
LP-BM5 Retrovirus–Expanded Monocytic Myeloid-Derived ... · LP-BM5 Retrovirus–Expanded...
21
Suppressor Cells Alter B Cell Phenotype and Function Expanded Monocytic Myeloid-Derived - LP-BM5 Retrovirus Jessica L. Rastad and William R. Green http://www.immunohorizons.org/content/2/3/87 https://doi.org/10.4049/immunohorizons.1700066 doi: 2018, 2 (3) 87-106 ImmunoHorizons This information is current as of March 11, 2019. References http://www.immunohorizons.org/content/2/3/87.full#ref-list-1 , 38 of which you can access for free at: cites 104 articles This article Email Alerts http://www.immunohorizons.org/alerts Receive free email-alerts when new articles cite this article. Sign up at: ISSN 2573-7732. All rights reserved. 1451 Rockville Pike, Suite 650, Rockville, MD 20852 The American Association of Immunologists, Inc., is an open access journal published by ImmunoHorizons by guest on March 11, 2019 http://www.immunohorizons.org/ Downloaded from by guest on March 11, 2019 http://www.immunohorizons.org/ Downloaded from
Transcript of LP-BM5 Retrovirus–Expanded Monocytic Myeloid-Derived ... · LP-BM5 Retrovirus–Expanded...

Suppressor Cells Alter B Cell Phenotype and FunctionExpanded Monocytic Myeloid-Derived−LP-BM5 Retrovirus
Jessica L. Rastad and William R. Green
http://www.immunohorizons.org/content/2/3/87https://doi.org/10.4049/immunohorizons.1700066doi:
2018, 2 (3) 87-106ImmunoHorizons
This information is current as of March 11, 2019.
Referenceshttp://www.immunohorizons.org/content/2/3/87.full#ref-list-1
, 38 of which you can access for free at: cites 104 articlesThis article
Email Alertshttp://www.immunohorizons.org/alertsReceive free email-alerts when new articles cite this article. Sign up at:
ISSN 2573-7732.All rights reserved.1451 Rockville Pike, Suite 650, Rockville, MD 20852The American Association of Immunologists, Inc.,
is an open access journal published byImmunoHorizons
by guest on March 11, 2019
http://ww
w.im
munohorizons.org/
Dow
nloaded from
by guest on March 11, 2019
http://ww
w.im
munohorizons.org/
Dow
nloaded from
LP-BM5 Retrovirus–Expanded Monocytic Myeloid-DerivedSuppressor Cells Alter B Cell Phenotype and Function
Jessica L. Rastad* and William R. Green*,†
*Department of Microbiology and Immunology, Geisel School of Medicine at Dartmouth, Lebanon, NH 03756; and †Norris Cotton Cancer Center,
Geisel School of Medicine at Dartmouth, Lebanon, NH 03756
ABSTRACT
Our laboratory demonstrated that infection with the murine retrovirus LP-BM5 results in increased numbers of monocytic myeloid-
derived suppressor cells (M-MDSCs) and that these M-MDSCs suppress not only T but also B cell responses. Because of the paucity of
studies regarding the effects of MDSCs in general on B cells, we focused on these understudied B cell targets for M-MDSC effects
on B cell phenotypic and functional parameters. M-MDSCs specifically decreased the proliferation of transitional type 2 (T2) B cells
in response to polyclonal stimulation but increased germinal center and Ab-secreting B cell proportions and class-switched Ig
production. Additionally, M-MDSCs inhibited the expression of CD40 and MHC class II on stimulated B cells and suppressed Ag
presentation to Ag-specific CD4+ T cells. These alterations of the B cell compartment coincided with decreases in aerobic glycolysis,
mitochondrial respiration, and glucose consumption; the latter specifically decreased in the T2 subset. To compare B cell targets
of ex vivo M-MDSC suppression with the status of B cells during the course of LP-BM5–induced pathogenesis, including
immunodeficiency in vivo, B cells from LP-BM5–infected mice were collected and analyzed. LP-BM5 infection resulted in several
analogous alterations of B cells, as were observed with retrovirally expanded M-MDSC suppression in vitro, including decreased
proliferation of T2 B cells, an increased proportion of germinal center and Ab-secreting B cells, increased production of class-
switched Abs, decreased expression of CD40, and decreased metabolic activity upon stimulation. ImmunoHorizons, 2018, 2: 87–106.
INTRODUCTION
Myeloid-derived suppressor cells (MDSCs) are myeloid lineagecells that have been heavily studied for their ability to dampenT cell–mediated immune responses in human cancer patientsand murine tumor models (1–6). We demonstrated that LP-BM5murine retrovirus–infected mice exhibited a 3-fold increase innumbers of monocytic MDSCs (M-MDSCs), which are 4.5-fold
moresuppressiveonaper-cellbasis thancellsof similarphenotypein naive, uninfected animals, resulting in a more than 12-foldincrease in the total suppressive activityper spleen (7, 8).TheseLP-BM5–expanded M-MDSCs suppressed proliferation, IFN-g, andIL-10productionofTcells in response tobothanti-CD3/anti-CD28andConAstimulation(7, 9, 10).Our laboratorydiscovered that theseM-MDSCs also strongly inhibited B cell proliferation (7) and Bregulatory cell IL-10 responses (11); to our knowledge, this is the
Received for publication November 2, 2017. Accepted for publication April 12, 2018.
Address correspondence and reprint request to: William R. Green, Department of Microbiology and Immunology, Geisel School of Medicine at Dartmouth, Lebanon,NH 03756. E-mail address: [email protected]
ORCID: 0000-0002-0086-0786 (W.R.G.).
This work was supported by Public Health Service Grant CA-50157 from the National Institutes of Health (NIH) and Pilot Grant P30 GM-10345 (both to W.R.G.) as well asstipend support for J.L.R. from NIH Institutional Training Grant T32 AI007363 (to Dr. C. Sentman). Flow cytometry was performed at DartLab, the Immune Monitoringand Flow Cytometry Shared Resource at the Geisel School of Medicine at Dartmouth, which is supported in part by Core Grant CA23108 from the National CancerInstitute to the Norris Cotton Cancer Center as well as Grants P20 (RR16437) and P30 (GM103415) from the National Institute of General Medical Sciences, as the Centerof Biomedical Research Excellence in Molecular, Cellular, and Translational Immunological Research (to W.R.G., principal investigator).
Abbreviations used in this article: ECAR, extracellular acidification rate; GC, germinal center; iNOS, inducible NO synthase; MAIDS, murine AIDS; MDSC, myeloid-derivedsuppressor cell; MFI, mean fluorescence intensity; MHC II, MHC class II; M-MDSC, monocytic MDSC; MZ, marginal zone; 2-NBDG, 2-(N-(7-nitrobenz-2-oxa-1,3-diazol-4-yl)-amino)-2-deoxyglucose; OCR, oxygen consumption rate; T1, transitional type 1; T2, transitional type 2; VISTA, V-domain Ig-containing suppressor of T cell activation;wpi, week postinfection.
This article is distributed under the terms of the CC BY-NC 4.0 Unported license.
Copyright © 2018 The Authors
https://doi.org/10.4049/immunohorizons.1700066 87
RESEARCH ARTICLE
Infectious Disease
ImmunoHorizons is published by The American Association of Immunologists, Inc.
by guest on March 11, 2019
http://ww
w.im
munohorizons.org/
Dow
nloaded from
first report of MDSC-mediated suppression of B cells. Sub-sequently, additional evidence for B cells as targets of MDSCs hasbeen presented (12–14), particularly in autoimmunity (15–18) andduringBcell lymphopoiesis (19–21).There is increasingappreciationof the role MDSCs play in viral systems (22). In addition to the LP-BM5 retrovirus, the causative agent of murine AIDS (MAIDS),MDSCs have recently been implicated during infections by retro-viruses suchashuman(23–29)andsimian immunodeficiencyviruses(23, 30–32), RNA viruses such as influenza A virus (33, 34) andlymphatic choriomeningitis virus (35), and DNA viruses such ashepatitis B virus (36–39), HSV (40, 41), and vaccinia virus (42).
M-MDSCs that are expanded during LP-BM5 infectionsuppressedBcell proliferation inresponse topolyclonal activators,including LPS and anti-CD40 + IL-4 stimulation, and specificallysuppressed proliferation of IL-10–producing regulatory B cells(7, 11). These polyclonal activators were chosen because of theirclassic use in defining the immunosuppression of B cells duringLP-BM5 infection (43, 44) and their ability to stimulate a strongB cell response. Furthermore, there is precedent for viral signalingthrough TLR4, the receptor through which LPS signals, duringrelated retroviral immune responses to mouse mammary tumorvirusandMoloneymurine leukemiavirus (arelativeof theecotropicmurine leukemia virus found in the LP-BM5 retroviral isolate) (45,46) aswell asduring responses tohumanretroviruses suchasHIV-1(47).AlthoughM-MDSCsuppressionofTcell responseswasentirelyinducible NO synthase (iNOS)–dependent, iNOS accounted for onlyabout half of the suppression of B cells (7). M-MDSCs from LP-BM5–infected mice used contact-dependent mechanisms—suchasV-domain Ig-containing suppressorofT cell activation (VISTA)and VISTA in combination with iNOS—for ;45% of their sup-pression of B cell proliferation and soluble mechanisms—such asproductionof superoxide,NO, peroxynitrite, andTGF-b—formuchor all of the other 55%of their suppression of B cell proliferation (7,8, 11). The use of multiple mechanisms along with the plasticity ofMDSCsas immaturemyeloid lineagecellsmayberesponsible for theobservation that when the two major mechanisms of suppres-sion were knocked out in iNOS/VISTA double-knockout MDSCs,overall levels of suppression remained relatively unchanged (11).
As B cells remain an understudied target of MDSC-mediatedsuppression, in this articlewedescribe indetail thephenotypic andfunctional effects ofMDSCs on B cells and B cell subsets as well asthe phenotype and function of B cells during LP-BM5 infection,duringwhichM-MDSCsareexpanded.TheuseofmultipleM-MDSCeffector mechanisms and the existence of multiple B cell subsetsthat are potential differential targets may result in unexpectedM-MDSC–dependent consequences, some of which may appear,counterintuitively, to bepositive innature. For this reason, someoftheseM-MDSC–mediated changes in B cells are referred to in thisarticle as alterations, as opposed to strictly suppression.
MATERIALS AND METHODS
MiceSeven-week-oldC57/Bl/6 (B6)micewerepurchased fromCharlesRiver (Wilmington, MA) and OT-II mice (B6.Cg-Tg(TcraTcrb)
425Cbn/J) from The Jackson Laboratory (Bar Harbor, ME). Allmice were housed in the Center for Comparative Medicine andResearch at the Geisel School ofMedicine at Dartmouth andwereused at;8–10 wk of age. All animal experiments were done withthe approval of the Institutional Animal Care and Use Committeeof Dartmouth College in conjunction with the Dartmouth CenterforComparativeMedicine andResearch, anAmericanAssociationof Laboratory Animal Care–approved animal facility.
LP-BM5 virus inoculationLP-BM5 virus was prepared in the laboratory as previouslydescribed (48, 49). Mice were infected i.p. with 53 104 ecotropicPFUs as determined by a standard retroviral XC plaqueassay (50).
M-MDSC enrichmentForenrichmentofM-MDSCpopulations, splenocytes frompooled5 wk postinfection (wpi) LP-BM5–infected B6 mice were labeledwith beads coupled to anti-Ly6G–biotin to deplete Ly6G-positivecells and subsequently with anti-biotin–coupled paramagneticbeads. The negative flow-through was collected from a MACScolumn (Miltenyi Biotec, Auburn, CA), labeled with anti-CD11b–coupled paramagnetic beads, and column purified, leading to thestandard enriched M-MDSC preparation previously employed(7–11). These cells are Gr-1+ Ly6C+ CD11b+ and exhibited signi-ficantly enhanced suppressive function of bothB andT cells. Thisenrichedpopulation contains only;1%CD4+Foxp3+ cells (8) and,5% CD4+ T cells and,5%CD8+ cells (J.L. Rastad, unpublishedobservations).
[3H]Thymidine incorporation and CFSE-based assays tomeasure proliferation and MDSC suppression assaysResponder cells (uninfected, wild-type B6 splenocytes) wereplated at 5 3 105 cells per well in 96-well plates. M-MDSCs(obtained from 5 wpi LP-BM5–infected mice and employed asLy6G-depleted/CD11b-enriched splenocytes) were plated at aresponder:M-MDSC cell ratio of 3:1 (mimicking the ratio of B cellstoMDSCs inan infected spleen) in three toeightwellsper conditionin supplemented media (containing 5% FCS, L-glutamine, andantibiotics). Responder cellswere stimulatedwith 40mg/ml anti-CD40+ 10ng/ml IL-4orwith 8.75mg/mlLPSat 37°Cand5%CO2.Beginning at 66 h, wells were pulsed with 1 mCi [3H]thymidine(PerkinElmer,Waltham, MA). At 72 h, plates were harvested andassayed for thymidine incorporation using a scintillation counter.Percent suppression was calculated from the control responseas previously described (7). Briefly, the percentage of residualresponsiveness was calculated by determining the ratio of the cpmof responder cellswithM-MDSCsover the cpmof the respondersalone. The percentage of residual responsiveness was subtractedfrom 100% (control responsiveness) to determine the percentsuppression. Additionally, responder cells or cells from naiveversus 8 wpi LP-BM5–infected mice were stained with CFSE(Invitrogen, Carlsbad, CA) to assess proliferation in com-bination with surface markers to determine different cell popula-tions (see below).
https://doi.org/10.4049/immunohorizons.1700066
88 LP-BM5–EXPANDED M-MDSCs ALTER B CELL PHENOTYPE AND FUNCTION ImmunoHorizons
by guest on March 11, 2019
http://ww
w.im
munohorizons.org/
Dow
nloaded from

Flow cytometryFor cell surface staining, 1–23 106 spleencells (fromM-MDSCsup-pression assays or directly ex vivo from naive or LP-BM5–infectedmice) were incubated with a viability stain (7-AAD; eBioscience, SanDiego, CA) and various Abs conjugated to FITC, PE, PerCP,allophycocyanin, Pe-Cy7,APC-Cy7, orBrilliantViolet 421. The cellswere analyzed by a MACSQuant flow cytometer (Miltenyi Biotec)todetect expressionofmurineCD19 (6D5),CD21 (7E9),B220 (RA3-6B2), IgD (11-26c.2a), IgM (RMM-1), CD40 (3/23), MHC class II(MHCII;I-Ab,AF6-120.1),GL-7(GL7),Fas(CD95,15A7),andsyndecan-1(CD138, 3281-2) (BioLegend, San Diego, CA; BD Biosciences, SanJose,CA, eBioscience; Invitrogen,Carlsbad,CA). Positive gateswereselected based on isotype and fluorescence minus one controls, anddata were analyzed using FlowJo software (Tree Star).
ELISAs for Ig productionSupernates from stimulated B cell/M-MDSC suppression assaysor from ex vivo spleen preparations containing B cells from naiveand 8 wpi LP-BM5–infected mice were assessed for total Ig, IgM,IgG2c (previously denoted as IgG2a but renamed per Ref. 51), andIgG3byanELISA.Affinity-purifiedgoat anti-mouse Ig, IgM, IgG2c,or IgG3Abswereused tocoat96-wellplates (SouthernBiotechnologyAssociates, Birmingham, AL), and the ELISAwas developed usingan alkaline phosphatase–conjugated goat anti-mouse Ig (SouthernBiotechnologyAssociates) andphosphate substrate (p4744; Sigma-Aldrich) and quantified at 405 nm using an ELISA reader.
B cell enrichment for antigenic peptide presentationFor B cell enrichment, splenocytes from naive or 8 wpi LP-BM5–infected B6 mice were labeled with anti-CD19–coupledparamagnetic beads. The bound cells were purified using a MACScolumn (Miltenyi Biotec). After stimulation with LPS and sub-sequent incubation with OVA, B cells were re-enriched. Purity, asassessed by flow cytometry, was.95%.
OT-II Ag presentation assaysB cells were purified from naive and 8 wpi mice (see the B cellenrichmentprocess describedabove) and culturedwithLPS in thepresence or absence ofM-MDSCs (seeMDSC suppression assays,above) for 48 h. The B cells were then washed and re-enriched(again using the B cell enrichment process detailed above to re-move cocultured MDSCs) and pulsed with 5 or 25 mg/ml OVA323–339peptide (aminoacid sequence ISQAVHAAHAEINEAGR)(Sigma-Aldrich), the minimal I-Ab presented epitope for the B6OT-II TCR (52), as indicated for 1.5 h on ice. B cells were washedgently to remove unbound OVA peptide and plated at 1 3 105
Bcellsperwellwith53 105OT-II splenocytesandcultured for 3d.Beginning at 66 h, wells were pulsed with 1 mCi [3H]thymidine(PerkinElmer). At 72 h, plates were harvested and assayed forthymidine incorporation using a scintillation counter, and percentMDSC suppression was calculated.
Extracellular flux and cellular bioenergetics measurementsExtracellular acidification rate (ECAR) and oxygen consumptionrate (OCR), measures of glycolytic capacity and mitochondrial
respiration, were measured using the Seahorse Bioscience XF96technology (Billerica, MA). Supernates were collected from poly-clonally stimulated responder B cells alone or stimulated responderB cells cocultured with M-MDSCs as described above for the[3H]thymidine assays. Supernates were collected at 40 h andtransferred to recipient responder B cells that had been stimulatedin parallel, as detailed previously (11). At 66 h, these recipientB cells were washed with XF Assay Media, plated at 13 106 cellsperwell in a96-wellXFcultureplate, and incubated for20min–1hat 37°C in a non–carbon dioxide incubator. At various times recom-mended by the manufacturer, oligomycin (final well concentrationof 1mM), carbonyl cyanide 4-(trifluoromethoxy)-phenylhydraxone(FCCP, final concentration of 2 mM), and rotenone (final concen-tration of 0.5 mM) were released from injection ports and measure-ments were taken in real time to determine the effects of theM-MDSC-supernate on metabolism. Similarly, B cells from naiveand8wkpost-LP-BM5–infectedmicewere stimulated ex vivowithLPS and analyzed at 66 h.
Glucose uptakeResponder cells were stimulated with polyclonal activators inthe presence or absence of M-MDSCs, as described above for the[3H]thymidine incorporation assays. At 66 h, cells were washedwith PBS, resuspended in PBS alone (as a negative control) orPBS + 50 mM 2-(N-(7-nitrobenz-2-oxa-1,3-diazol-4-yl)-amino)-2-deoxyglucose (2-NBDG,afluorescent glucoseanalog; Invitrogen),and incubated for 1 h at 37°C and 5%CO2. Cellswere then collectedand stained using surface Abs (specifically those used for B cellsubsetting:CD19, IgM, IgD, andCD21) and7-AADandmeasuredonthe MACSQuant, as described above for flow cytometry assays.
Statistical analysisSD of the mean were determined and compared statistically usinga Student t test, and the Holm–Bonferroni post hoc method wasused to correct for multiple comparisons. All experimental datashown are representative from a set of at least three individualexperiments with a similar pattern of results.
RESULTS
Effects of M-MDSCs on B cellsM-MDSCs preferentially suppressed proliferation of transitionaltype 2 B cells. As previously reported, M-MDSCs from LP-BM5–infected mice suppressed B cell proliferation in response topolyclonalBcell activators, includingLPSandanti-CD40+IL-4, asmeasuredby both [3H]thymidine incorporation andCFSEdilution(7, 8, 10, 11). As B cells in various stages of development responddifferently to a variety of stimuli and suppressive factors (53, 54),the effects ofM-MDSCs onproliferation of different B cell subsetswas determined. B cells enter the spleen as transitional type 1 (T1)B cells (CD19+ IgMhi IgD2 CD212) (55). There they transition totransitional type 2 (T2) B cells (CD19+ IgMhi IgDmid/+), which canbecome mature follicular (CD19+ IgMlo IgDhi) or marginal zone(MZ) (CD19+IgMhi IgD2CD21hi)Bcellsdependingontheactivatingstimuli (55). Using a combination of CFSE dye dilution and cell
https://doi.org/10.4049/immunohorizons.1700066
ImmunoHorizons LP-BM5–EXPANDED M-MDSCs ALTER B CELL PHENOTYPE AND FUNCTION 89
by guest on March 11, 2019
http://ww
w.im
munohorizons.org/
Dow
nloaded from
surface staining, we determined that M-MDSCs from LP-BM5–infected mice consistently specifically suppressed the proliferationinresponseof theT2Bcell subset toLPS,withminimaleffectson theother subsets, including the T1 (Fig. 1A–C), mature, andMZ subsets(data not shown). This suppression of the T2 B cell subset wasstatistically significant, as indicated by an increase in CFSE meanfluorescence intensity (MFI) (Fig. 1B) and an average of a 30%decrease in the percentage of cells that divided (Fig. 1C) in culturescontaining M-MDSCs when compared with otherwise identicalcultures lackingM-MDSCs.Minor differences in survivabilitymakeit difficult to reconstruct the magnitude of the effect on the B cellcompartment by summing up the effects of individual subsets;however, the selectivity for the T2 compartment was striking.Importantly, M-MDSCs also substantially decreased B cell pro-liferation (by ;80%) in response to anti-CD40 + IL-4. The mostpronounced decreases were observed in the mature B cell subset,followed by the T2 subset (data not shown).
To further probe the effects of M-MDSCs on B cell pro-liferation, thedivision andproliferation indiceswerecalculated forboth the B cell population as a whole and for the T2 B cell subset.The division index, which represents the average number ofdivisions by each cell (including cells that never divide), wassignificantly decreased in the presence of M-MDSCs for both theunfractionated B cell population (average decrease of;30%) andfor the T2 population (average decrease of ;40%) (Fig. 1D). Incontrast, the proliferation index, which represents the averagenumber of divisions by each dividing cell (and does not includecells that never divide), remained unchanged in all experiments(Fig. 1E).Collectively, thesedata indicated thatM-MDSCsdecreasethe number of B cells entering division but that once these cellsenter the cell cycle, theyundergo an equivalent numberof divisionsto cells in the absence of M-MDSCs. Supporting this conclusion,theMFIof thedividedcells remainedunchanged in thepresenceofM-MDSCs (Fig. 1F), in sharp contrast to the significant M-MDSCinhibitory effects on the CFSE dilution by MFI assessment of allcells (including the parental peak) (see Fig. 1B).
M-MDSCs increased Ig production. As Ab production is a mainfunctionofB lineagecells and isdrivenbyCD40-signaling,wenextdetermined the effects of M-MDSCs on Ig production using anti-CD40 + IL-4 stimulation. An Ig ELISA indicated that, surprisingly,in the presence ofM-MDSCs, B cells increased Ig production (Fig.2A).M-MDSCs increased productionof both IgMandof the class-switched Abs, IgG2c and IgG3 (Fig. 2B–D). Based on these al-terations, it is tempting to speculate thatM-MDSC function altersAb production by increasing class switching. In agreement withthis hypothesis, M-MDSC coculture repeatedly increased theproportion (Fig. 2E) and number (Fig. 2F) of germinal center (GC)Bcells (definedasCD19+ IgMloGL-7+ and later confirmedasCD19+
GL-7+ Fas+), the population that undergoes class-switch recom-bination. GC B cells can differentiate into memory B cells or Ab-secreting cells (56). To further probe the M-MDSC–dependentalterations seen in Ab production, the proportions of Ab-secretingcells were determined. In agreement with the increased Ig levels,M-MDSCs led to increased proportions (Fig. 2G) and numbers
(Fig. 2H) of Ab-secreting cells (B220+ CD138+). Of note, because ofdecreased B cell survivability and low cell numbers in the absenceof stimulation, the proportion of Ab-secreting cells among liveunstimulated B cells is higher than that of stimulated B cells (Fig.2G), yet the number of Ab-secreting cells is considerably lower(Fig. 2H).
In terms of the ability to generalize to other forms of B cellstimulation, M-MDSCs had similar effects on IgG subclass pro-duction in response to LPS stimulation (Fig. 2K, 2L). Additionally,LPS stimulation in the presence of M-MDSCs also increased theproportionofGCBcells (Fig. 2M), indicating that these alterationswere not specific to anti-CD40 + IL-4 stimulation. However, M-MDSCs did not affect total Ig (Fig. 2I) and actually decreased IgMproduction (Fig. 2J) in response to LPS stimulation, unlike anti-CD40 + IL-4 stimulation. In agreement with the lack of effect ontotal Ig levels,M-MDSCsdidnot increase or decreaseAb-secretingcells in response to LPS stimulation (Fig. 2N). M-MDSCs actuallydecreased proliferation of GC B cells in response to LPS (Fig. 2O)despite increasing GC numbers and proportions, indicating thatincreases in this subset were likely due to increased differentiationor increased survival of differentiated cells. M-MDSCs had nosignificant effect on proliferation of Ab-secreting cells (data notshown). In the absence of stimulation, Ig productionwas below thelevel of detection given the controls (M-MDSCs alone stimulatedwith LPS) and as such was unaffected by M-MDSCs.
M-MDSCs decreased expression of CD40 and MHC II. AsBcellsmay serve as functional APCs to activate CD4+ T cells (57), andCD4+ T cells are important in providing costimulation to B cells(58), the effects of M-MDSCs on expression of molecules re-sponsible for B cell cross-talk with CD4+ T cells were determined.Both anti-CD40 + IL-4 and LPS stimulation led to increasedexpression of the signal 1– and/or signal 2–associated molecules,MHC II, and/or CD40, respectively, on B cells. Although the vastmajority of the B cells remained positive for these markers, M-MDSCs reproducibly decreased CD40 density in LPS-stimulatedB cells by an average of ;15% (Fig. 3A, 3B). This decrease wasroughly equivalent across all developmental subsets (data notshown). CD40 expressionwas not testedwith anti-CD40+ IL-4stimulation because of the potential for interference betweenthe CD40-staining Ab and the activation Ab and because ofactivation-induced receptor internalization. CD86 expression byactivated B cells, in contrast, was not altered by M-MDSCs,indicating that not all costimulatorymolecules are downregulatedby M-MDSCs (data not shown).
Similarly, M-MDSCs also consistently decreased the densityof the signal 1 molecule MHC II—by;55% for anti-CD40 + IL-4stimulation and by;40% for LPS stimulation (Fig. 3C, 3D, 3F,3G). With anti-CD40 + IL-4 stimulation, the largest decreasewas detected in the mature subset, followed by the MZ and T2populations (Fig. 3E). For LPS stimulation, this decrease wassignificant for all subsets but most pronounced for the T2 B cellsubset (Fig. 3H). Interestingly, this is the same subset whoseproliferation was preferentially suppressed by these M-MDSCs(Fig. 1).
https://doi.org/10.4049/immunohorizons.1700066
90 LP-BM5–EXPANDED M-MDSCs ALTER B CELL PHENOTYPE AND FUNCTION ImmunoHorizons
by guest on March 11, 2019
http://ww
w.im
munohorizons.org/
Dow
nloaded from

FIGURE 1. M-MDSCs preferentially suppressed proliferation of T2 B cells.
(A) CFSE in combination with surface staining and flow cytometry was used to visualize division of B cells in different developmental stages in response
to LPS, either in the presence or absence of M-MDSCs. (B) Geometric MFIs of CFSE staining, (C) percentage of cells divided, (D) division indices, and
(E) proliferation indices of CFSE staining. (F) Geometric MFIs of CFSE staining of divided cells in different developmental subsets. Data shown are from a
representative experiment, with a similar pattern of results observed in three additional experiments. p values indicated comparisons with B cells alone.
*p , 0.05, **p , 0.01, ***p , 0.001.
https://doi.org/10.4049/immunohorizons.1700066
ImmunoHorizons LP-BM5–EXPANDED M-MDSCs ALTER B CELL PHENOTYPE AND FUNCTION 91
by guest on March 11, 2019
http://ww
w.im
munohorizons.org/
Dow
nloaded from
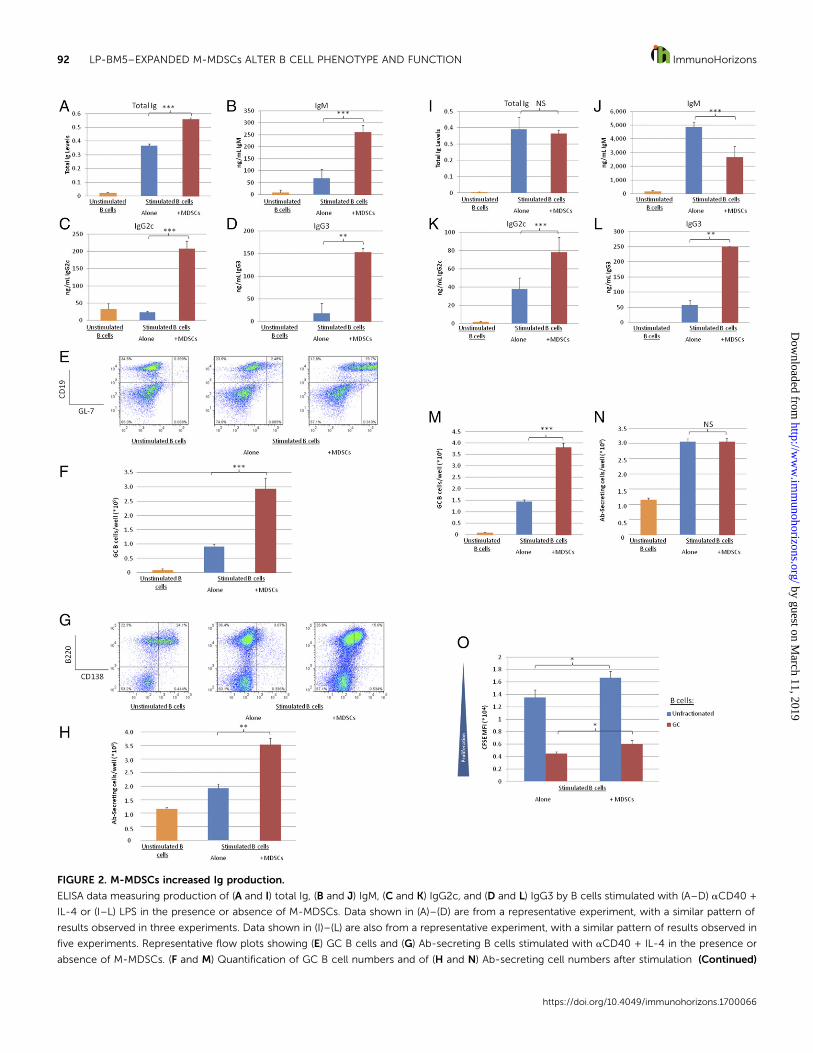
FIGURE 2. M-MDSCs increased Ig production.
ELISA data measuring production of (A and I) total Ig, (B and J) IgM, (C and K) IgG2c, and (D and L) IgG3 by B cells stimulated with (A–D) aCD40 +
IL-4 or (I–L) LPS in the presence or absence of M-MDSCs. Data shown in (A)–(D) are from a representative experiment, with a similar pattern of
results observed in three experiments. Data shown in (I)–(L) are also from a representative experiment, with a similar pattern of results observed in
five experiments. Representative flow plots showing (E) GC B cells and (G) Ab-secreting B cells stimulated with aCD40 + IL-4 in the presence or
absence of M-MDSCs. (F and M) Quantification of GC B cell numbers and of (H and N) Ab-secreting cell numbers after stimulation (Continued)
https://doi.org/10.4049/immunohorizons.1700066
92 LP-BM5–EXPANDED M-MDSCs ALTER B CELL PHENOTYPE AND FUNCTION ImmunoHorizons
by guest on March 11, 2019
http://ww
w.im
munohorizons.org/
Dow
nloaded from

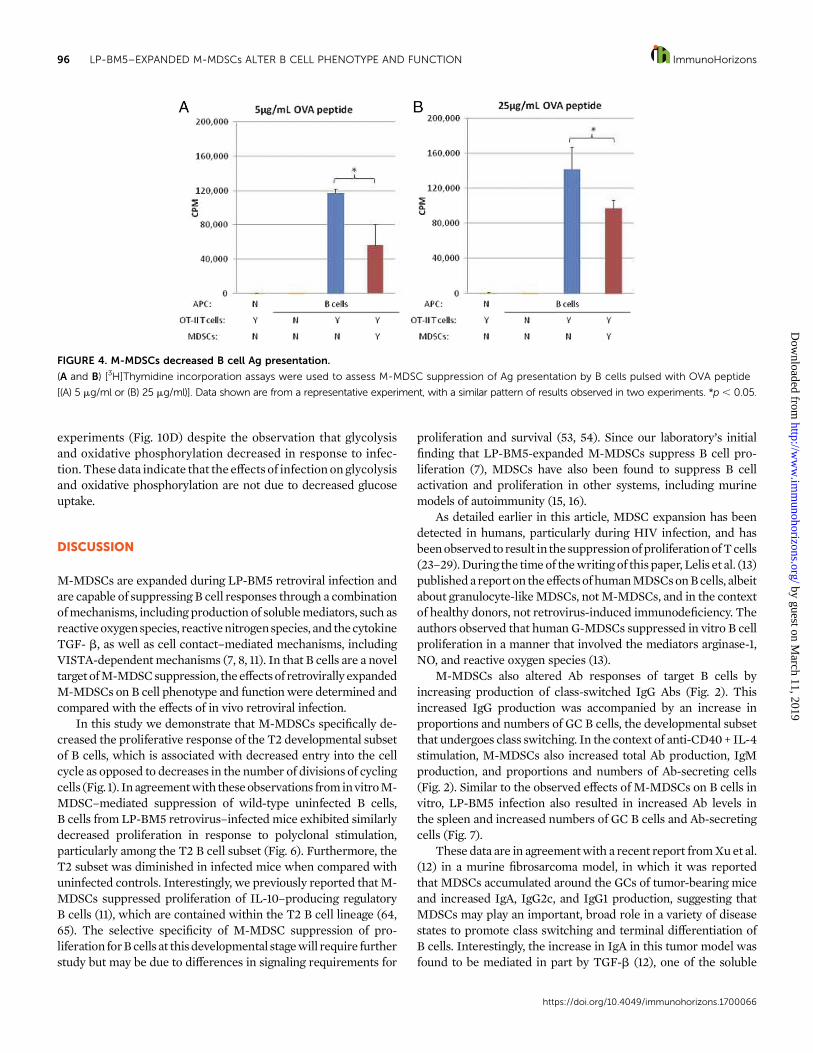
M-MDSCs decreased B cell Ag presentation. To determine if thedownregulation of MHC II by M-MDSCs seen in Fig. 3 wasphysiologically relevant, the ability of B cells activated in thepresenceor absenceofM-MDSCs topresentOVApeptide toOVA-specific, TCR-transgenic CD4+ OT-II T cells was determined.Briefly, highly enriched B cells (seeMaterials and Methods) wereactivated using LPS in the presence or absence of M-MDSCs.TheseBcellswere thenwashed, re-enriched to removeM-MDSCs,and briefly pulsed with OVA peptide. Unbound peptide wasremoved and equal numbers of B cells with bound peptide werecultured with OVA-specific transgenic OT-II CD4+ T cells (seeMaterials and Methods). In agreement with data on MHC IIexpression byflowcytometry (Fig. 3C–H),M-MDSCs decreasedfunctional OVA antigen presentation by B cells at two differentconcentrations of OVA peptide by 30–50%, as quantified by [3H]thymidine incorporation by the OT-II T cells in the secondreadout coculture (Fig. 4). Importantly, this response was OVAspecific and did not occur in the absence of peptide Ag or Ag-presenting B cells, and the possibility of detectable proliferationof (carryover) B cell APCs during the [3H]thymidine pulse wasfound to be negligible. These controls confirmed that the [3H]thymidine incorporation was due to OVA-specific activation ofOT-II OVA-specific CD4+ T cells. These data indicated that M-MDSC–mediated downregulation of MHC II expression led tofunctionally decreased Ag presentation.
M-MDSCs and their supernates decreased B cell metabolism.Manyof the above-mentioned B cell functions, including proliferation,Ig production, and MHC II Ag presentation to trigger specificCD4+ T cell stimulation, require substantial amounts of cellularenergy, sometimes over extended time periods. T cells respond tostimulation by rapidly increasing aerobic glycolysis in a processknown as the Warburg effect (59, 60). In contrast, it has morerecently been reported that B cells upregulate both oxidativephosphorylation and aerobic glycolysis upon activation (61, 62),but we are unaware of any reports on the possible alteration ofB cell metabolism by MDSC function. In this study, LP-BM5–expanded M-MDSCs were able to decrease B cell proliferation(Fig. 1), alterAbproductionandproportionsofBcell developmentalsubsets (Fig. 2), decrease expression of the B cell surfacemoleculesMHCIIandCD40(Fig. 3), decreaseAgpresentation (Fig. 4), and, aspreviously reportedbyour laboratory, decrease IL-10productionbyB regulatory cells (11). The effects of M-MDSCs on metabolism ofthe responding B cells were therefore assessed. Supernates fromsuppressive cocultures of M-MDSCs with stimulated B cells wereused in place of M-MDSCs, as 1) the metabolism of the M-MDSCscould affect themetabolic readouts of the culture and 2) supernatesfrom such M-MDSC cocultures (but not control supernates) areable to suppress B cells, with soluble mediators (including NO,peroxynitrite, superoxide, and TGF-b) accounting for the majority
of M-MDSC–mediated suppression of B cells (11). The effect ofthese supernates from M-MDSC cocultures on B cell metabolismwere compared with control supernates from responder cells sti-mulated alone. Importantly, no differenceswere identified in viabilityof the B cells in the presence of M-MDSC–derived supernates fromsuppression cocultures versus supernates from control cultureslackingM-MDSCs, and equal numbers of B cells fromeach conditionwere tested, eliminating any differences due to any possible minorlevels of cell death and/or variation in cell numbers.
Supernates generated from suppressive M-MDSC cocultures(with B cells stimulated by LPS) significantly reduced both thebaseline ECAR and the OCR of the B cells in all experiments,whereas supernates from stimulated B cells cultured alone had noeffect. Together, these results indicate that M-MDSC functioncauses reductions in the rates of aerobic glycolysis and oxidativephosphorylation at baseline or starting culture conditions,respectively (Fig. 5A–C).
When oligomycin, which inhibits ATP production by mito-chondria, thereby forcing the cell to use glycolysis, was injected,ECAR values were significantly reduced in the presence ofM-MDSCs (Fig. 5B), indicating that evenunder stressed conditionsin which glycolysis was pushed to its maximal level, M-MDSCsupernates were able to inhibit glycolysis. Similarly, when FCCPwas used to depolarize the mitochondrial membrane and allowfor maximal electron flux through the electron transport chain,thereby increasing OCR rates, M-MDSC supernates were still ableto substantially inhibit oxidative phosphorylation (Fig. 5C). Theseresults imply that suppressive M-MDSC supernates (from theircoculture with LPS-stimulated B cells) decrease themaximal ratesof aerobic glycolysis and respiration that the respondingB cells canachieve. The effects of M-MDSCs on metabolism appear to bedependent on the type of stimuli, as the presence of supernatesfrom analogous M-MDSC/B cell cocultures in which the B cellactivator was instead anti-CD40 + IL-4 did not dramatically affectthe metabolism of these B cells. However, it is possible that thetiming and other conditions used were not optimal to detect smallmetabolic effects for simulations other than LPS.
As both oxidative phosphorylation and glycolysis requireglucose consumption, we next measured glucose uptake using thefluorescent glucose analog 2-NBDG in the presence or absence ofM-MDSCs as an initial approach to characterize the molecularmechanism(s) underlying these decreases in metabolic activity.M-MDSCs reduced glucose uptake by the unfractionated B cellcompartment by ;30% (Fig. 5D). This decrease was primarilyassociated with the statistically significant decrease observed inthe T2 subset, the same developmental subset found to be targetedforM-MDSCsuppressionofbothproliferation (Fig. 1) andMHCIIdensity (Fig. 3). In contrast, and consistent with the data of Fig. 1(see Results text) T1 and MZ B cells again demonstrated relativeresistance to the effects of M-MDSC inhibition of glucose uptake.
with (F and H) aCD40 + IL-4 or (M and N) LPS. (O) Geometric MFIs of CFSE staining was used to visualize division of GC B cells in response to LPS in
the presence or absence of M-MDSCs. Data shown in (E)–(H) and in (M)–(O) are from representative experiments, with a similar pattern of results
observed in at least two experiments. *p , 0.05, **p , 0.01, ***p , 0.001.
https://doi.org/10.4049/immunohorizons.1700066
ImmunoHorizons LP-BM5–EXPANDED M-MDSCs ALTER B CELL PHENOTYPE AND FUNCTION 93
by guest on March 11, 2019
http://ww
w.im
munohorizons.org/
Dow
nloaded from
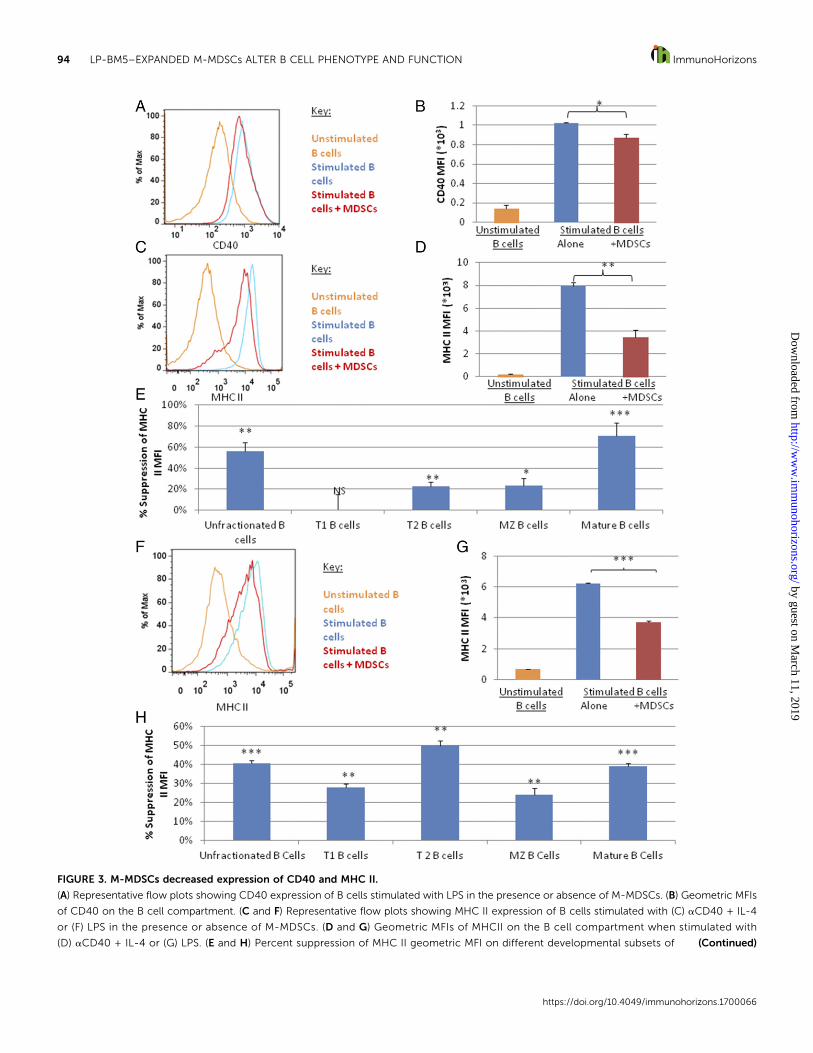
FIGURE 3. M-MDSCs decreased expression of CD40 and MHC II.
(A) Representative flow plots showing CD40 expression of B cells stimulated with LPS in the presence or absence of M-MDSCs. (B) Geometric MFIs
of CD40 on the B cell compartment. (C and F) Representative flow plots showing MHC II expression of B cells stimulated with (C) aCD40 + IL-4
or (F) LPS in the presence or absence of M-MDSCs. (D and G) Geometric MFIs of MHCII on the B cell compartment when stimulated with
(D) aCD40 + IL-4 or (G) LPS. (E and H) Percent suppression of MHC II geometric MFI on different developmental subsets of (Continued)
https://doi.org/10.4049/immunohorizons.1700066
94 LP-BM5–EXPANDED M-MDSCs ALTER B CELL PHENOTYPE AND FUNCTION ImmunoHorizons
by guest on March 11, 2019
http://ww
w.im
munohorizons.org/
Dow
nloaded from

Overall, thedata inFigs. 1–5 indicate thatM-MDSCsalter theBcellcompartment in subset-specific ways, reducing proliferation,Ag presentation, and metabolism while increasing both total Ig pro-duction and especially production of class-switched IgG subclasses.
Effects of LP-BM5 retroviral infection on B cellsLP-BM5 retroviral infection preferentially decreased proliferationof T2 B cells. To determine if similar phenotypic and functionalchanges also occur during LP-BM5 retroviral infection, B cellsfrom naive or infected mice were analyzed directly ex vivo. Aswas observed with M-MDSC–treated B cells in in vitro sup-pression assays, in vivoLP-BM5 infection resulted in a decreasedability of B cells to proliferate when stimulated ex vivo (Fig.6A–C). This decrease in proliferative ability to respond wasespecially pronounced among the T2 B cell subset, whereas forT1 B cells (Fig. 6A–C) and the other subsets (data not shown),infection resulted in a,10% change in the percentage of B cellsthat divided (which reached significance in some, but not all,experiments). Neither B cells from naive nor infected miceproliferated significantly in the absence of stimulation, as assessedby both [3H]thymidine incorporation and CFSE dilution (data notshown). Spleens fromLP-BM5retrovirus–infectedmice exhibiteda significant decrease in the proportion of B cells that were in theT2 stage of development (Fig. 6D), corroborating the selectiveeffect of M-MDSCs on proliferation of this subset (Fig. 1).
LP-BM5 retroviral infection increased Ab production. LP-BM5infection leads to increased Ig levels in the serum, a classic aspectof retrovirus and MAIDS pathogenesis (7, 63). An Ig ELISA per-formed on supernates from naive and infected spleens imme-diately ex vivo revealed that in agreement with our in vitroM-MDSC suppression assay data for anti-CD40 + IL-4 (Fig. 2A,2B), total Ig levels (Fig. 7A) and IgM levels (Fig. 7B) increased inthe spleen. Additionally, similar to what was observed with invitroM-MDSC suppression assay data for anti-CD40 + IL-4 andLPS (Fig. 2C, 2D, 2K, 2L), IgG2c and IgG3 levels increasedsignificantly in the spleens of infected animals (Fig. 7C, 7D).
Because suppression assays with isolated, retrovirally ex-panded M-MDSCs revealed that the increase in class-switchedand total Ig production correlated with an increase in the pro-portion ofGCBcells (Fig. 2F, 2M) andAb-secreting cells (Fig. 2H),the number of such B cells in the spleen was determined in naiveand infected animals immediately ex vivo. Similar to what wasdemonstrated with M-MDSC suppression in vitro, LP-BM5 in-fection lead to a steady increase in the proportion andnumber ofGCB cells (Fig. 7E) and Ab-secreting cells (Fig. 7F) in all experiments.
LP-BM5 retroviral infection decreased expression of CD40. Theexpression by B cells of the surface molecules CD40 andMHC II,both ofwhichwere inhibited byM-MDSCs in in vitro suppression
assays (Fig. 3), was also determined on B cells from naive andinfected mice directly ex vivo. CD40 expression was repeatedlydecreased in response to LP-BM5 infection (Fig. 8A), potentiallyreflecting the demonstrated effects of M-MDSCs on the B cellcompartment. However, in the case of infection, decreases inCD40 expression were specific to themature B cell compartment,whereas in in vitro M-MDSC suppression assays, these changesoccurred globally in B cells without obvious subset specificity. Incontrast, the density of MHC II was marginally, but consistently,increasedwhencomparedwith naivemice (Fig. 8B). This increasewas consistent across all developmental subsets (data not shown).
M-MDSCs decreased Ag presentation by B cells from LP-BM5–infected mice. In that M-MDSCs were able to suppress AgpresentationbyuninfectedBcells (Fig. 4),we testedwhether theseM-MDSCs could also suppressAg presentation by infectedB cells,which had slightly higher baseline MHC II expression. Impor-tantly, M-MDSCs were able to strongly decrease functional Agpresentation by B cells from infectedmice stimulated ex vivo on aper-cell basis, as measured by proliferation of OT-II CD4+ T cells(seeMaterials andMethods), indicating thatM-MDSCs are able tosuppressAPC functioneven in the context of retrovirally activatedBcells (Fig. 9A).B cellAPCscarriedoverduring the [3H]thymidinepulse did not proliferate, and proliferation of OT-II CD4+ T cellsrequiredbothAPCsandOVApeptide.As abiological control, theseM-MDSCs were also able to suppress proliferation of stimulatedB cells from infected mice (Fig. 9B).
LP-BM5 retroviral infection decreased B cell metabolism. BecauseM-MDSCs were able to suppress the upregulation of B cellmetabolism following activation by LPS in ex vivo M-MDSCsuppression assays (Fig. 5), the metabolic pathway use of B cellsfrom naive and infected mice was tested following LPS activation.When compared with stimulated B cells from uninfected controlmice, themetabolism of stimulated B cells from infectedmice washighly significantly and broadly reduced (Fig. 10A). This decreasewas detected in both baseline and stressed ECAR and OCR(Fig. 10B, 10C), indicating that in infection, B cells displayedreduced ability to upregulate metabolism in response to stimula-tion, similar to what was displayed with B cells cocultured withM-MDSCs. Of note, unstimulated B cells from naive and infectedmice had very lowmetabolic pathway use after culture. However,the low levels of both OCR and ECAR after culture were slightlyincreased in unstimulated B cells from infected mice (data notshown). When B cell metabolism was measured directly ex vivo(without culture), B cells from infected mice exhibited increasedmetabolism, likely due to immune activation as a consequence ofinfection (data not shown).
Interestingly, glucose uptake was unaltered in B cells frominfected mice when compared with B cells from naive mice in all
(E) aCD40 + IL-4–stimulated or (H) LPS-stimulated B cells by M-MDSCs. Data shown in (A)–(H) are from a representative experiment, with a similar
pattern of results observed in four experiments. Statistics in (E) and (H) represent comparisons of MFI of B cells within the indicated subset in the presence
or absence of M-MDSCs. *p , 0.05, **p , 0.01,***p , 0.001.
https://doi.org/10.4049/immunohorizons.1700066
ImmunoHorizons LP-BM5–EXPANDED M-MDSCs ALTER B CELL PHENOTYPE AND FUNCTION 95
by guest on March 11, 2019
http://ww
w.im
munohorizons.org/
Dow
nloaded from
experiments (Fig. 10D) despite the observation that glycolysisand oxidative phosphorylation decreased in response to infec-tion.Thesedata indicate that the effects of infectiononglycolysisand oxidative phosphorylation are not due to decreased glucoseuptake.
DISCUSSION
M-MDSCs are expanded during LP-BM5 retroviral infection andare capable of suppressing B cell responses through a combinationofmechanisms, including production of solublemediators, such asreactiveoxygenspecies, reactivenitrogenspecies, and thecytokineTGF- b, as well as cell contact–mediated mechanisms, includingVISTA-dependentmechanisms (7, 8, 11). In that B cells are a noveltarget ofM-MDSCsuppression, theeffects of retrovirally expandedM-MDSCs on B cell phenotype and functionwere determined andcompared with the effects of in vivo retroviral infection.
In this study we demonstrate that M-MDSCs specifically de-creased the proliferative response of the T2 developmental subsetof B cells, which is associated with decreased entry into the cellcycle as opposed to decreases in the number of divisions of cyclingcells (Fig. 1). In agreementwith theseobservations frominvitroM-MDSC–mediated suppression of wild-type uninfected B cells,B cells fromLP-BM5 retrovirus–infected mice exhibited similarlydecreased proliferation in response to polyclonal stimulation,particularly among the T2 B cell subset (Fig. 6). Furthermore, theT2 subset was diminished in infected mice when compared withuninfected controls. Interestingly, we previously reported thatM-MDSCs suppressed proliferation of IL-10–producing regulatoryB cells (11), which are contained within the T2 B cell lineage (64,65). The selective specificity of M-MDSC suppression of pro-liferationforBcells at thisdevelopmental stagewill require furtherstudy but may be due to differences in signaling requirements for
proliferation and survival (53, 54). Since our laboratory’s initialfinding that LP-BM5-expanded M-MDSCs suppress B cell pro-liferation (7), MDSCs have also been found to suppress B cellactivation and proliferation in other systems, including murinemodels of autoimmunity (15, 16).
As detailed earlier in this article, MDSC expansion has beendetected in humans, particularly during HIV infection, and hasbeenobservedto result in thesuppressionofproliferationofTcells(23–29).During the timeof thewriting of thispaper, Lelis et al. (13)publisheda report on theeffects ofhumanMDSCsonBcells, albeitabout granulocyte-likeMDSCs, notM-MDSCs, and in the contextof healthy donors, not retrovirus-induced immunodeficiency. Theauthors observed that human G-MDSCs suppressed in vitro B cellproliferation in a manner that involved the mediators arginase-1,NO, and reactive oxygen species (13).
M-MDSCs also altered Ab responses of target B cells byincreasing production of class-switched IgG Abs (Fig. 2). Thisincreased IgG production was accompanied by an increase inproportions and numbers of GC B cells, the developmental subsetthat undergoes class switching. In the context of anti-CD40 + IL-4stimulation, M-MDSCs also increased total Ab production, IgMproduction, and proportions and numbers of Ab-secreting cells(Fig. 2). Similar to the observed effects of M-MDSCs on B cells invitro, LP-BM5 infection also resulted in increased Ab levels inthe spleen and increased numbers of GC B cells and Ab-secretingcells (Fig. 7).
These data are in agreementwith a recent report fromXuet al.(12) in a murine fibrosarcoma model, in which it was reportedthat MDSCs accumulated around the GCs of tumor-bearing miceand increased IgA, IgG2c, and IgG1 production, suggesting thatMDSCs may play an important, broad role in a variety of diseasestates to promote class switching and terminal differentiation ofB cells. Interestingly, the increase in IgA in this tumor model wasfound to be mediated in part by TGF-b (12), one of the soluble
FIGURE 4. M-MDSCs decreased B cell Ag presentation.
(A and B) [3H]Thymidine incorporation assays were used to assess M-MDSC suppression of Ag presentation by B cells pulsed with OVA peptide
[(A) 5 mg/ml or (B) 25 mg/ml)]. Data shown are from a representative experiment, with a similar pattern of results observed in two experiments. *p , 0.05.
https://doi.org/10.4049/immunohorizons.1700066
96 LP-BM5–EXPANDED M-MDSCs ALTER B CELL PHENOTYPE AND FUNCTION ImmunoHorizons
by guest on March 11, 2019
http://ww
w.im
munohorizons.org/
Dow
nloaded from
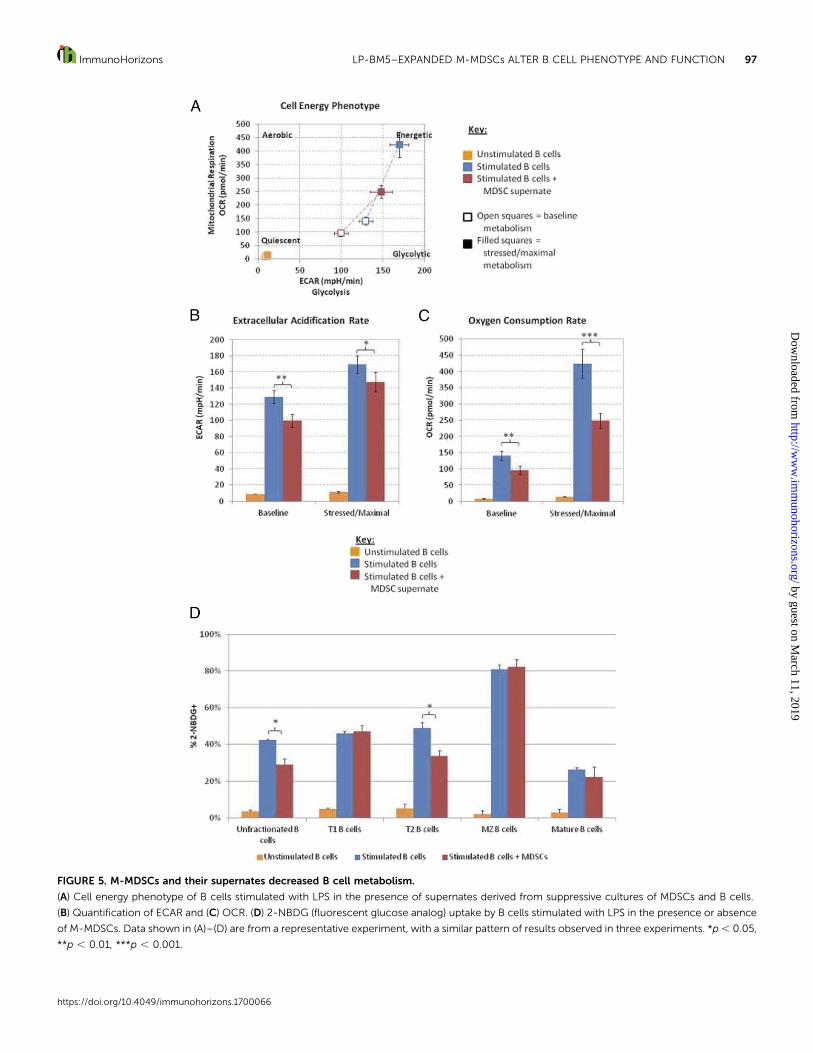
FIGURE 5. M-MDSCs and their supernates decreased B cell metabolism.
(A) Cell energy phenotype of B cells stimulated with LPS in the presence of supernates derived from suppressive cultures of MDSCs and B cells.
(B) Quantification of ECAR and (C) OCR. (D) 2-NBDG (fluorescent glucose analog) uptake by B cells stimulated with LPS in the presence or absence
of M-MDSCs. Data shown in (A)–(D) are from a representative experiment, with a similar pattern of results observed in three experiments. *p, 0.05,
**p , 0.01, ***p , 0.001.
https://doi.org/10.4049/immunohorizons.1700066
ImmunoHorizons LP-BM5–EXPANDED M-MDSCs ALTER B CELL PHENOTYPE AND FUNCTION 97
by guest on March 11, 2019
http://ww
w.im
munohorizons.org/
Dow
nloaded from

mediators of B cell suppression we identified in the LP-BM5system (11). TGF-b has also been observed to inhibit proliferationand increase class switching to IgG2c and IgG3 (66), consistent
with the increase in these specific IgG subclasses both in thepresence of M-MDSCs and in LP-BM5 retrovirus–infected mice(Figs. 2, 7).
FIGURE 6. LP-BM5 retroviral infection preferentially decreased proliferation of T2 B cells.
(A) CFSE in combination with surface staining for flow cytometry was used to visualize division of B cells in different developmental stages from
naive and LP-BM5–infected mice in response to LPS stimulation in vitro. (B) Geometric MFIs of CFSE and (C) percentage of cells divided of different
developmental subsets. (D) Proportions of T2 B cells in spleens of infected and uninfected mice. Data shown in (A)–(D) are from a representative
experiment, with a similar pattern of results observed in three experiments. *p , 0.05, **p , 0.01, ***p , 0.001.
https://doi.org/10.4049/immunohorizons.1700066
98 LP-BM5–EXPANDED M-MDSCs ALTER B CELL PHENOTYPE AND FUNCTION ImmunoHorizons
by guest on March 11, 2019
http://ww
w.im
munohorizons.org/
Dow
nloaded from
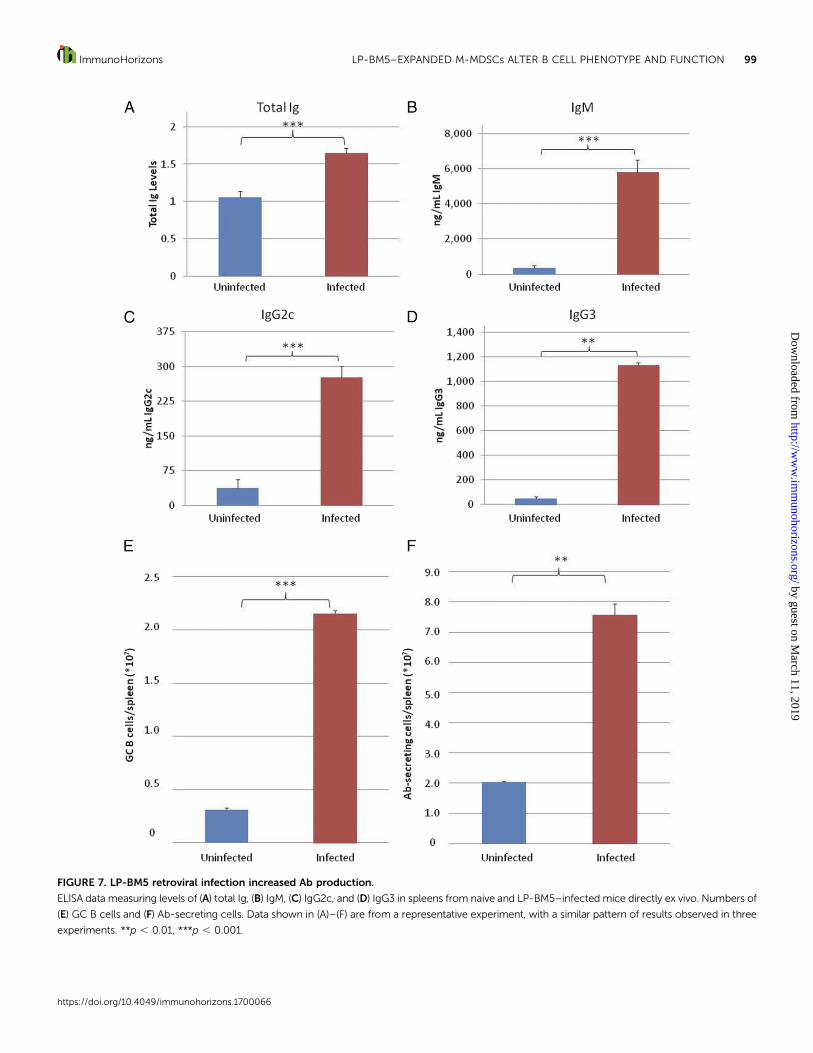
FIGURE 7. LP-BM5 retroviral infection increased Ab production.
ELISA data measuring levels of (A) total Ig, (B) IgM, (C) IgG2c, and (D) IgG3 in spleens from naive and LP-BM5–infected mice directly ex vivo. Numbers of
(E) GC B cells and (F) Ab-secreting cells. Data shown in (A)–(F) are from a representative experiment, with a similar pattern of results observed in three
experiments. **p , 0.01, ***p , 0.001.
https://doi.org/10.4049/immunohorizons.1700066
ImmunoHorizons LP-BM5–EXPANDED M-MDSCs ALTER B CELL PHENOTYPE AND FUNCTION 99
by guest on March 11, 2019
http://ww
w.im
munohorizons.org/
Dow
nloaded from
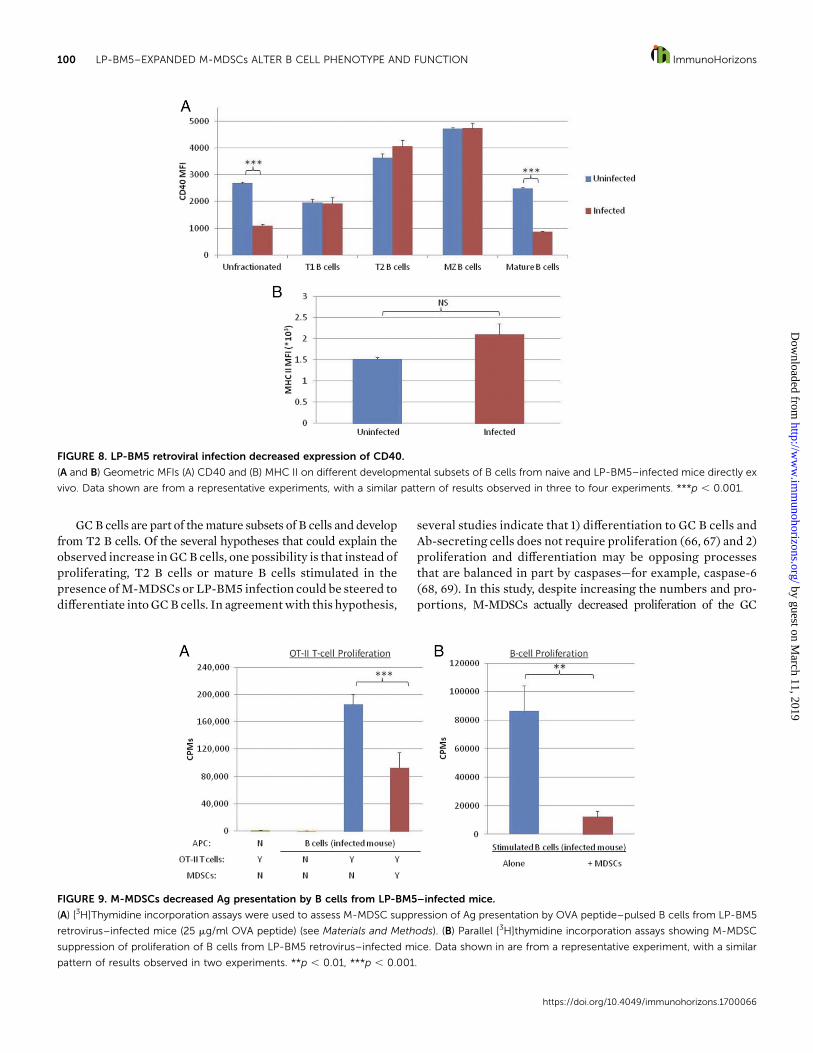
GCB cells are part of themature subsets of B cells and developfrom T2 B cells. Of the several hypotheses that could explain theobserved increase inGCB cells, one possibility is that instead ofproliferating, T2 B cells or mature B cells stimulated in thepresence ofM-MDSCs or LP-BM5 infection could be steered todifferentiate intoGCB cells. In agreementwith this hypothesis,
several studies indicate that 1) differentiation to GC B cells andAb-secreting cells does not require proliferation (66, 67) and 2)proliferation and differentiation may be opposing processesthat are balanced in part by caspases—for example, caspase-6(68, 69). In this study, despite increasing the numbers and pro-portions, M-MDSCs actually decreased proliferation of the GC
FIGURE 8. LP-BM5 retroviral infection decreased expression of CD40.
(A and B) Geometric MFIs (A) CD40 and (B) MHC II on different developmental subsets of B cells from naive and LP-BM5–infected mice directly ex
vivo. Data shown are from a representative experiments, with a similar pattern of results observed in three to four experiments. ***p , 0.001.
FIGURE 9. M-MDSCs decreased Ag presentation by B cells from LP-BM5–infected mice.
(A) [3H]Thymidine incorporation assays were used to assess M-MDSC suppression of Ag presentation by OVA peptide–pulsed B cells from LP-BM5
retrovirus–infected mice (25 mg/ml OVA peptide) (see Materials and Methods). (B) Parallel [3H]thymidine incorporation assays showing M-MDSC
suppression of proliferation of B cells from LP-BM5 retrovirus–infected mice. Data shown in are from a representative experiment, with a similar
pattern of results observed in two experiments. **p , 0.01, ***p , 0.001.
https://doi.org/10.4049/immunohorizons.1700066
100 LP-BM5–EXPANDED M-MDSCs ALTER B CELL PHENOTYPE AND FUNCTION ImmunoHorizons
by guest on March 11, 2019
http://ww
w.im
munohorizons.org/
Dow
nloaded from
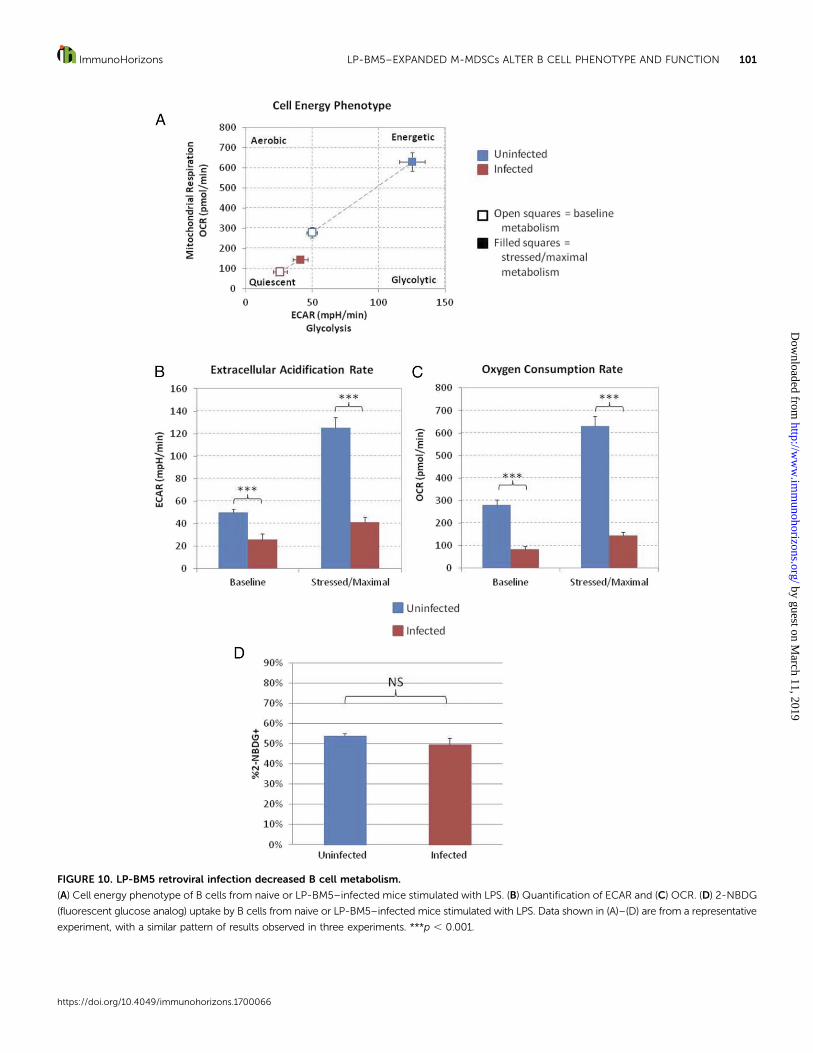
FIGURE 10. LP-BM5 retroviral infection decreased B cell metabolism.
(A) Cell energy phenotype of B cells from naive or LP-BM5–infected mice stimulated with LPS. (B) Quantification of ECAR and (C) OCR. (D) 2-NBDG
(fluorescent glucose analog) uptake by B cells from naive or LP-BM5–infected mice stimulated with LPS. Data shown in (A)–(D) are from a representative
experiment, with a similar pattern of results observed in three experiments. ***p , 0.001.
https://doi.org/10.4049/immunohorizons.1700066
ImmunoHorizons LP-BM5–EXPANDED M-MDSCs ALTER B CELL PHENOTYPE AND FUNCTION 101
by guest on March 11, 2019
http://ww
w.im
munohorizons.org/
Dow
nloaded from
B cells (Fig. 2O) and had little to no effect on proliferation ofAb-secreting cells.
LP-BM5–expanded M-MDSCs also altered B cell phenotypeand function by decreasing expression of the B cell surfacemolecules CD40 and MHC II (Fig. 3) and, in concert, decreasingAg presentation (Fig. 4). CD40 expression was also reduced inresponse to infection (Fig. 8). In contrast, LP-BM5 infection led toslight but non–statistically significant increases in MHC II levels,perhaps because of retrovirus-induced activation. Importantly, inex vivo suppression assays, M-MDSCs inhibited Ag presentationby these ex vivo stimulated infected B cells (Fig. 9). SignalingthroughCD40 is important inGC formation and in activating classswitching and somatic hypermutation in B cells (70–72). Theobserveddecrease inCD40mayseemparadoxical atfirst given thatM-MDSCs also increased B cell production of class-switched Abs.However, thismay be explained, at least in part, by the observationthat in other systems, CD40 is internalized after ligation (73, 74).We have previously published that CD40–CD154 binding betweenB and CD4+ T cells, respectively, and CD40 signaling throughselective TRAF adaptor proteins is required for initiation and pro-gression of LP-BM5–induced pathogenesis (49, 75–77). Based onthis involvement of CD40 signaling in pathogenesis, it is temptingto speculate that M-MDSC–mediated decreases in CD40 expres-sion, which are reflected in B cells from LP-BM5–infected mice,could help tomoderate disease, even in highly susceptible B6mice.
These alterations in B cell phenotype and function coincidedwith decreased glycolysis and oxidative phosphorylation anddecreased glucose uptake in the presence of MDSC, which wasmost prominent in the T2 B cell subset (Fig. 5). Correspondingly,B cells from infectedmice demonstrated severemetabolic defects,analogous to some of those observed in in vitro MDSC–B cellsuppression assays, with decreases in both baseline and stressedand/or maximal aerobic glycolysis and oxidative phosphorylation(Fig. 10). Interestingly, whereas M-MDSCs decreased glucoseuptake by B cells in ex vivo suppression assays, infection did notsignificantly affect glucose uptake (Fig. 10). Several potentialexplanations exist for the decreases in glycolysis and oxidativephosphorylation yet sustained glucose uptake seen in B cells frominfectedmice.For example, decreases inglucose transportmaynotbe necessary for decreases in glycolysis and oxidative phosphory-lation, as glucose uptake may not be the rate-limiting step.Alternatively, glucose could be used for othermetabolic pathwaysto generate sufficient energy required by the B cells, such as thepentose phosphate pathway (which is involved in nucleic acidsynthesis and antioxidant generation; see Ref. 78) or lipid syn-thesis. It hasbeenreported thatwhereasBcellproliferationentailsactivation of aerobic glycolysis, Ig production is characterized byreduced glycolysis and increased consumption of glutamine (79).In addition, increased lipid synthesis likely cooperates to providefor the increases in the endoplasmic reticulum and other endo-membrane networks (i.e., the Golgi apparatus) necessary for Igsynthesis (80). Ab-secreting cells also increase autophagy to meettheir metabolic demands and to regulate endoplasmic reticulumsize and stress (81). Future studieswouldbeneeded todetermine ifM-MDSCs increase glutamine consumption, lipid synthesis, the
pentose phosphate pathway, and/or autophagy in B cells concur-rent with the increase in Ig production.
Depletion of M-MDSCs remains an elusive target, both in theMDSCs field in general and in this nonacute retroviral infectionsystem, due in part to both practical concerns arising from therelatively chronic time course of retroviral pathogenesis (e.g.,dramatic immunodeficiency at 8 wpi) and the lack of MDSC-specific cell surface molecules to target (without targeting otherimportant cell types) aswell as the similarity in phenotype to otherimmune cells potentially involved directly in either viral patho-genesis or the host response (22). Thus, in an initial attempt toassess the potential of B cells as important targets of M-MDSCsand LP-BM5 disease, we showed in this study that the phenotypeand function of B cells from infected mice is strongly correlatedwithobserved invitro effects ofM-MDSCsonBcell targets.Despitethese consistent and striking parallels, future studies are needed toprovide direct evidence for M-MDSC function in vivo. Of specialimportance, reaching beyond this experimental system are theobservations that M-MDSCs alter positively, rather than alwaysinhibit, certainBcell subsetproportions and/or functions, includingGCBcell andAb-secreting cell percentages andAbproduction (Fig.2).This isnotunlikewhat is seenwithothercell subsets traditionallydefined as suppressive, such as T regulatory cells, which have beenobserved to promoteTh17 responses (82, 83), tissue repair (84), andGCreactions (85)undercertainconditions.Ademonstration in theLP-BM5 system thatM-MDSCs directly cause the positive effectsobserved invivowouldopenupanewlevel ofconsiderationfor thecapacities for MDSCs to differentially regulate specific cellulartargets and their functions in various disease states.
Similar to patientswithHIV-inducedAIDS,micewithLP-BM5–induced MAIDS display increased susceptibility to opportunisticinfections, ranging from bacterial (86–88) to viral (89–94), fungal(95–98), and protozoan parasitic infections (99–102). Althoughdata are limited regarding the role of B cell dysfunction in the in-creased susceptibility observed in LP-BM5–infected mice, humoralresponses have been demonstrated to be important for clearance ofmany of these pathogens in other systems. The disease course ofthese opportunistic infections in LP-BM5–infected mice is similarto thediseasecourseof thesepathogens inBcell–deficient,non–LP-BM5–infected mice, indicating that B cell alterations could be amajor contributing factor to increased susceptibility (103–105).Further understanding of the in vitro and ex vivo effects ofMDSCsonBcell phenotype and functionmayhelp to address this increasedsusceptibility and provide approaches to prevent or treat opportu-nistic infections.
DISCLOSURES
The authors have no financial conflicts of interest.
ACKNOWLEDGMENTS
We thank David Leib, Mary Jo Turk, Kathy Green, Megan O’Connor,Petra Sergent, Fiona McEnany, Yanbo Sun, Joshua Obar, Yina Huang, andEdward Usherwood for technical assistance and helpful discussions.
https://doi.org/10.4049/immunohorizons.1700066
102 LP-BM5–EXPANDED M-MDSCs ALTER B CELL PHENOTYPE AND FUNCTION ImmunoHorizons
by guest on March 11, 2019
http://ww
w.im
munohorizons.org/
Dow
nloaded from
REFERENCES
1. Nagaraj, S., and D. I. Gabrilovich. 2010. Myeloid-derived suppressorcells in human cancer. Cancer J. 16: 348–353.
2. Talmadge, J. E., and D. I. Gabrilovich. 2013. History of myeloid-derived suppressor cells. Nat. Rev. Cancer 13: 739–752.
3. Bronte, V., S. Brandau, S.-H. Chen, M. P. Colombo, A. B. Frey,T. F. Greten, S. Mandruzzato, P. J. Murray, A. Ochoa, S. Ostrand-Rosenberg, et al. 2016. Recommendations for myeloid-derived sup-pressor cell nomenclature and characterization standards. Nat. Commun.7: 12150.
4. Marigo, I., L. Dolcetti, P. Serafini, P. Zanovello, and V. Bronte. 2008.Tumor-induced tolerance and immune suppression by myeloid de-rived suppressor cells. Immunol. Rev. 222: 162–179.
5. Sica, A., and V. Bronte. 2007. Altered macrophage differentiation andimmune dysfunction in tumor development. J. Clin. Invest. 117:1155–1166.
6. Solito, S., I. Marigo, L. Pinton, V. Damuzzo, S. Mandruzzato, andV. Bronte. 2014. Myeloid-derived suppressor cell heterogeneity inhuman cancers. Ann. N. Y. Acad. Sci. 1319: 47–65.
7. Green, K. A., W. J. Cook, and W. R. Green. 2013. Myeloid-derivedsuppressor cells in murine retrovirus-induced AIDS inhibit T- andB-cell responses in vitro that are used to define the immunodefi-ciency. J. Virol. 87: 2058–2071.
8. Green, K. A., L. Wang, R. J. Noelle, and W. R. Green. 2015. Selectiveinvolvement of the checkpoint regulator VISTA in suppression ofB-cell, but not T-cell, responsiveness by monocytic myeloid-derivedsuppressor cells from mice infected with an immunodeficiency-causing retrovirus. J. Virol. 89: 9693–9698.
9. O’Connor, M. A., J. L. Vella, and W. R. Green. 2016. Reciprocal re-lationship of T regulatory cells and monocytic myeloid-derivedsuppressor cells in LP-BM5 murine retrovirus-induced immunode-ficiency. J. Gen. Virol. 97: 509–522 .
10. O’Connor, M. A., W. W. Fu, K. A. Green, and W. R. Green. 2015. Sub-populations of M-MDSCs from mice infected by an immunodeficiency-causing retrovirus and their differential suppression of T- vs B-cellresponses. Virology 485: 263–273.
11. Rastad, J. L., and W. R. Green. 2016. Myeloid-derived suppressorcells in murine AIDS inhibit B-cell responses in part via solublemediators including reactive oxygen and nitrogen species, and TGF-b.Virology 499: 9–22.
12. Xu, X., Q. Meng, U. Erben, P. Wang, R. Glauben, A. A. Kuhl, H. Wu,C. W. Ma, M. Hu, Y. Wang, et al. 2017. Myeloid-derived suppressorcells promote B-cell production of IgA in a TNFR2-dependentmanner. Cell. Mol. Immunol. 14: 597–606.
13. Lelis, F. J. N., J. Jaufmann, A. Singh, K. Fromm, A. C. Teschner,S. Poschel, I. Schafer, S. Beer-Hammer, N. Rieber, and D. Hartl. 2017.Myeloid-derived suppressor cells modulate B-cell responses. Immunol.Lett. 188: 108–115.
14. Wang, L., E. W. Chang, S. C. Wong, S.-M. Ong, D. Q. Chong, andK. L. Ling. 2013. Increased myeloid-derived suppressor cells ingastric cancer correlate with cancer stage and plasma S100A8/A9proinflammatory proteins. J Immunol. 190: 794–804.
15. Crook, K. R., M. Jin, M. F. Weeks, R. R. Rampersad, R. M. Baldi,A. S. Glekas, Y. Shen, D. A. Esserman, P. Little, T. A. Schwartz,and P. Liu. 2015. Myeloid-derived suppressor cells regulate T celland B cell responses during autoimmune disease. J. Leukoc. Biol. 97:573–582.
16. Liu, P., K. Crook, and M. Weeks. 2014. Impact of myeloid-derivedsuppressor cells on adoptive immunity in autoimmune arthritis.J. Immunol. 192: 200.6.
17. Park, M.-J., S.-H. Lee, E.-K. Kim, E.-J. Lee, S.-H. Park, S.-K. Kwok,and M.-L. Cho. 2016. Myeloid-derived suppressor cells induce theexpansion of regulatory B cells and ameliorate autoimmunity in the
sanroque mouse model of systemic lupus erythematosus. ArthritisRheumatol. 68: 2717–2727.
18. Li, Y., Z. Tu, S. Qian, J. J. Fung, S. D. Markowitz, L. L. Kusner,H. J. Kaminski, L. Lu, and F. Lin. 2014. Myeloid-derived suppressorcells as a potential therapy for experimental autoimmune myastheniagravis. J. Immunol. 193: 2127–2134.
19. Kennedy, D. E., and K. L. Knight. 2015. Inhibition of B lymphopoiesisby adipocytes and IL-1–producing myeloid-derived suppressor cells.J. Immunol. 195: 2666–2674.
20. Kennedy, D. E., and K. L. Knight. 2017. Inflammatory changes inbone marrow microenvironment associated with declining B lym-phopoiesis. J. Immunol. 198: 3471–3479.
21. Kennedy, D. E., P. L. Witte, and K. L. Knight. 2016. Bone marrow fatand the decline of B lymphopoiesis in rabbits. Dev. Comp. Immunol.58: 30–39.
22. O’Connor, M. A., J. L. Rastad, and W. R. Green. 2017. The role ofmyeloid-derived suppressor cells in viral infection. Viral Immunol.30: 82–97.
23. Gama, L., E. N. Shirk, J. N. Russell, K. I. Carvalho, M. Li, S. E. Queen,J. Kalil, M. C. Zink, J. E. Clements, and E. G. Kallas. 2012. Expansionof a subset of CD14highCD16negCCR2low/neg monocytes function-ally similar to myeloid-derived suppressor cells during SIV and HIVinfection. J. Leukoc. Biol. 91: 803–816.
24. Qin, A., W. Cai, T. Pan, K. Wu, Q. Yang, N. Wang, Y. Liu, D. Yan,F. Hu, P. Guo, et al. 2013. Expansion of monocytic myeloid-derivedsuppressor cells dampens T cell function in HIV-1-seropositive in-dividuals. J. Virol. 87: 1477–1490.
25. Vollbrecht, T., R. Stirner, A. Tufman, J. Roider, R. M. Huber,J. R. Bogner, A. Lechner, C. Bourquin, and R. Draenert. 2012. Chronicprogressive HIV-1 infection is associated with elevated levels ofmyeloid-derived suppressor cells. AIDS 26: F31–F37.
26. Garg, A., and S. A. Spector. 2014. HIV type 1 gp120-induced expan-sion of myeloid derived suppressor cells is dependent on interleukin6 and suppresses immunity. J. Infect. Dis. 209: 441–451.
27. Lei, A. H., Q. Yang, W. P. Cai, Y. F. Liu, Y. Lan, A. P. Qin, F. Y. Hu,and J. Zhou. 2016. Clinical significance of myeloid-derived sup-pressor cells in human immunodeficiency virus-1/ hepatitis C virus-coinfected patients. Scand. J. Immunol. 83: 438–444.
28. Tumino, N., F. Turchi, S. Meschi, E. Lalle, V. Bordoni, R. Casetti,C. Agrati, E. Cimini, C. Montesano, V. Colizzi, et al. 2015. In HIV-positive patients, myeloid-derived suppressor cells induce T-cellanergy by suppressing CD3z expression through ELF-1 inhibition.AIDS 29: 2397–2407.
29. Zhang, Z.-N., N. Yi, T.-W. Zhang, L.-L. Zhang, X. Wu, M. Liu,Y.-J. Fu, S.-J. He, Y.-J. Jiang, H.-B. Ding, et al. 2017. Myeloid-derivedsuppressor cells associated with disease progression in primary HIVinfection: PD-L1 blockade attenuates inhibition. J. Acquir. ImmuneDefic. Syndr. 76: 200–208.
30. Sui, Y., A. Hogg, Y. Wang, B. Frey, H. Yu, Z. Xia, D. Venzon,K. McKinnon, J. Smedley, M. Gathuka, et al. 2014. Vaccine-inducedmyeloid cell population dampens protective immunity to SIV. J. Clin.Invest. 124: 2538–2549.
31. Dross, S. E., P. V. Munson, S. E. Kim, D. L. Bratt, H. C. Tunggal,A. L. Gervassi, D. H. Fuller, and H. Horton. 2017. Kinetics of myeloid-derived suppressor cell frequency and function during simian im-munodeficiency virus infection, combination antiretroviral therapy,and treatment interruption. J. Immunol. 198: 757–766.
32. Sui, Y., B. Frey, Y. Wang, R. Billeskov, S. Kulkarni, K. McKinnon,T. Rourke, L. Fritts, C. J. Miller, and J. A. Berzofsky. 2017. Para-doxical myeloid-derived suppressor cell reduction in the bonemarrow of SIV chronically infected macaques. PLoS Pathog. 13:e1006395.
33. De Santo, C., M. Salio, S. H. Masri, L. Y.-H. Lee, T. Dong, A. O. Speak,S. Porubsky, S. Booth, N. Veerapen, G. S. Besra, et al. 2008. InvariantNKT cells reduce the immunosuppressive activity of influenza A
https://doi.org/10.4049/immunohorizons.1700066
ImmunoHorizons LP-BM5–EXPANDED M-MDSCs ALTER B CELL PHENOTYPE AND FUNCTION 103
by guest on March 11, 2019
http://ww
w.im
munohorizons.org/
Dow
nloaded from
virus-induced myeloid-derived suppressor cells in mice and humans.J. Clin. Invest. 118: 4036–4048.
34. Jeisy-Scott, V., W. G. Davis, J. R. Patel, J. B. Bowzard, W.-J. Shieh,S. R. Zaki, J. M. Katz, and S. Sambhara. 2011. Increased MDSC ac-cumulation and Th2 biased response to influenza A virus infection inthe absence of TLR7 in mice. PLoS One 6: e25242.
35. Norris, B. A., L. S. Uebelhoer, H. I. Nakaya, A. A. Price, A. Grakoui,and B. Pulendran. 2013. Chronic but not acute virus infection inducessustained expansion of myeloid suppressor cell numbers that inhibitviral-specific T cell immunity. Immunity 38: 309–321.
36. Pallett, L. J., U. S. Gill, A. Quaglia, L. V. Sinclair, M. Jover-Cobos,A. Schurich, K. P. Singh, N. Thomas, A. Das, A. Chen, et al. 2015.Metabolic regulation of hepatitis B immunopathology by myeloid-derived suppressor cells. Nat. Med. 21: 591–600.
37. Huang, A., B. Zhang, W. Yan, B. Wang, H. Wei, F. Zhang, L. Wu,K. Fan, and Y. Guo. 2014. Myeloid-derived suppressor cells reg-ulate immune response in patients with chronic hepatitis B virusinfection through PD-1-induced IL-10. J. Immunol. 193: 5461–5469.
38. Chen, S., S. M. F. Akbar, M. Abe, Y. Hiasa, and M. Onji. 2011. Im-munosuppressive functions of hepatic myeloid-derived suppressorcells of normal mice and in a murine model of chronic hepatitis Bvirus. Clin. Exp. Immunol. 166: 134–142.
39. Zhang, H., S. Guan, K. Yang, J. Ye, K. Yan, Y. Pan, Y. Wu, A. Wang,and B. Sun. 2015. The frequency of peripheral blood CD14(+)HLA-DR(-/low) MDSCs is negatively correlated with the inflammationin patients with chronic hepatitis B. Chin J. Cell Mol. Immunol. 31:1387–1390, 1395.
40. Divito, S. J., and R. L. Hendricks. 2008. Activated inflammatory in-filtrate in HSV-1-infected corneas without herpes stromal keratitis.Invest. Ophthalmol. Vis. Sci. 49: 1488–1495.
41. Veiga-Parga, T., A. Suryawanshi, S. Mulik, F. Gimenez, S. Sharma,T. Sparwasser, and B. T. Rouse. 2012. On the role of regulatoryT cells during viral-induced inflammatory lesions. J. Immunol.189: 5924–5933.
42. Fortin, C., X. Huang, and Y. Yang. 2012. NK cell response to vacciniavirus is regulated by myeloid-derived suppressor cells. J. Immunol.189: 1843–1849.
43. Cerny, A., A. W. Hugin, R. R. Hardy, K. Hayakawa, R. M. Zinkernagel,M. Makino, and H. C. Morse III. 1990. B cells are required forinduction of T cell abnormalities in a murine retrovirus-inducedimmunodeficiency syndrome. J. Exp. Med. 171: 315–320.
44. Aziz, D. C., Z. Hanna, and P. Jolicoeur. 1989. Severe immunodeficiencydisease induced by a defective murine leukaemia virus. Nature 338:505–508.
45. Rassa, J. C., J. L. Meyers, Y. Zhang, R. Kudaravalli, and S. R. Ross.2002. Murine retroviruses activate B cells via interaction with toll-like receptor 4. Proc. Natl. Acad. Sci. USA 99: 2281–2286.
46. Burzyn, D., J. C. Rassa, D. Kim, I. Nepomnaschy, S. R. Ross, andI. Piazzon. 2004. Toll-like receptor 4-dependent activation of den-dritic cells by a retrovirus. J. Virol. 78: 576–584.
47. Del Corno, M., A. Cappon, G. Donninelli, B. Varano, F. Marra, andS. Gessani. 2016. HIV-1 gp120 signaling through TLR4 modulatesinnate immune activation in human macrophages and the biology ofhepatic stellate cells. J. Leukoc. Biol. 100: 599–606.
48. Klinken, S. P., T. N. Fredrickson, J. W. Hartley, R. A. Yetter, andH. C. Morse III. 1988. Evolution of B cell lineage lymphomas in micewith a retrovirus-induced immunodeficiency syndrome, MAIDS.J. Immunol. 140: 1123–1131.
49. Green, K. A., R. J. Noelle, and W. R. Green. 1998. Evidence for acontinued requirement for CD40/CD40 ligand (CD154) interactionsin the progression of LP-BM5 retrovirus-induced murine AIDS. Virology241: 260–268.
50. Rowe, W. P., W. E. Pugh, and J. W. Hartley. 1970. Plaque assaytechniques for murine leukemia viruses. Virology 42: 1136–1139.
51. Morgado, M. G., P. Cam, C. Gris-Liebe, P. A. Cazenave, andE. Jouvin-Marche. 1989. Further evidence that BALB/c and C57BL/6 gamma 2a genes originate from two distinct isotypes. EMBO J. 8:3245–3251.
52. Barnden, M. J., J. Allison, W. R. Heath, and F. R. Carbone. 1998.Defective TCR expression in transgenic mice constructed usingcDNA-based alpha- and beta-chain genes under the control of het-erologous regulatory elements. Immunol. Cell Biol. 76: 34–40.
53. Su, S. D., M. M. Ward, M. A. Apicella, and R. E. Ward. 1991. Theprimary B cell response to the O/core region of bacterial lipo-polysaccharide is restricted to the Ly-1 lineage. J. Immunol. 146:327–331.
54. Su, T. T., and D. J. Rawlings. 2002. Transitional B lymphocyte sub-sets operate as distinct checkpoints in murine splenic B cell devel-opment. J. Immunol. 168: 2101–2110.
55. Loder, F., B. Mutschler, R. J. Ray, C. J. Paige, P. Sideras, R. Torres,M. C. Lamers, and R. Carsetti. 1999. B cell development in the spleentakes place in discrete steps and is determined by the quality of B cellreceptor-derived signals. J. Exp. Med. 190: 75–89.
56. Ellebedy, A. H., K. J. L. Jackson, H. T. Kissick, H. I. Nakaya,C. W. Davis, K. M. Roskin, A. K. McElroy, C. M. Oshansky, R. Elbein,S. Thomas, et al. 2016. Defining antigen-specific plasmablast andmemory B cell subsets in human blood after viral infection or vac-cination. Nat. Immunol. 17: 1226–1234.
57. Chen, X., and P. E. Jensen. 2008. The role of B lymphocytes as antigen-presenting cells. Arch. Immunol. Ther. Exp. (Warsz.) 56: 77–83.
58. Victora, G. D., T. A. Schwickert, D. R. Fooksman, A. O. Kamphorst,M. Meyer-Hermann, M. L. Dustin, and M. C. Nussenzweig. 2010.Germinal center dynamics revealed by multiphoton microscopy witha photoactivatable fluorescent reporter. Cell 143: 592–605.
59. Pearce, E. L. 2010. Metabolism in T cell activation and differentia-tion. Curr. Opin. Immunol. 22: 314–320.
60. Warburg, O. 1956. On the origin of cancer cells. Science 123: 309–314.61. Caro-Maldonado, A., R. Wang, A. G. Nichols, M. Kuraoka, S. Milasta,
L. D. Sun, A. L. Gavin, E. D. Abel, G. Kelsoe, D. R. Green, and J. C. Rathmell.2014. Metabolic reprogramming is required for antibody productionthat is suppressed in anergic but exaggerated in chronically BAFF-exposed B cells. J. Immunol. 192: 3626–3636.
62. Jellusova, J., M. H. Cato, J. R. Apgar, P. Ramezani-Rad, C. R. Leung,C. Chen, A. D. Richardson, E. M. Conner, R. J. Benschop, J. R. Woodgett,and R. C. Rickert. 2017. Gsk3 is a metabolic checkpoint regulator inB cells. Nat. Immunol. 18: 303–312.
63. Mosier, D. E., R. A. Yetter, and H. C. Morse III. 1985. Retroviral in-duction of acute lymphoproliferative disease and profound immuno-suppression in adult C57BL/6 mice. J. Exp. Med. 161: 766–784.
64. Blair, P. A., K. A. Chavez-Rueda, J. G. Evans, M. J. Shlomchik,A. Eddaoudi, D. A. Isenberg, M. R. Ehrenstein, and C. Mauri. 2009.Selective targeting of B cells with agonistic anti-CD40 is an effica-cious strategy for the generation of induced regulatory T2-like B cellsand for the suppression of lupus in MRL/lpr mice. J. Immunol. 182:3492–3502.
65. Evans, J. G., K. A. Chavez-Rueda, A. Eddaoudi, A. Meyer-Bahlburg,D. J. Rawlings, M. R. Ehrenstein, and C. Mauri. 2007. Novel sup-pressive function of transitional 2 B cells in experimental arthritis.J. Immunol. 178: 7868–7878.
66. Lebman, D. A., and J. S. Edmiston. 1999. The role of TGF-b ingrowth, differentiation, and maturation of B lymphocytes. MicrobesInfect. 1: 1297–1304.
67. Meyer-Bahlburg, A., S. F. Andrews, K. O. A. Yu, S. A. Porcelli, andD. J. Rawlings. 2008. Characterization of a late transitional B cellpopulation highly sensitive to BAFF-mediated homeostatic pro-liferation. J. Exp. Med. 205: 155–168.
68. Richards, S., C. Watanabe, L. Santos, A. Craxton, and E. A. Clark.2008. Regulation of B-cell entry into the cell cycle. Immunol. Rev.224: 183–200.
https://doi.org/10.4049/immunohorizons.1700066
104 LP-BM5–EXPANDED M-MDSCs ALTER B CELL PHENOTYPE AND FUNCTION ImmunoHorizons
by guest on March 11, 2019
http://ww
w.im
munohorizons.org/
Dow
nloaded from

69. Watanabe, C., G. L. Shu, T. S. Zheng, R. A. Flavell, and E. A. Clark.2008. Caspase 6 regulates B cell activation and differentiation intoplasma cells. J. Immunol. 181: 6810–6819.
70. Van den Eertwegh, A. J., R. J. Noelle, M. Roy, D. M. Shepherd,A. Aruffo, J. A. Ledbetter, W. J. Boersma, and E. Claassen. 1993. Invivo CD40-gp39 interactions are essential for thymus-dependenthumoral immunity. I. In vivo expression of CD40 ligand, cytokines,and antibody production delineates sites of cognate T-B cell inter-actions. J. Exp. Med. 178: 1555–1565.
71. Foy, T. M., F. H. Durie, and R. J. Noelle. 1994. The expansive roleof CD40 and its ligand, gp39, in immunity. Semin. Immunol. 6:259–266.
72. Elgueta, R., M. J. Benson, V. C. de Vries, A. Wasiuk, Y. Guo, and R.J. Noelle. 2009. Molecular mechanism and function of CD40/CD40L engagement in the immune system. Immunol. Rev. 229:152–172.
73. Wang, H. M., Q. Yan, T. Yang, H. Cheng, J. Du, K. Yoshioka, S. K. P. Kung,and G. H. Ding. 2015. Scaffold protein JLP is critical for CD40 signaling inB lymphocytes. J. Biol. Chem. 290: 5256–5266.
74. Anolik, J., R. J. Looney, A. Bottaro, I. Sanz, and F. Young. 2003.Down-regulation of CD20 on B cells upon CD40 activation. Eur. J.Immunol. 33: 2398–2409.
75. Green, K. A., R. J. Noelle, B. G. Durell, and W. R. Green. 2001.Characterization of the CD154-positive and CD40-positive cellularsubsets required for pathogenesis in retrovirus-induced murine im-munodeficiency. J. Virol. 75: 3581–3589.
76. Green, K. A., K. M. Crassi, J. D. Laman, A. Schoneveld, R. R. Strawbridge,T. M. Foy, R. J. Noelle, and W. R. Green. 1996. Antibody to the ligandfor CD40 (gp39) inhibits murine AIDS-associated splenomegaly,hypergammaglobulinemia, and immunodeficiency in disease-susceptibleC57BL/6 mice. J. Virol. 70: 2569–2575.
77. Green, K. A., C. L. Ahonen, W. J. Cook, and W. R. Green. 2004.CD40-associated TRAF 6 signaling is required for disease inductionin a retrovirus-induced murine immunodeficiency. J. Virol. 78:6055–6060.
78. Patra, K. C., and N. Hay. 2014. The pentose phosphate pathway andcancer. Trends Biochem. Sci. 39: 347–354.
79. Garcia-Manteiga, J. M., S. Mari, M. Godejohann, M. Spraul,C. Napoli, S. Cenci, G. Musco, and R. Sitia. 2011. Metabolomics of Bto plasma cell differentiation. J. Proteome Res. 10: 4165–4176.
80. Dufort, F. J., M. R. Gumina, N. L. Ta, Y. Tao, S. A. Heyse, D. A. Scott,A. D. Richardson, T. N. Seyfried, and T. C. Chiles. 2014. Glucose-dependent de novo lipogenesis in B lymphocytes: a requirement foratp-citrate lyase in lipopolysaccharide-induced differentiation.J. Biol. Chem. 289: 7011–7024.
81. Pengo, N., M. Scolari, L. Oliva, E. Milan, F. Mainoldi, A. Raimondi,C. Fagioli, A. Merlini, E. Mariani, E. Pasqualetto, et al. 2013. Plasmacells require autophagy for sustainable immunoglobulin production.Nat. Immunol. 14: 298–305.
82. Pandiyan, P., H. R. Conti, L. Zheng, A. C. Peterson, D. R. Mathern,N. Hernandez-Santos, M. Edgerton, S. L. Gaffen, and M. J. Lenardo.2011. CD4(+)CD25(+)Foxp3(+) regulatory T cells promote Th17 cellsin vitro and enhance host resistance in mouse Candida albicans Th17cell infection model. Immunity 34: 422–434.
83. Chen, Y., C. J. Haines, I. Gutcher, K. Hochweller, W. M. Blumen-schein, T. McClanahan, G. Hammerling, M. O. Li, D. J. Cua, and M.J. McGeachy. 2011. Foxp3(+) regulatory T cells promote T helper 17cell development in vivo through regulation of interleukin-2. Im-munity 34: 409–421.
84. Zhang, C., L. Li, K. Feng, D. Fan, W. Xue, and J. Lu. 2017. ‘Repair’Treg cells in tissue injury. Cell. Physiol. Biochem. 43: 2155–2169.
85. Laidlaw, B. J., Y. Lu, R. A. Amezquita, J. S. Weinstein, J. A. VanderHeiden, N. T. Gupta, S. H. Kleinstein, S. M. Kaech, and J. Craft. 2017.Interleukin-10 from CD4+follicular regulatory T cells promotes thegerminal center response. Sci. Immunol. 2: eaan4767.
86. Umemura, M., K. Hirose, W. Wajjwaiku, H. Nishimura, T. Matsuguchi,Y. Gotoh, M. Takahashi, M. Makino, and Y. Yoshikai. 2001. ImpairedIL-15 production associated with susceptibility of murine AIDS tomycobacterial infection. J. Leukoc. Biol. 69: 138–148.
87. Orme, I. M., S. K. Furney, and A. D. Roberts. 1992. Dissemination of entericMycobacterium avium infections in mice rendered immunodeficient bythymectomy and CD4 depletion or by prior infection with murineAIDS retroviruses. Infect. Immun. 60: 4747–4753.
88. Darban, H., R. R. Watson, J. R. Darban, and L. M. Shahbazian. 1992.Modification of resistance to Streptococcus pneumoniae by dietaryethanol, immunization, and murine retroviral infection. Alcohol. Clin.Exp. Res. 16: 846–851.
89. Peacock, C. D., and P. Price. 1995. Effect of a retroviral immuno-deficiency syndrome on resistance to MCMV: a role for naturalkiller cells. J. Acquir. Immune Defic. Syndr. Hum. Retrovirol. 10:120–128.
90. Yang, H., R. L. Drain, C. A. Franco, and J. M. Clark. 1996. Efficacy ofBMS-180194 against experimental cytomegalovirus infections inimmunocompromised mice. Antiviral Res. 29: 233–241.
91. Peacock, C. D., S. D. Olver, and P. Price. 1997. Effect of a retroviralimmunodeficiency syndrome on murine cytomegalovirus-inducedhepatitis. Am. J. Pathol. 150: 1089–1100.
92. Peacock, C. D., and P. Price. 1999. The role of IL-12 in the control ofMCMV is fundamentally different in mice with a retroviral immu-nodeficiency syndrome (MAIDS). Immunol. Cell Biol. 77: 131–138.
93. Sepulveda, R. T., J. Zhang, and R. R. Watson. 2002. Selenium sup-plementation decreases coxsackievirus heart disease during murineAIDS. Cardiovasc. Toxicol. 2: 53–61.
94. Mutnal, M. B., S. J. Schachtele, S. Hu, and J. R. Lokensgard. 2013.T-cell reconstitution during murine acquired immunodeficiencysyndrome (MAIDS) produces neuroinflammation and mortality inanimals harboring opportunistic viral brain infection. J. Neuro-inflammation 10: 98.
95. Lacroix, C., F. Chau, C. Carbon,M. Sinet, and F. Derouin. 1997. Cryptococcusneoformans infection in mice previously infected with LP-BM5MuLV,the agent of murine AIDS (MAIDS). Clin. Exp. Immunol. 110: 196–202.
96. Furukawa, K., H. Sasaki, R. B. Pollard, and F. Suzuki. 2000. Lanoconazole,a new imidazole antimycotic compound, protects MAIDS mice againstencephalitis caused by Cryptococcus neoformans. J. Antimicrob.Chemother. 46: 443–450.
97. Cole, G. T., K. Saha, K. R. Seshan, K. T. Lynn, M. Franco, andP. K. Wong. 1992. Retrovirus-induced immunodeficiency in miceexacerbates gastrointestinal candidiasis. Infect. Immun. 60: 4168–4178.
98. Utsunomiya, T., M. Kobayashi, M. Ito, R. B. Pollard, and F.Suzuki. 2000. Glycyrrhizin improves the resistance of MAIDS miceto opportunistic infection of Candida albicans through the modula-tion of MAIDS-associated type 2 T cell responses. Clin. Immunol. 95:145–155.
99. Gazzinelli, R. T., J. W. Hartley, T. N. Fredrickson, S. K. Chattopadhyay,A. Sher, and H. C. Morse III. 1992. Opportunistic infections andretrovirus-induced immunodeficiency: studies of acute and chronicinfections with Toxoplasma gondii in mice infected with LP-BM5murine leukemia viruses. Infect. Immun. 60: 4394–4401.
100. Watanabe, H., Y. Suzuki, M. Makino, and M. Fujiwara. 1993. Toxo-plasma gondii: induction of toxoplasmic encephalitis in mice withchronic infection by inoculation of a murine leukemia virus inducingimmunodeficiency. Exp. Parasitol. 76: 39–45.
101. Khan, I. A., W. R. Green, L. H. Kasper, K. A. Green, and J. D. Schwartzman.1999. Immune CD8(+) T cells prevent reactivation of Toxoplasmagondii infection in the immunocompromised host. Infect. Immun. 67:5869–5876.
102. Alak, J. I., M. Shahbazian, D. S. Huang, Y. Wang, H. Darban,E. M. Jenkins, and R. R. Watson. 1993. Alcohol and murine acquiredimmunodeficiency syndrome suppression of resistance to Cryptosporidium
https://doi.org/10.4049/immunohorizons.1700066
ImmunoHorizons LP-BM5–EXPANDED M-MDSCs ALTER B CELL PHENOTYPE AND FUNCTION 105
by guest on March 11, 2019
http://ww
w.im
munohorizons.org/
Dow
nloaded from

parvum infection during modulation of cytokine production. Alcohol.Clin. Exp. Res. 17: 539–544.
103. Schneider, K., A. Loewendorf, C. De Trez, J. Fulton, A. Rhode,H. Shumway, S. Ha, G. Patterson, K. Pfeffer, S. A. Nedospasov, et al.2008. Lymphotoxin-mediated crosstalk between B cells and splenicstroma promotes the initial type I interferon response to cytomeg-alovirus. Cell Host Microbe 3: 67–76.
104. Chaudhri, G., V. Panchanathan, H. Bluethmann, and G. Karupiah.2006. Obligatory requirement for antibody in recovery from a primarypoxvirus infection. J. Virol. 80: 6339–6344.
105. Wilson, R., J. M. Cohen, R. J. Jose, C. de Vogel, H. Baxendale, andJ. S. Brown. 2015. Protection against Streptococcus pneumoniae lunginfection after nasopharyngeal colonization requires both humoraland cellular immune responses. Mucosal Immunol. 8: 627–639.
https://doi.org/10.4049/immunohorizons.1700066
106 LP-BM5–EXPANDED M-MDSCs ALTER B CELL PHENOTYPE AND FUNCTION ImmunoHorizons
by guest on March 11, 2019
http://ww
w.im
munohorizons.org/
Dow
nloaded from