Lower Taieri Water Quality Report
129
Report on the Surface Water Quality of the Lower Taieri River Catchment March 2004
Transcript of Lower Taieri Water Quality Report

Report on the Surface Water Quality of the Lower Taieri River Catchment
March 2004

Report on the Surface Water Quality of the Lower Taieri River Catchment
ISBN 1-877265-32-2
March 2004 Front cover: Taieri River at Allanton

Report on the Surface Water Quality of the Lower Taieri River Catchment
i
Chairperson's Foreword
The lower Taieri River catchment is an important area with its mix of urban and industrial development, intensive agriculture and ecologically significant wetlands. For many people in Dunedin and surrounding districts it is an area with special character. To them it is a great place to live, to enjoy and to prosper. The Taieri River and the many smaller waterways on the plains and the wetland complex, which includes Lakes Waipori and Waihola, are all part of what makes the area a special place. Water quality in the lower Taieri waterways has been a matter of public concern for some time. Of particular concern has been the poor quality of the water discharged
from the Main Drain into Lake Waipori. I am pleased, therefore, that a comprehensive water quality study has been completed and I am sure that it will play an important part in helping to clarify the extent of the problem and provide direction for future action. The report highlights that while water quality in the lower Taieri River and its main tributaries is relatively good, quality is compromised at times particularly during wet weather. In contrast, water quality in some of the smaller streams, such as Owhiro Stream, and in some of the drains on the West Taieri, is not up to a standard that most members of the community would feel is acceptable. While these results are of concern, I am encouraged by the positive response to initiatives undertaken by the Otago Regional Council over the past two years, which are aimed at improving water quality throughout the whole of the lower Taieri catchment. The Otago Regional Council is committed to its part in ensuring water quality on the lower Taieri improves. I urge all those with an interest in the area including, management agencies, urban authorities and members of the farming community to work together to ensure that the necessary changes in landuse practices happen. Duncan Butcher Chairperson

Report on the Surface Water Quality of the Lower Taieri River Catchment
ii
ii

Report on the Surface Water Quality of the Lower Taieri River Catchment
iii
Executive Summary
In October 2001 the Otago Regional Council began an intensive 12-month surface water quality monitoring programme in the lower Taieri River catchment. The programme forms part of the Lower Taieri Catchment Programme and was launched in response to concerns from Council, interest groups and the local community that water quality in the lower Taieri River catchment was being adversely affected by poor land management practices on the intensively farmed Taieri Plain. The water quality monitoring programme focused on monthly sampling at 30 sites for the first 8 months, and was scaled down to 16 sites for the final four months. Six of the 30 monitoring sites were located on the lower Taieri River between Outram and Henley Ferry, the others on key tributaries and agricultural drains. Water samples were tested for a range of physico-chemical and microbiological parameters including dissolved oxygen, temperature, pH, conductivity, turbidity, five-day biochemical oxygen demand (BOD), Escherichia coli (E. coli), ammoniacal nitrogen, nitrite-nitrate nitrogen, total nitrogen, dissolved reactive phosphorus and total phosphorus. One-off periphyton and macroinvertebrate sampling was also undertaken at selected sites, and four recreational sites also tested for selected microbiological indicators over the 2001-2002 summer. The monitoring results indicate water quality in the lower Taieri River is relatively good. Median concentrations for almost all physico-chemical and microbiological water quality parameters were below the ANZECC 2000 default trigger values at all six monitoring sites. Based on December 2000-December 2002 monitoring results, the median values of many water quality analytes are generally lower at Outram and Allanton than in the middle and upper reaches of the Taieri River. Analysis of historical water quality records at Allanton also indicate that the removal of the discharge of Mosgiel sewage from the lower Taieri River in mid 2000 has resulted in a significant improvement in water quality at Allanton. While median values complied with guidelines, water quality in the lower Taieri River was comprised at times, particularly during wet weather. This was the case at the Outram Glen site which is often used for contact recreation. Elevated E. coli counts exceeded recommended contact recreation guidelines on 6 out of 17 sampling occasions over the 2001-2002 summer. Elevated ammoniacal nitrogen concentrations were recorded below SH1 and require further investigation. Overall, the highest E. coli counts were recorded at Allanton. This may be related to poor water quality in Owhiro Stream. Lee Creek, the Silverstream and the Waipori River recorded the highest water quality of the lower Taieri River tributaries. With the exception of pH, median concentrations of water quality analytes for all of these watercourses were well within ANZECC 2000 guidelines. In contrast, water quality in Owhiro Stream was extremely poor. At both Gordon Road in Mosgiel and the bottom of the catchment below Riverside Road, the stream was enriched with organic matter, and recorded consistently elevated turbidity levels, E. coli counts and nutrient concentrations that significantly exceeded the ANZECC 2000 default trigger values. Stock (dairy cows and sheep) access was

Report on the Surface Water Quality of the Lower Taieri River Catchment
iv
iv
confirmed as the primary contributor to poor water quality below Riverside Road and sewage contamination, most probably as a result of cross-contamination with stormwater outfalls, is thought to be impacting on water quality above Burns Street. Periphyton growth is rampant at the Burns Street site and the macroinvertebrate community is severely impoverished. Water quality in the lower Taieri drains was poorest in the West Taieri drainage network, principally Kirks Drain and the Main Drain in the vicinity of Miller and Marshall Roads. A combination of authorised and unauthorised point source discharges, notably dairyshed effluent and septic tank effluent was identified as a key source of the contamination. High contaminant concentrations were also recorded in Lee Canal Drain on the West Taieri, particularly at Miller Road. Contaminant concentrations in the lower reaches of the Main Drain prior to the discharge to Lake Waipori were significantly lower, most probably as a result of dilution from groundwater intrusion. Most water quality impacts identified during the monitoring programme are attributed to point source discharges, livestock access to water and riparian margins, and poor land management practices. Point source discharges to water on the lower Taieri include dairyshed effluent, septic tank effluent, industrial and urban stormwater, and treated sewage from Dunedin International Airport at Momona. Stormwater discharges appear to be a problem in Mosgiel with impacts detected on both Owhiro Stream and, based on regular pollution events, the Silverstream. Septic tanks were also identified as a problem during and after the monitoring programme, with septic tank effluent from nine properties found leaking or discharging to drains. The leaking tanks are not isolated to any one location and it is likely that the problem is widespread. Livestock, both sheep and dairy cows, had direct access to the water at a number of monitoring sites. This contributed to bank erosion, sedimentation and degraded water quality, particularly in the lower reaches of the Owhiro Stream and A1 Drain. In most cases the impact of stock access was reflected in elevated E. coli counts that at times rendered the water unsuitable for contact recreation. Farming practices are also likely to be contributing to degraded water quality in some areas. Silage pit leachate runoff was identified on several occasions, in one case from an inappropriately located pit, and the other from a deliberate diversion of the runoff into a drain. Poor management of stand-off pads and winter sacrifice paddocks may also be causing localised problems. Otago Regional Council staff are working with the lower Taieri community and local agencies to address the various issues raised in this report.

Report on the Surface Water Quality of the Lower Taieri River Catchment
v
Table of Contents Executive Summary ......................................................................................................... iii
1 Introduction............................................................................................................... 1
1.1 Aims and Objectives ................................................................................. 2
2 Background Information.......................................................................................... 3
2.1 Catchment Description .............................................................................. 3
2.2 Water Quality Monitoring ......................................................................... 4
2.3 Biological Monitoring ............................................................................... 6
3 Study Area and Methods.......................................................................................... 7
3.1 Monitoring Sites ........................................................................................ 7
3.1.1 Water Quality Monitoring Sites ................................................... 7
3.2 Sampling Frequency................................................................................ 21
3.3 Sampling Methods................................................................................... 21
3.4 Monitoring Analytes................................................................................ 22
3.5 Data Analysis .......................................................................................... 22
4 Results ...................................................................................................................... 23
4.1 Water Temperature.................................................................................. 26
4.1.1 Definition and Significance........................................................ 26
4.1.2 Guidelines................................................................................... 26
4.1.3 Results ........................................................................................ 26
4.2 pH ............................................................................................................ 28
4.2.1 Definition and Significance........................................................ 28
4.2.2 Guidelines................................................................................... 28
4.2.3 Results ........................................................................................ 29
4.3 Suspended Sediment, Turbidity and Clarity............................................ 31
4.3.1 Definition and Significance........................................................ 31
4.3.2 Guidelines................................................................................... 31
4.3.3 Results ........................................................................................ 32
4.4 Conductivity ............................................................................................ 35
4.4.1 Definition and Significance........................................................ 35
4.4.2 Guidelines................................................................................... 35
4.4.3 Results ........................................................................................ 35

Report on the Surface Water Quality of the Lower Taieri River Catchment
vi
vi
4.5 Dissolved Oxygen and Biochemical Oxygen Demand (BOD) ............... 37
4.5.1 Definition and Significance........................................................ 37
4.5.2 Guidelines................................................................................... 37
4.5.3 Results ........................................................................................ 37
4.6 Nitrogen and Phosphorus ........................................................................ 41
4.6.1 Definition and Significance........................................................ 41
4.6.2 Guidelines................................................................................... 42
4.6.3 Results ........................................................................................ 42
4.7 Pathogens: Faecal Coliforms and E. coli................................................. 49
4.7.1 Definition and Significance........................................................ 49
4.7.2 Guidelines................................................................................... 50
4.7.3 Results ........................................................................................ 50
4.8 Periphyton and Macroinvertebrates......................................................... 53
4.8.1 Definition and Significance........................................................ 53
4.8.2 Guidelines................................................................................... 54
4.8.3 Results ........................................................................................ 54
4.9 Recreational Water Quality ..................................................................... 56
5 Discussion................................................................................................................. 60
5.1 Lower Taieri River .................................................................................. 60
5.1.1 Water Quality Over Time........................................................... 65
5.2 Water Quality in Tributaries of the Lower Taieri River.......................... 67
5.2.1 Mill Stream................................................................................. 67
5.2.2 Silverstream................................................................................ 68
5.2.3 Owhiro Stream............................................................................ 69
5.2.4 Lee Creek and Contour Channel ................................................ 71
5.2.5 Waipori River ............................................................................. 72
5.2.6 Meggatburn................................................................................. 73
5.2.7 Unnamed Tributary of Lake Waihola......................................... 73
5.3 Water Quality in the Lower Taieri Catchment Drains ............................ 74
5.3.1 Mill “Stream” Drain ................................................................... 74
5.3.2 A1 Drain ..................................................................................... 74
5.3.3 O13 Drain ................................................................................... 76
5.3.4 Main Drain.................................................................................. 76

Report on the Surface Water Quality of the Lower Taieri River Catchment
vii
5.3.5 Kirks Drain ................................................................................. 80
5.3.6 Lee Canal Drain.......................................................................... 81
5.4 Key Water Quality Issues........................................................................ 82
5.4.1 Point Source Discharges............................................................. 82
5.4.2 Direct Stock Access to Waterways and Riparian Areas............. 84
5.4.3 Land Management Practices....................................................... 85
6 Conclusions.............................................................................................................. 88
7. References................................................................................................................ 90
APPENDICES................................................................................................................. 71
Appendix 1 – Water Quality Monitoring Sites............................................................. 73
Appendix 2 – Raw Water Quality Results .................................................................... 78
Appendix 3 – Periphyton and Macroinvertebrate Results ......................................... 80
Appendix 4 – Seasonal Kendall Test Results................................................................ 86

Report on the Surface Water Quality of the Lower Taieri River Catchment
viii
viii
List of Figures Figure 1.1 The Taieri River at the Outram Glen picnic area ..................................... 1
Figure 2.1 Different farm types of the lower Taieri Plain ......................................... 4
Figure 2.2 Current state of environment surface water quality monitoring sites on the Lower Taieri Plain .............................................................................. 5
Figure 3.1 Physico-chemical and microbiological water quality monitoring sites sampled during October 2001 to September 2002 ................................... 8
Figure 3.2 Taieri River below the Henley Ferry Bridge, looking downstream ......... 9
Figure 3.3 Mill Stream at McKays Triangle............................................................ 10
Figure 3.4 Silverstream at Gordon Road, looking downstream............................... 11
Figure 3.5 Owhiro Stream at Burns Street, Mosgiel, looking downstream............. 12
Figure 3.6 Lee Creek at Woodside Glen (left) and the Contour Channel at Grainger Road........................................................................................................ 13
Figure 3.7 Waipori River at Henley Berwick Road, looking downstream.............. 14
Figure 3.8 Meggatburn at Berwick Road................................................................. 15
Figure 3.9 Unnamed Stream at Clarendon Road, looking downstream .................. 16
Figure 3.10 A1 Drain from the Taieri River flood gates ........................................... 17
Figure 3.11 O13 Drain looking downstream from Riverside Road........................... 17
Figure 3.12 Taieri Main Drain at the Waipori Pumping Station ............................... 18
Figure 3.13 Kirks Drain at Marshall Road................................................................. 19
Figure 3.14 Lee Canal Drain at Marshall Road ......................................................... 20
Figure 3.15 Boat jetty at Lake Waihola ..................................................................... 21
Figure 4.1 Box plot summarising surface water temperatures recorded in various waterways in the lower Taieri River catchment over October 2001 to September 2002 inclusive....................................................................... 27
Figure 4.2 Box plot summarising surface water temperatures recorded in various drains in the lower Taieri River catchment over October 2001 to September 2002 inclusive....................................................................... 28
Figure 4.3 Box plot summarising pH values recorded in various waterways in the lower Taieri River catchment over October 2001 to September 2002 inclusive.................................................................................................. 30
Figure 4.4 Box plot summarising pH values recorded in drains in the lower Taieri River catchment over October 2001 to September 2002 inclusive ........ 30
Figure 4.5 Box plot summarising turbidity values recorded in various waterways in the lower Taieri River catchment over October 2001 to September 2002 inclusive.................................................................................................. 32

Report on the Surface Water Quality of the Lower Taieri River Catchment
ix
Figure 4.6 Box plot summarising turbidity values recorded in drains in the lower Taieri River catchment over October 2001 to September 2002 inclusive................................................................................................................ 33
Figure 4.7 Mean daily flows recorded in the Taieri River at Outram over October 2001 to September 2002 inclusive, with the flows on sampling days denoted by arrows................................................................................... 34
Figure 4.8 Median conductivity concentrations recorded in various waterways in the lower Taieri River catchment over October 2001 to September 2002 inclusive.................................................................................................. 36
Figure 4.9 Box plot summarising conductivity concentrations recorded in various drains in the lower Taieri River catchment over October 2001 to September 2002 inclusive....................................................................... 36
Figure 4.10 Box plot summarising dissolved oxygen saturation data for various waterways in the lower Taieri River catchment over October 2001 to September 2002 inclusive....................................................................... 38
Figure 4.11 Box plot summarising dissolved oxygen saturation values for various drains in the lower Taieri River catchment over October 2001 to September 2002 inclusive....................................................................... 39
Figure 4.12 Dissolved oxygen concentrations recorded in the Main Drain over October 2001 to September 2002 inclusive............................................ 39
Figure 4.13 Median BOD concentrations recorded in various waterways in the lower Taieri River catchment over October 2001 to September 2002 inclusive................................................................................................................ 40
Figure 4.14 BOD concentrations recorded in various drains in the lower Taieri River catchment over October 2001 to September 2002 inclusive .................. 41
Figure 4.15 Box plot summarising ammoniacal nitrogen concentrations recorded in various waterways in the lower Taieri River catchment over October 2001 to September 2002 inclusive ......................................................... 43
Figure 4.16 Box plot summarising ammoniacal nitrogen concentrations recorded in various drains in the lower Taieri River catchment over October 2001 to September 2002 inclusive....................................................................... 44
Figure 4.17 Nitrite-nitrate nitrogen concentrations recorded in the lower Taieri River over October 2001 to September 2002 inclusive ................................... 44
Figure 4.18 Box plot summarising nitrite-nitrate nitrogen concentrations recorded in various drains in the lower Taieri River catchment over October 2001 to September 2002 inclusive....................................................................... 45
Figure 4.19 Box plot summarising total nitrogen concentrations recorded in various waterways in the lower Taieri River catchment over October 2001 to September 2002 inclusive....................................................................... 46

Report on the Surface Water Quality of the Lower Taieri River Catchment
x
x
Figure 4.20 Box plot summarising total nitrogen concentrations recorded in various drains in the lower Taieri River catchment over October 2001 to September 2002 inclusive....................................................................... 47
Figure 4.21 Box plot summarising dissolved reactive phosphorus concentrations recorded in various waterways in the lower Taieri River catchment over October 2001 to September 2002 inclusive............................................ 47
Figure 4.22 Box plot summarising dissolved reactive phosphorus concentrations ... 48
Figure 4.23 Box plot summarising total phosphorus concentrations recorded in various waterways in the lower Taieri River catchment over October 2001 to September 2002 inclusive ......................................................... 49
Figure 4.24 Box plot summarising E. coli counts in various waterways in the lower Taieri River catchment over October 2001 to September 2002 inclusive. The MfE/MoH 2003 microbiological guidelines for freshwater recreational areas are indicative only as their application should be restricted to the summer bathing season (i.e., 1 November to 31 March)................................................................................................................ 51
Figure 4.25 E. coli counts recorded in various waterways in the lower Taieri River catchment over October 2001 to September 2002 inclusive .................. 52
Figure 4.26 Box plot summarising E. coli counts in various drains in the lower ...... 53
Figure 4.27 E. coli counts recorded in the Taieri River at Outram Glen over 1 November 2001 to 31 March 2002 inclusive ......................................... 58
Figure 4.28 Blue-green algal bloom in Lake Waihola, February 2002 ..................... 59
Figure 5.1 Natural foams and tannin stained water entering the lower ................... 60
Figure 5.2 Total phosphorus concentrations recorded in the Taieri River at Allanton over August 1994 to August 2003 inclusive, along with the Seasonal Kendall slope estimator (trend line) ....................................................... 66
Figure 5.3 Iron-bacteria slimes in Mill Stream at Milners Road ............................. 67
Figure 5.4 Prolific filamentous algae growth in Owhiro Stream at Burns Street .... 69
Figure 5.5 Bank erosion, pugging, instream sedimentation and enrichment in Owhiro Stream below Riverside Road as a result of a stock access ...... 71
Figure 5.6 Dairy cows on the banks of the Contour Channel near Grainger Road . 72
Figure 5.7 Sheep on the banks of the unnamed tributary at Clarendon Road ......... 74
Figure 5.8 The A1 Drain above the floodgates to the Taieri River, with obvious signs of recent stock access .................................................................... 75
Figure 5.9 Black enriched water from the #28 Drain (left) entering the Main Drain at Miller Road......................................................................................... 77
Figure 5.10 The Main Drain at Marshall Road looking downstream in September 2001 (top) and in March 2002 (bottom) when the drain was smothered with Azolla.............................................................................................. 79

Report on the Surface Water Quality of the Lower Taieri River Catchment
xi
Figure 5.11 Septic tank effluent discharges to Kirks Drain from two properties on Kirks Drain Road – the discharge on the right was located a short distance above the Marshall Road sampling site.................................... 81
Figure 5.12 Leachate runoff from a silage pit below Riverside Road, near Owhiro Stream..................................................................................................... 86
Figure 5.13 The A1 Drain upstream of Riverside Road. The drain is fenced off preventing stock access and riparian vegetation has been allowed to grow................................................................................................................ 87

Report on the Surface Water Quality of the Lower Taieri River Catchment
xii
xii
List of Tables Table 4.1 Summary water quality data for rivers and streams in the lower Taieri
River catchment, October 2001 to May 2002 inclusive, with exceedances of the ANZECC 2000 default trigger values shown in bold type. Data for sites sampled through until September 2002 (n=12) are provided in brackets 24
Table 4.2 Summary water quality data for various Lower Taieri catchment drains, October 2001 to May 2002 inclusive (n=8). Data for sites sampled through until September 2002 (n=12) are provided in brackets 25
Table 4.3 Rainfall data* (mm) for the Lower Taieri Plain during water quality sampling over October 2001 to September 2002 inclusive 34
Table 4.4 Species richness and dominant taxa for single replicate periphyton samples collected from riffle habitats at SOE monitoring sites in the lower Taieri River catchment in March 2002 and March 2003 55
Table 4.5 Species richness, MCI, SQMCI and EPT scores for single replicate macroinvertebrate samples collected from riffle habitats in the lower Taieri River catchment in March 2002 and February/March 2003 56
Table 4.6 Median, minimum and maximum E. coli and enterococci counts at four popular contact recreation sites in the Lower Taieri catchment over 1 November 2001 to 31 March 2002 inclusive 57
Table 5.1 Median physico-chemical and microbiological water quality data for the lower Taieri River catchment monitoring sites over October 2001 to September 2002 inclusive with % increase (+) or % decrease (-) compared with the median value for Outram 63
Table 5.2 Selected physico-chemical and microbiological water quality data for Otago Regional Council Taieri River SOE monitoring sites, December 2000-December 2002* 63
Table 5.3 Species richness, macroinvertebrate community index (MCI) and semi-quantitative macroinvertebrate community index (SQMCI) values for single macroinvertebrate samples collected from riffle flow habitats in the Taieri River in March 2002 64
Table 5.4 Seasonal Kendall test results for selected water quality analytes monitored in the Taieri River at Outram Glen between August 1994 and August 2003 inclusive 65
Table 5.5 Seasonal Kendall test results for selected water quality analytes monitored in the Taieri River at Allanton between August 1994 and August 2003 inclusive 66
Table 5.6 A comparison of Taieri River water quality at Allanton, pre and post removal of the Mosgiel sewage discharge in July 2000 67

Report on the Surface Water Quality of the Lower Taieri River Catchment
xiii
Table 5.7 Selected summary water quality data for the A1 Drain, October 2001-May 2002 inclusive* 75
Table 5.8 Results of one-off water quality sampling in the #28 Drain, 8 March 2002 77
Table 5.9 Results of one-off water quality sampling in Kirks Drain, 8 March 2002 80


Report on the Surface Water Quality of the Lower Taieri River Catchment 1
____________________________________________________________________________________________________________
1 Introduction
In October 2001 the Otago Regional Council began an intensive 12-month surface water quality monitoring programme in the lower Taieri River catchment. The programme forms part of the Lower Taieri Catchment Programme which was launched in response to concerns from Council, interest groups and the local community that water quality in the lower Taieri River catchment was being adversely affected by poor land management practices on the intensively farmed Taieri Plain. Monthly physico-chemical and microbiological water quality samples were taken at 30 sites on the Lower Taieri Plain with a further four recreational sites also tested for selected microbiological indicators over the 2001-2002 summer. Six of the 30 monitoring sites were located on the lower Taieri River between Outram and Henley Ferry, the others on key tributaries and agricultural drains. The monitoring programme did not include Lakes Waihola and Waipori, as a separate trophic state monitoring programme for these lakes was initiated in October 2002. This report presents the results and findings of the 12-month Lower Taieri monitoring programme, including routine state of the environmental biological monitoring in the lower Taieri River catchment. Information is also drawn from the Otago Regional Council’s long-term state of the environment (SOE) water quality monitoring sites, principally those located on the Taieri River at Outram Glen (Figure 1.1), Allanton and Henley Ferry Bridge. Routine SOE monitoring has been conducted at two-monthly intervals since the early 1990s at these sites and the results were first reported in the Taieri River Catchment Report 1999. It is the results of SOE monitoring that usually trigger more targeted monitoring in the form of catchment programmes such as the Lower Taieri Catchment Programme.
Figure 1.1 The Taieri River at the Outram Glen picnic area

Report on the Surface Water Quality of the Lower Taieri River Catchment
________________________________________________________________________
2
1.1 Aims and Objectives
The principal aim of the monitoring programme was to assess water quality in the lower Taieri River catchment. Specific objectives included: • To determine the state (health) of water quality in the lower Taieri River catchment
through comparison of water quality data against the Australia and New Zealand Conservation Council Water Quality Guidelines (2000).
• To examine spatial and temporal trends in water quality in the lower Taieri River catchment.
• To identify sites of poor water quality and attempt to identify the causes of water quality problems.

Report on the Surface Water Quality of the Lower Taieri River Catchment 3
____________________________________________________________________________________________________________
2 Background Information
2.1 Catchment Description
The Taieri River originates in the rolling tussock tops of the Lammermoor and Lammerlaw Ranges in Central Otago at an altitude of almost 1,200 m. The river is a dominant feature of the semi-arid Styx and Maniototo Basins through which it meanders before turning south to flow through the townships of Middlemarch and Outram and out to the sea, approximately 30 km southwest of Dunedin and for a distance of approximately 318 km. The most densely populated area within the Taieri River catchment is on the lower Taieri Plain (occupying an area of 180 km²), where the township of Mosgiel is located. This floodplain area is intensively farmed (predominantly dairying) (Figure 2.1). Surface water flows are mostly drained by artificial drains which dissect most of the agricultural land. Up until July 2000, treated sewage from Mosgiel township was discharged into the Taieri River upstream of Allanton. Treated sewage from Mosgiel is now pumped to the Green Island Wastewater Treatment Plant and discharged to the ocean via an offshore outfall near Waldronville. The East Taieri drainage scheme involves capturing streams and creeks rising in the hill catchments and channeling them, under gravity, mainly to the Silverstream. The West Taieri drainage scheme involves an entirely artificial drainage system whereby four principal drain systems transfer water into the Taieri Main Drain from an area of approximately 7,500 hectares. The Main Drain terminates at the Waipori Pumping Station from where water is pumped into Lake Waipori. The lower Taieri River plain is crossed by three main watercourses; the Taieri River, Silverstream and Waipori River. The Silverstream joins the Taieri River downstream of Outram near Murray Road and the Waipori joins the Taieri River at Henley Ferry. A number of streams and cut-off drainage channels are contained entirely within the lower Taieri River catchment such as Mill Stream, Owhiro Stream, Lee Creek, Contour Channel and Meggatburn. The tidal influence in the lower Taieri River varies with river flow but extends a considerable distance upstream, resulting in a significant back-flow of Taieri River water up the Waipori River, and into Lakes Waihola and Waipori. The lower Taieri tidal reaches provide regionally significant whitebait, sea-run trout and salmon fisheries (Otago Regional Council 1999). The lower Taieri River provides high quality habitats for both native and salmonid fisheries (Otago Regional Council 1999). The associated Lake Waipori/Waihola wetland provides some of the most important habitat for native fish, wetland vegetation and waterbirds within the region (Otago Regional Council 2000a). The Silverstream provides high quality trout spawning and nursery habitats and the Waipori River, despite modification by hydro-electric power schemes, supports important native fish communities in its upper catchment reaches (Otago Regional Council 1999).

Report on the Surface Water Quality of the Lower Taieri River Catchment
________________________________________________________________________
4
(Source: AgResearch 2001)
Figure 2.1 Different farm types of the lower Taieri Plain 2.2 Water Quality Monitoring
Routine physico-chemical and microbiological water quality monitoring in the lower Taieri River catchment has been conducted by the Otago Regional Council since the early 1990s. Water samples are typically collected at two-monthly intervals and tested for a variety of parameters, including dissolved oxygen, temperature, pH, conductivity, visual clarity, turbidity, suspended solids, nutrients and indicator bacteria. Current State of the Environment (SOE) river monitoring sites include (Figure 2.2): • Taieri River at Outram Glen • Taieri River at Allanton • Taieri River at Henley Ferry • Waipori River below its confluence with the Contour Channel • Contour Channel at the No. 4 Bridge • Taieri Main Drain at the Waipori Pumping Station • Owhiro Stream at Mosgiel1 • Silverstream at Riccarton Road2
1 Recently adopted (late 2002)
Study boundary Taieri River
Study boundary

Report on the Surface Water Quality of the Lower Taieri River Catchment 5
____________________________________________________________________________________________________________
Otago region
Taieri River catchment
Taieri River below Outram Dunedin
Figure 2.2 Current state of environment surface water quality monitoring sites on the Lower Taieri Plain
2 Recently reinstated (mid 2003)

Report on the Surface Water Quality of the Lower Taieri River Catchment
________________________________________________________________________
6
2.2 Biological Monitoring
Biological monitoring in the lower Taieri River catchment began in 1996. Monitoring incorporates analysis of the riverbed periphyton and macroinvertebrate communities and is undertaken annually during low or stable summer flows. Various sites have been monitored in the lower Taieri River catchment since 1996. Current SOE biological monitoring sites include: • Taieri River at Outram Glen • Taieri River at Allanton • Waipori River inside Waipori Scenic Reserve • Silverstream above Three-Mile Hill Road • Silverstream at Riccarton Road • Owhiro Stream at Mosgiel

Report on the Surface Water Quality of the Lower Taieri River Catchment 7
____________________________________________________________________________________________________________
3 Study Area and Methods
3.1 Monitoring Sites 3.1.1 Water Quality Monitoring Sites
Physico-chemical and microbiological water quality monitoring was conducted at 30 sites on the following rivers, streams and drains in the lower Taieri River catchment over October 2001 to September 2002 inclusive (Figure 3.1 and Appendix 1): • Taieri River at Outram (SH87), below Lindsay Road, Murray Road, Allanton, below
SH1 and Henley Ferry Bridge • Silverstream at Three-Mile Hill Road, Gordon Road and Riverside Road • Mill Stream at Milners Road and McKays Triangle • Lee Creek at Woodside Glen • Contour Channel at Grainger Road and the No. 4 Bridge • Owhiro Stream at Wingatui Road†3, Burns Street and below Riverside Road • Waipori River at Waipori Scenic Reserve and above Henley Berwick Road Bridge • Meggatburn at Berwick Road • Unnamed tributary of Lake Waihola at Clarendon Road • A1 Drain at McKays Triangle and Taieri River confluence • O13 Drain at Murray Road • Taieri Main Drain at Miller Road, Marshall Road and Waipori Pumping Station • Kirks Drain at Marshall Road • Lee Canal at Miller Road and Marshall Road
3 Added to the monitoring programme in February 2002

Report on the Surface Water Quality of the Lower Taieri River Catchment
________________________________________________________________________
8
Figure 3.1 Physico-chemical and microbiological water quality monitoring sites sampled during October 2001 to September 2002

Report on the Surface Water Quality of the Lower Taieri River Catchment 9
____________________________________________________________________________________________________________
Lower Taieri River Six monitoring sites were located on the lower Taieri River below Outram. The uppermost site was located at the Outram Glen bathing area (SH87) and is also included in the Otago Regional Council’s state of the environment (SOE) water quality and biological monitoring programmes. Sites were also included at Lindsay Road and Murray Road, above and below the Taieri River confluence with the A1 Drain and Silver Stream. A fourth site was located at Allanton below the Taieri River confluence with Owhiro Stream. This site is both a SOE water quality and biological monitoring site. A fifth (tidal) site was located between Allanton and State Highway 1 Bridge, downstream of a land drain discharge entering the river on the true left bank. The sixth (tidal) monitoring site was the Otago Regional Council’s SOE water quality monitoring site immediately downstream of the Henley Ferry Bridge (Figure 3.2).
Figure 3.2 Taieri River below the Henley Ferry Bridge, looking downstream Mill Stream
Mill Stream originates above Milners Road on the North Taieri where it is fed by small creeks from the Waironga and Tirohanga hill catchments. The stream is channelised once it reaches the alluvial Taieri Plain and serves primarily as a drainage channel. Under normal flow conditions Mill Stream discharges into the Taieri River, but a diversion channel exists upstream of Gordon Road in Mosgiel, allowing water to flow directly into the Silverstream.

Report on the Surface Water Quality of the Lower Taieri River Catchment
________________________________________________________________________
10
Monitoring sites were located in the upper reaches at Milner Road and in the lower reaches at McKays Triangle above the confluence with the A1 Drain (Figure 3.3).
Figure 3.3 Mill Stream at McKays Triangle Silverstream The Silverstream drains a mainly forested catchment (exotic and indigenous) and is 94 km2 in area. Monitoring sites were located at Three Mile Hill Road where agricultural activity and residential development are sparse, at Gordon Road in Mosgiel downstream of several urban and industrial stormwater outfalls and the Mill Creek Diversion outflow (Figure 3.4), and in the lower reaches at Riverside Road where sheep and dairy farming predominate. The latter site can occasionally receive back-flow from the Taieri River. The Dunedin City Council takes water from the Silverstream above Three Mile Hill for communal supply. This contributes to low flows in the Silverstream during the summer.

Report on the Surface Water Quality of the Lower Taieri River Catchment 11
____________________________________________________________________________________________________________
Figure 3.4 Silverstream at Gordon Road, looking downstream
Owhiro Stream Owhiro Stream drains the Chain Hills, Saddle Hill, Scroggs Hill south-east flank of the lower Taieri Plain. It arises behind Wingatui and flows through the eastern edge of Mosgiel township, and down through agricultural land (primarily horse, sheep and dairy farming) before discharging to the Taieri River immediately upstream of Allanton. The stream has been modified as a result of past drainage and channelisation activities yet electric fish surveys undertaken in 2002 and 2003 by Fish and Game Otago staff on behalf of the Taieri Trust have identified a range of fish in the lower reaches of the stream including trout, perch, eels and bullies. A giant kokopu (Galaxias argenteus) was also found between Riccarton Road and Gladfield Road in 2003 (G. Robertson, Taieri Trust, pers. comm. 2003).

Report on the Surface Water Quality of the Lower Taieri River Catchment
________________________________________________________________________
12
Two sites were monitored, one in the middle reaches at Burns Street in Mosgiel (Figure 3.5) and the other in the lower reaches below Riverside Road and the confluence of the O13 Drain. An additional site at the Wingatui Road bridge (in the upper reaches) was added as a third site for a short period from February 2002.
Figure 3.5 Owhiro Stream at Burns Street, Mosgiel, looking downstream

Report on the Surface Water Quality of the Lower Taieri River Catchment 13
____________________________________________________________________________________________________________
Lee Creek and the Contour Channel Lee Creek rises as a number of small creeks in the north of the Maungatua Range to combine to a single channel at Woodside Glen. The creek is diverted into the head of the Contour Channel at the junction of Huntly and McDonald Roads near Outram. It supports a diverse fish community including several galaxiid species, two species of eel, brown trout, perch and common and upland bullies (pers. comm. Department of Conservation 2003). The Contour Channel is an artificial watercourse built by the Western Taieri Land Drainage Board between 1910 and 1920 (Otago Regional Council 2000a). It runs along the foot of the Maungatua Range, collecting runoff from the hill catchment to discharge to the Waipori River at Henley Berwick Road above Lake Waipori. During wet winter conditions when Lee Canal Drain water levels are too high to allow gravity drainage, runoff can be pumped into the Contour Channel at the Lake Ascot Pumping Station. Lee Creek was monitored at Woodside Glen Recreation Reserve where it drains a largely bush catchment (Figure 3.6) and the Contour Channel was monitored at Grainger Road (Figure 3.6) and in the lower reaches above the Waipori River tidal influence at the No. 4 Bridge.
Figure 3.6 Lee Creek at Woodside Glen (left) and the Contour Channel at
Grainger Road

Report on the Surface Water Quality of the Lower Taieri River Catchment
________________________________________________________________________
14
Lower Waipori River The Waipori River originates as the outflow of Lake Mahinerangi and flows through a gorge deeply incised into schist bedrock, and completely surrounded by native bush. River flows are highly variable as a result of hydro-electric power generation within the Waipori Gorge. When the river emerges from the gorge it opens into a pastoral setting and meanders 7 km to its confluence with the Contour Channel at Henley Berwick Road. One kilometre further downstream the river flows into Lake Waipori. Monitoring sites were located in the lower reaches of the Waipori River inside the Waipori Scenic Reserve entrance where agricultural activity is largely absent and above the confluence with the Contour Channel at Henley Berwick Road (Figure 3.7). The Otago Regional Council’s long-term SOE water quality monitoring site is located below the Contour Channel confluence. White-baiting and other fishing is popular in this stretch of the Waipori River.
Figure 3.7 Waipori River at Henley Berwick Road, looking downstream Meggatburn The Meggatburn is a tributary of Lake Waipori and drains a 36 km2 catchment that is comprised of predominantly exotic forest plantations. Trout and banded kokopu (Galaxias fasciatus) are common in the upstream reaches.

Report on the Surface Water Quality of the Lower Taieri River Catchment 15
____________________________________________________________________________________________________________
A monitoring site was located below the forested catchment at Berwick Road (Figure 3.8). Below Berwick Road the predominant land use is agricultural (sheep and beef farming).
Figure 3.8 Meggatburn at Berwick Road

Report on the Surface Water Quality of the Lower Taieri River Catchment
________________________________________________________________________
16
Unnamed Tributary of Lake Waihola Several streams enter the southern end of Lake Waihola and one unnamed stream was monitored at Clarendon Road (Figure 3.9). The stream drains the western hill margins above the lake. Wildfowl were regularly seen at the monitoring site in the lower reaches. Giant kokopu (Galaxias argenteus) are common further upstream (David et al. 2000).
Figure 3.9 Unnamed Stream at Clarendon Road, looking downstream A1 Drain The A1 Drain is an Otago Regional Council maintained drain on the East Taieri. It drains predominantly dairying land between SH87 and the lower Mill Stream and discharges under gravity via flood gates to the Taieri River below Riverside Road. When the river is high and there is a build up of water in the drain following heavy rainfall, water can be pumped into the Silverstream at the Silverstream Pump Station. Sampling sites were located at the outflow of McKays Triangle and immediately upstream of the A1 Drain’s confluence with the Taieri River (Figure 3.10).

Report on the Surface Water Quality of the Lower Taieri River Catchment 17
____________________________________________________________________________________________________________
Figure 3.10 A1 Drain from the Taieri River flood gates
O13 Drain The O13 Drain is also an Otago Regional Council maintained drain. It drains a portion of the East Taieri in the Riverside Road area. Drainage water can either flow under gravity into Owhiro Stream below Riverside Road, or it can be pumped into the Taieri River at Murray Road. The monitoring site was originally located at Murray Road but due to lack of flow was shifted upstream to Riverside Road (Figure 3.11).
Figure 3.11 O13 Drain looking downstream from Riverside Road

Report on the Surface Water Quality of the Lower Taieri River Catchment
________________________________________________________________________
18
Taieri Main Drain (Main Drain) The Main Drain collects water from the western Taieri Plain, including the Kirks Drain and Lee Canal Drain catchments. The Otago Regional Council operates and maintains the drainage system, which terminates at the Waipori Pumping Station from where the drainage water is pumped into Lake Waipori. The pumping station has been in operation since 1931, and has allowed the low lying western area of the Lower Taieri Plain to be developed (Otago Regional Council 1999). Three monitoring sites were located on the Main Drain. The uppermost site was located at Miller Road above the treated sewage effluent discharge from Dunedin International Airport. A second site was located at Marshall Road immediately above the confluence of Kirks Drain and Lee Canal Drain. The third site was located at the Waipori Pumping Station and has been part of the Otago Regional Council’s SOE surface water quality monitoring programme since 1994 (Figure 3.12).
Figure 3.12 Taieri Main Drain at the Waipori Pumping Station Kirks Drain Kirks Drain collects water from part of the western Taieri Plain. It runs from Miller Road to Marshall Road where it meets the Main Drain. A single monitoring site was located at Marshall Road above the confluence with the Main Drain (Figure 3.13).

Report on the Surface Water Quality of the Lower Taieri River Catchment 19
____________________________________________________________________________________________________________
Figure 3.13 Kirks Drain at Marshall Road
Lee Canal Drain Like Kirks Drain, Lee Canal Drain (Lee Canal) services part of the western Taieri Plain and runs from Church Road near Outram to its confluence with the Main Drain below Marshall Road. Monitoring sites were located at Miller Road and at Marshall Road above the confluence with the Main Drain (Figure 3.14).

Report on the Surface Water Quality of the Lower Taieri River Catchment
________________________________________________________________________
20
Figure 3.14 Lee Canal Drain at Marshall Road
3.1.2 Biological Monitoring Sites Biological monitoring was conducted in riffle habitat on the following waterways in the lower Taieri River catchment: • Taieri River at Outram (SH87) and Allanton • Silverstream at Three-Mile Hill Road and Riverside Road • Owhiro Stream at Burns Street 3.1.3 Recreational Sites Microbiological water quality was monitored at four popular contact recreation sites over the 2001-2002 bathing season: • Taieri River at Outram Glen and Taieri Mouth • Lake Waihola at the jetty Figure 3.15) and children’s waterslide

Report on the Surface Water Quality of the Lower Taieri River Catchment 21
____________________________________________________________________________________________________________
Figure 3.15 Boat jetty at Lake Waihola 3.2 Sampling Frequency
Physico-chemical and microbiological water quality monitoring sites were sampled at monthly intervals between October 2001 to May 2002 inclusive. Following the May 2002 sampling round, the total number of monitoring sites was reduced from 30 to 16. Periphyton and macroinvertebrate samples were collected on one occasion from the Taieri River at Outram Glen and Allanton in March 2002 as part of routine SOE biological monitoring in the lower Taieri River catchment. Rainfall precluded sampling the scheduled monitoring sites in the Silverstream, which were subsequently sampled in March 2003 along with the Owhiro Stream at Burns Street. Contact recreation sites were sampled at a minimum of fortnightly intervals between 1 November 2001 and 31 March 2002. 3.3 Sampling Methods
Spot sampling was conducted at all water quality monitoring sites. Sampling at tidal sites was timed to coincide with a low or outgoing tide at Henley Ferry. Water samples were stored on ice upon collection and transported to the Otago Regional Council’s contracted

Report on the Surface Water Quality of the Lower Taieri River Catchment
________________________________________________________________________
22
laboratories for analysis within 24 hours of collection. Field measurements (dissolved oxygen, temperature and conductivity) were taken using approved water quality meters. Periphyton sampling was conducted by pooling the scrapings from three randomly selected cobbles of approximately 5 cm2 in area. Samples were identified and the relative abundance of each different taxa assessed using methodology developed by Biggs and Kilroy (2000). Macroinvertebrate samples were collected and processed in accordance with Protocols C1 and P1 of the Ministry for the Environment’s Protocol for Sampling Macroinvertebrates in Wadeable Streams (Stark et al. 2001). This involved kick-net sampling 0.6-1.0 m2 of substrate from a riffle habitat at each monitoring site. Recreational water quality sites were sampled in accordance with the protocol outlined in the Ministry for the Environment/Ministry of Health Microbiological Water Quality Guidelines for Marine and Freshwater Recreational Areas (2003). 3.4 Monitoring Analytes
Water samples were tested for a range of physico-chemical and microbiological parameters. These included dissolved oxygen, temperature, conductivity, pH, turbidity, Escherichia coli (E. coli), 5-day biochemical oxygen demand (BOD), ammoniacal nitrogen, nitrite-nitrate nitrogen, total nitrogen, dissolved reactive phosphorus and total phosphorus. Visual clarity (horizontal black disc), suspended solids and faecal coliforms analyses were also undertaken on the samples from the SOE monitoring sites on every second sampling occasion. Periphyton and macroinvertebrate samples were enumerated for measures of species richness and relative abundance. Water samples collected from the recreational sites were tested for E. coli, (freshwater sites) and enterococci (saline sites). 3.5 Data Analysis
Summary statistics were tabulated for all water quality data with non-detect values taken as being half the detection limit (e.g., a result reported as <0.1 mg/L is taken as 0.05 mg/L). The complete set of water quality results is presented in Appendix 2.

Report on the Surface Water Quality of the Lower Taieri River Catchment 23
____________________________________________________________________________________________________________
4 Results
This section presents the results of the 12-month physico-chemical and microbiological water quality monitoring programme conducted in the lower Taieri River catchment. Biological and recreational monitoring results are also summarised in this section. Table 4.1 summarises water quality in the Taieri and Waipori Rivers and natural tributary streams. Although technically an artificial watercourse, the Contour Channel has been included in Table 4.1 as it is fed by a natural watercourse (Lee Creek). Water quality in the drainage system of the Lower Taieri Plain is summarised separately in Table 4.2. Table 4.1 compares minimum, median and maximum results of key water quality analytes against the Australian and New Zealand Guidelines for Fresh and Marine Water Quality (ANZECC 2000). The guidelines set default trigger values for slightly modified lowland4 aquatic ecosystems in New Zealand. An exceedance of the trigger value is an ‘early warning’ mechanism to alert attention to resource managers of a potential problem or emerging change that should be followed up. Therefore an exceedance does not necessarily mean an adverse environmental effect would result, but that the exceedance should “trigger” further investigation (ANZECC 2000). The ANZECC 2000 Guidelines emphasise that the best reference conditions are set by locally appropriate data. The guidelines therefore recommend deriving site-specific trigger values for different catchments where possible using water quality data from an appropriate reference site. The guidelines recommend that a minimum of two years of water quality results from continuous monthly sampling (24 samples) be used to develop site specific guidelines. A trigger for further action is deemed to have occurred when the median concentration of n independent samples taken at a test site exceeds the 80th percentile of the same indicator at a suitably chosen reference site (ANZECC 2000). The Taieri River at Outram provides a suitable reference site for the lower Taieri River catchment as there are more than eight years of routine SOE monitoring data available from which to assess water quality. Outram has only been sampled at two-monthly intervals under the SOE monitoring programme, therefore it was necessary to draw on data gathered over a greater time period than two years in order to obtain a sufficient number of samples to derive trigger values. Note that data collected during the catchment monitoring programme was excluded to avoid bias as a result of the increased sampling frequency over this period. For simplicity and also to enable the Outram monitoring site data to be assessed against water quality guidelines, only exceedances of the default trigger values are highlighted in Table 4.1. The ANZECC 2000 guidelines are not included in Table 4.2 as it is not appropriate to apply the trigger values for freshwater aquatic ecosystems to an artificially constructed agricultural drainage system.
4 Where lowland rivers are defined as those at <150 m altitude.

Report on the Surface Water Quality of the Lower Taieri River Catchment
___________________________________________________________________________________________________________________________________________________________________________________
24
Table 4.1Summary water quality data for rivers and streams in the lower Taieri River catchment, October 2001 to May 2002 inclusive, with exceedances of the ANZECC 2000 default trigger values shown in bold type. Data for sites sampled through until September 2002 (n=12) are provided in brackets
ANZECC 2000 Trigger Values
Temperature (°C)
Dissolved Oxygen
(mg/L)
pH Turbidity (NTU)
Conductivity (mS/cm)
E. coli (MPN/100 ml)
BOD5 (mg/L)
Nitrite-Nitrate Nitrogen (mg/L)
Ammoniacal Nitrogen (mg/L)
Total Nitrogen (mg/L)
Dissolved Reactive Phosphorus
(mg/L)
Total Phosphorus
(mg/L)
Default Trigger Value† No guideline No guideline 7.2-7.8 <5.6 No guideline No guideline <0.444 <0.021 <0.614 <0.010 <0.033
Site-Specific Trigger Value††
N/A (seasonally dependant)
>10.2 7.4-7.8 <5.2 <0.091
<260 for bathing‡
<1 <0.070 <0.020 <0.398 <0.012 <0.043
Median Range Median Range Median Range Median Range Median Range Median Range Median Range Median Range Median Range Median Range Median Range Median Range
Mill Stream Milners Rd 10.8 3.9-14.7 10.3 8.0-14.0 6.6 6.3-7.2 7.0 2.8-9.3 0.14 0.12-0.18 499 48-670 0.5 - 0.023 0.008-0.222 0.005 0.005-0.07 0.150 0.04-0.45 0.003 - 0.010 0.003-0.027 Silverstream Three-Mile Hill 13.3 3.7-18.3 10.7 4.9-13.0 7.0 6.1-7.4 1.1 0.5-2.0 0.16 0.13-0.19 75 16-600 0.5 - 0.036 0.007-0.093 0.005 0.005-0.03 0.140 0.11-0.18 0.003 - 0.009 0.003-0.020 Gordon Rd 11.9 3.4-15.2 10.9 9.6-12.9 6.6 6.1-7.7 1.1 0.5-4.2 0.15 0.13-0.17 200 170-310 0.5 0.5-2 0.189 0.089-0.382 0.005 0.005-0.04 0.370 0.16-0.53 0.003 0.003-0.089 0.010 0.003-0.123 Riverside Rd
13.8 (11.7)
3.7-19.8 (3.7-19.8)
11.7 (12.3)
8.8-13.1 (8.8-13.3)
7.3 (7.6)
6.4-8.1 (6.4-8.6)
0.8 (1.2)
0.4-4.1 (0.4-8.5)
0.15 (0.15)
0.12-0.17 (0.12-0.17)
107 (145)
21-310 (2-340)
0.5 (0.5)
- (0.5-1)
0.060 (0.105)
0.017-0.125(0.017-0.360)
0.005 (0.005)
0.005-0.02 (0.005-0.08)
0.195 (0.240)
0.12-0.41 (0.12-0.57)
0.003 (0.003)
0.003-0.011 (0.003-0.011)
0.012 (0.013)
0.003-0.026 (0.003-0.026)
Owhiro Stream Wingatui Rd‡‡ 9.4 4.7-13.3 6.8 5.6-9.8 7.0 5.9-7.5 4.0 2.7-23.1 0.26 0.18-0.34 895 420-2,200 0.8 0.5-3 0.015 0.005-1.02 0.005 0.005-0.14 0.465 0.42-1.94 0.010 0.003-0.031 0.045 0.029-0.114 Burns St
12.7 (11.3)
4.1-17.9 (4.1-19.8)
8.9 (9.5)
5.5-12.9 (5.5-13.9)
6.6 (7.0)
6.0-7.4 (6.0-9.0)
9.6 (9.6)
1.0-27.9 (1.0-40.0)
0.20 (0.22)
0.14-0.32 (0.14-0.36)
930 (930)
39-5,700 (12-5,700)
2 (2)
1-3 (1-3)
0.103 (0.159)
0.014-1.29 (0.014-1.36)
0.045 (0.045)
0.005-0.14 (0.005-0.15)
1.04 (1.09)
0.64-2.12 (0.64-2.42)
0.008 (0.009)
0.003-0.034 (0.003-0.034)
0.108 (0.094)
0.059-0.206 (0.040-0.206)
D/s Riverside Rd
13.7 (11.5)
3.6-18.2 (3.6-18.2)
7.5 (8.7)
4.8-9.6 (4.8-2.4)
6.6 (6.9)
6.1-7.7 (6.1-7.7)
10.0 (10.4)
6.5-25.3 (6.5-31.3)
0.27 (0.27)
0.20-0.31 (0.20-0.42)
580 (580)
110-7,700(32-7700)
1.5 (1.5)
0.5-4 (0.5-4)
0.126 (0.139)
0.015-1.25 (0.015-1.25)
0.045 (0.045)
0.020-0.18 (0.005-0.18)
0.655 (0.750)
0.32-2.24 (0.32-2.24)
0.007 (0.007)
0.003-0.019 (0.003-0.023)
0.087 (0.087)
0.055-0.131 (0.036-0.180)
Taieri River Outram Glen
15.2 (13.0)
2.8-18.4 (2.8-18.4)
11.4 (11.6)
9.1-12.5 (9.1-13.3)
7.0 (7.1)
6.8-8.2 (6.8-8.2)
1.9 (3.2)
0.9-15.3 (0.9-25.9)
0.07 (0.07)
0.05-0.08 (0.05-0.08)
135 (96)
16-240 (8-240)
0.5 (0.5)
- -
0.023 (0.033)
0.002-0.187(0.002-0.187)
0.005 (0.005)
0.005-0.01 (0.005-0.02)
0.275 (0.280)
0.18-0.49 (0.18-0.56)
0.003 (0.003)
0.003-0.016 (0.003-0.016)
0.028 (0.027)
0.017-0.046 (0.017-0.093)
Lindsay Rd 14.5 2.6-18.2 9.6 7.7-12.2 6.8 6.4-7.5 2.9 1.5-6.8 0.07 0.05-0.08 105 30-500 0.5 - 0.034 0.002-0.235 0.005 0.005-0.03 0.310 0.19-0.55 0.004 0.003-0.010 0.029 0.012-0.105 Murray Rd
14.2 (11.3)
2.6-17.6 (2.6-17.6)
9.3 (9.6)
7.4-11.9 (7.4-11.9)
6.7 (7.0)
6.2-7.4 (6.2-7.4)
3.0 (4.4)
1.1-7.8 (1.1-10.0)
0.07 (0.07)
0.05-0.09 (0.05-0.09)
115 (72)
58-380 (17-380)
0.5 (0.5)
- -
0.036 (0.051)
0.008-0.248(0.008-0.248)
0.015 (0.015)
0.005-0.03 (0.005-0.03)
0.260 (0.330)
0.14-0.45 (0.14-0.52)
0.004 (0.004)
0.003-0.013 (0.003-0.016)
0.030 (0.028)
0.014-0.045 (0.014-0.045)
Allanton
14.7 (11.1)
2.6-17.5 (2.6-17.6)
9.9 (10.2)
8.9-12.0 (8.3-12.4)
6.7 (7.0)
6.0-7.5 (6.0-7.5)
2.1 (3.5)
1.3-7.3 (1.3-9.6)
0.08 (0.08)
0.05-0.09 (0.05-0.10)
155 (155)
97-580 (51-580)
0.5 (0.5)
- -
0.037 (0.048)
0.002-0.318(0.002-0.318)
0.013 (0.020)
0.005-0.04 (0.005-0.04)
0.295 (0.305)
0.20-0.63 (0.2-0.63)
0.004 (0.003)
0.003-0.010 (0.003-0.011)
0.033 (0.027)
0.014-0.042 (0.006-0.042)
State Highway 1
14.8 (11.3)
2.6-17.6 (2.6-17.6)
8.3 (9.6)
6.7-12.1 (6.7-12.3)
6.6 (7.0)
6.4-7.4 (6.4-7.4)
2.2 (2.8)
1.2-56.5 (1.2-56.5)
0.08 (0.07)
0.05-0.09 (0.05-0.09)
130 (110)
64-440 (43-440)
0.5 (0.5)
0.5-1 (0.5-1)
0.021 (0.041)
0.011-0.292(0.011-0.292)
0.025 (0.020)
0.005-0.09 (0.005-0.09)
0.265 (0.315)
0.21-0.65 (0.21-0.65)
0.006 (0.006)
0.003-0.019 (0.003-0.019)
0.021 (0.019)
0.013-0.044 (0.003-0.044)
Henley-Ferry
15.5 (12.2)
3.6-18.4 (3.6-18.4)
8.9 (10.0)
6.8-11.4 (6.8-12.3)
6.6 (6.8)
6.2-7.8 (5.9-7.8)
6.5 (6.4)
3.6-19.2 (3.6-19.2)
1.06 (0.41)
0.27-7.55 (0.13-7.55)
72 (71)
8-720 (8-720)
0.5 (0.5)
0.5-1 (0.5-1)
0.024 (0.034)
0.005-0.175(0.005-0.175)
0.008 (0.015)
0.005-0.08 (0.005-0.08)
0.280 (0.395)
0.23-0.57 (0.23-0.58)
0.006 (0.004)
0.003-0.014 (0.003-0.014)
0.023 (0.023)
0.003-0.070 (0.003-0.070)
Lee Creek/Contour Channel Woodside Glen 10.5 3.1-14.1 10.7 9.5-12.5 7.2 6.7-7.5 0.5 0.3-4.8 0.06 0.06-0.07 22 4-260 0.5 0.5-2 0.020 0.007-0.155 0.008 0.005-0.04 0.135 0.09-0.36 0.006 0.003-0.015 0.014 0.003-0.043 Grainger Rd 13.7 3.5-16.9 11.0 9.7-14.3 7.3 6.6-7.9 1.9 0.9-56.5 0.09 0.08-0.13 715 73-5,200 0.5 0.5-3 0.074 0.002-1.13 0.030 0.005-0.33 0.295 0.19-2.85 0.012 0.006-0.227 0.044 0.027-0.505 No. 4 Bridge
13.6 (11.8)
3.0-17.3 (3.0-17.3)
9.6 (10.0)
7.8-12.5 (7.8-12.5)
6.8 (6.8)
6.1-8.0 (6.1-8.0)
2.5 (2.5)
1.5-32.7 (1.5-32.7)
0.10 (0.10)
0.08-0.26 (0.08-0.26)
310 (205)
4-4,100 (2-4,100)
0.5 (0.5)
0.5-3 (0.5-3)
0.061 (0.21)
0.015-1.53 (0.015-1.53)
0.025 (0.035)
0.005-0.53 (0.005-0.53)
0.380 (0.555)
0.26-3.38 (0.26-3.38)
0.022 (0.017)
0.011-0.056 (0.005-0.056)
0.061 (0.051)
0.036-0.412 (0.017-0.412)
Waipori River Scenic Reserve 13.4 7.4-16.3 9.5 7.4-11.7 6.7 6.3-7.1 2.3 1.0-5.0 0.04 0.03-0.07 19 10-93 0.5 0.5-1 0.059 0.029-0.091 0.015 0.005-0.08 0.295 0.19-0.72 0.003 0.003-0.005 0.014 0.003-0.103 Henley Ber. Rd. Br 13.6
(11.3) 4.6-17.9
(4.6-17.9) 8.5
(9.7) 6.5-10.2
(6.5-11.6) 6.7
(6.8) 6.5-7.4
(6.5-7.4) 1.6
(2.5) 1.1-36.0
(0.8-36.0) 0.05
(0.04) 0.03-0.08
(0.03-0.08)98
(56) 44-170 (5-170)
0.5 (0.5)
0.5-1 (0.5-1)
0.046 (0.06)
0.017-0.238(0.017-0.238)
0.020 (0.020)
0.005-0.11 (0.005-0.12)
0.220 (0.270)
0.15-0.81 (0.15-0.81)
0.003 (0.003)
0.003-0.013 (0.003-0.013)
0.020 (0.018)
0.007-0.080 (0.007-0.080)
Meggatburn Berwick Rd 11.8 3.4-14.1 9.9 7.5-12.5 6.9 6.9-7.4 3.8 1.1-28.1 0.07 0.07-0.10 120 54-6,900 0.5 - 0.15 0.071-0.957 0.020 0.005-0.08 0.275 0.18-1.29 0.003 0.003-0.041 0.016 0.008-0.080 Unnamed Stream Clarendon Rd 13.2 3.3-17.4 5.2 3.6-11.3 6.5 6.4-7.3 4.6 3.0-18.5 0.18 0.16-0.23 300 30-3,700 1.0 0.5-3 0.073 0.021-2.29 0.055 0.005-0.31 0.700 0.36-3.81 0.015 0.006-0.193 0.077 0.033-0.413

Report on the Surface Water Quality of the Lower Taieri River Catchment
_____________________________________________________________________________________________________________________________________________________________________________________________________________________________________________________________________________
25
† Default trigger values for physical and chemical stressors in “slightly modified” lowland ecosystems in New Zealand, Tables 3.3.10-3.3.11 †† Site specific default trigger values (ANZECC 2000) using 80th percentile SOE water quality data for the Taieri River at Outram Glen (Aug 1997-Aug 2001, n=21-24) ‡ Ministry of Environment (MfE)/Ministry of Health (MoH) Microbiological Water Quality Guidelines for Freshwater Recreational Areas (2003) ‡‡ Only four sample results exist for this site (February 2001 – May 2002 inclusive)
Table 4.2 Summary water quality data for various Lower Taieri catchment drains, October 2001 to May 2002 inclusive (n=8). Data for sites sampled through until September 2002 (n=12) are provided in brackets Temperature
(°C) Dissolved Oxygen
(mg/L)
pH Turbidity (NTU)
Conductivity (mS/cm)
E. coli (MPN/100 ml)
BOD5 (mg/L)
Nitrite-Nitrate Nitrogen (mg/L)
Ammoniacal Nitrogen (mg/L)
Total Nitrogen (mg/L)
Dissolved Reactive Phosphorus
(mg/L)
Total Phosphorus
(mg/L)
Median Range Median Range Median Range Median Range Median Range Median Range Median Range Median Range Median Range Median Range Median Range Median Range
Mill Stream McKays Triangle 13.3 3.1-17.6 5.2 3.3 -11.8 6.6 6.1-7.0 7.5 1.8-16.0 0.23 0.21-0.26 91 4-710 2 0.5-2 0.034 0.006-0.692 0.025 0.02-0.13 0.63 0.47-1.18 0.003 0.003-0.009 0.061 0.017-0.144
A1 Drain McKays Triangle 14.5 2.8-18.7 5.3 1.8-9.8 6.7 6.0-7.1 5.8 2.6-13.8 0.26 0.24-0.29 57 16-560 1 0.5-2 0.162 0.016-0.905 0.085 0.03-0.88 0.92 0.42 -1.60 0.009 0.003-0.040 0.087 0.014-0.224Taieri River 16.5
(13.5) 2.8-22.6
(2.8-22.6) 7.4
(7.7) 2.8 -10.4 (2.8-10.4)
6.6 (6.8)
6.1-7.5 (6.1-7.5)
14.8 (11.6)
7.9-51.3 (6.6-51.3)
0.25 (0.25)
0.23-0.33 (0.23-0.39)
1,500 (585)
290-46,100(6-46,100)
2 (2.0)
1-4 (0.5-4)
0.129 (0.158)
0.029-0.961 (0.029-1.42)
0.320 (0.200)
0.02-2.08 (0.02-2.08)
1.59 (1.15)
0.69-3.32 (0.39-3.32)
0.006 (0.004)
0.003-0.015 (0.003-0.015)
0.122 (0.095)
0.050-0.249 (0.010-0.249)
O13 Drain Riverside Rd† 15.1 3.4-20.9 6.4 6.0-9.6 6.5 6.1-7.1 24.6 12.4-34.3 0.29 0.15-0.32 360 30 – 2800 1 0.5-2 0.056 0.036-0.626 0.330 0.06-0.75 0.81 0.37 -1.20 0.003 0.003-0.007 0.065 0.010-0.081
Main Drain Miller Rd 15.9
(14.0) 3.5-22.9
(3.5-22.9) 4.9
(5.9) 0.6 -10.9 (0.6-10.9)
7.0 (7.0)
6.1-7.6 (6.1-7.6)
30.9 (31.5)
14.2-309 (14.2-309)
0.71 (0.69)
0.40-1.15 (0.40-1.15)
445 (500)
94-10,300 (94-10,300)
6.5 (6)
4-40 (0.5-40)
0.061 (0.110)
0.012-1.21 (0.012-1.25)
9.29 (4.23)
2.53 –19.7 (0.61-19.7)
12.4 (7.94)
1.30-27.0 (1.30-27.0)
0.546 (0.277)
0.130-2.88 (0.003-2.88)
1.540 (1.245)
0.160-6.00 (0.131-6.00)
Marshall Rd 13.8 (10.8)
2.6-16.1 (2.6-16.1)
0.6 (0.8)
0.4-6.7 (0.4-6.7)
7.3 (7.2)
7.1-7.4 (6.9-7.4)
10.1 (9.5)
3.9-33.6 (3.9-33.6)
1.39 (1.42)
0.89-2.39 (0.89-2.39)
830 (780)
16-17,000 (16-17,000)
5 (5)
4-41 (2-41)
0.181 (0.732)
0.006-1.14 (0.006-2.39)
2.40 (2.05)
1.45 -5.89 (0.51-5.89)
5.29 (5.31)
3.50-8.80 (3.50-8.80)
0.541 (0.48)
0.073-2.49 (0.003-2.45)
1.310 (1.01)
0.620-2.64 (0.085-2.64)
Waipori Pump Stn 15.2 (12.7)
2.7-17.1 (2.7-17.1)
2.0 (3.1)
0.3-7.3 (0.3-7.3)
6.7 (6.8)
6.5-7.6 (6.5-7.6)
4.1 (6.7)
3.0-11.7 (3.0-15.0)
5.33 (4.92)
1.45 - 6.11 (1.45-6.11)
99 (120)
8- 870 (8-870)
2.5 (2.5)
1-7 (0.5-7)
0.343 (0.426)
0.141-1.73 (0.141-2.04)
1.03 (1.27)
0.36-2.44 (0.36-2.44)
2.41 (3.55)
1.41-6.11 (1.41-6.11)
0.004 (0.003)
0.003-0.042 (0.003-0.042)
0.047 (0.059)
0.003-0.450 (0.003-0.450)
Kirks Drain Marshall Rd 14.1
(12.3) 3.7-21.7
(3.7-21.7) 2.8
(3.6) 0.7-7.7
(0.7-7.9) 7.3
(7.2) 6.8-8.0
(6.7-8.0) 43.9
(36.8) 16.7-77.4
(16.7-77.4)1.55
(1.93) 0.89-2.04
(0.89-3.54)360
(360) 10-12,300 (5-24,800)
10 (8)
4-23 (1.0-23)
0.106 (0.158)
0.028-0.623 (0.028-1.53)
12.24 (8.50)
3.03-21.9 (2.15-21.9)
16.6 (12.6)
5.61-37.5 (5.61-37.5)
1.425 (0.72)
0.053-2.45 (0.003-2.45)
2.715 (2.25)
8.8-13.1 (8.8-13.3)
Lee Canal Drain Miller Rd 16.5 3.6-20.9 6.4 1.2-12.8 6.8 6.3-7.7 39.8 15.4 – 109 0.41 0.35-0.57 2,150 290-6,900 4 2-11 0.025 0.009-1.16 0.770 0.06-3.13 2.72 0.94-4.90 0.024 0.009-0.071 0.578 0.271-0.719Marshall Rd 14.5
(12.6) 2.7-18.2
(2.7-18.2) 3.4
(5.0) 1.3-8.9
(1.3-10.8) 6.7
(6.7) 6.5-7.7
(6.3-7.7) 6.0
(6.0) 1.4-39.5
(1.4-39.5) 0.59
(0.75) 0.46-1.98
(0.46-2.66)100
(100) 8-1,600
(8-1,600) 1
(1) 1-4
(0.5-6) 0.217
(0.237) 0.013-1.35
(0.013-1.94)0.175
(0.290) 0.02-1.34
(0.02-1.34) 1.52
(1.72) 0.66-4.90
(0.66-4.90) 0.006
(0.003) 0.005-0.081
(0.003-0.081)0.049
(0.047) 0.014-0.420
(0.009-0.420)
† Only six sample results exist for this site (December 2001 – May 2002 inclusive)

Report on the Surface Water Quality of the Lower Taieri River Catchment ______________________________________________________________________________________
________________________________________________________________________
26
Raw water quality data have been summarised in box plot format throughout most of this section, details of which are given below. For some water quality variables, notably temperature, there is a significant difference between the median values of monitoring sites sampled for 8 months and those sampled for 12 months. Sites sampled for only 8 months have been identified in box plots and graphs with an asterisk.
4.1 Water Temperature
4.1.1 Definition and Significance
Water temperature has a substantial effect on the functioning of aquatic ecosystems and the physiology of biota, including cell function, enzyme activity, bacteriological reproduction rates, and plant growth rates. Temperature also influences dissolved oxygen concentrations (the higher the temperature, the lower the oxygen concentration) and can affect the toxicity of certain chemicals such as ammonia. Temperature exhibits large diurnal fluctuations, with the lowest readings generally recorded at night and early morning. 4.1.2 Guidelines
There are no guidelines for temperature other than the Third Schedule of the Resource Management Act (RMA) 1991 which states that discharges into water bodies should not change the water temperature by more than 3oC. 4.1.3 Results
Figure 4.1 and Figure 4.2 present box plot summaries of surface water temperatures recorded at the 30 monitoring sites in the lower Taieri River catchment during the 12-month study. Water temperatures recorded in the rivers and streams ranged from 2.6 to 19.8 °C (Figure 4.1), with the highest temperatures recorded in the smaller watercourses. The Silverstream at Riverside Road recorded the spot individual temperature of 19.8°C on 29 January 2002.
Box Plot A box plot provides a quick impression of the magnitude of data, the degree of spread and the symmetry. The box encloses the middle 50% of data with the median drawn as a vertical line inside the box. The mean is drawn as a cross, which tends to occur inside the box. Horizontal lines (whiskers) extend from each end of the box. The left (or lower) whisker is drawn from the first quartile to the smallest point within 1.5 inter-quartile ranges from the lower quartile. The other whisker is drawn from the upper quartile to the largest point within 1.5 inter-quartile ranges from the upper quartile. Any individual values that fall beyond the whiskers (outliers) are shown as small squares.

Report on the Surface Water Quality of the Lower Taieri River Catchment ______________________________________________________________________________________
______________________________________________________________________________________
27
Temperatures in the drains ranged from 2.6 to 22.9°C (Figure 4.2). As expected, median values tended to be several degrees warmer than median values in the larger watercourses.
Figure 4.1 Box plot summarising surface water temperatures recorded in various waterways in the lower Taieri River catchment over October 2001 to September 2002 inclusive
Temperature Deg.C
Mill Stm Milners RdSil.Stm 3M Hill
Sil.Stm Gordons RdSil.Stm RiversideOwhiro WingatuiOwhiro Burns StOwhiro ds Riverside
Taieri OutramTaieri ds Lindsays R
Taieri Murrays RdTaieri Allanton
Taieri SH1Taieri Henley FerryCk Woodside Glen
on. Chl Grainger RdCon. Chl No.4 BrWaipori Scenic ResWaipori HB Br Rd
ggatburn Berwick BUnnamed Clarendon
0 4 8 12 16 20
*Mill Stm – Milners Rd *Silverstream – 3-M Hill
*Silverstream – Gordon Rd Silverstream – Riverside Rd
*Owhiro Stm – Wingatui Rd Owhiro Stm – Burns St
Owhiro Stm – Riverside Rd Taieri R – Outram Glen
*Taieri R – Lindsays Rd Taieri R – Murray Rd
Taieri R – Allanton Taieri R – SH1
Taieri R – Henley-Ferry *Lee Ck – Woodside Glen Contour Ch – Grainger Rd
Contour Ch – No. 4 Br. *Waipori R – Scenic Reserve
Waipori R – Hen-Ber Rd *Meggatburn – Berwick Rd
Unnamed Stm – Clarendon Rd

Report on the Surface Water Quality of the Lower Taieri River Catchment ______________________________________________________________________________________
________________________________________________________________________
28
Figure 4.2 Box plot summarising surface water temperatures recorded in various drains in the lower Taieri River catchment over October 2001 to September 2002 inclusive 4.2 pH
4.2.1 Definition and Significance
At a given temperature, the intensity of the acidic or basic character of a solution is indicated by the pH or hydrogen ion activity. pH has a scale from 0 (extremely acidic) to 7 (neutral) through to 14 (extremely alkaline). New Zealand streams are generally slightly alkaline with most streams having a pH between 7.5 and 8.5 (Close and Davies-Colley 1990). All aquatic organisms have pH optima for cell functioning. pH also influences many chemical reactions and can affect the toxicity of contaminants such as ammonia and heavy metals. Carbon dioxide in water forms a variety of dissolved inorganic carbon products and these provide the vital carbonate-bicarbonate buffering system to prevent overly acid or alkaline conditions. 4.2.2 Guidelines
It is generally accepted that the pH of fresh waters should not vary beyond the range 6.5 to 9.0 (ANZECC 1992) although the ANZECC 2000 guidelines suggest a more restricted range of 7.3 to 8.0 for upland rivers and 7.2 to 7.8 for lowland rivers. Slightly lower pH values can be expected in many watercourses in the lower Taieri River catchment as
Temperature Deg.C
l Stm @ McKays TnDrain @ McKays TnA1 Drain Taieri Rvr
O13 Drain River. RdMain Drain Miller Rd
ain Drain Marsh. RdMain Drain Wai. PS
Kirks Drain Mars. RdLee Canal Miller RdLee Canal Mars. Rd
0 4 8 12 16 20 24
*Mill Stm – McKays Tr.
*A1 Drain – McKays Tr.
A1 Drain – Taieri R
*O13 Drain – Riverside Rd Main Drain – Miller Rd
Main Drain – Marshall Rd
Main Drain – Waipori PS
Kirks Drain – Marshall Rd *Lee Canal – Miller Rd
Lee Canal - Marshall Rd

Report on the Surface Water Quality of the Lower Taieri River Catchment ______________________________________________________________________________________
______________________________________________________________________________________
29
some watercourses drain areas rich in natural organic acids (e.g., tannic, humic, and uronic acids). 4.2.3 Results
The waters of the lower Taieri River as it enters the Taieri Plain (at Outram) are fairly neutral (median pH 7.1) but become slightly acidic with distance downstream to Henley Ferry median pH 6.6), (Figure 4.3). This decrease in pH reflects the inputs of organic material from agriculture on the plain and probably explains the slightly acidic pH values recorded in many of the drains (Figure 4.4). In addition, watercourses on the Taieri Plain generally have a low alkalinity and low calcium concentrations (Robertson and Ryder 1995) and hence a low buffering capacity. The Silverstream at Riverside Road shows a slightly elevated pH relative to upstream values, the median value being 7.6. The maximum value recorded at this site was pH 8.6 on 24 September 2002 (Figure 4.3). A high pH value was also recorded in the Owhiro Stream at Mosgiel during the last sampling round in September 2002 (pH 9.04).

Report on the Surface Water Quality of the Lower Taieri River Catchment ______________________________________________________________________________________
________________________________________________________________________
30
Figure 4.3 Box plot summarising pH values recorded in various waterways in the lower Taieri River catchment over October 2001 to September 2002 inclusive
Figure 4.4 Box plot summarising pH values recorded in drains in the lower Taieri River catchment over October 2001 to September 2002 inclusive
pH
ll Stm @ McKays TnDrain @ McKays TnA1 Drain Taieri Rvr
O13 Drain River. RdMain Drain Miller Rd
Main Drain Marsh. RdMain Drain Wai. PS
Kirks Drain Mars. RdLee Canal Miller RdLee Canal Mars. Rd
6 6.4 6.8 7.2 7.6 8
*Mill Stm – McKays Tr.
*A1 Drain – McKays Tr. A1 Drain – Taieri R
*O13 Drain – Riverside Rd
Main Drain – Miller Rd
Main Drain – Marshall Rd Main Drain – Waipori PS
Kirks Drain – Marshall Rd
*Lee Canal – Miller Rd
Lee Canal - Marshall Rd
pH
Mill Stm Milners RdSil.Stm 3M Hill
Sil.Stm Gordons RdSil.Stm RiversideOwhiro WingatuiOwhiro Burns StOwhiro ds Riverside
Taieri OutramTaieri ds Lindsays R
Taieri Murrays RdTaieri Allanton
Taieri SH1Taieri Henley Ferry
e Ck Woodside Glenon. Chl Grainger RdCon. Chl No.4 BrWaipori Scenic ResWaipori HB Br Rd
ggatburn Berwick BUnnamed Clarendon
5.8 6.8 7.8 8.8 9.8
*Mill Stm – Milners Rd *Silverstream – 3-M Hill
*Silverstream – Gordon Rd Silverstream – Riverside Rd
*Owhiro Stm – Wingatui Rd Owhiro Stm – Burns St
Owhiro Stm – Riverside Rd Taieri R – Outram Glen
*Taieri R – Lindsays Rd Taieri R – Murray Rd
Taieri R – Allanton Taieri R – SH1
Taieri R – Henley-Ferry *Lee Ck – Woodside Glen Contour Ch – Grainger Rd
Contour Ch – No. 4 Br. *Waipori R – Scenic Reserve
Waipori R – Hen-Ber Rd *Meggatburn – Berwick Rd
*Unnamed Stm – Clarendon Rd
ANZECC 2000 default trigger values (<7.2 & >7.8)

Report on the Surface Water Quality of the Lower Taieri River Catchment ______________________________________________________________________________________
______________________________________________________________________________________
31
4.3 Suspended Sediment, Turbidity and Clarity
4.3.1 Definition and Significance
Suspended sediment, turbidity and clarity are all interrelated. Suspended sediment (referred to here as suspended solids) is a measure of soil and other solid material suspended in the water column. It indicates the potential for sedimentation from the water column which may have a range of adverse effects on aquatic flora and fauna. Such effects include reduction of light penetration, an alteration of natural euphotic depth, reduced periphyton production, smothering of habitat, impairment to visual feeding ability, clogging of fish gills, a reduction in the invertebrate food source and an avoidance of silted gravels for spawning by adult fish (Robertson Ryder & Associates. 1995). Turbidity is an optical property of water where suspended and dissolved materials cause light to be scattered and absorbed rather than transmitted in straight lines. Turbidity, caused by suspended solids affects the colour and clarity of water. Clarity is a measure of the transmission of light through water. It is similar to turbidity but gives a horizontal distance able to be seen through the water. Clarity is measured using a “Black Disc” and is affected by both suspended solids and dissolved coloured substances. Clarity influences primary production and hence fish and invertebrate abundance and distribution. Clarity is also an important factor when assessing the aesthetic value of a waterbody. For most rivers suspended solid concentrations are positively correlated with turbidity (and both suspended solid concentrations and turbidity are inversely correlated with visual clarity). Therefore as suspended solid concentrations and turbidity increase, water clarity decreases. 4.3.2 Guidelines
There are no guidelines for suspended solid concentrations in water. Concentrations in clean freshwaters typically range from <1 to 5 mg/L although higher values can occur, particularly in glacial fed waters. The ANZECC 2000 guidelines specify the following default trigger values for turbidity and visual clarity in lowland freshwater rivers and streams: • Turbidity: 5.6 NTU • Visual Clarity: >0.8 m The Ministry for the Environment (MfE) has also published guidelines for visual clarity (MfE 1994). These guidelines state that visual clarity affects bather preferences and stipulate that the horizontal sighting range of a black disc should exceed 1.6 m.

Report on the Surface Water Quality of the Lower Taieri River Catchment ______________________________________________________________________________________
________________________________________________________________________
32
4.3.3 Results
Turbidity was monitored at all 30 sites in the Lower Taieri River Catchment Programme, but suspended solids and clarity were only monitored every second month at the SOE sites. Therefore only the turbidity results are presented in this section.
The Silverstream (Three-Mile Hill Road and Gordon Road) and Lee Creek at Woodside Glen recorded the lowest turbidity values (Figure 4.25). In contrast, Owhiro Stream consistently recorded elevated turbidity readings, indicating that the water was generally much dirtier than in other rivers and streams in the lower Taieri River catchment. The median values at Burns Street and Riverside Road significantly exceeded the ANZECC 2000 default trigger value of 5.6 NTU (9.6 NTU and 10.4 NTU respectively). The median value recorded in Mill Stream at Milners Road also exceeded the default trigger value (7.0 NTU) as did the Taieri River at Henley-Ferry (6.4 NTU). The latter exceedance is not surprising as Henley-Ferry receives the tidal outflow from Lake Waipori and Lake Waihola and the substrate is comprised of mud and fine sands which are easily “stirred up”.
Figure 4.5 Box plot summarising turbidity values recorded in various waterways in the lower Taieri River catchment over October 2001 to September 2002 inclusive Water in the drains was significantly more turbid compared with the rivers and streams (Figure 4.6). The highest median values were recorded in drains on the West Taieri,
Turbidity NTU
ll Stm Milners RdSil.Stm 3M Hill
l.Stm Gordons RdSil.Stm RiversideOwhiro WingatuiOwhiro Burns Stwhiro ds Riverside
Taieri Outramieri ds Lindsays RTaieri Murrays Rd
Taieri AllantonTaieri SH1
aieri Henley FerryCk Woodside Glenn. Chl Grainger RdCon. Chl No.4 Br
Waipori Scenic ResWaipori HB Br Rdgatburn Berwick Bnnamed Clarendon
0 10 20 30 40 50 60
*Mill Stm – Milners Rd *Silverstream – 3-M Hill
*Silverstream – Gordon Rd Silverstream – Riverside Rd
*Owhiro Stm – Wingatui Rd Owhiro Stm – Burns St
Owhiro Stm – Riverside Rd Taieri R – Outram Glen
*Taieri R – Lindsays Rd Taieri R – Murray Rd
Taieri R – Allanton Taieri R – SH1
Taieri R – Henley-Ferry *Lee Ck – Woodside Glen Contour Ch – Grainger Rd
Contour Ch – No. 4 Br. *Waipori R – Scenic Reserve
Waipori R – Hen-Ber Rd *Meggatburn – Berwick Rd
*Unnamed Stm – Clarendon Rd
ANZECC 2000 default trigger value (5.6 NTU)

Report on the Surface Water Quality of the Lower Taieri River Catchment ______________________________________________________________________________________
______________________________________________________________________________________
33
principally Lee Canal Drain at Marshall Road (39.8 NTU), Kirks Drain at Marshall Road (36.8 NTU), and the Main Drain at Miller Road (31.5 NTU).
Figure 4.6 Box plot summarising turbidity values recorded in drains in the lower Taieri River catchment over October 2001 to September 2002 inclusive At most sites the highest turbidity values were recorded on the 28 May 2002 sampling run which was undertaken following heavy rainfall and subsequent elevated river flows (Table 4.3 and Figure 4.7). Sites on watercourses with a predominantly mud or silt–based substrate were most affected, notably the Taieri River below SH1 (56.5 NTU), the Contour Channel at Grainger Road and No. 4 Bridge (56.5 NTU and 32.7 NTU respectively), the Waipori River at Henley Berwick Road (36.0 NTU) and the Meggatburn at Berwick Road (28.1 NTU).
Turbidity NTU
Stm @ McKays Tnrain @ McKays Tn
A1 Drain Taieri Rvr13 Drain River. Rdain Drain Miller Rdin Drain Marsh. Rd
Main Drain Wai. PSrks Drain Mars. Rd
Lee Canal Miller RdLee Canal Mars. Rd
0 100 200 300 400
*Mill Stm – McKays Tr. *A1 Drain – McKays Tr.
A1 Drain – Taieri R
*O13 Drain – Riverside Rd
Main Drain – Miller Rd Main Drain – Marshall Rd
Main Drain – Waipori PS
Kirks Drain – Marshall Rd
*Lee Canal – Miller Rd Lee Canal - Marshall Rd

Report on the Surface Water Quality of the Lower Taieri River Catchment ______________________________________________________________________________________
________________________________________________________________________
34
Table 4.3 Rainfall data* (mm) for the Lower Taieri Plain during water quality sampling over October 2001 to September 2002 inclusive
Riccarton Road, Mosgiel Dunedin Airport, Momona Sample Date Day of
Sampling Previous
24 hrs Previous
48 hrs Previous
7 days Day of
SamplingPrevious
24 hrs Previous
48 hrs Previous
7 days 16/10/2001 0 2.5 7.5 13.5 0.2 8.6 8.8 21.8 14/11/2001 0 2.0 12.5 15.5 2.6 11.4 11.4 16.0 17/12/2001 0 0 0.5 1.0 0 1.8 2.2 8.4 29/1/2002 0 0 0 0 0 0 0 6.8 27/2/2002 12.0 0 0 5 0 0 0 14.8 18/3/2002 0 0 0 8 0.2 0.4 7.0 9.6 16/4/2002 0 0 0 0.5 0 0 0 0 28/5/2002 0 16.5 19.5 47.5 10.6 5.2 16.0 36.4 26/6/2002 1.0 2.5 2.5 5 3.0 0 0 1.6 25/7/2002 0.5 2.0 7.5 8.5 0.6 2.8 2.8 3.4 28/8/2002 1.0 0.5 4.0 13.5 0 6.0 13.4 15.4 24/9/2002 1.0 1.5 2.0 17.0 2.2 0 0.6 13.4
* Beginning at 9.00 am each day
Figure 4.7 Mean daily flows recorded in the Taieri River at Outram over October 2001 to September 2002 inclusive, with the flows on sampling days denoted by arrows
0
50
100
150
200
250
300
350
Oct-01 Dec-01 Feb-02 Apr-02 Jun-02 Aug-02 Oct-02
Flo
w (m
3 /s)

Report on the Surface Water Quality of the Lower Taieri River Catchment ______________________________________________________________________________________
______________________________________________________________________________________
35
4.4 Conductivity
4.4.1 Definition and Significance
Conductivity refers to the ability of an aqueous solution to carry an electric current. This ability depends on the presence of ions and their total concentration. Conductivity or salinity measurements are generally determined by the concentration of dissolved solids in solution. In freshwater carbonates are generally the most abundant salts due to the high availability and solubility of carbon dioxide. The lower the conductivity concentration, the purer the water is. Wastewater and farm effluents therefore have higher concentrations of minerals than natural water, and a large increase in the conductivity of a water body can often be traced back to waste discharges. 4.4.2 Guidelines
There are no guidelines for conductivity concentrations in water. Concentrations in freshwaters typically range from 0.02 to 0.15 mS/cm although higher values can occur, particularly where there is a significant groundwater or wastewater input. The ANZECC 2000 site-specific trigger value for Outram Glen is 0.091 mS/cm. 4.4.3 Results
Median conductivity concentrations were within the expected range for most of the rivers and streams in the lower Taieri River catchment (Figure 4.8). The main exception is Owhiro Stream which consistently recorded elevated concentrations (the medians ranged from 0.20 to 0.27 mS/cm for the three monitoring sites). The unnamed tributary of Lake Waihola also had an elevated median concentration (0.18 mS/cm). Median concentrations at the Taieri River sites were 0.07 to 0.08 mS/cm with the exception of the saline site at Henley-Ferry (0.409 mS/cm).

Report on the Surface Water Quality of the Lower Taieri River Catchment ______________________________________________________________________________________
________________________________________________________________________
36
Figure 4.8 Median conductivity concentrations recorded in various waterways in the lower Taieri River catchment over October 2001 to September 2002 inclusive Conductivity concentrations were significantly higher in the lower Taieri drains, especially those located on the West Taieri (Figure 4.9). The highest median concentrations were recorded in the Main Drain at the Waipori Pumping Station (4.92 mS/cm) and Kirks Drain at Marshall Road (1.93 mS/cm).
Figure 4.9 Box plot summarising conductivity concentrations recorded in various drains in the lower Taieri River catchment over October 2001 to September 2002 inclusive.
Conductivity mS/cm
Mill Stm @ McKays TnA1 Drain @ McKays Tn
A1 Drain Taieri RvrO13 Drain River. Rd
Main Drain Miller RdMain Drain Marsh. Rd
Main Drain Wai. PSKirks Drain Mars. RdLee Canal Miller RdLee Canal Mars. Rd
0 2 4 6 8
*Mill Stm – McKays Tr.*A1 Drain – McKays Tr.
A1 Drain – Taieri R*O13 Drain – Riverside Rd
Main Drain – Miller RdMain Drain – Marshall RdMain Drain – Waipori PS
Kirks Drain – Marshall Rd*Lee Canal – Miller Rd
Lee Canal - Marshall Rd
0.00
0.05
0.10
0.15
0.20
0.25
0.30
0.35
0.40
0.45
Con
duct
ivity
(mS
/cm
)
Mill Stm - Milners Rd*Silver Stm - 3 Mile Hill*Silver Stm - Gordon Rd*Silver Stm - Riverside RdOw hiro Stm - Wingatui Rd*Ow hiro Stm - Burns StOw hiro Stm - Riverside RdTaieri R - OutramTaieri R - Lindsay Rd*Taieri R - Murray RdTaieri R - AllantonTaieri R - SH1Taieri R - Henley-FerryLee Ck - Woodside Glen*Contour Ch - Grainger RdContour Ch - No. 4 Br.Waipori R - Scenic Res.*Waipori R - Hen-Ber RdMeggatburn - Berw ick Rd*Unnamed Stm - Clar. Rd*

Report on the Surface Water Quality of the Lower Taieri River Catchment ______________________________________________________________________________________
______________________________________________________________________________________
37
4.5 Dissolved Oxygen and Biochemical Oxygen Demand (BOD)
4.5.1 Definition and Significance
Dissolved oxygen (DO) is essential for aquatic life and the concentration measured in a waterbody reflects the equilibrium between oxygen-consuming processes and oxygen-releasing processes. Dissolved oxygen concentrations are reduced by organic matter in the water (e.g., sewage), as bacteria require oxygen to break organic matter down. Dissolved oxygen exhibits large diurnal fluctuations, with the lowest levels generally recorded in the early morning. Dissolved oxygen concentrations also vary with season, in response to changes in aquatic plant growth. The Biochemical Oxygen Demand (BOD) of water may be defined as the amount of oxygen required for aerobic micro-organisms to oxidise carbonaceous organic matter to a stable inorganic form. It therefore indicates the amount of biodegradable organic matter present in the water, and the potential for bacteria to deplete oxygen concentrations. Waste matter rich in organic material with high BOD values can rapidly deplete dissolved oxygen levels when discharged into water. 4.5.2 Guidelines
There are no guidelines for dissolved oxygen although it is generally accepted that absolute concentrations should remain above 6.5 mg/L to maintain a healthy aquatic ecosystem. Concentrations less than 5 mg/L adversely affect trout and levels of 2-3 mg/L may result in fish kills. The ANZECC 2000 Guidelines stipulate that dissolved oxygen concentrations, expressed as percentage saturation, should be within the range 99-103% in upland waters. The “bottom-line” in the Third Schedule of the RMA is that the concentration of dissolved oxygen should not fall below 80% saturation and this is the critical trigger value used in this report. There is no default trigger value for BOD in the ANZECC 2000 water quality guidelines. A guideline of 2 mg/L has been specified to avoid undesirable biological growths in water (Ministry for the Environment 1992). Concentrations in unpolluted waters are always less than this. The ANZECC 2000 site-specific trigger value for the Taieri River at Outram Glen is <1 mg/L. 4.5.3 Results
Dissolved oxygen concentrations were converted to percentage saturation data to remove the influence of temperature on the results and thereby enable different sites to be compared. Dissolved oxygen saturation values varied across sites and through time in the lower Taieri River and tributaries. Median values were above 80% saturation at all sites except the Unnamed Stream at Clarendon Road and the Owhiro Stream at Wingatui Road and Riverside Road (Figure 4.10). The highest median values were recorded in the Taieri River at Outram and the Silverstream at Riccarton Road.

Report on the Surface Water Quality of the Lower Taieri River Catchment ______________________________________________________________________________________
________________________________________________________________________
38
Dissolved oxygen values in the lower Taieri drainage network were significantly less than in the rivers and streams (Figure 4.11). The lowest median values were recorded in the Main Drain at Marshall Road and Waipori Pumping Station (13.4% and 31.5% respectively), as a result of a series of near zero readings at these sites over October 2001 to March 2002 (Figure 4.12). Kirks Drain at Marshall Road also recorded a very low median (35.0%).
Figure 4.10 Box plot summarising dissolved oxygen saturation data for various waterways in the lower Taieri River catchment over October 2001 to September 2002 inclusive
Dissolved Oxygen (% saturation)
Milners RoadeeMile Hill RdGordon RdRiverside RdWingatuiBurns StRD OWHIROOutramLindsayMurrayAllantonSH1HenleyLee Ckon Ch GraingerNo Four BRScenicWaipori HenleyMEggatUnnamed0 20 40 60 80 100 120 140
*Mill Stm – Milners Rd *Silverstream – 3-M Hill
*Silverstream – Gordon Rd Silverstream – Riverside Rd
*Owhiro Stm – Wingatui Rd Owhiro Stm – Burns St
Owhiro Stm – Riverside Rd Taieri R – Outram Glen
*Taieri R – Lindsays Rd Taieri R – Murray Rd
Taieri R – Allanton Taieri R – SH1
Taieri R – Henley-Ferry *Lee Ck – Woodside Glen Contour Ch – Grainger Rd
Contour Ch – No. 4 Br. *Waipori R – Scenic Reserve
Waipori R – Hen-Ber Rd *Meggatburn – Berwick Rd
*Unnamed Stm – Clarendon Rd
0 20 40 60 80 100 120
Dissolved Oxygen (% saturation)
RMA 1991 Third Schedule Minimum “Critical”

Report on the Surface Water Quality of the Lower Taieri River Catchment ______________________________________________________________________________________
______________________________________________________________________________________
39
Figure 4.11 Box plot summarising dissolved oxygen saturation values for various drains in the lower Taieri River catchment over October 2001 to September 2002 inclusive
Figure 4.12 Dissolved oxygen concentrations recorded in the Main Drain over October 2001 to September 2002 inclusive
0
2
4
6
8
10
12
Oct-01 Jan-02 Apr-02 Jul-02 Oct-02
Dis
solv
ed O
xyge
n (m
g/L)
Main Drain - Miller Rd
Main Drain - Marshall Rd
Main Drain - W aipori PS
Dissolved Oxygen (% saturation)
sample
Mill StmA1 McKaysA1 Taieri R
O13MD Miller
MD MarshallMD Waipori PS
KirksLee Miller Rd
Lee C marshall R0 20 40 60 80 100 120
*Mill Stm – McKays Tr.*A1 Drain – McKays Tr.
A1 Drain – Taieri R*O13 Drain – Riverside Rd
Main Drain – Miller RdMain Drain – Marshall RdMain Drain – Waipori PS
Kirks Drain – Marshall Rd*Lee Canal – Miller Rd
Lee Canal - Marshall Rd

Report on the Surface Water Quality of the Lower Taieri River Catchment ______________________________________________________________________________________
________________________________________________________________________
40
BOD concentrations were generally below detection levels at most river and stream monitoring sites (Figure 4.13). The main exception was Owhiro Stream which recorded BOD concentrations in excess of the MfE 1992 guideline of 2 mg/L on a number of occasions at both Burns Street and Riverside Road. The greatest concentration recorded during the monitoring programme was 4 mg/L (below Riverside Road) on 17 December 2001. BOD was also detected in the unnamed tributary of Lake Waihola and on one sampling occasion the result exceeded the MFE 1992 guideline.
Figure 4.13 Median BOD concentrations recorded in various waterways in the lower Taieri River catchment over October 2001 to September 2002 inclusive BOD was detected regularly in all of the drains on the Lower Taieri Plain but the concentrations vary greatly from site to site (Figure 4.14). The greatest concentrations (up to 41 mg/L) were recorded in the West Taieri drainage system (Main Drain, Kirks Drain and Lee Canal), with Kirks Drain at Marshall Road recording the highest median value (8 mg/l).
0.0
0.5
1.0
1.5
2.0
2.5
BO
D (m
g/L)
Mill Stm - Milners Rd*Silver Stm - 3 Mile Hill*Silver Stm - Gordon Rd*Silver Stm - Rivers ide RdOw hiro Stm - Wingatui Rd*Ow hiro Stm - Burns StOw hiro Stm - Rivers ide RdTaieri R - OutramTaieri R - Lindsay Rd*Taieri R - Murray RdTaieri R - A llantonTaieri R - SH1Taieri R - Henley-FerryLee Ck - Woodside Glen*Contour Ch - Grainger RdContour Ch - No. 4 Br.Waipori R - Scenic Res.*Waipori R - Hen-Ber RdMeggatburn - Berw ick Rd*Unnamed Stm - Clar. Rd*
MfE 1992 Guideline

Report on the Surface Water Quality of the Lower Taieri River Catchment ______________________________________________________________________________________
______________________________________________________________________________________
41
Figure 4.14 BOD concentrations recorded in various drains in the lower Taieri River catchment over October 2001 to September 2002 inclusive 4.6 Nitrogen and Phosphorus
4.6.1 Definition and Significance
Nitrogen and phosphorus are vital elements for aquatic plant and algal growth which in turn provide food for the invertebrate and vertebrates that live in or are associated with the water. These elements may be limiting factors in plant growth when in short supply but in sufficient quantities they may also promote unsightly algal blooms and nuisance macrophyte growth. Excessive proliferations of both algae and aquatic plants can choke waterways, reducing their drainage capacity, and amenity and fishery values (Robertson Ryder & Associates 1995). Both nitrogen and phosphorus are found in a number of different chemical forms, however the principal forms available to plants are those that are soluble. For this reason dissolved inorganic nutrient concentrations are most relevant for predicting the potential for nuisance periphyton and macrophyte growths. These forms include ammoniacal nitrogen and nitrite-nitrate nitrogen (collectively referred to as dissolved inorganic nitrogen) and dissolved reactive phosphorus. Total nutrient concentrations are also relevant in surface waters, because particulate matter can settle out in quiescent areas and become biologically available to plants via mineralisation (Ministry for the Environment 1992). Ammoniacal nitrogen is comprised of ammonium (NH4+) and unionised ammonia (NH3). Ammonia is rarely found in any significant amounts in natural waters and its presence most commonly indicates the presence of domestic, agricultural or industrial effluent. Ammonia is very soluble in water and can be toxic to aquatic life, especially fish.
0
10
20
30
40
Oct-01 Jan-02 Apr-02 Jul-02 Oct-02
BO
D (m
g/L)
Mill Stm - McKays Tr.*
A1 Drain - McKays Tr.*
A1 Drain - Taieri R
013 Drain - Riverside Rd*
Main Drain - Miller Rd
Main Drain - Marshall Rd
Main Drain - Waipori PS
Kirks Drain - Marshall Rd
Lee Canal - Miller Rd*
Lee Canal - Marshall Rd

Report on the Surface Water Quality of the Lower Taieri River Catchment ______________________________________________________________________________________
________________________________________________________________________
42
Toxicity is a function of both temperature and pH, with toxicity increasing with increasing water temperature and alkalinity (ANZECC 2000). 4.6.2 Guidelines
The ANZECC 2000 water quality guidelines specify the following default trigger values for dissolved and total nutrients in lowland freshwater rivers and streams: • Ammoniacal nitrogen: 0.021 mg/L • Nitrite-nitrate nitrogen: 0.444 mg/L • Total nitrogen: 0.614 mg/L • Dissolved reactive phosphorus: 0.010 mg/L • Total phosphorus: 0.033 mg/L
It is important to note that it can be difficult to link periphyton biomass to stream nutrient concentrations. Many plants may take up extra nutrients when concentrations are high and use them for growth later when nitrogen or phosphorus becomes limiting. The ANZECC 2000 guidelines also specify specific toxicity trigger values for ammonia correlated with the level of protection that is assigned to a particular ecosystem. For slightly modified ecosystems such as the lower Taieri River, a 95% protection level can be applied. This correlates to a default trigger value of 0.9 mg/L as ammoniacal nitrogen at pH 8.0. 4.6.3 Results
Median ammoniacal nitrogen concentrations were below the ANZECC 2000 default trigger level of 0.021 mg/L at all Taieri River monitoring sites, although the median for the SH1 site was elevated relative to the other sites. Median concentrations in the Owhiro Stream at Burns Street and Riverside Road and the unnamed tributary of Lake Waihola at Clarendon Road significantly exceeded the ANZECC 2000 default trigger value (Figure 4.15). The median concentration at both monitoring sites on the Contour Channel also exceeded the trigger value. Drains in the McKays Triangle area (Mill Stream and A1 Drain) on the East Taieri were the only drains to record ammoniacal nitrogen concentrations of similar magnitude to the rivers and streams. At all other drain monitoring sites concentrations were 2-4 orders of magnitude greater. The highest concentrations were again recorded in the West Taieri drainage system (Figure 4.16), with Kirks Drain at Marshall Road recording median and maximum concentrations of 12.2 mg/L and 21.9 mg/L respectively. The highest concentrations in the Main Drain were recorded in the upper reaches at Miller Road (median 9.29 mg/L) while the lowest concentrations were recorded in the bottom of the catchment at the Waipori Pumping Station (median 1.03 mg/L).

Report on the Surface Water Quality of the Lower Taieri River Catchment ______________________________________________________________________________________
______________________________________________________________________________________
43
Figure 4.15 Box plot summarising ammoniacal nitrogen concentrations recorded in various waterways in the lower Taieri River catchment over October 2001 to September 2002 inclusive
Ammoniacal Nitrogen mg/L
ill Stm Milners RdSil.Stm 3M Hill
il.Stm Gordons RdSil.Stm RiversideOwhiro WingatuiOwhiro Burns Stwhiro ds Riverside
Taieri Outramaieri ds Lindsays RTaieri Murrays Rd
Taieri AllantonTaieri SH1
aieri Henley FerryCk Woodside Glenn. Chl Grainger RdCon. Chl No.4 Br
Waipori Scenic ResWaipori HB Br Rdgatburn Berwick Bnnamed Clarendon
0 0.1 0.2 0.3 0.4 0.5 0.6
*Mill Stm – Milners Rd *Silverstream – 3-M Hill
*Silverstream – Gordon Rd Silverstream – Riverside Rd
*Owhiro Stm – Wingatui Rd Owhiro Stm – Burns St
Owhiro Stm – Riverside Rd Taieri R – Outram Glen
*Taieri R – Lindsays Rd Taieri R – Murray Rd
Taieri R – Allanton Taieri R – SH1
Taieri R – Henley-Ferry *Lee Ck – Woodside Glen Contour Ch – Grainger Rd
Contour Ch – No. 4 Br. *Waipori R – Scenic Reserve
Waipori R – Hen-Ber Rd *Meggatburn – Berwick Rd
*Unnamed Stm – Clarendon Rd
ANZECC 2000 default trigger value (0.021

Report on the Surface Water Quality of the Lower Taieri River Catchment ______________________________________________________________________________________
________________________________________________________________________
44
Figure 4.16 Box plot summarising ammoniacal nitrogen concentrations recorded in various drains in the lower Taieri River catchment over October 2001 to September 2002 inclusive Median nitrite-nitrate nitrogen concentrations were below the ANZECC 2000 default trigger value of 0.444 mg/L at all river and stream monitoring sites, although concentrations were elevated in Owhiro Stream and the Contour Channel (refer Table 4.1). Nitrite-nitrate nitrogen concentrations exhibited a strong seasonal variation in the lower Taieri River, with concentrations lowest in summer and highest in winter (Figure 4.17).
Figure 4.17 Nitrite-nitrate nitrogen concentrations recorded in the lower Taieri River over October 2001 to September 2002 inclusive
Ammoniacal Nitrogen mg/L
Stm @ McKays TnDrain @ McKays TnA1 Drain Taieri Rvr
O13 Drain River. Rdain Drain Miller Rd
ain Drain Marsh. RdMain Drain Wai. PSirks Drain Mars. Rd
Lee Canal Miller RdLee Canal Mars. Rd
0 4 8 12 16 20 24
*Mill Stm – McKays Tr.
*A1 Drain – McKays Tr. A1 Drain – Taieri R
*O13 Drain – Riverside Rd
Main Drain – Miller Rd
Main Drain – Marshall Rd Main Drain – Waipori PS
Kirks Drain – Marshall Rd
*Lee Canal – Miller Rd
Lee Canal - Marshall Rd
0.000.050.100.150.200.250.300.35
Oct-01 Jan-02 Apr-02 Jul-02 Oct-02Nitr
ite-N
itrat
e N
itrog
en (m
g/L) Taieri R - Outram Glen
Taieri R - Lindsay Rd
Taieri R - Murray Rd
Taieri R - Allanton
Taieri R - below SH1
Taieri R - Henley Ferry

Report on the Surface Water Quality of the Lower Taieri River Catchment ______________________________________________________________________________________
______________________________________________________________________________________
45
Nitrite-nitrate nitrogen concentrations in the Lower Taieri drainage system are summarised in Figure 4.18. The highest concentrations were recorded in the Main Drain at Miller Road and Marshall Road.
Figure 4.18 Box plot summarising nitrite-nitrate nitrogen concentrations recorded in various drains in the lower Taieri River catchment over October 2001 to September 2002 inclusive
Median total nitrogen concentrations were below the ANZECC 2000 default trigger level of 0.614 mg/L at all river and stream monitoring sites except Owhiro Stream at Burns Street and Riverside Road and the Unnamed Stream at Clarendon Road (Figure 4.19). Total nitrogen concentrations followed a similar seasonal pattern to ammoniacal nitrogen concentrations, with the highest concentrations being recorded in the winter months.
Nitrite-Nitrate Nitrogen mg/L
l Stm @ McKays TnDrain @ McKays TnA1 Drain Taieri Rvr
O13 Drain River. RdMain Drain Miller Rd
ain Drain Marsh. RdMain Drain Wai. PS
Kirks Drain Mars. RdLee Canal Miller RdLee Canal Mars. Rd
0 0.4 0.8 1.2 1.6 2 2.4
*Mill Stm – McKays Tr.
*A1 Drain – McKays Tr.
A1 Drain – Taieri R
*O13 Drain – Riverside Rd Main Drain – Miller Rd
Main Drain – Marshall Rd
Main Drain – Waipori PS
Kirks Drain – Marshall Rd *Lee Canal – Miller Rd
Lee Canal - Marshall Rd

Report on the Surface Water Quality of the Lower Taieri River Catchment ______________________________________________________________________________________
________________________________________________________________________
46
Figure 4.19 Box plot summarising total nitrogen concentrations recorded in various waterways in the lower Taieri River catchment over October 2001 to September 2002 inclusive Total nitrogen concentrations in the Lower Taieri drainage system followed a similar pattern to ammoniacal nitrogen concentrations, with very high concentrations being recorded in the West Taieri drainage system (Figure 4.20). Kirks Drain at Marshall Road recorded median and maximum concentrations of 16.6 mg/L and 37.5 mg/L respectively. While ammoniacal nitrogen is clearly the dominant form of nitrogen present in the drains, Table 4.2 indicates that the combined dissolved inorganic forms (i.e., nitrite-nitrate nitrogen and ammoniacal nitrogen) do not equate to the total nitrogen concentration at any site, indicating the presence of significant concentrations of organic nitrogen. Median dissolved reactive phosphorus concentrations were well below the ANZECC 2000 default trigger value of 0.010 mg/L at most river and stream monitoring sites. The key exceptions were the Contour Channel at both the No. 4 Bridge and Grainger Road, and the Unnamed Stream at Clarendon Road (Figure 4.21). These sites recorded median concentrations of 0.170 mg/L, 0.120 mg/L and 0.015 mg/L respectively. The median concentration for Owhiro Stream at Wingatui Road was right on the trigger value, but caution is required in drawing any conclusions from this value as the site was only sampled on four occasions.
Total Nitrogen mg/L
Mill Stm Milners RdSil.Stm 3M Hill
Sil.Stm Gordons RdSil.Stm RiversideOwhiro WingatuiOwhiro Burns StOwhiro ds Riverside
Taieri Outramaieri ds Lindsays RTaieri Murrays Rd
Taieri AllantonTaieri SH1
Taieri Henley FerryCk Woodside Glenn. Chl Grainger RdCon. Chl No.4 Br
Waipori Scenic ResWaipori HB Br Rdgatburn Berwick B
Unnamed Clarendon
0 1 2 3 4
*Mill Stm – Milners Rd *Silverstream – 3-M Hill
*Silverstream – Gordon Rd Silverstream – Riverside Rd
*Owhiro Stm – Wingatui Rd Owhiro Stm – Burns St
Owhiro Stm – Riverside Rd Taieri R – Outram Glen
*Taieri R – Lindsays Rd Taieri R – Murray Rd
Taieri R – Allanton Taieri R – SH1
Taieri R – Henley-Ferry *Lee Ck – Woodside Glen Contour Ch – Grainger Rd
Contour Ch – No. 4 Br. *Waipori R – Scenic Reserve
Waipori R – Hen-Ber Rd *Meggatburn – Berwick Rd
*Unnamed Stm – Clarendon Rd
ANZECC 2000 default trigger value (0.614

Report on the Surface Water Quality of the Lower Taieri River Catchment ______________________________________________________________________________________
______________________________________________________________________________________
47
Figure 4.20 Box plot summarising total nitrogen concentrations recorded in various drains in the lower Taieri River catchment over October 2001 to September 2002 inclusive
Figure 4.21 Box plot summarising dissolved reactive phosphorus concentrations recorded in various waterways in the lower Taieri River catchment over October 2001 to September 2002 inclusive
Total Nitrogen mg/L
ll Stm @ McKays TnDrain @ McKays TnA1 Drain Taieri Rvr
O13 Drain River. RdMain Drain Miller Rd
Main Drain Marsh. RdMain Drain Wai. PS
Kirks Drain Mars. RdLee Canal Miller RdLee Canal Mars. Rd
0 10 20 30 40
*Mill Stm – McKays Tr.
*A1 Drain – McKays Tr. A1 Drain – Taieri R
*O13 Drain – Riverside Rd
Main Drain – Miller Rd
Main Drain – Marshall Rd Main Drain – Waipori PS
Kirks Drain – Marshall Rd
*Lee Canal – Miller Rd
Lee Canal - Marshall Rd
Dissolved Reactive Phosphorus mg/L
Mill Stm Milners RdSil.Stm 3M Hill
il.Stm Gordons RdSil.Stm RiversideOwhiro WingatuiOwhiro Burns Stwhiro ds Riverside
Taieri Outramaieri ds Lindsays RTaieri Murrays Rd
Taieri AllantonTaieri SH1
Taieri Henley FerryCk Woodside Glenn. Chl Grainger RdCon. Chl No.4 Br
Waipori Scenic ResWaipori HB Br Rdgatburn Berwick Bnnamed Clarendon
0 0.04 0.08 0.12 0.16 0.2 0.24
*Mill Stm – Milners Rd *Silverstream – 3-M Hill
*Silverstream – Gordon Rd Silverstream – Riverside Rd
*Owhiro Stm – Wingatui Rd Owhiro Stm – Burns St
Owhiro Stm – Riverside Rd Taieri R – Outram Glen
*Taieri R – Lindsays Rd Taieri R – Murray Rd
Taieri R – Allanton Taieri R – SH1
Taieri R – Henley-Ferry *Lee Ck – Woodside Glen Contour Ch – Grainger Rd
Contour Ch – No. 4 Br. *Waipori R – Scenic Reserve
Waipori R – Hen-Ber Rd *Meggatburn – Berwick Rd
*Unnamed Stm – Clarendon Rd
ANZECC 2000 default trigger value (0.010 mg/L)

Report on the Surface Water Quality of the Lower Taieri River Catchment ______________________________________________________________________________________
________________________________________________________________________
48
Median dissolved reactive phosphorus concentrations in the drains on the East Taieri were similar to those recorded in the rivers and streams, ranging from 0.003 mg/L to 0.004 mg/L. Concentrations were significantly higher in some of the West Taieri drains (Figure 4.22), notably Kirks Drain at Marshall Road and the Main Drain at both Miller Road and Marshall Road (0.720 mg/L, 0.277 mg/L and 0.480 mg/L respectively). In contrast, the median concentrations in the Main Drain at the Waipori Pumping Station and Lee Canal at Marshall Road were very low (both 0.003 mg/L).
Figure 4.22 Box plot summarising dissolved reactive phosphorus concentrations recorded in various drains in the lower Taieri River catchment over October 2001 to September 2002 inclusive
Total phosphorus concentrations exceeded the ANZECC 2000 default trigger value of 0.033 mg/L at several stream monitoring sites (Figure 4.23). The highest median was recorded in Owhiro Stream at Burns Street (0.094 mg/L) but the sites at Wingatui Road and Riverside Road also exceeded the ANZECC trigger value (0.045 mg/L and 0.087 mg/L respectively). The Contour Channel at both the No. 4 Bridge and Grainger Road, and the Unnamed Stream at Clarendon Road recorded median concentrations of 0.044 mg/L, 0.051 mg/L and 0.077 mg/L respectively. Total phosphorus concentrations in the Lower Taieri drains followed an identical pattern to dissolved phosphorus concentrations (refer Figure 4.22). The lowest median values were recorded in the East Taieri drains and the highest in Kirks Drain and the Main Drain on the West Taieri.
Dissolved Reactive Phosphorus mg/L
Mill Stm @ McKays TnA1 Drain @ McKays Tn
A1 Drain Taieri RvrO13 Drain River. Rd
Main Drain Miller RdMain Drain Marsh. Rd
Main Drain Wai. PSKirks Drain Mars. RdLee Canal Miller RdLee Canal Mars. Rd
0 0.5 1 1.5 2 2.5 3
*Mill Stm – McKays Tr. *A1 Drain – McKays Tr.
A1 Drain – Taieri R *O13 Drain – Riverside Rd
Main Drain – Miller Rd Main Drain – Marshall Rd Main Drain – Waipori PS
Kirks Drain – Marshall Rd *Lee Canal – Miller Rd
Lee Canal - Marshall Rd
Dissolved Reactive Phosphorus mg/L

Report on the Surface Water Quality of the Lower Taieri River Catchment ______________________________________________________________________________________
______________________________________________________________________________________
49
Figure 4.23 Box plot summarising total phosphorus concentrations recorded in various waterways in the lower Taieri River catchment over October 2001 to September 2002 inclusive 4.7 Pathogens: Faecal Coliforms and E. coli
4.7.1 Definition and Significance
Faecal coliforms and Escherichia coli (E. coli) are indicator bacteria associated with the gut of warm-blooded animals. Their presence in water may indicate the presence of harmful pathogens that can cause eye, ear, nose and throat infections, skin diseases, and gastrointestinal disorders. A number of parasites and pathogens can also be transmitted to stock and affect their health. E. coli is the most specific indicator of faecal contamination and is nearly always found in high numbers in the gut of humans and warm blooded animals. E. coli is the preferred microbiological indicator for faecal contamination and health effects in freshwater (Ministry for the Environment/Ministry of Health 2003).
Total Phosphorus mg/L
ill Stm Milners RdSil.Stm 3M Hill
l.Stm Gordons RdSil.Stm RiversideOwhiro WingatuiOwhiro Burns Stwhiro ds Riverside
Taieri Outramaieri ds Lindsays RTaieri Murrays Rd
Taieri AllantonTaieri SH1
aieri Henley FerryCk Woodside Glenn. Chl Grainger RdCon. Chl No.4 Br
Waipori Scenic ResWaipori HB Br Rdgatburn Berwick Bnnamed Clarendon
0 0.1 0.2 0.3 0.4 0.5 0.6
*Mill Stm – Milners Rd *Silverstream – 3-M Hill
*Silverstream – Gordons Rd Silverstream – Riverside Rd
*Owhiro Stm – Wingatui Rd Owhiro Stm – Burns St
Owhiro Stm – Riverside Rd Taieri R – Outram Glen
*Taieri R – Lindsays Rd Taieri R – Murray Rd
Taieri R – Allanton Taieri R – SH1
Taieri R – Henley-Ferry *Lee Ck – Woodside Glen Contour Ch – Grainger Rd
Contour Ch – No. 4 Br. *Waipori R – Scenic Reserve
Waipori R – Hen-Ber Rd *Meggatburn – Berwick Rd
*Unnamed Stm – Clarendon Rd
ANZECC 2000 default trigger value (0.033 mg/L)

Report on the Surface Water Quality of the Lower Taieri River Catchment ______________________________________________________________________________________
________________________________________________________________________
50
In the Lower Taieri sources of pollution that may significantly contribute to the loading of faecal contamination in surface watercourses include sewage and stormwater discharges, wildlife and agricultural runoff. 4.7.2 Guidelines
Guidelines for faecal coliform and E. coli in fresh waters differ depending on the use of water. The New Zealand Drinking Water Standards (Ministry of Health 1995) specify that faecal coliform concentrations in water used for human consumption should be less than 1 cfu/100 ml. However water in the lower Taieri River catchment is generally only used for irrigation, stock drinking water or contact recreation. The ANZECC 2000 guidelines specify that the concentration of faecal coliforms in irrigation waters used for pasture and fodder for grazing animals should contain less than 1,000 cfu/100 ml (ANZECC 2000). The trigger value is reduced to 100 cfu/100ml for dairy animals without a 5-day withholding period. These guidelines also state that drinking water for livestock should contain less than 100 faecal coliforms per 100 ml as a median value based on a number of readings over time from a regular monitoring programme. Further investigation is warranted where 20% of the results exceed four times the median trigger value. The New Zealand Microbiological Water Quality Guidelines for Marine and Freshwater Recreational Areas (Ministry of the Environment/Ministry of Health 20035) specifies that in order to meet the Acceptable/Green mode for contact recreation no single sample should exceed 260 E. coli/100 ml. Daily sampling is required when any single result exceeds 260 E. coli /100 ml (Alert/Amber Mode) and public notification and erection of warning signs are recommended when any sample result at a designated bathing area exceeds 550 E. coli/100 ml (Action/Red Mode). 4.7.3 Results
E. coli was monitored at all 30 sites in the Lower Taieri River Catchment Programme, but faecal coliforms were only monitored every second month at the SOE sites. Therefore only the E. coli results are presented in this section. Taieri River SOE faecal coliform data are discussed in Section 5. Owhiro Stream recorded the highest median E. coli count (Figure 4.24), with results from the site at Burns Street ranging from 39 to 5,700 MPN/100 ml over the 12-month monitoring period. High counts were also recorded in the lower reaches below Riverside Road (up to 7,700 MPN/100 ml). Although it is difficult to apply recreational water quality guidelines to a short duration, low frequency sampling programme such as the Lower Taieri Catchment Monitoring Programme, it is clear from these results that Owhiro Stream is not suitable for primary contact recreation.
5 The guidelines were first released in 2002 at which time different freshwater trigger values were in place. These values served purely as interim guidelines until the revised set, based on more comprehensive monitoring data, could be completed.

Report on the Surface Water Quality of the Lower Taieri River Catchment ______________________________________________________________________________________
______________________________________________________________________________________
51
Other stream monitoring sites with elevated median E. coli counts were Mill Stream at Milners Road (499 MPN/100 ml), the Contour Channel at Grainger Road and the No. 4 Bridge (715 MPN/100 ml and 205 MPN/100 ml respectively), the Unnamed Stream at Clarendon Road (300 MPN/100 ml), and the Silverstream at Gordon Road (200 MPN/100 ml).
Figure 4.24 Box plot summarising E. coli counts in various waterways in the lower Taieri River catchment over October 2001 to September 2002 inclusive. The MfE/MoH 2003 microbiological guidelines for freshwater recreational areas are indicative only as their application should be restricted to the summer bathing season (i.e., 1 November to 31 March) Table 4.1 and Figure 4.24 indicate that most stream monitoring sites recorded high E. coli counts on at least one occasion during the monitoring period. In some cases, for example Owhiro Stream below Riverside Road and the Meggatburn at Berwick Road, this coincided with stock in the water or along the streambanks. In most cases, the highest counts were recorded when sampling days coincided with rainfall events, notably 14 November 2001 and 28 May 2002 (Figure 4.25).
Eschericia Coli MPN/100mL
l Stm Milners RdSil.Stm 3M Hill
Stm Gordons RdSil.Stm RiversideOwhiro WingatuiOwhiro Burns Sthiro ds Riverside
Taieri Outrameri ds Lindsays Raieri Murrays Rd
Taieri AllantonTaieri SH1
ieri Henley Ferryk Woodside GlenChl Grainger RdCon. Chl No.4 Br
aipori Scenic ResWaipori HB Br Rd
atburn Berwick Bnamed Clarendon
0 2 4 6 8
*Mill Stm – Milners Rd *Silverstream – 3-M Hill
*Silverstream – Gordon Rd Silverstream – Riverside Rd
*Owhiro Stm – Wingatui Rd Owhiro Stm – Burns St
Owhiro Stm – Riverside Rd Taieri R – Outram Glen
*Taieri R – Lindsays Rd Taieri R – Murray Rd
Taieri R – Allanton Taieri R – SH1
Taieri R – Henley-Ferry *Lee Ck – Woodside Glen Contour Ch – Grainger Rd
Contour Ch – No. 4 Br. *Waipori R – Scenic Reserve
Waipori R – Hen-Ber Rd *Meggatburn – Berwick Rd
*Unnamed Stm – Clarendon Rd
2,000 4,000 6,000 8,000
MfE/MoH 2003 Acceptable/Green & Action/Red Modes
0

Report on the Surface Water Quality of the Lower Taieri River Catchment ______________________________________________________________________________________
________________________________________________________________________
52
E. coli counts varied greatly across the Lower Taieri drainage network (Figure 4.26). The A1 Drain recorded both the lowest median count and the highest individual count of all 10 drain monitoring sites, with a median of 57 MPN/100 ml in McKays Triangle compared with median and maximum counts of 585 MPN/100 ml and 46,1000 MPN/100 ml (respectively) four kilometres downstream at the confluence with the Taieri River. The highest median count was recorded in Lee Canal at Miller Road (2,150 MPN/100 ml). Other sites with high median counts were the Main Drain at both Marshall Road (780 MPN/100 ml) and Miller Road (500 MPN/100 ml), and Kirks Drain at Marshall Road (360 MPN/100 ml).
Figure 4.25 E. coli counts recorded in various waterways in the lower Taieri River catchment over October 2001 to September 2002 inclusive
0
1,000
2,000
3,000
4,000
5,000
6,000
7,000
8,000
Oct-01 Jan-02 Apr-02 Jul-02 Oct-02
E. c
oli (
MPN
/100
ml)
Mill Stm - Milners RdSilverstm - 3-M HillSilverstm - Gordons RdSilverstm - Riverside RdOw hiro Stm - Burns StOw hiro Stm - Riverside RdTaieri R - Outram GlenTaieri R - Lindsay RdTaieri R - Murray RdTaieri R - AllantonTaieri R - below SH1Taieri R - Henley FerryLee Ck - Woodside GlenContour Ch - Grainger RdContour Ch - No.4 BridgeWaipori R - Scenic ResWaipori R - Hen-Bw k Rd Br.Meggatburn - Berw ick RdUnnamed Stm - Clarendon Rd

Report on the Surface Water Quality of the Lower Taieri River Catchment ______________________________________________________________________________________
______________________________________________________________________________________
53
Figure 4.26 Box plot summarising E. coli counts in various drains in the lower Taieri River catchment over October 2001 to September 2002 inclusive 4.8 Periphyton and Macroinvertebrates
4.8.1 Definition and Significance
Periphyton is the slimy material attached to the surfaces of rocks and other bottom substrate in rivers and streams. It is comprised of algae, diatoms, bacteria and fungi. It plays a key role in aquatic food webs because it is the main source of food for benthic invertebrates, which in turn are an important food source for fish. Excessive periphyton growths are unsightly and reduce the aesthetic and recreational values of a river. Excessive growths can also negatively affect fish and invertebrate communities. Macroinvertebrates are organisms that lack a backbone and are larger than 250 microns in size. Four major groups of macroinvertebrates exist; insects such as mayflies, caddisflies and dragonflies, molluscs such as snails and mussels, crustaceans such as freshwater shrimps and amphipods, and oligochaetes such as aquatic worm species that live in muddy streambeds. Periphyton and macroinvertebrates can serve as good indicators of ecological change in freshwater environments. For example, changes in abundance (density) of macroinvertebrates can indicate changes in periphyton productivity, which may be indicative of increased nutrient inputs. Different macroinvertebrate species also have different tolerances to environmental factors such as dissolved oxygen, nutrients and fine
Eschericia Coli MPN/100mL
ll Stm @ McKays TnDrain @ McKays TnA1 Drain Taieri Rvr
O13 Drain River. RdMain Drain Miller Rd
Main Drain Marsh. RdMain Drain Wai. PS
Kirks Drain Mars. RdLee Canal Miller RdLee Canal Mars. Rd
0 1 2 3 4 5
*Mill Stm – McKays Tr. *A1 Drain – McKays Tr.
A1 Drain – Taieri R
*O13 Drain – Riverside Rd
Main Drain – Miller Rd Main Drain – Marshall Rd
Main Drain – Waipori PS
Kirks Drain – Marshall Rd
*Lee Canal – Miller Rd Lee Canal - Marshall Rd
Eschericia coli MPN/100mL
0 10,000 20,000 30,000 40,000 50,000

Report on the Surface Water Quality of the Lower Taieri River Catchment ______________________________________________________________________________________
________________________________________________________________________
54
sediment, such that the presence or absence of different species in an environment may indicate changes in water quality. 4.8.2 Guidelines
The New Zealand Periphyton Guidelines (Ministry for the Environment 2000) outline a range of guidelines for periphyton biomass and cover designed to protect various instream values including aesthetics, benthic biodiversity and trout habitat and angling. These guidelines are not considered in this report as Otago Regional Council SOE periphyton monitoring focuses only on species richness and relative abundance. Macroinvertebrate guidelines exist in the form of biotic indices that have been developed over the last 10 to 20 years. These indices are based on the number, type and abundance of macroinvertebrate taxa present at a monitoring site with different taxa assigned different “pollution sensitivity” scores ranging from 1 (pollution tolerant) to 10 (pollution sensitive) (e.g., Stark, 1985, Stark 1998). Indices used by the Otago Regional Council include:
• Species richness: the number of taxa present • Macroinvertebrate community index (MCI): a sensitivity score based solely on
the number of different taxa present • Semi-quantitative macroinvertebrate community index (SQMCI): a sensitivity
score based on the number of different taxa present and the relative abundance of each taxon
• % EPT Richness: the percentage of pollution-sensitive Empheroptera (mayfly), Plecoptera (stonefly) and Trichoptera (caddisfly) groups present
4.8.3 Results
The results of periphyton and macroinvertebrate sampling undertaken in March 2002 and February/March 2003 are summarised in Table 4.4 and Table 4.5. The full results are presented in Appendix 3. The periphyton community in the lower Taieri River was dominated by taxa common and widespread throughout New Zealand, notably Gomphoneis spp. (Outram), Melosira varians (Outram and Allanton) and Oedogonium (Allanton), (Table 4.4). The Silverstream upstream of Three Mile Hill Road supported the greatest range of taxa, and this is reflected in a healthy and diverse macroinvertebrate community at this site (Table 4.5). In contrast periphyton cover was sparse in the lower reaches at Riccarton Road, which may partly be related to greatly reduced flows in these reaches. Under low or stable flow conditions, grazing invertebrates can reach sufficient densities to significantly reduce the abundance of periphyton. This occurred in the lower Silverstream during the 1998-1999 drought when a single 400 ml macroinvertebrate sample was found to contain an estimated 70,000 Physa snails (Otago Regional Council 2000b).

Report on the Surface Water Quality of the Lower Taieri River Catchment ______________________________________________________________________________________
______________________________________________________________________________________
55
Table 4.5 indicates that both Potamopyrgus antipodarum and Physa snails were among the dominant taxa from this site in 2003. The Owhiro Stream at Burns Street was dominated by Oedogonium, an extremely common and widespread filamentous green algae. Only a few other taxa were found at this site.
Table 4.4 Species richness and dominant taxa for single replicate periphyton samples collected from riffle habitats at SOE monitoring sites in the lower Taieri River catchment in March 2002 and March 2003
Monitoring Site Year Species Richness Dominant Taxa† 2002 8 Gomphoneis spp. Melosira varians Taieri River – Outram Glen 2003 12 Gomphoneis spp. 2002 13 Melosira varians, Phormidium Taieri River – Allanton 2003 14 Oedogonium
Silverstream – 3 Mile Hill 2003 19 Synedra ulna, Cymbella kappii Silverstream - Riccarton Rd 2003 3 Stigeoclonium Owhiro Stream - Burns St 2003 5 Oedogonium † Abundance classes 7 and 8 of Biggs & Kilroy’s (2000) scale of relative abundance
The macroinvertebrate results indicate that fairly healthy instream communities were present at all monitoring sites, with the exception of Owhiro Stream at Burns Street (Table 4.5). The Silverstream above Three-Mile Hill Road recorded the greatest number of taxa (30), with over 50% of the taxa belonging to the mayfly, stonefly and caddisfly groups. The Taieri River also supported a healthy range of macroinvertebrates, including many pollution sensitive taxa. The difference in MCI and SQMCI scores between the Outram and Allanton sites reflect differences in habitat rather than water quality (at Outram the river flows over cobbles providing a good riffle habitat while at Allanton the river flows over a pebble substrate). Similar habitat differences exist in the Silverstream at Three Mile Hill and in the lower reaches at Riccarton Road. The Three Mile Hill site has a more stable substrate comprised of tightly packed cobbles whereas the substrate at Riccarton Road is comprised largely of smaller and more mobile pebbles. The superior habitat at Three Mile Hill is a key reason why there is a greater range of macroinvertebrates at this site compared with further downstream. However, other factors may also be important, notably reduced flows in the lower reaches below the Dunedin City Council’s water supply extraction and stormwater discharges from the Mosgiel industrial and residential area. This is discussed further in Section 5.

Report on the Surface Water Quality of the Lower Taieri River Catchment ______________________________________________________________________________________
________________________________________________________________________
56
Table 4.5 Species richness, MCI, SQMCI and EPT scores for single replicate macroinvertebrate samples collected from riffle habitats in the lower Taieri River catchment in March 2002 and February/March 2003
Monitoring Site Year Species Richness
MCI SQMCI % EPT Dominant Taxa†
2002 19 92.6 6.57 63.2 Deleatidium spp., Pycnocentria evecta, Hydora nitida, Orthocladiinae
Taieri R - Outram Glen
2003 17 105.9 5.35 52.9 Aoteapsyche spp., Pycnocentria spp., Elmidae, Deleatidium spp., Chironominae, Oligochaeta
2002 12 91.7 4.83 41.7 Potamopyrgus antipodarum, Deleatidium spp., Hydora nitida, Paracalliope fluviatilis
Taieri R - Allanton
2003 18 93.3 3.65 50.0 Paracalliope fluviatilis, Potamopyrgus antipodarum, Oligochaeta, Pycnocentria spp., Oxyethira albiceps, Elmidae, Ostracoda
Silverstm – 3 Mile Hill 2003 30 110.0 4.95 53.3 Olinga spp., Pycnocentria spp., Pycnocentrodes spp., Deleatidium spp., Aoteapsyche spp., Potamopyrgus antipodarum, Orthocladiinae, Elmidae, Oxyethira albiceps, Chironominae, Oligochaeta
Silverstm - Riccarton Rd 2003 18 83.3 3.49 38.9 Potamopyrgus antipodarum, Physa spp., Ostracoda, Elmidae, Orthocladiinae
Owhiro Stm - Burns St 2003 10 58.0 2.57 0 Potamopyrgus antipodarum Physa spp., Sphaerium spp., Ostracoda, Orthocladiinae, Oligochaeta
Interpretation of Scores: • MCI >120 or SQMCI >6 = clean water & good habitat, e.g. fast-flowing water over clean cobbles • MCI 100-200 or SQMCI 5 - 6 = doubtful quality or possible mild pollution • MCI 80–100 or SQMCI 4 – 5 = probable moderate pollution • MCI <80 or SQMCI <4 = probable severe pollution • † Abundance classes VA and VVA of Stark’s (1998) SQMCI
The macroinvertebrate community in the Owhiro Stream at Burns Street is severely impoverished. Only 10 taxa were identified from sampling undertaken in March 2003, and the dominant taxa were typical of those found in nutrient enriched waters (snails, oligochaete worms, orthoclad midges). These findings are consistent with previous sampling undertaken in the late 1990s (Otago Regional Council 2000b). 4.9 Recreational Water Quality
The results of the 2001/2002 summer recreational water quality monitoring are summarised in Table 4.6. The Taieri River at Outram Glen was the only site to exceed
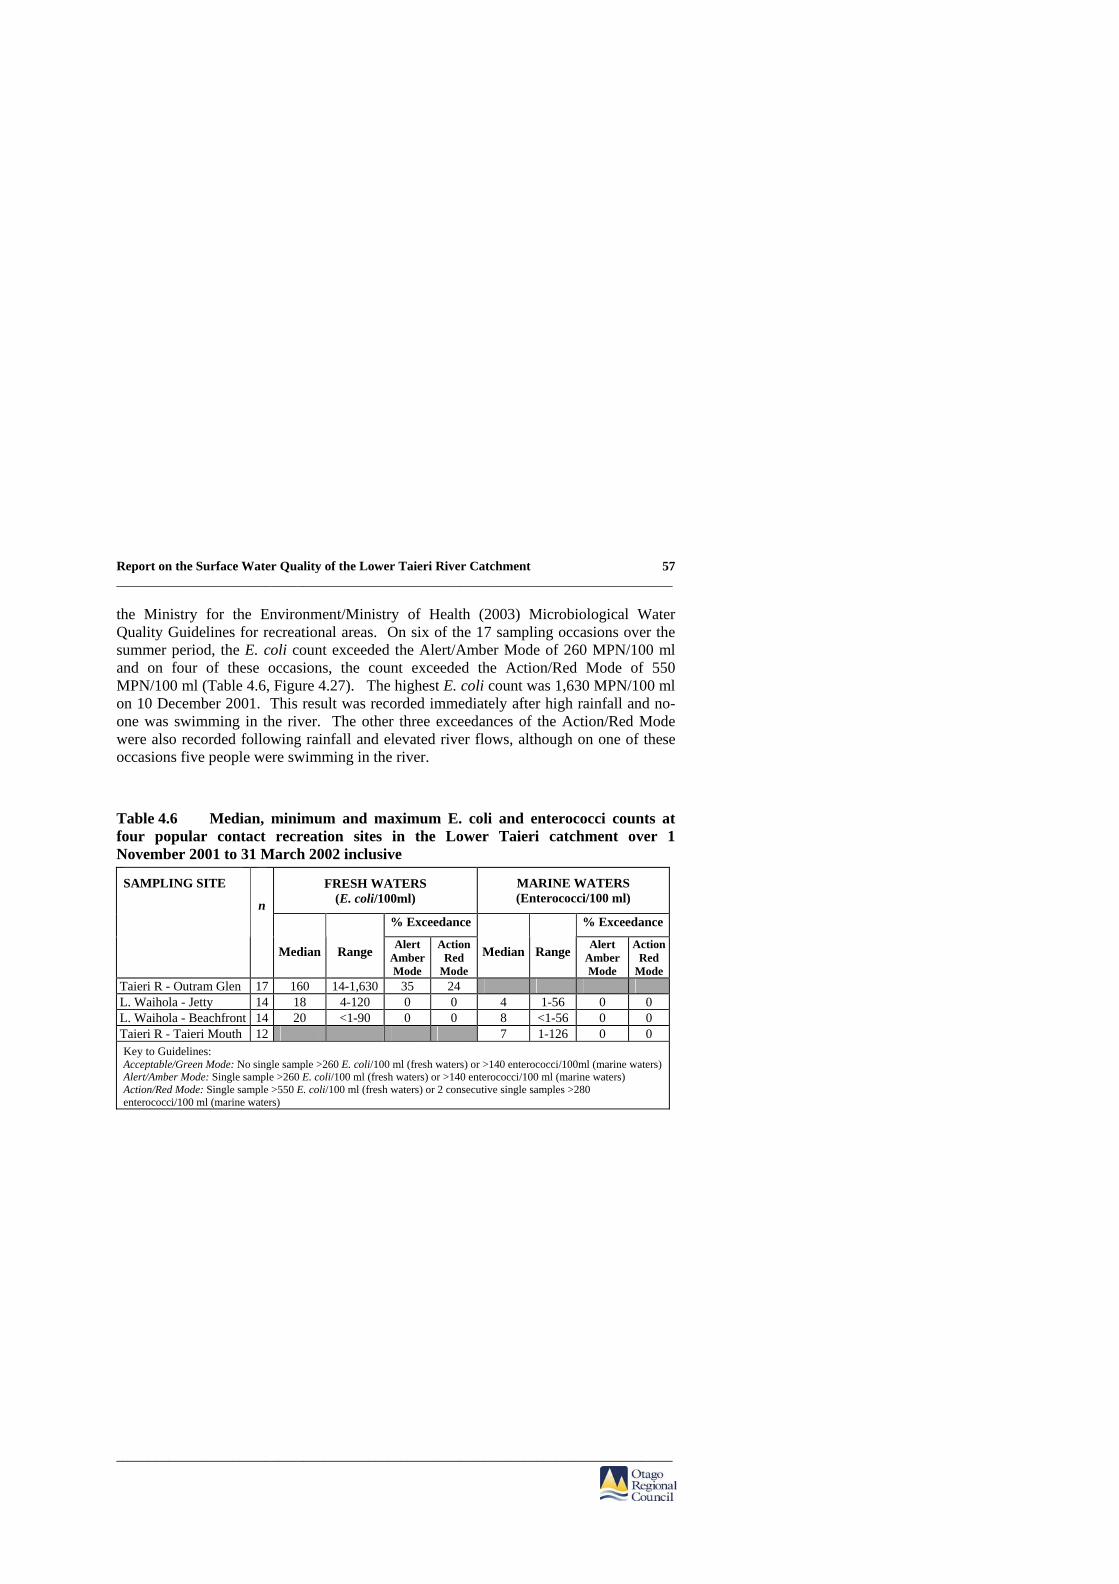
Report on the Surface Water Quality of the Lower Taieri River Catchment ______________________________________________________________________________________
______________________________________________________________________________________
57
the Ministry for the Environment/Ministry of Health (2003) Microbiological Water Quality Guidelines for recreational areas. On six of the 17 sampling occasions over the summer period, the E. coli count exceeded the Alert/Amber Mode of 260 MPN/100 ml and on four of these occasions, the count exceeded the Action/Red Mode of 550 MPN/100 ml (Table 4.6, Figure 4.27). The highest E. coli count was 1,630 MPN/100 ml on 10 December 2001. This result was recorded immediately after high rainfall and no-one was swimming in the river. The other three exceedances of the Action/Red Mode were also recorded following rainfall and elevated river flows, although on one of these occasions five people were swimming in the river.
Table 4.6 Median, minimum and maximum E. coli and enterococci counts at four popular contact recreation sites in the Lower Taieri catchment over 1 November 2001 to 31 March 2002 inclusive
FRESH WATERS (E. coli/100ml)
MARINE WATERS (Enterococci/100 ml)
% Exceedance % Exceedance
SAMPLING SITE
n
Median
Range Alert Amber Mode
Action Red
Mode
Median
Range Alert Amber Mode
Action Red
ModeTaieri R - Outram Glen 17 160 14-1,630 35 24 L. Waihola - Jetty 14 18 4-120 0 0 4 1-56 0 0 L. Waihola - Beachfront 14 20 <1-90 0 0 8 <1-56 0 0 Taieri R - Taieri Mouth 12 7 1-126 0 0 Key to Guidelines: Acceptable/Green Mode: No single sample >260 E. coli/100 ml (fresh waters) or >140 enterococci/100ml (marine waters) Alert/Amber Mode: Single sample >260 E. coli/100 ml (fresh waters) or >140 enterococci/100 ml (marine waters) Action/Red Mode: Single sample >550 E. coli/100 ml (fresh waters) or 2 consecutive single samples >280 enterococci/100 ml (marine waters)

Report on the Surface Water Quality of the Lower Taieri River Catchment ______________________________________________________________________________________
________________________________________________________________________
58
Figure 4.27 E. coli counts recorded in the Taieri River at Outram Glen over 1 November 2001 to 31 March 2002 inclusive Although very low bacteria counts were found in surface water samples collected from Lake Waihola, it should be noted that the lake was very calm during the summer monitoring period and greater bacteria counts would be expected in windy conditions as a result of disturbance of sediment from the lake bed. Moreover, the calm summer conditions contributed to a potentially toxic blue-green algal bloom in early 2002 (Figure 4.28). This bloom, identified as Anabaena flosaquae, resulted in the lake being closed to contact recreation for several months. The bloom reappeared for a short period over the 2002-2003 summer but was not seen over the 2003-2004 summer.
0
200
400
600
800
1,000
1,200
1,400
1,600
1-Nov-01 25-Nov-01 19-Dec-01 12-Jan-02 5-Feb-02 1-Mar-02 25-Mar-02
E. c
oli
(MP
N/1
00 m
l)
Action/Red Mode: Single result >550 E. coli/100 mlAlert/Amber Mode: Single result >260 E. coli/100 mlAcceptable/Green Mode: No single result >260 E. coli/100 ml

Report on the Surface Water Quality of the Lower Taieri River Catchment ______________________________________________________________________________________
______________________________________________________________________________________
59
Figure 4.28 Blue-green algal bloom in Lake Waihola, February 2002

Report on the Surface Water Quality of the Lower Taieri River Catchment ______________________________________________________________________________________
________________________________________________________________________
60
5 Discussion
Several key findings emerge from the monitoring results presented in Section 4. Firstly the Owhiro Stream has particularly poor water quality and an impoverished periphyton and macroinvertebrate community. Secondly, there were a number of localised impacts on water quality that appear to be directly related to landuse practices adjacent to, or upstream of, specific monitoring sites. These are discussed below in relation to the lower Taieri River, tributaries, and the lower Taieri Plain drainage system. Key water quality problems and their likely causes are also discussed. 5.1 Lower Taieri River
Water quality in the lower Taieri River below Outram was found to be relatively good during the course of the monitoring programme, with very few analytes exceeding the ANZECC 2000 default trigger values. However, elevated E. coli counts were recorded on a number of occasions at all six sites. This probably reflects stock access at some sites (e.g., cattle below Outram Glen) and polluted tributary inputs (e.g., Owhiro Stream, A1 Drain). Activity higher in the catchment will also play a role. For example, agricultural modification of the Lee Stream catchment has at times contributed sediment to the Taieri River above Outram Glen. Lee Stream also carries natural foams and froths into the Taieri River which, when observed downstream on the Taieri Plain, are often reported to the Otago Regional Council as suspected pollution incidents (Figure 5.1).
Figure 5.1 Natural foams and tannin stained water entering the lower Taieri River from Lee Stream (February 2002)

Report on the Surface Water Quality of the Lower Taieri River Catchment ______________________________________________________________________________________
______________________________________________________________________________________
61
Although median nitrogen and phosphorus concentrations were below the ANZECC 2000 default trigger values at all sites, Figure 5.1 indicates that there is a trend of increasing ammoniacal nitrogen concentrations with distance downstream from Outram Glen (where it was consistently below detection limits) to State Highway 1 (where the median concentration hovered around the ANZECC 2000 default trigger value of 0.021 mg/L). Increasing tributary and drain inputs as the river meanders across the Taieri Plain are the likely reason for this. Elevated concentrations can also be expected below State Highway 1 as a result of adjacent land use. Dairy cows are grazed on very low lying land adjacent to the flood-free highway. A series of drainage channels dissect this land and discharge surface and subsurface water to the Taieri River. There is also a ditch that enters the true left bank of the river above the monitoring site that drains land utilised by both dairy cows and wildlife. Table 5.1 indicates that the Allanton site, compared to the reference site at Outram Glen has the most elevated bacteria counts. This may be due to the influence of the Owhiro Stream which enters the Taieri River only a few hundred metres upstream of Allanton. Henley-Ferry differs from the other Taieri River monitoring sites in that it receives the tidal outflow from Lakes Waipori and Waihola. Tidal exchange, coupled with a silty substrate, explain the elevated conductivity and turbidity values at this site. The Henley-Ferry site also had lower bacteria counts than the other Taieri River sites. This may be related to tidal exchange and subsequent changes in salinity although sampling was always restricted to an outgoing tide. Table 5.2 summarises physico-chemical and microbiological water quality data collected between December 2000 – December 2002 from all Otago Regional Council SOE monitoring sites on the Taieri River. These sites include Stonehenge, Halls Bridge and Waipiata in the upper reaches, Middlemarch in the mid reaches and Outram Glen and Allanton in the lower reaches. Henley Ferry was excluded from the table owing to its tidal properties. Table 5.2 indicates that median values of many water quality analytes are generally lower at Outram and Allanton than in the middle and upper reaches. The key exceptions are ammoniacal nitrogen and nitrite-nitrate nitrogen which are highest at Allanton. The lower Taieri River macroinvertebrate sampling results indicate a slight decline in the macroinvertebrate community between Outram and Allanton. However as noted in Section 4.9.3, this is likely to reflect significant differences in habitat rather than poorer water quality at Allanton.

Report on the Surface Water Quality of the Lower Taieri River Catchment ______________________________________________________________________________________
________________________________________________________________________
62
Table 5.3 summarises the results of single kick net samples collected at all Otago Regional Council SOE biomonitoring sites on the Taieri River during summer/autumn 2002, including an extra sample collected from Creamery Road. The results again emphasise the influence that habitat variables such as substrate stability and heterogeneity can have on community index scores. The high scoring sites (Stonehenge, Cottesbrook and Outram Glen) all have a relatively tightly packed cobble substrate with good riffles that are able to support a greater range of pollution-sensitive stoneflies, mayflies and caddisflies than the more mobile pebble-dominated substrate, such as that which exists at the lower scoring sites (Creamery Road, Waipiata and Allanton).

Report on the Surface Water Quality of the Lower Taieri River Catchment _________________________________________________________________________________________________________________________________________________________________________________________________________________
_________________________________________________________________________________________________________________________________________________________________________________________________________________
63
Table 5.1 Median physico-chemical and microbiological water quality data for the lower Taieri River catchment monitoring sites over October 2001 to September 2002 inclusive with % increase (+) or % decrease (-) compared with the median value for Outram
Dissolved Oxygen (% Saturation)
Turbidity (NTU)
Conductivity (mS/cm)
E. coli (MPN/100 ml)
Nitrite-Nitrate Nitrogen (mg/L)
Ammoniacal Nitrogen (mg/L)
Total Nitrogen (mg/L)
Dissolved Reactive Phosphorus
(mg/L)
Total Phosphorus
(mg/L) Median % change Median % change Median % change Median % change Median % change Median % change Median % change Median % change Median % change
Outram 111 1.94 0.068 135 0.0225 0.005 0.275 0.0025 0.028
Lindsay Rd 96 -14 2.88 +48 0.068 +0 105 -22 0.0335 +49 0.005 0 0.31 +13 0.0043 +70 0.029 +4
Murray Rd 82 -26 3.03 +56 0.069 +1 115 -15 0.0335 +49 0.015 +200 0.26 -6 0.0038 +50 0.03 +7
Allanton 96 -14 2.07 +7 0.076 +11 155 +15 0.0365 +62 0.0125 +150 0.295 +7 0.0038 +50 0.033 +18
SH1 86 -23 2.2 +13 0.076 +11 130 -4 0.0275 +22 0.025 +400 0.265 +7 0.006 +140 0.0205 -27
Henley-Ferry 90 -19 6.45 +332 1.055 +1451 72 -47 0.0235 +4 0.0075 +50 0.28 +2 0.006 +140 0.023 -18
Table 5.2 Selected physico-chemical and microbiological water quality data for Otago Regional Council Taieri River SOE monitoring sites, December 2000-December 2002*
Suspended Solids (mg/L)
Turbidity (NTU)
Clarity (m)
Faecal Coliforms (cfu/100 ml)
E. coli (MPN/100 ml)
Nitrite-Nitrate Nitrogen (mg/L)
Ammoniacal Nitrogen (mg/L)
Total Nitrogen (mg/L)
Dissolved Reactive Phosphorus
(mg/L)
Total Phosphorus (mg/L)
Median n Median n Median n Median n Median n Median n Median n Median n Median n Median n
Upper Taieri
Stonehenge 2.0 21 1.4 22 1.63 21 78 22 58 22 0.010 22 0.005 22 0.265 22 0.003 22 0.013 22
Halls Bridge 1.0 22 2.2 22 1.28 21 200 22 156 22 0.006 22 0.005 22 0.355 22 0.010 22 0.036 22
Waipiata 11.5 16 3.7 16 0.85 15 355 16 305 16 0.012 16 0.010 16 0.365 16 0.010 16 0.043 16
Mid Taieri
Cottesbrook Bridge 12.0 11 4.9 11 0.80 11 180 11 130 11 0.021 11 0.005 11 0.300 11 0.005 11 0.031 11
Lower Taieri
Outram Glen 2.5 14 2.8 19 1.05 13 106 18 100 31 0.029 19 0.005 19 0.270 19 0.004 19 0.026 19
Allanton 7.5 4 2.7 14 1.00 2 145 8 145 14 0.040 14 0.020 14 0.305 14 0.003 14 0.027 14
* Note that due to differences in sampling frequency between standard SOE sites and SOE sites included in intensive catchment monitoring programmes, the number of samples from which the median values are determined varies from site to site.

Report on the Surface Water Quality of the Lower Taieri River Catchment ________________________________________________________________________________________________________________________________________________________________________________________________________________
______________________________________________________________________________________________________________________________________________________________________________
64
Table 5.3 Species richness, macroinvertebrate community index (MCI) and semi-quantitative macroinvertebrate community index (SQMCI) values for single macroinvertebrate samples collected from riffle flow habitats in the Taieri River in March 2002
Upper Taieri Mid Taieri Lower Taieri Biological Index
Stonehenge Creamery Rd Waipiata Cottesbrook Br Outram Glen Allanton*
Species Richness: number of taxa present 14 20 12 14 19 12
MCI: a sensitivity score based solely on the number of different taxa present
121.4 97.0 98.3 111.4 92.6 91.7
SQMCI: a sensitivity score based on the number of different taxa present and the relative abundance of each taxon
7.32 6.40 6.71 6.68 6.57 4.83
% EPT Richness: the percentage of pollution-sensitive Empheroptera (mayfly), Plecoptera (stonefly) and Trichoptera (caddisfly) groups present
64.3 55.0 41.7 64.3 63.2 41.7
Dominant Substrate: A key habitat feature that influences which macroinvertebrates inhabit the site. Examples include boulders, cobbles, pebbles, gravel, sand and mud.
Cobbles Pebbles Pebbles Cobbles Cobbles Pebbles & Gravel
Interpretation of Scores: • MCI >120 or SQMCI >6 = clean water (and good habitat, e.g., fast-flowing water over clean stones) • MCI 100-120 or SQMCI 5-6 = doubtful quality or possible mild pollution • MCI 80-100 or SQMCI 4-5 = probable moderate pollution • MCI <80 or SQMCI<4 = probable severe pollution * This site was regarded as a “run” and naturally will not support the same diversity of taxa as a riffle habitat
This page has been left blank intentionally.

Report on the Surface Water Quality of the Lower Taieri River Catchment ______________________________________________________________________________________
65
5.1.1 Water Quality Over Time
It is beyond the scope of this report to undertake a detailed analysis of historical lower Taieri River water quality data6. However given that previous SOE monitoring has identified degraded water quality at Allanton (Otago Regional Council 1999) and the results of the 2001-2002 monitoring programme indicate otherwise, a simple time series analysis of selected water quality analytes was undertaken for Outram Glen and Allanton. Although Outram Glen water quality records date back to the early 1980s, routine SOE monitoring only commenced in August 1994 and therefore the period of time considered in the time series analysis is August 1994 to August 2003. The same time period was selected for Allanton although the water quality record is less complete, with only a few samples collected between 1998 and 2001. As E. coli counts have only been routinely monitored at SOE sites since 1998, only faecal coliform data were examined. In addition, as many water quality analytes exhibit seasonal variation throughout the year (e.g., temperature, nutrients), the Seasonal Kendall test was used to remove this variation and display the true underlying trend. A p-value of less than 0.05 was deemed a significant result (refer Appendix 4 for full statistical analyses). Table 5.4 indicates that there has not been any significant change in turbidity levels or faecal coliform counts at Outram Glen between 1994 and 2003. Nutrient concentrations have decreased, although in most cases the decreases are very small despite being statistically significant.
Table 5.4 Seasonal Kendall test results for selected water quality analytes monitored in the Taieri River at Outram Glen between August 1994 and August 2003 inclusive
n Z-Statistic Slope p-value Significant Trend Turbidity (NTU) 59 -2.161 -0.1962 >0.2 No Faecal Coliforms (cfu/100ml) 56 0.1014 0.6665 >0.2 No Nitrite-Nitrate Nitrogen (mg/L) 59 -3.314 -0.0064 <0.05 Yes - decrease Ammoniacal Nitrogen (mg/L) 59 -3.005 -0.0010 <0.05 Yes - decrease Total Nitrogen (mg/L) 46 -2.065 -0.02 <0.05 Yes - decrease Diss. Reactive Phosphorus (mg/L) 59 -2.829 -0.0005 <0.05 Yes - decrease Total Phosphorus (mg/L) 59 -2.494 -0.0020 <0.05 Yes - decrease
Note: Slope = Units per year In contrast, there has been a significantly more marked decrease in the concentrations of all forms of nitrogen and phosphorus at Allanton, as well as turbidity levels and faecal coliforms counts during this period (Table 5.5). From Figure 5.2 it can be seen that the significant decline in total phosphorus concentrations dates from the last few years. Similar trends were observed with the ammoniacal nitrogen and faecal coliform data 6 Detailed analyses of water quality over time are addressed in the Otago Regional Council’s Taieri River Catchment Monitoring Report (1999) which is to be updated later in 2004.

Report on the Surface Water Quality of the Lower Taieri River Catchment ________________________________________________________________________
_______________________________________________________________________________________________________
66
record (Appendix 4). This improvement in water quality coincides with the removal of the Mosgiel sewage discharge from the Taieri River in July 2000. To confirm this is the case, one-sided Mann Whitney (Wilcoxin) tests were undertaken to compare median nutrient concentrations and faecal coliform counts pre- and post July 2000 (Table 5.6, Appendix 5). The results confirm that there has been significant (p<0.05) decreases in median turbidity levels, faecal coliform counts and nutrient concentrations since October 2001 when routine water quality monitoring recommenced at Allanton.
Table 5.5 Seasonal Kendall test results for selected water quality analytes monitored in the Taieri River at Allanton between August 1994 and August 2003 inclusive
n Z-Statistic Slope p-value Significant Trend Turbidity (NTU) 37 -2.09 -0.2003 <0.05 Yes - decrease Faecal Coliforms (cfu/100ml) 31 -2.899 -61.61 <0.05 Yes - decrease Ammoniacal Nitrogen (mg/L) 39 -4.21 -0.0051 <0.05 Yes - decrease Nitrite-Nitrate Nitrogen (mg/L) 39 -2.122 -0.0069 <0.05 Yes - decrease Total Nitrogen (mg/L) 25 -0.4369 -0.0292 >0.20 No Diss. Reactive Phosphorus (mg/L) 39 -4.185 -0.0021 <0.05 Yes - decrease Total Phosphorus (mg/L) 39 -4.184 -0.0058 <0.05 Yes - decrease
Note: Slope = Units per year
Figure 5.2 Total phosphorus concentrations recorded in the Taieri River at Allanton over August 1994 to August 2003 inclusive, along with the Seasonal Kendall slope estimator (trend line)

Report on the Surface Water Quality of the Lower Taieri River Catchment ______________________________________________________________________________________
67
Table 5.6 A comparison of Taieri River water quality at Allanton, pre and post removal of the Mosgiel sewage discharge in July 2000
1994-2000 2001-2003 Mann Whitney Comparison
Water Quality Analyte
Median n Median n W statistic p-value Turbidity (NTU) 4.2 19 2.2 18 248.5 0.0096 Faecal Coliforms (cfu/100ml) 570 19 115 12 186.0 0.0019 Ammoniacal Nitrogen (mg/L) 0.051 21 0.020 18 360.0 <0.0001 Nitrite-Nitrate Nitrogen (mg/L) 0.100 21 0.043 18 274.5 0.0083 Total Nitrogen (mg/L) 0.46 7 0.31 18 96.0 0.0244 Diss. Reactive Phosphorus (mg/L) 0.018 21 0.004 18 376.0 <0.0001 Total Phosphorus (mg/L) 0.067 21 0.022 18 352.5 <0.0001
5.2 Water Quality in Tributaries of the Lower Taieri River 5.2.1 Mill Stream
Over the monitoring period Mill Stream at Milners Road was characterised by high turbidity values and quite variable E. coli counts. In contrast, nutrient concentrations were consistently below the ANZECC 2000 default trigger values. The presence of a thick cover of iron-bacteria on the rocky substrate may have some impact on turbidity levels (Figure 5.3). The source of the E. coli contamination is unclear. Although Milners Road is an upper catchment site there is some agricultural activity located higher up in the catchment that may be having some impact.
Figure 5.3 Iron-bacteria slimes in Mill Stream at Milners Road

Report on the Surface Water Quality of the Lower Taieri River Catchment ________________________________________________________________________
_______________________________________________________________________________________________________
68
5.2.2 Silverstream
Water quality was generally very good in the Silverstream during the monitoring programme, with median values of all water quality analytes below the ANZECC 2000 default trigger values at all three sites. However, elevated E. coli bacteria counts and ammoniacal nitrogen and phosphorus concentrations were recorded on several occasions. Sheep grazing along the stream banks at Three-Mile Hill contributed to occasional elevated E. coli counts at this site. Sheep were also observed in and along the stream above the Riverside Road monitoring site where they are used to control grass growth on the flood banks. The middle monitoring site at Gordon Road site is located downstream of several industrial stormwater outfalls as well as the confluence with the Mill Stream diversion channel and, as discussed in Section 5.2.1, Mill Stream has been found to carry elevated bacteria counts. Although water quality was very high during the course of the monitoring programme, the Silverstream is a watercourse that has been subjected to a number of significant pollution events in the past and remains at high risk. Several industrial stormwater outfalls discharge directly to the Silverstream, including those from an aerodrome, a meatworks processing plant and a wood moulding plant. In 2001, the Council issued an infringement notice against the meatworks for an illegal discharge of contaminants, including fat and ammonia, to the Silverstream. Further complaints about discolouration of the Silverstream have been recorded since 2001 but due to the intermittent nature of many pollution events, the cause has not always been able to be identified. The risk of significant adverse effects arising from water pollution events in the Silverstream is exacerbated by low flows, partly induced by water abstraction by the Dunedin City Council above Three Mile Hill. Low flows in the summer, coupled with a lack of streamside vegetation cover result in very high water temperatures. The highest temperature recorded during the monitoring period was 19.8°C at Riverside Road but temperatures above 25°C have been recorded in the lower stream reaches in the past. Temperatures of this magnitude severely deplete dissolved oxygen concentrations and can stress instream life and result in trout mortality. The Silverstream macroinvertebrate sampling results indicate a decline in the macroinvertebrate community between Three Mile Hill and Riccarton Road. As noted in Section 4.9.3, significant differences in physical habitat will be the primary reason for this. However, water pollution events can not be discounted either, given Riccarton Road is located below both industrial and urban areas. Spot macroinvertebrate sampling undertaken further upstream between Wingatui Road and Gordon Road by the Taieri Trust in 2003 did not identify many sensitive taxa (G. Robertson, pers. comm. 2003). This stretch of stream receives multiple industrial and residential stormwater discharges.

Report on the Surface Water Quality of the Lower Taieri River Catchment ______________________________________________________________________________________
69
5.2.3 Owhiro Stream
Water quality in Owhiro Stream was clearly the poorest of all the natural watercourses sampled during the monitoring programme. At both Gordon Road in Mosgiel and at the bottom of the catchment below Riverside Road the stream was enriched (elevated BOD), turbid and had E. coli bacteria and nutrient and concentrations that significantly exceeded the ANZECC 2000 default trigger values. This was reflected in dense periphyton growth (Figure 5.4) and an impoverished macroinvertebrate community at Burns Street.
Figure 5.4 Prolific filamentous algae growth in Owhiro Stream at Burns Street In February 2002 a third sampling site was added to the monitoring programme upstream at Wingatui Road to assess water quality in the upper catchment. Although water quality was higher at this site, Table 4.1 (refer Section 4) indicates that on occasion it was also subjected to organic inputs and had elevated bacteria and ammoniacal nitrogen concentrations. Stock (both sheep and cattle) access was confirmed as the primary contributor to poor water quality below Riverside Road (Figure 5.5). The cause of the poor water quality upstream in Mosgiel has been more difficult to identify but the enriched nature of the stream at Burns Street is consistent with sewage contamination. This could occur in one of two ways, either as a result of cross contamination with the stormwater (a number of stormwater outfalls discharge into the Owhiro Stream), or by septic tank seepage (not all households are connected to the reticulated sewerage scheme). In March 2003, Otago Regional Council compliance staff were informed by a member of the public that sewage was entering the Owhiro Stream above Gordon Road. Investigations by the Dunedin City Council traced the discharge to a block of flats. Sewage pipes from the flats had

Report on the Surface Water Quality of the Lower Taieri River Catchment ________________________________________________________________________
_______________________________________________________________________________________________________
70
accidentally been connected to the stormwater pipe that discharged to the stream. The problem was promptly rectified. Like the Silverstream, the Owhiro Stream has also been the subject of pollution events, most commonly as a result of broken sewage pipes. This occurred in the vicinity of Riverside Road in November 2000, resulting in raw sewage entering the Owhiro Stream. Other pollution events have also been recorded. For example, in 1999 a poultry farm was found discharging contaminants into a tributary of the Owhiro Stream near Wingatui.

Report on the Surface Water Quality of the Lower Taieri River Catchment ______________________________________________________________________________________
71
Figure 5.5 Bank erosion, pugging, instream sedimentation and enrichment in Owhiro Stream below Riverside Road as a result of a stock access 5.2.4 Lee Creek and Contour Channel
Lee Creek is the headwaters of the Contour Channel and, as expected, water quality at the monitoring site in the reserve at Woodside Glen was very good. The median values for all water quality analytes were below the ANZECC 2000 default trigger values, although there were occasional elevated E. coli counts, and ammoniacal nitrogen and phosphorus concentrations. Although water quality in the Contour Channel was considerably poorer than in Lee Creek proper (reflecting its drainage function), water quality was significantly higher

Report on the Surface Water Quality of the Lower Taieri River Catchment ________________________________________________________________________
_______________________________________________________________________________________________________
72
than in some of the adjacent drains. Water quality was heavily influenced by weather events, with the highest E. coli counts and nutrient concentrations recorded following high rainfall and subsequent high flows. The main factor affecting water quality during dry weather events is likely to be stock access. Dairy cows were observed grazing on the banks of the Contour Channel at both Grainger Road (Figure 5.6) and the No. 4 Bridge. On several occasions at the latter site, a significant amount of faecal matter had been deposited adjacent to the water and only a minor rise in water level would result in water contamination.
Figure 5.6 Dairy cows on the banks of the Contour Channel near Grainger Road 5.2.5 Waipori River
Waipori River water quality was monitored just inside the entrance to the Waipori Falls Scenic Reserve and in the lower reaches immediately above the confluence with the Contour Channel. As expected, water quality was very good inside the reserve, with all median analyte levels well below the ANZECC 2000 default trigger values. Elevated ammoniacal nitrogen and total phosphorus concentrations were recorded on a few occasions but the reason for this is unknown. Treated sewage from the Waipori Falls village is discharged into the river, but this discharge occurs a considerable distance upstream and is of a short, intermittent duration each day. Water quality was also good at the lower monitoring site with all median analyte levels again below the ANZECC 2000 default trigger values. As with the Contour Channel,

Report on the Surface Water Quality of the Lower Taieri River Catchment ______________________________________________________________________________________
73
the riverbed is comprised of a soft, silty substrate that is easily disturbed in wet weather events and subsequent high river flows. Such conditions occurred during the May 2002 sampling round and this coincided with the highest turbidity, E. coli and nutrient concentrations. 5.2.6 Meggatburn
Water quality is reasonable in the Meggatburn with median values of all water quality parameters below the ANZECC 2000 default trigger values. However, on several occasions very high E. coli bacteria counts and elevated ammoniacal nitrogen concentrations were recorded. The elevated results are attributed to stock (sheep) having direct access to the creek at the Berwick Road monitoring site, as forestry is the principal land use further upstream. Water quality in the lower reaches of the Meggatburn is likely to carry higher bacteria counts and nutrient concentrations, as the creek flows through more intensively farmed land before entering Lake Waipori. 5.2.7 Unnamed Tributary of Lake Waihola
Monitoring results for the “unnamed tributary” indicate water quality is poor, with most forms of nutrients exceeding the ANZECC 2000 default trigger values, some by a significant margin. Some very high E. coli bacteria counts were also recorded at the Clarendon Road site. The stream appears to be one of several watercourses draining farmland on the southwestern hillslopes behind Lake Waihola. Further investigation is required to determine whether there are any point source discharges into the stream (e.g., farm drains). Geese and ducks were abundant at the sampling site and sheep can also access the stream (Figure 5.7), but it is likely that there are other sources of nutrients to the stream.

Report on the Surface Water Quality of the Lower Taieri River Catchment ________________________________________________________________________
_______________________________________________________________________________________________________
74
Figure 5.7 Sheep on the banks of the unnamed tributary at Clarendon Road 5.3 Water Quality in the Lower Taieri Catchment Drains
5.3.1 Mill “Stream” Drain
Mill “Stream” Drain (as opposed to the natural Mill Stream which was monitored at Milners Road) recorded among the lowest turbidity levels, nutrient concentrations and bacteria counts of the lower Taieri drains. Although this probably reflects the less intensive landuse in the area of East Taieri catchment that it drains (predominantly sheep farming), higher contaminant levels would be expected from an agricultural catchment, particularly E. coli (median 91 MPN/100 ml). 5.3.2 A1 Drain
The A1 Drain also drains a portion of the East Taieri and the site at McKays Triangle had similar water quality to “Mill Stream” at McKays Triangle, including a surprisingly low median E. coli count of just 57 MPN/100 ml. However, there was a significant decline in water quality between the reserve site and the lower site at the confluence of the Taieri River (Figure 5.7). Water quality at the bottom site was characterised by high turbidity levels and E. coli counts (up to 46,100 MPN/100 ml). Nutrient concentrations were also significantly higher at this site.

Report on the Surface Water Quality of the Lower Taieri River Catchment ______________________________________________________________________________________
75
Table 5.7 Selected summary water quality data for the A1 Drain, October 2001-May 2002 inclusive*
McKays Triangle Taieri River confluence Media
n Min Max Media
n Min Max
Turbidity (NTU) 5.8 2.6 13.8 14.8 7.9 51.3 E. coli (MPN/100ml) 57 16 560 1,500 290 46,100 Ammoniacal Nitrogen (mg/L) 0.085 0.03 0.88 0.320 0.02 2.08 Total Nitrogen (mg/L) 0.92 0.42 1.60 1.59 0.69 3.32 Total Phosphorus (mg/L) 0.087 0.014 0.224 0.122 0.050 0.249
* Only the A1 Drain at the Taieri River was monitored through to September 2002 The reason for the dramatic decline in water quality between the sampling sites is largely attributed to stock access below Riverside Road (between McKays Triangle and Riverside Road the drain is fenced and bordered by thick riparian grasses). Sheep, and also dairy cows at times, had direct access to the lower sampling site and there is evidence of considerable damage to the drain banks and bed as a result (Figure 5.8).
Figure 5.8 The A1 Drain above the floodgates to the Taieri River, with obvious signs of recent stock access

Report on the Surface Water Quality of the Lower Taieri River Catchment ________________________________________________________________________
_______________________________________________________________________________________________________
76
5.3.3 O13 Drain
Water quality in the O13 Drain was found to be more turbid but otherwise similar to that recorded in Mill “Stream” and the A1 Drain at McKays Triangle. Only six sample results were obtained from this drain as the original site located at Murray Road was dry on the first two sampling occasions and had to be shifted to Riverside Road. The O13 Drain only had sufficient flow on one sampling occasion (28 May 2002) to result in a discharge to Owhiro Stream. 5.3.4 Main Drain
The Main Drain, as with the other drains on the West Taieri, exhibited the poorest water quality during the monitoring programme. The uppermost site at Miller Road (above Dunedin International Airport) recorded the highest nutrient concentrations while the Marshall Road site had the highest E. coli counts and lowest dissolved oxygen concentrations. BOD concentrations up to 40 mg/L were also recorded at these two sites. Such concentrations are equivalent to those found in effluent discharges from many municipal oxidation ponds. In contrast, contaminant levels were significantly lower further downstream at the Waipori Pump Station. Point source discharges are believed to be the primary cause of degraded water quality at Miller Road, and probably also Marshall Road. At Miller Road, the Main Drain is joined by the #28 Drain on the true right bank. This drain discharged black, anoxic water into the Main Drain during the 12 month water quality monitoring programme (Figure 5.9). One-off samples collected from two sites on the #28 Drain in March 2002 indicated significant contamination was occurring in the short stretch of drain between McLeod Road and Miller Road. Although both sampling sites recorded elevated BOD concentrations, the lower sampling site located immediately above the confluence with the Main Drain recorded significantly higher turbidity, ammoniacal nitrogen, total nitrogen and total phosphorus concentrations (Table 5.8).

Report on the Surface Water Quality of the Lower Taieri River Catchment ______________________________________________________________________________________
77
Figure 5.9 Black enriched water from the #28 Drain (left) entering the Main Drain at Miller Road
Table 5.8 Results of one-off water quality sampling in the #28 Drain, 8 March 2002
McLeod Road Miller Road Turbidity (NTU) 40.4 152 BOD (mg/L) 14 16 E. coli (MPN/100mL) 1,900 300 Ammoniacal Nitrogen (mg/L) 6.29 45.3 Total Nitrogen (mg/L) 10.3 64.3 Total Phosphorus (mg/L) 1.86 6.90
In October 2002 an investigation into the dairy farm through which the #28 Drain runs revealed that dairy effluent had been entering the drain. A land-based effluent disposal system had been in place for about a year but the holding pond lacked a backflow prevention valve. The problem was promptly rectified resulting in an improvement in water clarity in the Main Drain at Miller Road. Although no point source discharges were identified in the immediate vicinity of the Main Drain sampling site at Marshall Road7, treated sewage from Dunedin International Airport (including the township of Momona) is discharged directly into the Main Drain approximately 4 km upstream adjacent to the airport entrance. This discharge is rich in
7 Although no discharges were identified during the monitoring programme, routine dairy farm inspections by Council compliance staff found dairyshed effluent entering the Main Drain immediately below Marshall Road in July 2003.

Report on the Surface Water Quality of the Lower Taieri River Catchment ________________________________________________________________________
_______________________________________________________________________________________________________
78
several contaminants, with ammoniacal nitrogen concentrations at times up to 45 mg/L8. The current discharge is authorised by Discharge Permit 94227 and is due to expire on 31 October 2004. Of particular concern in the Main Drain was the series of near-zero dissolved oxygen readings recorded over October 2001 to March 2002 inclusive at both Marshall Road and the Waipori Pump Station. Under such anoxic conditions, contaminants bound to sediments in the drain (e.g., phosphorus) can be re-released into the water column where they can contribute to other problems (e.g., algal blooms, toxicity effects). The drop in dissolved oxygen levels was attributed to a dense covering of the floating fern Azolla, which blanketed the entire surface of the Main Drain from Marshall Road to the pump station during late spring-summer (Figure 5.10). With the exception of the crash in dissolved oxygen concentrations, water quality in the Main Drain at the Waipori Pumping Station was significantly higher than that at Miller Road and Marshall Road. This is partly because there were no point source discharges affecting water quality at the sampling site. More importantly, it would appear that contaminants in the drain water at the pumping station are being diluted by intrusion of saline groundwater. Very high conductivity readings were recorded at this site, particularly during dry weather. The only sampling occasion to coincide with a discharge of Main Drain water to Lake Waipori occurred on 28 May 2002 when the pumps were in full operation following several days of heavy rain. There was a marked deterioration in water quality at the pumping station on this occasion but the conductivity reading was lowest recorded during the monitoring programme, reflecting dilution from freshwater surface inputs.
8 Consent holder monitoring data

Report on the Surface Water Quality of the Lower Taieri River Catchment ______________________________________________________________________________________
79
Figure 5.10 The Main Drain at Marshall Road looking downstream in September 2001 (top) and in March 2002 (bottom) when the drain was smothered with Azolla

Report on the Surface Water Quality of the Lower Taieri River Catchment ________________________________________________________________________
_______________________________________________________________________________________________________
80
5.3.5 Kirks Drain
Water quality in Kirks Drain at Marshalls Road was extremely poor and similar to that in the Main Drain at Miller Road. Very high turbidity (up to 77.4 NTU), BOD5 (up to 23 mg/L), ammoniacal nitrogen (up to 21.9 mg/L), total nitrogen (up to 37.5 mg/L), total phosphorus (6.9 mg/L) and E. coli (up to 12,300 MPN/100 ml) concentrations were recorded in this drain during the 12-month monitoring programme. On 8 March 2002, additional sampling was undertaken at this site, along with another three sites further upstream on Kirks Drain Road to identify the source(s) of contamination. No sampling was undertaken in the upper drain reaches above Otokia Road as the drain was largely dry. The results are summarised in Table 5.9, along with the sample results of suspected septic tank effluent that was observed discharging into Kirks Drain below Farm Road (Figure 5.10). Signs of another suspected septic tank discharge were observed on Kirks Drain Road above Otokia Road (Error! Reference source not found.).
Table 5.9 Results of one-off water quality sampling in Kirks Drain, 8 March 2002
Kirks Drain
Marshall Rd
D/s Farm Rd
60 m d/s Poplar Rd
100 m d/s Otokia Rd
Septic Tank Discharge
Turbidity (NTU) 21.6 81.1 84.9 261 46.4 BOD (mg/L) 5 178 56 79 8 Faecal coliforms (cfu/100 mL) 85 81,000 410 820 100 E. coli (MPN/100mL) 85 81,000 390 820 44 Ammoniacal Nitrogen (mg/L) 8.88 37.3 32.4 1.43 28.1 Total Nitrogen (mg/L) 15.3 54.8 77.5 5.87 37.9 Total Phosphorus (mg/L) 3.62 4.58 7.70 0.36 11.2
Contaminant concentrations below Farm Road were extremely high, particularly faecal indicator bacteria, and reflect the direct discharge of dairy effluent into this drain at the time of sampling. This discharge was authorised under Discharge Permit O4246 which expired on 1 March 2003. The property owner has since ceased discharging dairy effluent into Kirks Drain and has shifted to a land-based effluent disposal system. The reason for the poor water quality above Farm Road (60m below Poplar Road and 100m below Otokia Road) is unknown but there was minimal flow in the drain which made it difficult to obtain water samples without disturbing the drain sediments where contaminant concentrations would be greatest. The sample results for the suspected septic tank discharge were a little unusual. The nutrient concentrations were within the expected range for septic tank effluent but both the BOD5 concentration and indicator bacteria counts were very low. If present in the discharge, a chlorine-based disinfectant would explain these results. Following receipt of the sample results, Otago Regional Council compliance staff advised the property owner

Report on the Surface Water Quality of the Lower Taieri River Catchment ______________________________________________________________________________________
81
to undertake maintenance on the septic tank. The same tank was found discharging to Kirks Drain again in September 2003 but was promptly cleaned out under the directive of Council staff. There have been no further discharges to Kirks Drain since this time.
Figure 5.11 Septic tank effluent discharges to Kirks Drain from two properties on Kirks Drain Road – the discharge on the right was located a short distance above the Marshall Road sampling site 5.3.6 Lee Canal Drain
Like the other drains on the West Taieri, water quality was also poor in Lee Canal. Contaminant concentrations were highest at the Miller Road site, where black anoxic sediments were present in the drain. As with some of the other drains, the nitrogen sampling results also suggest the presence of significant concentrations of organic nitrogen at this site. Further investigation may be required as routine inspections of dairy farms higher up in the catchment identified several spots where effluent had potentially entered the drain. Runoff from a silage pit was also identified in the upper Lee Canal catchment.

Report on the Surface Water Quality of the Lower Taieri River Catchment ________________________________________________________________________
_______________________________________________________________________________________________________
82
5.4 Key Water Quality Issues
The lower Taieri River catchment is primarily agricultural and farming practices can be expected to impact to a certain extent on water quality in both the Taieri River and its tributaries. However the results obtained during monitoring to date have identified localised “hotspots” where some agricultural practices are having more than a minor effect on water quality. The impacts are not limited to agriculture however, with discharges from both urban stormwater outfalls and septic tanks also in need of further investigation. The principal issues that appear to be impacting on water quality include point source discharges, stock access, and poor land management practices. These issues are discussed separately below. 5.4.1 Point Source Discharges
Several different types of point source discharges were identified during the course of the 12-month monitoring programme. These include discharges of dairy and septic tank effluent in various locations, stormwater discharges in Mosgiel and treated sewage from the Dunedin International Airport at Momona. Dairyshed Effluent
At the time of writing this report there are no longer any remaining authorised discharges of dairyshed effluent to water in the lower Taieri River catchment. The Council has worked with dairy farmers to ensure alternative disposal methods, mostly land-based systems, are adopted. Provided these systems are operated and maintained as required, there should be no direct discharge of effluent to drains or natural waterways in the future. Septic Tank Effluent
The use of septic tanks is widespread across the lower Taieri River catchment. Mosgiel and Momona are the only townships to have reticulated sewerage systems and some parts of Mosgiel are still serviced by septic tanks. Preliminary investigations following the discovery of two septic tank discharges on Kirks Drain Road during the monitoring programme identified a number of other properties with septic tanks leaking or discharging into surface watercourses. The leaking tanks are not isolated to any one location and it is likely that the problem is widespread. On the East Taieri, following a complaint from the East Taieri Golf Course in late 2003, septic tanks from four properties were found discharging into a tributary drain of the Owhiro Stream. On the West Taieri, in addition to the two discharges to Kirks Drain on Kirks Drain Road, discharges have been identified on Otokia Road, Marshall Road and Henley-Berwick Road. It is possible that leakage from septic tanks in Allanton township may also be having a localised effect. Dunedin City Council environmental health staff have noted poor draining soils and small sections contribute to problems with some septic tanks in the area (R. Ludlow, Dunedin City Council, pers. comm. 2003). Outram, which

Report on the Surface Water Quality of the Lower Taieri River Catchment ______________________________________________________________________________________
83
has experienced major growth in the last 10 years and lies over a groundwater protection zone, may also be an area of concern. Outram, which has experienced major growth in the last 10 years and lies over a groundwater protection zone, may also be an area of concern. Under the Regional Plan: Water, the installation of new septic tank disposal systems in groundwater protection areas require resource consent from the Otago Regional Council. Where problem septic tanks have been identified, property owners have been given a strict timeframe to have the problem rectified. In some cases resource consents have been required from the Dunedin City Council. Based on the cases identified to date, poor, or in some cases a complete lack of, maintenance is likely to be the primary reason for leaking septic tanks. This is consistent with the findings of recent septic tank surveys in the Bay of Plenty region and the Clutha District. Undersized tanks can also be a problem (Graham & Futter 2002). In the lower Taieri, it is likely that most problems are occurring with old systems since all new septic tank systems are inspected by Dunedin City Council staff and property owners receive a written leaflet advising how to care for the system (W. Kitt, Dunedin City Council, pers. comm. 2003). Two practices of concern identified to date are the apparent diversion of septic tank outflows into drains and the use of chlorine-based bleach as a disinfectant. Disinfectants adversely affect the septic tank system and can find their way into surface watercourses where they may have other effects. In some cases disinfectant appears to be used to eliminate odour but as odour from a septic tank is generally indicative of a problem, the use of disinfectant only disguises the problem and can lead to adverse environmental effects. Stormwater
As discussed in Sections 5.22 and 5.23, stormwater from industrial and residential land in Mosgiel has the potential to impact on water quality in both Owhiro Stream and the Silverstream. In the case of the Silverstream, there is already a history of water pollution events arising from stormwater discharges. In terms of Owhiro Stream, monitoring results clearly indicate degraded water quality and an impoverished instream biological community, probably as a result of sewage contamination. The quality of stormwater discharges to this stream needs to be investigated, particularly with respect to the possible existence of unauthorised sewage connections. Otago Regional Council compliance staff undertook a one-off survey of stormwater discharges to both Owhiro Stream and the Silverstream in June 2003, but this sampling run was limited to dry weather conditions when many outfalls were dry. A number of water quality issues were identified from the one-off survey and followed up where possible: • The presence of fat globules in the Silverstream arising from a discharge from an
industrial stormwater outfall opposite Titri Place, Mosgiel. • Extremely high E. coli and faecal coliform counts in a stormwater drain discharging
into the Silverstream from Reid Avenue, Mosgiel.

Report on the Surface Water Quality of the Lower Taieri River Catchment ________________________________________________________________________
_______________________________________________________________________________________________________
84
• Elevated copper, nickel and zinc concentrations in sediment samples taken from the Silverstream immediately below the Wingatui Road stormwater outfall.
• Extremely turbid water entering Owhiro Stream from a stormwater drain in the Hampton Grove area as a result of builders upstream working too close to the drain.
• Elevated zinc concentrations in sediment samples taken from Owhiro Stream immediately below the Gladstone Road stormwater outfall.
Treated Sewage at Momona
With the exception of septic tank systems, the only remaining sewage discharge to water in the lower Taieri River catchment is that from Dunedin International Airport at Momona into the Main Drain. As discussed in Section 5.3.4, the current authorisation for this discharge expires on 1 October 2004. In keeping with the Otago Regional Council’s policy to eliminate point source discharges to surface waterways, the consent holder will be expected to investigate land disposal options in their application for a renewal of the authorisation. 5.4.2 Direct Stock Access to Waterways and Riparian Areas
Stock had free access to the water and banks at a number of sampling sites. This can reduce water quality in several ways: • Removal of riparian vegetation and therefore the ability of vegetation to buffer the
water from sediment, nutrients and faecal bacteria; • Disturbance and erosion of banks, contributing to high instream sediment loads and
reduced water clarity - stock having direct access to waterways can also contribute to significant areas of localised sedimentation, resulting in a loss of gravel habitat for sensitive macroinvertebrates and fish spawning;
• Direct defecation into waterways. The problems above were most noticeable in the Owhiro Stream below Riverside Road and the A1 Drain at the Taieri River confluence. At these sites, both sheep and dairy cows had free access to the banks and water, resulting in significant damage to the stream margins and bed, and very turbid and enriched water (refer Figure 5.4). Under Section 13.5.1.8 of the Regional Plan: Water, this stock access is not permitted in Owhiro Stream as the livestock have caused slumping, pugging and erosion of the bank and a conspicuous change in the colour and clarity of the water. Council Land Resources staff, in conjunction with the Taieri Trust, have worked with the property owner to fence and plant the affected areas. Other monitoring sites that were affected by stock access included the Silverstream at Three-Mile Hill Road and Riverside Road, the Meggatburn at Berwick Road and the Contour Channel at both Grainger Road and the No. 4 Bridge. Dairy cattle were also observed in the Taieri River immediately downstream of the SH87 bridge at Outram Glen. In most cases the impact of stock access was reflected in elevated E. coli counts that often rendered the water unsuitable for contact recreation.

Report on the Surface Water Quality of the Lower Taieri River Catchment ______________________________________________________________________________________
85
In 2003 the Otago Regional Council adopted an initiative to exclude all dairy cows from waterways in Otago by December 2005. Through the Lower Taieri Catchment Programme, Council land resources staff are working with farmers in problem areas and in the West Taieri and along the Taieri River to promote the use of temporary or permanent fencing. The Otago Regional Council is also supporting the Taieri Trust to work with landowners to fence and plant the riparian margins of the Owhiro Stream. Although exclusion of dairy cows will not totally eliminate all water quality problems in the lower Taieri catchment, it will reduce a significant number of localised impacts and contribute to an overall improvement in water quality. 5.4.3 Land Management Practices
In addition to stock access to waterways, land management practices may be contributing to reduced water quality in some areas. These include inappropriate siting of silage pits and poor management of stand-off pads and sacrifice paddocks. Overstocking and excessive fertilisation may also be issues but this needs investigation. The location of silage pits are an important consideration in preventing pollution as leachate from silage is likely to cause severe deoxygenation in waterways. On average, silage pit leachate is 200 times more concentrated than raw sewage and 40 times stronger than farm dairy wastewater. Silage pit runoff with potential to enter waterways was identified in several places in the lower Taieri catchment (Figure 5.12). In one case identified in late 2002, silage pit leachate had been deliberately piped under the Outram-Mosgiel Road and into a drainage ditch that flowed down to McKays Triangle where it enters the A1 Drain and, ultimately, the Taieri River. This practice was rectified under the directive of Council compliance staff with the leachate diverted to a farm effluent pond.

Report on the Surface Water Quality of the Lower Taieri River Catchment ________________________________________________________________________
_______________________________________________________________________________________________________
86
Figure 5.12 Leachate runoff from a silage pit below Riverside Road, near Owhiro Stream Poor management of sacrifice paddocks, partly through overstocking, has been identified in a few places. For example, in July 2003, runoff was seen entering the Taieri River at Henley as a result of stock having grazed the adjacent sacrifice paddock right down to bare soil. Without a cover of vegetation on a paddock, sediment and other contaminants easily flow into watercourses in wet weather conditions. As a result of Council Compliance staff follow-up and quick and decisive action by the farmer, this riparian margin is now fenced with a wide buffer of long grass. Otago Regional Council Land Resources staff have been working with farmers and other landowners in the lower Taieri catchment on a range of land management issues. Several workshops, field days and discussion groups have been held to date with the latest being a field day on the Taieri River on 4 March 2004. While there are plenty of areas where land management practices need to be improved, there are also numerous examples of sound management practices (Figure 5.13) that many land owners have had in place for some time.

Report on the Surface Water Quality of the Lower Taieri River Catchment ______________________________________________________________________________________
87
Figure 5.13 The A1 Drain upstream of Riverside Road. The drain is fenced off preventing stock access and riparian vegetation has been allowed to grow

Report on the Surface Water Quality of the Lower Taieri River Catchment ________________________________________________________________________
_______________________________________________________________________________________________________
88
6 Conclusions
The results of an intensive 12-month surface water quality monitoring programme in the lower Taieri River catchment over October 2001 to September 2002 indicate water quality in the lower Taieri River is relatively good. Median concentrations for almost all physico-chemical and microbiological water quality parameters were below the ANZECC 2000 default trigger values at all six monitoring sites. The key exception was turbidity at Henley Ferry although elevated turbidity is a product of the naturally silty substrate and tidal nature of this site. Most sites also recorded median pH values slightly below the range recommended by the ANZECC 2000 guidelines which reflects the slightly (and naturally) acidic nature of surface waters in much of catchment. Based on December 2000-December 2002 monitoring results, the median values of many water quality analytes are generally lower at Outram and Allanton than in the middle and upper reaches of the Taieri River. Analysis of historical water quality records at Allanton also indicate that the removal of the discharge of Mosgiel sewage from the lower Taieri River in mid 2000 has resulted in a significant improvement in water quality at Allanton. While median values complied with guidelines, water quality in the lower Taieri River was comprised at times, particularly during wet weather. This was the case at the Outram Glen which is often used for contact recreation. At this site elevated E. coli counts exceeded recommended contact recreation guidelines on 6 out of 17 sampling occasions over the 2001-2002 summer. Elevated ammoniacal nitrogen concentrations were recorded below State Highway 1 and require further investigation. Overall, the highest E. coli counts were recorded at Allanton. This may be related to poor water quality in Owhiro Stream as this stream enters the Taieri River less than a few hundred metres upstream. Lee Creek, the Silverstream and the Waipori River recorded the highest water quality of the lower Taieri River tributaries. With the exception of pH, median concentrations of water quality analytes for all of these watercourses were well within ANZECC 2000 guidelines. In contrast, water quality in Owhiro Stream was extremely poor. At both Gordon Road in Mosgiel and the bottom of the catchment below Riverside Road, the stream was enriched with organic matter, and recorded consistently elevated turbidity levels, E. coli counts and nutrient concentrations that significantly exceeded the ANZECC 2000 default trigger values. Stock (sheep and dairy cow) access was confirmed as the primary contributor to poor water quality below Riverside Road and sewage contamination, most probably as a result of cross-contamination with stormwater outfalls, is thought to be impacting on water quality above Burns Street. Periphyton growth is rampant at the Burns Street site and the macroinvertebrate community is severely impoverished. Water quality in the lower Taieri drains was poorest in the West Taieri drainage network, principally Kirks Drain and the Main Drain in the vicinity of Miller and Marshall Roads. These drains contained very high contaminant loads, with some concentrations similar to those found in municipal oxidation pond discharges. A combination of authorised and

Report on the Surface Water Quality of the Lower Taieri River Catchment ______________________________________________________________________________________
89
unauthorised point source discharges, notably dairyshed effluent and septic tank effluent was identified as being a key source of the contamination. High contaminant concentrations were also recorded in Lee Canal Drain on the West Taieri, particularly at Miller Road. Contaminant concentrations in the lower reaches of the Main Drain prior to the discharge to Lake Waipori were significantly lower, most probably as a result of dilution from groundwater intrusion. Water quality was significantly higher in the East Taieri drainage network, possibly reflecting the less intensive land use in this area of the plain and improved drainage through a higher gradient and natural water flow through the system. The key exception was the A1 Drain below Riverside Road which was characterised by high turbidity levels, E. coli counts and nutrient concentrations, primarily as a result of stock having open access to the drain on the true right bank. Most water quality impacts identified during the monitoring programme are attributed to point source discharges, livestock access to water and riparian margins, and poor land management practices. Point source discharges to water on the lower Taieri include dairyshed effluent, septic tank effluent, industrial and urban stormwater, and treated sewage from Dunedin International Airport at Momona. Stormwater discharges appear to be a problem in Mosgiel with impacts detected on both Owhiro Stream and, based on regular pollution events, the Silverstream. Septic tanks were also identified as a problem, with septic tank effluent from nine properties found leaking or discharging to drains. The leaking tanks are not isolated to any one location and it is likely that the problem is widespread. Livestock, both sheep and dairy cows, had direct access to the water at a number of monitoring sites. This contributed to bank erosion, sedimentation and degraded water quality, particularly in the lower reaches of the Owhiro Stream and A1 Drain. In most cases the impact of stock access was reflected in elevated E. coli counts that at times rendered the water unsuitable for contact recreation. Farming practices are also likely to be contributing to degraded water quality in some areas. Silage pit leachate runoff was identified on several occasions, in one case from an inappropriately located pit, and the other from a deliberate diversion of the runoff into a drain. Poor management of stand-off pads and winter sacrifice paddocks may also be causing localised problems. Otago Regional Council staff are working with the lower Taieri community and local agencies to address the various issues raised in this report.

Report on the Surface Water Quality of the Lower Taieri River Catchment ________________________________________________________________________
_______________________________________________________________________________________________________
90
7. References Australian and New Zealand Environment and Conservation Council (ANZECC). 2000.
Australian and New Zealand Guidelines for Fresh and Marine Water Quality. Australian and New Zealand Environment and Conservation Council and Agriculture and Resource Management Council of Australia and New Zealand.
Biggs, J.F.; Kilroy, C. 2000. Stream Periphyton Monitoring Manual. National Institute
of Water and Atmospheric Research, Christchurch. Close, M.E.; Davies-Colley, R.J. 1990. Baseflow chemistry in New Zealand Rivers. 1.
Characterisation. New Zealand Journal of Marine and Freshwater Research, Vol. 24: 319-341.
David, B.O.; Closs, G.P.; Arbuckle, C.J. 2002. Distribution of fish in tributaries of the
lower Taieri/Waipori Rivers, South Island, New Zealand. New Zealand Journal of Marine and Freshwater Research, 2002, Vol. 36: 797-808.
Graham, F.; Futter, P. 2002. Managing Septic Tanks in the Bay of Plenty, New Zealand
– Environment B.O.P’s Septic Tank Maintenance Programme. New Zealand Water & Wastes Association 44th Annual Conference and Expo, 25-27 September 2002.
Ministry for the Environment. 1992. Water Quality Guidelines No. 1. Guidelines for the
Control of Undesirable Growths in Water. Ministry for the Environment, Wellington.
Ministry for the Environment. 1994. Water Quality Guidelines No. 2. Guidelines for the
Management of Water Colour and Clarity. Ministry for the Environment, Wellington.
Ministry for the Environment. 2000. New Zealand Periphyton Guideline: Detecting,
Monitoring and Managing Enrichment of Streams. Ministry for the Environment, Wellington.
Ministry for the Environment, Ministry of Health. 2002. Microbiological Water Quality
Guidelines for Marine and Freshwater Recreational Areas. Ministry for the Environment, Wellington.
Ministry of Health. 1995. Drinking Water Standard for New Zealand. Ministry of
Health, Wellington. Otago Regional Council. 1999. Taieri River Catchment Monitoring Report. Otago
Regional Council, Dunedin. Otago Regional Council. 2000a. Regional Plan: Water for Otago. Otago Regional
Council, Dunedin.

Report on the Surface Water Quality of the Lower Taieri River Catchment ______________________________________________________________________________________
91
Otago Regional Council. 2000b. Freshwater Biomonitoring Programme: 1996-2000
Review. Otago Regional Council, Dunedin. Resource Management Act. 1991. New Zealand Government. Robertson Ryder & Associates. 1995. Factors Affecting Water Quality in the Lower
Taieri Catchment. Robertson Ryder & Associates, Dunedin. Stark, J.D. 1985. A macroinvertebrate community index of water quality for stony
streams. Water & Soil Miscellaneous Publication 87: National Water and Soil Conservation Authority, Wellington.
Stark, J.D. 1998. SQMCI: a biotic index for freshwater macroinvertebrate coded
abundance data. New Zealand Journal of Marine and Freshwater Research, Vol. 32: 55-66.
Stark, J.D.; Boothroyd, I.K.G.; Harding, J.S.; Maxted, J.R.; Scarsbrook, M.R. 2001.
Protocols for sampling macroinvertebrates in wadeable streams. New Zealand Macroinvertebrate Working Group Report No. 1. Prepared for the Ministry for the Environment, Sustainable Management Fund Project No. 5103.


Report on the Surface Water Quality of the Lower Taieri River Catchment ______________________________________________________________________________________
________________________________________________________________________
71
APPENDICES

Report on the Surface Water Quality of the Lower Taieri River Catchment ______________________________________________________________________________________
________________________________________________________________________
72

Report on the Surface Water Quality of the Lower Taieri River Catchment ______________________________________________________________________________________
________________________________________________________________________
73
Appendix 1 – Water Quality Monitoring Sites
Site 1 Site 4 Site 7 Silverstream @ 3M Hill Owhiro Stream @ Burn St Owhiro Stream d/s Riverside Rd
Site 8 Taieri River @ Allanton
Site 2 Site 5
Mill Stream @ Milners Rd Mill ‘Stream’ @ McKays Triangle Site 3 Site 6 Site 9 Silverstream @ Gordon Rd A1 Drain @ McKays Triangle 013 Drain @ Riverside Rd
1

Report on the Surface Water Quality of the Lower Taieri River Catchment ______________________________________________________________________________________
________________________________________________________________________
74

Report on the Surface Water Quality of the Lower Taieri River Catchment ______________________________________________________________________________________
________________________________________________________________________
75
Site 10 Site 13 Site 16 Taieri River @ Murray Rd Taieri River d/s Lindsay Rd Contour Channel @ Grainger Rd Site 11 Site 14 Site 17 Silverstream @ Riverside Rd Taieri River @ Outram Glen Lee Canal @ Miller Rd Site 12 Site 15 Site 18 A1 Drain @ Taieri Lee Creek @ Woodside Main Drain @ Miller Rd River Glen

Report on the Surface Water Quality of the Lower Taieri River Catchment ______________________________________________________________________________________
________________________________________________________________________
76
Site 19 Site 22 Site 25 Taieri River below SH1 Main Drain @ Marshall Rd Waipori River @ Henley-
Berwick Rd Site 20 Taieri River @ Henley Ferry Site 23 Site 26 Kirks Drain @ Marshall Rd Meggatburn @ Berwick Rd Site 21 Main Drain @ Waipori Pumping Site 27 Station Contour Channel @
No. 4 Bridge
Site 24
Lee Canal @ Marshall Rd

Report on the Surface Water Quality of the Lower Taieri River Catchment ______________________________________________________________________________________
________________________________________________________________________
77
Site 29 Site 30 Unnamed Stream @ Clarendon Rd Owhiro Stream @ Wingatui Rd Contact Recreations Sites Taieri River @ Outram Glen Lake Waihola @ Swimming Beach Lake Waihola @ Jetty Taieri River @ Taieri Mouth

Report on the Surface Water Quality of the Lower Taieri River Catchment ______________________________________________________________________________________
________________________________________________________________________
78
Appendix 2 – Raw Water Quality Results

Report on the Surface Water Quality of the Lower Taieri River Catchment ______________________________________________________________________________________
________________________________________________________________________
79

Report on the Surface Water Quality of the Lower Taieri River Catchment ______________________________________________________________________________________
________________________________________________________________________
80
Appendix 3 – Periphyton and Macroinvertebrate Results
1. Periphyton (a) 2002 Results
Taxa Taieri River - Outram Taieri River - Allanton 26-Mar-02 26-Mar-02
Green, non-filamentous Closterium 1
Diatoms Achnanthidium 4 4 Cocconeis placentula 3 3 Cymbella cf. kappii 5 cf. Diatoma 6 Encyonema minutum 4 Frustulia 1 Gomphoneis spp. 8 6 Melosira varians 7 8 Navicula cryptocephala 3 Nitzschia spp. (small) 3 4 Nitzschia spp. (skinny) 4 cf. Sellaphora 1 Surirella tenera 2 Synedra cf. ulna var. ramesi 1
Cyanobacteria Phormidium 7
Relative abundance scores: 8 Dominant
7 Abundant 6 Common – Abundant 5 Common 4 Occasional – Common 3 Occasional 2 Rare – Occasional 1 Rare

Report on the Surface Water Quality of the Lower Taieri River Catchment ______________________________________________________________________________________
________________________________________________________________________
81
(b) 2003 Results Taieri River Owhiro Stream Silverstream Taxa Outram Allanton Burns St 3-Mile Hill Riccarton Rd 13-Feb-03 06-Mar-03 06-Mar-03 13-Feb-03 13-Feb-03
Mougoetia 3 2 Oedogonium 8 8 Spirogyra 4 Stigeoclonium 8 Closterium 3 2 1 Cosmarium 1 Achnanthidium linearis 2 3 Cocconeis spp. 3 5 1 Cybella aspera 3 Cymbella kappii 7 2 Encyonema cf. minutum 2 Epithemia sorex 5 Fragilaria (small) 3 Gomphoneis spp 8 3 6 Gomphonema spp (small) 4 4 Gomphonema cf. truncatum 2 Melosira varians 5 6 4 Navicula avenacea 4 Navicula cf.capitoradiata 3 Nitzschia palea 2 3 Nitzschia gracilis 3 Nitzschia spp. (skinny) 2 Nitzschia spp. (small) 2 Pinnularia 5 Rhoicosphenia 1 4 4 Rhopalodia novae-zealandiae
3
Surirella tenera 1 Synedra ulna 2 2 5 8 3 Synedra ulna cf. var. contracta
1 3
Tabellaria 4 Oscillatoria/Phormidium 3 cf. Merismopedia 1

Report on the Surface Water Quality of the Lower Taieri River Catchment ______________________________________________________________________________________
________________________________________________________________________
82
2. Macroinvertebrates (a) 2002 Results Taxa MCI Sensitivity Score Taieri River - Outram Taieri River - Allanton 26-Mar-02 26-Mar-02 ORDER COLEOPTERA Hydora nitida 6 VA VA ORDER TRICHOPTERA Aoteapsyche colonica 4 A Hudsonema amabile 6 R Hydrobiosis clavigera 5 R Hydrobiosis early instar 5 C C Hydrobiosis umbripennis 5 C Oxyethira albiceps 2 R Paroxyethira hendersonii 2 C Psilochorema species 8 C Pycnocentria evecta 7 VA A Pycnocentrodes species 5 C A ORDER DIPTERA Tanytarsini 3 C Orthocladiinae 2 VA A Austrosimulium australense 3 C Muscidae 3 C R ORDER PLECOPTERA Zelandobius species 5 A Zelandoperla species (other) 10 C ORDER EPHEMEROPTERA Deleatidium species 8 VVA VA ORDER MOLLUSCA Potamopyrgus antipodarum 4 A VVA OLIGOCHAETA 1 C C CRUSTACEA Ostracoda 3 C Paracalliope fluviatilis 5 VA Total Richness 19 12 EPT Richness 12 5 % EPT Richness 63.16 41.67 MCI Score 92.63 91.67 SQMCI Score 6.57 4.83 Abundance Classes: R – Rare C – Common A – Abundant VA – Very Abundant VVA Very Very Abundant

Report on the Surface Water Quality of the Lower Taieri River Catchment ______________________________________________________________________________________
________________________________________________________________________
83
(b) 2003 Results
Taieri River Owhiro StreamSilverstream Taxa MCI
Sensitivity Score
Outram Allanton Burns St 3-Mile Hill Rd
Riccarton Rd
13-Feb-03 06-Mar-03 06-Mar-03 13-Feb-03 13-Feb-03ACARI 5 A COLEOPTERA Elmidae 6 VVA VA VA VA Rhantus pulverosus 5 R CRUSTACEA Cladocera 5 C Ostracoda 3 VA VA VA VVA Paracalliope fluviatilis 5 A VVA A Phreatoicus typicus 5 A DIPTERA Aphrophila species 5 R Chironominae 2 VA A VA A Chironomus zealandicus 1 R Ephydridae 4 A Maoridiamesa species 3 A Muscidae 3 A A Orthocladiinae 2 A VA VA VA Tanypodinae 5 A A EPHEMEROPTERA Coloburiscus humeralis 9 R Deleatidium species 8 VA A VVA MEGALOPTERA Archichauliodes diversus 7 R A MOLLUSCA Gyraulus species 3 A Physa species 3 R VA C VVA Potamopyrgus antipodarum 4 A VVA VVA VVA VVA Sphaerium species 3 A VA C ODONATA Xanthocnemis zealandica 5 R OLIGOCHAETA 1 VA VVA VVA VA A PLECOPTERA Austroperla cyrene 9 C Megaleptoperla grandis 9 R Stenoperla prasina 10 C Zelandobius confusus group 5 A Zelandoperla species 10 A A TRICHOPTERA Aoteapsyche species 4 VVA C VVA R Hudsonema alienum 6 A Hudsonema amabile 6 A A A Hydrobiosidae early instar 5 A R A A

Report on the Surface Water Quality of the Lower Taieri River Catchment ______________________________________________________________________________________
________________________________________________________________________
84
Hydrobiosis umbripennis group
5 A R A
Neurochorema forsteri 6 C Neurochorema species 6 Olinga species 9 A R VA Oxyethira albiceps 2 VA VA A Psilochorema species 8 R R Pycnocentria species 7 VVA VA VA A Pycnocentrodes species 5 A C VVA Total Richness 17 18 10 30 18 EPT Richness 9 9 0 16 7 MCI Score 105.88 93.33 58.00 110.00 83.33 SQMCI Score 5.35 3.65 2.57 4.95 3.49

Report on the Surface Water Quality of the Lower Taieri River Catchment ______________________________________________________________________________________
________________________________________________________________________
85

Report on the Surface Water Quality of the Lower Taieri River Catchment ______________________________________________________________________________________
________________________________________________________________________
86
Appendix 4 – Seasonal Kendall Test Results
Taieri River at Outram Glen, August 1994-August 2003
Turbidity
Faecal Coliforms

Report on the Surface Water Quality of the Lower Taieri River Catchment ______________________________________________________________________________________
________________________________________________________________________
87
Ammoniacal Nitrogen
Nitrite-Nitrate Nitrogen
Total Nitrogen

Report on the Surface Water Quality of the Lower Taieri River Catchment ______________________________________________________________________________________
________________________________________________________________________
88
Dissolved Reactive Phosphorus
Total Phosphorus

Report on the Surface Water Quality of the Lower Taieri River Catchment ______________________________________________________________________________________
________________________________________________________________________
89
Taieri River at Allanton, August 1994-August 2003 Turbidity
Faecal Coliforms
Ammoniacal Nitrogen

Report on the Surface Water Quality of the Lower Taieri River Catchment ______________________________________________________________________________________
________________________________________________________________________
90
Nitrite Nitrate Nitrogen
Total Nitrogen
Dissolved Reactive Phosphorus

Report on the Surface Water Quality of the Lower Taieri River Catchment ______________________________________________________________________________________
________________________________________________________________________
91
Total Phosphorus