Lower Hunter Dust Deposition Study
79
13-Apr-2016 Prepared for – NSW Environment Protection Authority – ABN: 43 692 285 758 NSW Environment Protection Authority Lower Hunter Dust Deposition Study Final Report
Transcript of Lower Hunter Dust Deposition Study

13-Apr-2016 Prepared for – NSW Environment Protection Authority – ABN: 43 692 285 758
NSW Environment Protection Authority
Lower Hunter Dust Deposition
Study
Final Report

Lower Hunter Dust Deposition Study
AECOM
Lower Hunter Dust Deposition Study
Final Report
Client: NSW Environment Protection Authority
ABN: 43 692 285 758
Prepared by
AECOM Australia Pty Ltd
17 Warabrook Boulevard, Warabrook NSW 2304, PO Box 73, Hunter Region MC NSW 2310, Australia
T +61 2 4911 4900 F +61 2 4911 4999 www.aecom.com
ABN 20 093 846 925
DISCLAIMER This report was prepared by AECOM Australia Pty Ltd in good faith exercising all due care and attention, but no representation or
warranty, express or implied is made as to the relevance, accuracy, completeness or fitness for purpose of this document in respect of any
particular user’s circumstances. AECOM undertakes no duty, nor accepts any responsibility, to any third party who may rely upon or use this
document. AECOM may also have relied upon information provided by the NSW Environment Protection Authority (EPA) and other third parties to
prepare this document, some of which may not have been verified. Users of this document should satisfy themselves concerning its application to,
and where necessary seek expert advice in respect of, their situation. The views expressed within are not necessarily the views of the EPA and
may not represent EPA policy.
© Copyright State of NSW and NSW Environment Protection Authority
With the exception of photographs, the State of NSW and NSW Environment Protection Authority are pleased to allow this material to be
reproduced in whole or in part for educational and non-commercial use on a non-reliance basis, provided the meaning is unchanged and its
source, publisher and authorship are acknowledged. Specific permission is required for the reproduction of photographs.
February 2016

Lower Hunter Dust Deposition Study
AECOM
Table of Contents
Executive Summary i 1.0 Introduction 1
1.1 Background 1 1.2 What is Deposited Dust? 1 1.3 Community Involvement 1 1.4 Objective of the Report 2 1.5 Scope of Works 2 1.6 Structure of this Report 3
2.0 Project Location and Description 5 2.1 Study Area 5 2.2 Dust Sources and Dust Composition 5
2.2.1 Potential Regional Dust Sources 5 2.2.2 Dust Composition 5 2.2.3 History of Dust Deposition in the Newcastle Region 6 2.2.4 Other Dust Deposition Composition Studies 6
2.3 Complaints Data 7 2.3.1 Complaints Data pre Monitoring Period 7 2.3.2 Complaints Data during Monitoring Period 7
2.4 Meteorology 8 2.4.1 Wind Speed and Direction 8 2.4.2 Rainfall 10
3.0 Impact Assessment Criteria 13 4.0 Methodology 16
4.1 Dust Monitoring Methods 16 4.1.1 Dust Deposition Gauges (DDGs) 17 4.1.2 Dust Deposition Gauge Monitoring locations 18 4.1.3 Petri Dish Sampling 21 4.1.4 Brush Samples 26
4.2 Laboratory Analysis 29 4.2.1 Standard Depositional Dust Suite 29 4.2.2 Stereomicroscopy (StM) 29 4.2.3 Scanning Electron Microscopy (SEM) 30 4.2.4 Energy Dispersive X-Ray Spectroscopy (EDS) 30 4.2.5 Chain of Custody Protocols 31
5.0 Monitoring Results 32 5.1 Standard Dust Deposition Analyses 32 5.2 Identification Analyses 37
5.2.1 Stereomicroscopy 37 5.2.2 Scanning Electron Microscopy and Energy Dispersive X-Ray Spectroscopy 48
6.0 Discussion and Recommendations 59 6.1 Discussion of Results 59
6.1.1 Total Dust Deposition 59 6.1.2 Deposition of Black Particles (Coal, Soot and Rubber) 59 6.1.3 Summary of Findings 61
6.2 Recommendations 63 7.0 Conclusion 65 8.0 References 67
List of Tables
Table 1 Report Structure 3 Table 2 Historical NSW dust deposition rates (1950 – 1980) 6 Table 3 Wind Speed Frequency Distribution of OEH Carrington Meteorology Station - Oct 2014
to Oct 2015 data (%) 8

Lower Hunter Dust Deposition Study
AECOM
Table 4 Ambient Air Quality Assessment Criteria (DEC 2005b) 13 Table 5 International Impact Assessment Criteria – Deposited Dust 13 Table 6 Monitoring Program Frequency by Analysis Counts 16 Table 7 Deposited Dust Samples Collection Dates 18 Table 8 Monitoring Locations and Details 19 Table 9 Petri Dish Sample Meteorology Conditions 23 Table 10 Brush Samples 27 Table 11 Deposited Dust – Insoluble Solids (g/m2.month) 34 Table 12 Stereomicroscopy Results for Brush Samples: Visual Composition Identification Analysis 40 Table 13 Stereomicroscopy Results for DDG Samples: Visual Composition Identification Analysis 43 Table 14 Stereomicroscopy Results for Petri Dish Samples: Visual Composition Identification
Analysis 45 Table 15 Energy Dispersive X-Ray Spectroscopy and Scanning Electron Microscopy Results for
Brush Samples 50 Table 16 Energy Dispersive X-Ray Spectroscopy and Scanning Electron Microscopy Results for
DDG Samples 54 Table 17 Energy Dispersive X-Ray Spectroscopy and Scanning Electron Microscopy Results for
Petri Dish Samples 56
List of Figures
Figure 1 Average Percentage Composition of Deposited Dust Samples (all samples) ii Figure 2 Typical Brush sample location and collection of dust sample which appears as black dust
to the human eye. iii Figure 3 Stereomicroscopy image showing that the ‘black dust sample’ is composed of brown,
black and lighter particles. iii Figure 4 Scanning electron microscopy (SEM) image of sample, which allows individual particle
types to be identified (black and white) iii Figure 5 Energy Dispersive X-ray Spectroscopy (EDS) results showing elemental particle
composition of SEM image area. iii Figure 6 Pie chart detailing laboratory results of the brush sample collected in Figure 2. iii Figure 7 Historical Newcastle region dust deposition rates (2001 – 2009) 6 Figure 8 Annual and Monthly Wind Roses at OEH Carrington Monitoring Station between 15
October 2014 and 15 October 2015 9 Figure 9 Bureau of Meteorology Rainfall Data 10 Figure 10 Comparison of Historical Rainfall and Project Period Rainfall 10 Figure 11 Sample Analysis Flow Chart 17 Figure 12 Ground Level Monitoring Locations from AS/NZS 3580.1.1 2007 (Reproduced with
permission from SAI Global Ltd under Licence 1408-C007) 18 Figure 13 Dust Deposition Monitoring Locations (DDG’s) 20 Figure 14 Example DDG location (Waratah) 21 Figure 15 An Example Petri Dish Sample 22 Figure 16 Petri Dish Sampling Locations 25 Figure 17 A Typical Brush Sample Location 26 Figure 18 Brush Sampling Locations 28 Figure 19 Example StM Images 30 Figure 20 Example SEM images for multiple particles (left) and a single particle (right). 30 Figure 21 Example EDS scans of the two SEM images above in Figure 20. 31 Figure 22 Dust Deposition Monthly Results Plot 36 Figure 23 Average Percentage Composition of Deposited Dust Samples (all samples) 37 Figure 24 General Examples of Stereomicroscopy Images 38 Figure 25 Example of Scanning Electron Microscopy Images (black and white) 48

Lower Hunter Dust Deposition Study
i AECOM
Executive Summary
The Newcastle Community Consultative Committee on the Environment (NCCCE) administered by the New
South Wales (NSW) Environment Protection Authority (EPA) was commissioned in 2011 to advise the Minister for
the Environment and the EPA about environmental and amenity issues in the Newcastle local government area
(LGA).
Through the NCCCE, the community (both groups and individuals) had raised concerns about the levels of visible
deposited dust in the Newcastle LGA. In response to the community concerns, the EPA, at the request of the
NCCCE, formed the Lower Hunter Dust Deposition Project Reference Group (LHDDPRG) and initiated the Lower
Hunter Dust Deposition Project (LHDDP). The LHDDPRG comprised eight members: two community
representatives, two industry representatives, two independent technical experts and two EPA staff members.
The reference group acted as a conduit between the broader community and the EPA regarding the study, and
advised and guided the EPA on project design and delivery.
After a competitive tender process AECOM was commissioned by the EPA, in consultation with the LHDDPRG, to
undertake a twelve month monitoring program to assess dust deposition rates as well as the composition of the
deposited dust. The LHDDGRG was integral in planning the project’s research questions, scope and
methodology. The study design included a peer review of the methodology paper by an independent technical
expert.
Through the LHDDPRG, expressions of interest were sent out to the community requesting locations for dust
monitoring for a one year period. Responses to the request were collated and those sites within the LHDDP
defined area were reviewed for appropriateness with relevant Australian Standard siting guidelines. Twelve
representative sites were selected and approved in coordination with the LHDDPRG.
Dust sampling was undertaken during the period October 2014 and October 2015 to identify trends in local dust
levels and composition. The dust monitoring program was comprised of:
- A dust monitoring network of 12 dust deposition gauges (DDGs) installed by AECOM and sampled and
analysed for insoluble solids and ash residue in general accordance with the Australian Standard AS/NZS
3580.10.1:2003(R2014) and the EPA (DEC 2005a) guidelines;
- Collection of 36 Petri dish and 24 brush samples at spatially variant locations to identify dust composition.
Petri dish samples were used to identify short term impacts during specific meteorological conditions, while
brush samples were used to identify longer term trends;
- Laboratory analysis of samples including:
Dust gauge sample analysis (weighing dust gauge samples and determining dust deposition rates)
conducted by Australian Laboratory Services (ALS) Environmental Laboratory, a NATA-accredited and
registered laboratory for standard dust gauge sample analysis (NATA accreditation number 825); and
Stereomicroscopy, scanning electron microscopy (SEM) and energy dispersive x-ray spectroscopy
(EDS) to identify particle composition of Petri dish, brush and selected DDG samples by the University
of Queensland Materials Performance (UQMP) laboratory.
For the purpose of the study, black dust refers to the visible, total deposited matter that is deposited at residential
locations within the study area and collected during the study.
In the laboratory, microscopic analysis revealed that the samples of total deposited matter, visible to the eye as
black dust, were comprised of:
- Brown particles of soil or rock;
- Black particles of coal, soot and rubber; and
- Lighter coloured particles of salt, plant and insect debris, alumina, paint and miscellaneous fibres.
Lower Hunter Dust Deposition Study
ii AECOM
The results of the study found:
- Annual average dust deposition for each of the twelve DDG sites was found to be below the EPA maximum
dust deposition criterion of 4g/m2.month (DEC, 2005a) for all sites with annual averages ranging from 0.5 to
1.1 g/m2.month. Of the total dust deposited, approximately 17% was identified as black particles (coal, soot
and rubber), equating to an annual average deposition rate in the order of 0.09 to 0.19 g/m2.month for black
particles alone
- Results of the composition identification analysis are summarised below and in Figure 1.
Soil or rock (primarily aluminosilicate) as the primary source of deposited dust averaging 69% of all
samples with a range of 40% to 90%;
Insect and plant debris accounted for an average of 10% of all samples with a range of 0% to 40%;
Coal on average formed 10% of total deposited dust with a range of 0% to 25%;
Rubber dust on average made up 4% of total deposited dust with a range of 0% to 20%;
Soot accounted for an average of 3% of all samples with a range of 0% to 20%; and
The remainder of the deposit dust was largely comprised of halite (salt), fly ash (from burning coal and
other materials), alumina, paint and miscellaneous fibres.
Figure 1 Average Percentage Composition of Deposited Dust Samples (all samples)
Results of the identification analysis determined soil or rock (primarily aluminosilicate) as the primary source of
deposited dust averaging 69% of all samples1. This is consistent with the findings of the deposited dust
composition studies conducted by the Queensland Government (refer to Section 2.2.4) which found the major
deposited dust to be soil or rock dust.
Photographs detailing the steps taken to collect and analyse a typical sample of deposited dust are shown below.
As can be seen from the example sample below, the analysis methods can identify particles both visually and
analytically. As can be seen below, the colour of the sample may vary depending on the magnification and
1 Including brush samples, DDG samples and petri dish samples.

Lower Hunter Dust Deposition Study
iii AECOM
background colour with analytical results for this sample identifying the composition as predominantly soil and
rock particles.
Figure 2 Typical Brush sample location and collection
of dust sample which appears as black dust to
the human eye.
Figure 3 Stereomicroscopy image showing that the ‘black
dust sample’ is composed of brown, black and
lighter particles.
Figure 4 Scanning electron microscopy (SEM) image of
sample, which allows individual particle types to be
identified (black and white)
Figure 5 Energy Dispersive X-ray Spectroscopy (EDS)
results showing elemental particle composition of
SEM image area.
Figure 6 Pie chart detailing laboratory results of the brush
sample collected in Figure 2.

Lower Hunter Dust Deposition Study
iv AECOM
The initial brief highlighted a number of research questions that the study should address. The project research
questions are addressed below:
1) What is the association between proximity to potential sources, such as the rail corridor, and
rate of dust deposition?
There was little association between the proximity to potential sources and the rate of dust deposition. The
average dust deposition rate for the sampling period was 0.8 g/m2.month. Of the locations in close proximity
to the rail line the averages were:
Waratah 0.8 g/m2.month
Islington 1.1 g/m2.month
Tighes Hill 0.9 g/m2.month
Hamilton 0.8 g/m2.month
Other potential sources such as industrial facilities in Waratah/Mayfield and coal handling facilities in Tighes
Hill were also in proximity to these locations.
Newcastle received the lowest annual deposition rate of 0.5 g/m2 month. It is noted that there is no industrial
rail corridor or industry in this location.
2) What is the level of dust deposition that is representative of specific areas in the Lower Hunter,
including the rail corridor?
Dust deposition was measured at 12 locations across the Newcastle LGA with annual average deposition
rates for insoluble solids found to be between 0.5 and 1.1 g/m2 month for the study period. Table 10 gives
the annual averages for each of the specific dust gauge locations.
3) How do measured dust deposition rates compare with international dust deposition criteria and
NSW criteria? - What is the composition of deposited dust?
As part of this study dust deposition was measured at 12 locations for a 12 month period. Annual dust
deposition rates for insoluble solids ranged between 0.5 and 1.1 g/m2.month, below the NSW EPA maximum
criteria of 4 g/m2.month. The deposition rates were also below the international criteria listed in Table 5 of
Section 3.0. Analysis indicates that the dust is generally comprised of soil and rock particles with smaller
fractions of coal, rubber and soot as well as inorganic matter such as insects and vegetation.
4) Is coal dust deposited at residential properties and/or other locations within the study area?
Coal dust was found in the majority of DDG, brush and Petri dish samples collected during this study.
Samples were collected from both residential and non-residential areas within the Newcastle LGA. On
average, coal accounted for 10% of the dust within samples analysed.
5) What is the composition of the ‘black dust’ identified at residential properties within the study
area?
Noting that for the purpose of this study that ‘black dust’ was considered to be the total dust observed by
residents on surfaces around their properties, the following was found. On average, samples were primarily
comprised of soil and rock, accounting for 69% of the composition of samples. Following this, coal was the
second largest contributor at 10%, with rubber (4%) and soot (3%) accounting for smaller portions. Particles
identified as black by laboratory analysis (coal, soot and rubber) therefore on average accounted for 17% of
the total deposited dust analysed.
6) What are the potential attributable sources of deposited dust/black dust?
Potential sources of deposited dust/black dust include natural ground (soil and rock dust). Such areas may
include natural earth, beaches, farming operations, construction sites and mining operations. Potential
sources of black particles (coal, soot and rubber) are likely to include coal handing operations, industrial
activities, shipping and automobile traffic and tyre degradation.

Lower Hunter Dust Deposition Study
v AECOM
7) Are there geographical or spatial variations in dust deposition/black dust?
While there is some variation between dust deposition annual averages across the 12 DDG monitoring
locations selected for this study, it is relatively minimal. The Newcastle site returned the minimum annual
average at 0.5 g/m2.month with Islington recording the maximum of 1.1 g/m2.month. The other 10 sites
recorded annual averages ranging from 0.7 to 0.9 g/m2.month resulting in overall average deposition rate of
0.8 g/m2.month for the study area.
Black dust, or more specifically black particles did show some geographical variations. Coal was at times
observed in higher concentrations when sampling was performed downwind of coal handling operations
however at other times, samples contained relatively low concentrations under these conditions. Generally
the percentages of coal found were higher in those areas surrounding the port and coal handing areas.
Soot was also found in higher concentrations around and downwind of the port operations. Sources may
include ships, trains and trucks as well as industry located around the port area.
No observable pattern was observed when analysing the distribution across the sample area.
It is recommended that longer term monitoring be undertaken to account for longer term meteorological variability
and to establish long term regional trends. Additionally, further monitoring could be undertaken outside the study
area to determine the background levels and composition of deposited dust in other areas of the State. Short term
sampling and analysis is also recommended, with strategic collection of samples upwind and downwind of
sources to identify significant contributors.

Lower Hunter Dust Deposition Study
vi AECOM
This page has been left blank intentionally.

Lower Hunter Dust Deposition Study
1 AECOM
1.0 Introduction
1.1 Background
The Newcastle Community Consultative Committee on the Environment (NCCCE) administered by the New
South Wales (NSW) Environment Protection Authority (EPA) was commissioned in 2011 by the NSW Minister for
the Environment. The NCCCE works with community groups in the Newcastle Local Government Area (LGA) to
identify environmental and amenity issues associated with local industrial activities.
Through the NCCCE, the community, both groups and individuals, have raised concerns about the level of visible
black dust deposited around residences in the Newcastle area. In response to the community concerns, the EPA,
at the request of the NCCCE, initiated the Lower Hunter Dust Deposition Project (LHDDP) and formed a project
reference group for the study. The Lower Hunter Dust Deposition Project Reference Group (LHDDPRG) is
comprised of eight members including EPA staff, community and industrial representatives as well as technical
advisors.
After a competitive tender process AECOM Australia Pty Limited (AECOM) was commissioned by the EPA to
undertake the LHDDP and worked in conjunction with the LHDDPRG throughout the project. The study included a
twelve month monitoring program conducted between October 2014 and October 2015 with the aim of examining
the quantity and composition of deposited dust in areas of the Lower Hunter.
1.2 What is Deposited Dust?
Deposited dust is dust from the air that settles onto the ground, or similar surface. The LHDDPRG agreed that for
the purpose of this study, the term black dust (as stated in the project scope) refers to the total dust deposited and
observed on surfaces around households and collected in the sampling program for analysis to identify particle
constituents. Typically deposited dust is primarily comprised of larger, heavier particles (originating from nearby
sources) but does also include smaller particles which may have travelled by wind from sources further away.
Measured in the units of g/m2.month, or grams per square metre (of ground) per month, deposited dust is typically
considered an amenity or nuisance issue rather than a direct heath concern. Deposited dust may originate from
many different sources, including both natural and man-made and monitoring deposited dust is a cost effective
method to provide an indication of air quality in an area.
1.3 Community Involvement
The LHDDPRG comprises eight members: two community representatives, two industry representatives, two
independent technical experts and two EPA staff. The reference group acts as a conduit between the broader
community and the EPA regarding the study, and advises and guides the EPA on project design and delivery.
Through the LHDDPRG expressions of interest were sent out to the community requesting locations for dust
monitoring for a one year period. Responses to the request were collated and those sites within the LHDDP
defined area were reviewed for appropriateness with relevant Australian Standard siting guidelines.
Representative sites were then selected and approved in coordination with the LHDDPRG. A copy of the
expression of interest is provided in Appendix A.
The LHDDPRG and its community representatives were integral in the planning of the project scope, methodology
and required outcomes. Through face to face meetings between the field study team and the LHDDPRG, a
defined scope of work was agreed to, locations for monitoring selected and the form of analysis identified. The
study design also included a peer review of the methodology paper by an independent expert. Progress meetings
were conducted throughout the project to ensure the project was being undertaken in accordance with the aims of
the LHDDPRG. The LHDDPRG agreed that for the purpose of this study, the term black dust refers to the total
dust deposited and observed on surfaces around households and collected in sampling program for analysis to
identify particle constituents.

Lower Hunter Dust Deposition Study
2 AECOM
1.4 Objective of the Report
The objective of this report is to document the scope, methodology and findings of the air quality monitoring
program established as part of the LHDDP and provide an assessment of the dust composition and deposition
rates in the LGA. The initial brief highlighted a number of research questions that the study should address. The
objective of the study was to:
- Provide an assessment of dust deposition rates against the relevant criteria;
- Describe the composition of deposited dust at monitoring locations;
- Assess the geographical and spatial distribution of dust deposition in the LGA;
- Observe the potential relationship between distribution rates of total dust and black particles and the
potential sources of this dust;
- Provide a response to each of the research questions (Section 6.1.3)
What is the association between proximity to potential sources, such as the rail corridor, and rate of
dust deposition?
What is the level of dust deposition that is representative of specific areas in the Lower Hunter,
including the rail corridor?
How do measured dust deposition rates compare with international dust deposition criteria and NSW
criteria? - What is the composition of deposited dust?
Is coal dust deposited at residential properties and/or other locations within the study area?
What is the composition of the ‘black dust’ identified at residential properties within the study area?
What are the potential attributable sources of deposited dust/black dust?
Are there geographical or spatial variations in dust deposition/black dust?
- Discuss weather conditions throughout the study period as well as any other observations.
1.5 Scope of Works
The scope of works for the study is as follows:
- Provide a description of the LHDDP and purpose of this report;
- Describe the study area including;
Potential dust sources within the study area;
Air quality complaints data collected by the EPA;
Local meteorology during the monitoring period including wind speed and wind direction.
- Define the relevant NSW EPA criteria for dust deposition;
- Provide a description of the monitoring methodologies including the use of DDGs, Petri dish and brush
sampling techniques;
- Provide a description of the methodologies used to analyse dust samples;
- Discuss the results of the monitoring and provide an assessment of the deposition rates of total dust and
black particles in the LGA; and
- Provide recommendations and conclusion.

Lower Hunter Dust Deposition Study
3 AECOM
1.6 Structure of this Report
Table 1 outlines the structure of this report and provides a description of each section.
Table 1 Report Structure
Section Description
Section 1.0 Provides a description of the Lower Hunter Dust Deposition Project and outlines the scope
of works undertaken for this study.
Section 2.0 Provides a description of the study area, identifies potential sources of dust, provides a
classification for deposited dust, the location of complaints data and provides a description
of local meteorology.
Section 3.0 Outlines the EPA impact assessment criterion for dust deposition.
Section 4.0 Describes the dust monitoring methodology for dust deposition gauges, Petri dish and brush
sampling as well as laboratory analysis.
Section 5.0 Summarises the results of the dust deposition monitoring and results of the additional
identification analyses undertaken including the results from the stereomicroscopy, stereo
electron microscopy and energy dispersive x-ray spectroscopy.
Section 6.0 Provides a discussion of the results presented in Section 5.0 and recommendations for
further assessment.
Section 7.0 Conclusion of the report.
Section 8.0 References.
Appendix A Community Flyer.
Appendix B Provides a comparison of meteorological data from NSW Office of Environment from
Carrington, Mayfield, Newcastle and Stockton monitoring stations.
Appendix C Provides figures for wind conditions during the time of sampling overlayed onto sampling
locations.
Appendix D DDG Field Sheets.
Appendix E Laboratory certificates of analysis for dust deposition.
Appendix F Laboratory reports for the stereomicroscopy analysis, scanning electron microscopy and
energy dispersive x-ray spectroscopy analysis.
Appendix G Detailed Summary of Identification Analysis Results.

Lower Hunter Dust Deposition Study
4 AECOM
This page has been left blank intentionally.

Lower Hunter Dust Deposition Study
5 AECOM
2.0 Project Location and Description
2.1 Study Area
The primary focus of the study area within the Newcastle LGA was determined by the distribution of dust
complaints data received by the EPA between 1 January 2011 and 31 March 2014 as discussed in Section 2.3.1.
Locations for dust monitoring were selected on the basis of historical complaints data and feedback from the
Lower Hunter Dust Deposition Project Reference Group (LHDDPRG). Figure 13 shows the locations of the DDGs
and identifies the general study area, along with the location of the rail network in the study area.
2.2 Dust Sources and Dust Composition
2.2.1 Potential Regional Dust Sources
There are a number of potential sources of particulate matter in the Hunter Valley including both point and diffuse
sources. These include:
- Windblown dust from unsealed surfaces;
- Sea salt;
- Coal mining, coal trains and associated stockpiles;
- Industrial emissions;
- Farming;
- Bushfires and hazard reduction burns;
- Electricity generation;
- Motor vehicle emissions; and
- Shipping.
Specifically in the study area, potential sources of industrially generated dust are concentrated around the
suburbs of Mayfield, Mayfield East, Waratah, Carrington, Kooragang Island, Islington and Wickham. These
suburbs form a central hub for industrial manufacturing facilities and include the Port of Newcastle and the rail line
delivering coal to Newcastle’s coal terminals.
2.2.2 Dust Composition
The purpose of this report is to provide an assessment of dust deposition rates and composition in the LGA. Dust
composition varies depending on the locality of the sample and the locally contributing sources of dust. For the
purpose of this study the following constituents that make up local dust deposits have been examined:
- Inorganic materials and minerals including:
Soil and rock particles;
Salts; and
Alumina.
- Black particulates including:
Coal;
Soot; and
Rubber;
- Slime and fungus;
- Insect and plant debris;
- Miscellaneous fibres; and
- Paint.

Lower Hunter Dust Deposition Study
6 AECOM
2.2.3 History of Dust Deposition in the Newcastle Region
Dust deposition has been monitored in the Newcastle region for many years by various organisations including
the NSW Government, Newcastle City Council and industries. Dust deposition rates have decreased significantly
over the last 70 years as heavy industry in the area has decreased and dust control measures and practices have
improved. Table 2 presents indicative dust deposition rates for Sydney, Newcastle and Wollongong to provide an
indication of historical dust deposition rates. Source: Bridgman, H.A. (2015) for 2001-2009 data
Figure 7 presents annual average deposition rates for five monitoring locations in the Newcastle Region for the
period 2001 to 2009 (monitoring performed by Newcastle City Council) to provide a more recent indication of
deposition rates in the study area. Included in this figure are DDG results for the LHDDP locations of Stockton
North, Mayfield East and Waratah in order to provide a general comparison to recent levels where monitoring data
is available for suburbs included in the LHDDP.
Table 2 Historical NSW dust deposition rates (1950 – 1980)
Decade Dust Deposition (g/m2.month)
Sydney Newcastle Wollongong
1950 9 34 13
1960 8 24 11
1970 4 9 8
1980 2 2 2
Source: Ferrari, L., (2015, 2000)
Source: Bridgman, H.A. (2015) for 2001-2009 data
Figure 7 Historical Newcastle region dust deposition rates (2001 – 2009)
2.2.4 Other Dust Deposition Composition Studies
A number of recent studies in Queensland coal mining areas have been conducted by the Queensland
Government to identify the composition of locally deposited dust and specifically the contribution of coal. These
include the Tennyson Dust Monitoring Investigation (Queensland Government 2012) and the Western –
Metropolitan Rail Systems Coal Dust Monitoring Program (Queensland Government 2013).
The Tennyson Dust Monitoring Investigation was conducted over a one month period and found that:
- The major component of dust samples from Tennyson monitoring sties was soil and rock dust comprising 40
percent (%) or more of the total deposited dust collected;
- Coal was found to comprise between 10 to 20% of total deposited dust;
- Black rubber dust on average comprised 10% of deposited dust; and
- Plant and insect debris was also found in the dust samples.

Lower Hunter Dust Deposition Study
7 AECOM
The Western-Metropolitan Rail Systems Coal Dust Monitoring Program was conducted over a four month period
and concluded that:
- The major component of deposited dust samples was mineral dust (soil and rock dust) comprising 50 to 90%
of total deposited dust;
- Coal was consistently detected at monitoring sites along the rail corridor used by coal trains;
- Only trace amounts of coal were observed in one sample and the background monitoring site located on a
section of rail not used by coal trains;
- Coal was found to comprise on average 10% of total deposited dust with levels as high as 20% observed in
some samples; and
- Black rubber dust on average comprised 10% of deposited dust.
2.3 Complaints Data
2.3.1 Complaints Data pre Monitoring Period
Between 1 January 2011 and 31 March 2014 the NSW EPA’s Environmental Line received 174 community
complaints in the Newcastle LGA regarding dust and particulate matter including smoke. The issues reported
varied considerably and included smoke, general black dust, dust from coal, fertiliser and grain, with spatial and
temporal variations in the reports. Suburbs that registered an above average number of dust complaints over this
period included:
- Carrington - Mayfield East - Stockton
- Hexham - Newcastle - Tighes Hill
- Kooragang - Newcastle East - Wickham
- Maryville - Shortland
Of the 174 community complaints, the majority of complaints registered were black dust (29%), coal dust (18%),
smoke (17%) and grain dust (10%). Black dust and coal dust accounted for almost half of the complaints, initiating
further investigation into potential dust sources, as well as identifying composition and deposition levels in the
Newcastle LGA.
2.3.2 Complaints Data during Monitoring Period
During the study period between October 2014 and October 2015 the NSW EPA’s Environmental Line received
26 community complaints regarding air emissions in the Newcastle LGA. As recorded in previous years (refer to
Section 2.3.1) the complaints varied considerably with nominated sources comprising:
- Industry stack emissions (14);
- Shipping activities (4);
- Coal trains and coal mining (3);
- Track and road maintenance work (2); and
- Other activities (3).
Of the 26 community complaints recorded during the monitoring period, 14 were related to dust deposition or
smoke particulate matter. Of the 14 dust complaints only 6 reports were specifically related to black dust or black
smoke, with 3 reports related to coal mining and coal trains and 3 reports relating to smoke from industrial
emissions. Suburbs which registered black dust complaints were Beresfield, Wickham, Hexham, Sandgate and
Kooragang Island.
Dust complaints received during the monitoring period were found to be less than half the annual average
received over the 1 January 2011 to 31 March 2014 record period (refer to Section 2.3.1). Potential variables
which may have contributed to a decrease in complaints over the study period are; meteorological conditions
(wind, rainfall, temperature and other factors), industrial/mining operations and production rates as well as dust
mitigation measures and practices.

Lower Hunter Dust Deposition Study
8 AECOM
2.4 Meteorology
Meteorology in the Newcastle area is affected by several factors with wind speed and direction largely affected by
topography at the small scale, while factors such as synoptic scale winds affect wind speed and direction on the
larger scale. Wind speed and direction as well as rainfall are important variables in assessing air quality, as they
dictate the direction and distance air pollutants travel and are key factors for dust lift-off from area sources such
as agricultural land and coal stockpiles. Wind speed/direction and rainfall are summarised in Sections 2.4.1 and
2.4.2 respectively with the influence of meteorology on the sampling locations discussed in Section 4.1.3.
2.4.1 Wind Speed and Direction
The NSW Office of Environment and Heritage (OEH) record wind speed and wind direction at four air quality
monitoring stations located within the study area. OEH monitoring stations are located at Carrington, Stockton,
Mayfield West and Newcastle. The Carrington monitoring station is located within the centre of the study area and
following data analysis is considered representative of local meteorological conditions within the study area. Little
variation was observed between Carrington and the other monitoring sites in terms of wind direction and a
comparison of this data is presented in Appendix B.
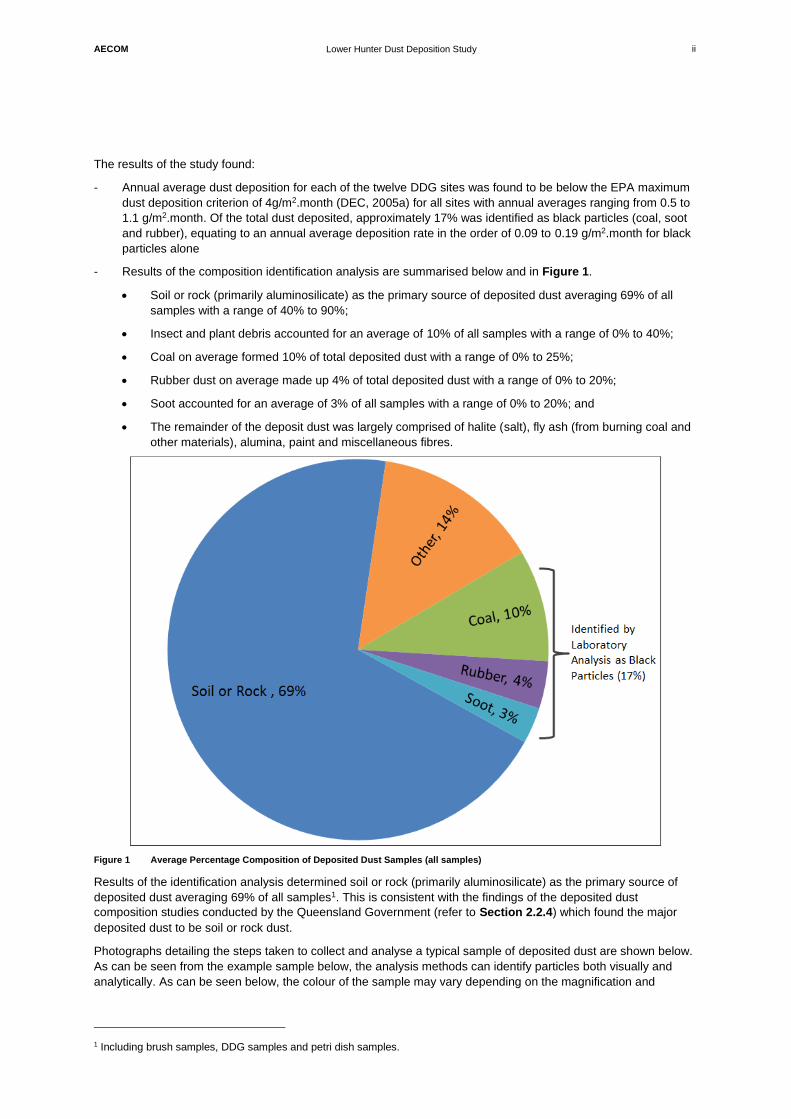
A wind speed frequency distribution and annual and seasonal wind roses for the Carrington OEH site for the study
period between October 2014 and October 2015 are presented in Table 3 and Figure 8 respectively. It can be
seen from Table 3 and Figure 8 that on an annual basis the dominant wind direction is from the west northwest to
northwest; occurring for 25% of the time. The annual average wind speed was found to be 2.7 metres per second
(m/s) which is a light to moderate wind speed. Calms (<0.5m/s) were found to occur for just over one percent of
the monitoring period.
On a monthly basis the average wind speed ranged from 2.0 m/s to 3.1 m/s. June 2015 had the highest wind
speed while the lowest average wind speed was observed in November 2014. In mid to late October 2014 no
dominant wind direction was observed with winds frequenting from the east, south and northwest. From
November 2014 to February 2015 the dominant wind direction was from the east northeast and a higher portion of
southeast to southerly winds were observed in March and April 2015. From May 2015 to mid-October 2015 the
predominant wind direction was from the northwest, similar to the annual trend observed.
Table 3 Wind Speed Frequency Distribution of OEH Carrington Meteorology Station - Oct 2014 to Oct 2015 data (%)
Wind
Direction
Wind Speed Class (m/s)
0.5-2.1 2.1-3.6 3.6-5.7 5.7-8.8 8.8-11.1 ≥11.1 Total
N 2.0 0.8 0.1 <0.1 <0.1 <0.1 2.9
NNE 1.3 1.3 0.1 <0.1 <0.1 <0.1 2.7
NE 1.7 2.0 0.2 <0.1 <0.1 <0.1 4.0
ENE 2.2 3.3 2.4 0.2 <0.1 <0.1 8.2
E 1.6 2.9 2.4 0.1 <0.1 <0.1 7.1
ESE 1.6 2.1 0.8 <0.1 <0.1 <0.1 4.5
SE 1.1 2.7 1.3 <0.1 <0.1 <0.1 5.1
SSE 0.9 1.9 2.8 0.5 <0.1 <0.1 6.0
S 1.0 1.7 2.4 1.9 <0.1 0.1 7.1
SSW 1.3 1.7 1.3 0.5 <0.1 <0.1 4.9
SW 2.4 2.2 0.4 <0.1 <0.1 <0.1 5.0
WSW 3.5 1.3 0.2 <0.1 <0.1 <0.1 5.1
W 2.7 1.2 0.4 0.1 <0.1 <0.1 4.3
WNW 3.1 2.9 2.9 0.9 <0.1 <0.1 9.8
NW 6.6 4.9 2.5 0.8 <0.1 <0.1 14.7
NNW 3.9 2.1 0.3 <0.1 <0.1 <0.1 6.3
Sub-Total 36.9 35.0 20.6 5.0 0.1 0.1 97.7
Annual (15 Oct 2014 to 15 Oct, 2015). Total periods = 8,784; Valid periods = 8,703; Calm wind periods = 123; Calm winds: 1.4%
Lower Hunter Dust Deposition Study
9 AECOM
Figure 8 Annual and Monthly Wind Roses at OEH Carrington Monitoring Station between 15 October 2014 and 15 October 2015
Annual
October 2014
November 2014
December 2014
January 2015
February 2015
March 2015
April 2015
May 2015
June 2015
July 2015
August 2015
September 2015
October 2015
WRPLOT View - Lakes Environmental Software
WIND ROSE PLOT:
Station # 99
COMMENTS: COMPANY NAME:
MODELER:
DATE:
18/11/2015
PROJECT NO.:
NORTH
SOUTH
WEST EAST
4%
8%
12%
16%
20%
WIND SPEED
(m/s)
>= 11.10
8.80 - 11.10
5.70 - 8.80
3.60 - 5.70
2.10 - 3.60
0.50 - 2.10
Calms: 1.40%
TOTAL COUNT:
8703 hrs.
CALM WINDS:
1.40%
DATA PERIOD:
Start Date: 15/10/2014 - 00:00End Date: 15/10/2015 - 23:00
AVG. WIND SPEED:
2.74 m/s
DISPLAY:
Wind SpeedDirection (blowing from)
WRPLOT View - Lakes Environmental Software
WIND ROSE PLOT:
Station # 99
COMMENTS: COMPANY NAME:
MODELER:
DATE:
18/11/2015
PROJECT NO.:
NORTH
SOUTH
WEST EAST
2%
4%
6%
8%
10%
WIND SPEED
(m/s)
>= 11.10
8.80 - 11.10
5.70 - 8.80
3.60 - 5.70
2.10 - 3.60
0.50 - 2.10
Calms: 1.65%
TOTAL COUNT:
405 hrs.
CALM WINDS:
1.65%
DATA PERIOD:
Start Date: 15/10/2014 - 00:00End Date: 31/10/2014 - 23:00
AVG. WIND SPEED:
2.69 m/s
DISPLAY:
Wind SpeedDirection (blowing from)
WRPLOT View - Lakes Environmental Software
WIND ROSE PLOT:
Station # 99
COMMENTS: COMPANY NAME:
MODELER:
DATE:
18/11/2015
PROJECT NO.:
NORTH
SOUTH
WEST EAST
3%
6%
9%
12%
15%
WIND SPEED
(m/s)
>= 11.10
8.80 - 11.10
5.70 - 8.80
3.60 - 5.70
2.10 - 3.60
0.50 - 2.10
Calms: 1.17%
TOTAL COUNT:
687 hrs.
CALM WINDS:
1.17%
DATA PERIOD:
Start Date: 1/11/2014 - 00:00End Date: 30/11/2014 - 23:00
AVG. WIND SPEED:
3.11 m/s
DISPLAY:
Wind SpeedDirection (blowing from)
WRPLOT View - Lakes Environmental Software
WIND ROSE PLOT:
Station # 99
COMMENTS: COMPANY NAME:
MODELER:
DATE:
18/11/2015
PROJECT NO.:
NORTH
SOUTH
WEST EAST
4%
8%
12%
16%
20%
WIND SPEED
(m/s)
>= 11.10
8.80 - 11.10
5.70 - 8.80
3.60 - 5.70
2.10 - 3.60
0.50 - 2.10
Calms: 1.70%
TOTAL COUNT:
744 hrs.
CALM WINDS:
1.70%
DATA PERIOD:
Start Date: 1/12/2014 - 00:00End Date: 31/12/2014 - 23:00
AVG. WIND SPEED:
3.02 m/s
DISPLAY:
Wind SpeedDirection (blowing from)
WRPLOT View - Lakes Environmental Software
WIND ROSE PLOT:
Station # 99
COMMENTS: COMPANY NAME:
MODELER:
DATE:
18/11/2015
PROJECT NO.:
NORTH
SOUTH
WEST EAST
4%
8%
12%
16%
20%
WIND SPEED
(m/s)
>= 11.10
8.80 - 11.10
5.70 - 8.80
3.60 - 5.70
2.10 - 3.60
0.50 - 2.10
Calms: 0.98%
TOTAL COUNT:
737 hrs.
CALM WINDS:
0.98%
DATA PERIOD:
Start Date: 1/01/2015 - 00:00End Date: 31/01/2015 - 23:00
AVG. WIND SPEED:
2.97 m/s
DISPLAY:
Wind SpeedDirection (blowing from)
WRPLOT View - Lakes Environmental Software
WIND ROSE PLOT:
Station # 99
COMMENTS: COMPANY NAME:
MODELER:
DATE:
18/11/2015
PROJECT NO.:
NORTH
SOUTH
WEST EAST
4%
8%
12%
16%
20%
WIND SPEED
(m/s)
>= 11.10
8.80 - 11.10
5.70 - 8.80
3.60 - 5.70
2.10 - 3.60
0.50 - 2.10
Calms: 1.87%
TOTAL COUNT:
666 hrs.
CALM WINDS:
1.87%
DATA PERIOD:
Start Date: 1/02/2015 - 00:00End Date: 28/02/2015 - 23:00
AVG. WIND SPEED:
2.54 m/s
DISPLAY:
Wind SpeedDirection (blowing from)
WRPLOT View - Lakes Environmental Software
WIND ROSE PLOT:
Station # 99
COMMENTS: COMPANY NAME:
MODELER:
DATE:
18/11/2015
PROJECT NO.:
NORTH
SOUTH
WEST EAST
3%
6%
9%
12%
15%
WIND SPEED
(m/s)
>= 11.10
8.80 - 11.10
5.70 - 8.80
3.60 - 5.70
2.10 - 3.60
0.50 - 2.10
Calms: 2.07%
TOTAL COUNT:
741 hrs.
CALM WINDS:
2.07%
DATA PERIOD:
Start Date: 1/03/2015 - 00:00End Date: 31/03/2015 - 23:00
AVG. WIND SPEED:
2.73 m/s
DISPLAY:
Wind SpeedDirection (blowing from)
WRPLOT View - Lakes Environmental Software
WIND ROSE PLOT:
Station # 99
COMMENTS: COMPANY NAME:
MODELER:
DATE:
18/11/2015
PROJECT NO.:
NORTH
SOUTH
WEST EAST
4%
8%
12%
16%
20%
WIND SPEED
(m/s)
>= 11.10
8.80 - 11.10
5.70 - 8.80
3.60 - 5.70
2.10 - 3.60
0.50 - 2.10
Calms: 1.55%
TOTAL COUNT:
694 hrs.
CALM WINDS:
1.55%
DATA PERIOD:
Start Date: 1/04/2015 - 00:00End Date: 30/04/2015 - 23:00
AVG. WIND SPEED:
2.84 m/s
DISPLAY:
Wind SpeedDirection (blowing from)
WRPLOT View - Lakes Environmental Software
WIND ROSE PLOT:
Station # 99
COMMENTS: COMPANY NAME:
MODELER:
DATE:
18/11/2015
PROJECT NO.:
NORTH
SOUTH
WEST EAST
5%
10%
15%
20%
25%
WIND SPEED
(m/s)
>= 11.10
8.80 - 11.10
5.70 - 8.80
3.60 - 5.70
2.10 - 3.60
0.50 - 2.10
Calms: 0.73%
TOTAL COUNT:
743 hrs.
CALM WINDS:
0.73%
DATA PERIOD:
Start Date: 1/05/2015 - 00:00End Date: 31/05/2015 - 23:00
AVG. WIND SPEED:
2.75 m/s
DISPLAY:
Wind SpeedDirection (blowing from)
WRPLOT View - Lakes Environmental Software
WIND ROSE PLOT:
Station # 99
COMMENTS: COMPANY NAME:
MODELER:
DATE:
18/11/2015
PROJECT NO.:
NORTH
SOUTH
WEST EAST
6%
12%
18%
24%
30%
WIND SPEED
(m/s)
>= 11.10
8.80 - 11.10
5.70 - 8.80
3.60 - 5.70
2.10 - 3.60
0.50 - 2.10
Calms: 0.88%
TOTAL COUNT:
719 hrs.
CALM WINDS:
0.88%
DATA PERIOD:
Start Date: 1/06/2015 - 00:00End Date: 30/06/2015 - 23:00
AVG. WIND SPEED:
2.00 m/s
DISPLAY:
Wind SpeedDirection (blowing from)
WRPLOT View - Lakes Environmental Software
WIND ROSE PLOT:
Station # 99
COMMENTS: COMPANY NAME:
MODELER:
DATE:
18/11/2015
PROJECT NO.:
NORTH
SOUTH
WEST EAST
6%
12%
18%
24%
30%
WIND SPEED
(m/s)
>= 11.10
8.80 - 11.10
5.70 - 8.80
3.60 - 5.70
2.10 - 3.60
0.50 - 2.10
Calms: 1.09%
TOTAL COUNT:
743 hrs.
CALM WINDS:
1.09%
DATA PERIOD:
Start Date: 1/07/2015 - 00:00End Date: 31/07/2015 - 23:00
AVG. WIND SPEED:
2.81 m/s
DISPLAY:
Wind SpeedDirection (blowing from)
WRPLOT View - Lakes Environmental Software
WIND ROSE PLOT:
Station # 99
COMMENTS: COMPANY NAME:
MODELER:
DATE:
18/11/2015
PROJECT NO.:
NORTH
SOUTH
WEST EAST
6%
12%
18%
24%
30%
WIND SPEED
(m/s)
>= 11.10
8.80 - 11.10
5.70 - 8.80
3.60 - 5.70
2.10 - 3.60
0.50 - 2.10
Calms: 0.85%
TOTAL COUNT:
744 hrs.
CALM WINDS:
0.85%
DATA PERIOD:
Start Date: 1/08/2015 - 00:00End Date: 31/08/2015 - 23:00
AVG. WIND SPEED:
2.61 m/s
DISPLAY:
Wind SpeedDirection (blowing from)
WRPLOT View - Lakes Environmental Software
WIND ROSE PLOT:
Station # 99
COMMENTS: COMPANY NAME:
MODELER:
DATE:
18/11/2015
PROJECT NO.:
NORTH
SOUTH
WEST EAST
3%
6%
9%
12%
15%
WIND SPEED
(m/s)
>= 11.10
8.80 - 11.10
5.70 - 8.80
3.60 - 5.70
2.10 - 3.60
0.50 - 2.10
Calms: 0.62%
TOTAL COUNT:
720 hrs.
CALM WINDS:
0.62%
DATA PERIOD:
Start Date: 1/09/2015 - 00:00End Date: 30/09/2015 - 23:00
AVG. WIND SPEED:
2.79 m/s
DISPLAY:
Wind SpeedDirection (blowing from)
WRPLOT View - Lakes Environmental Software
WIND ROSE PLOT:
Station # 99
COMMENTS: COMPANY NAME:
MODELER:
DATE:
18/11/2015
PROJECT NO.:
NORTH
SOUTH
WEST EAST
4%
8%
12%
16%
20%
WIND SPEED
(m/s)
>= 11.10
8.80 - 11.10
5.70 - 8.80
3.60 - 5.70
2.10 - 3.60
0.50 - 2.10
Calms: 1.59%
TOTAL COUNT:
360 hrs.
CALM WINDS:
1.59%
DATA PERIOD:
Start Date: 1/10/2015 - 00:00End Date: 15/10/2015 - 23:00
AVG. WIND SPEED:
2.65 m/s
DISPLAY:
Wind SpeedDirection (blowing from)

Lower Hunter Dust Deposition Study
10 AECOM
2.4.2 Rainfall
In the absence of rainfall being measured at the OEH monitoring stations, data has been obtained from Bureau of
Meteorology stations located at Nobbys Head (Station ID 061055) and Newcastle University (Station ID 061390).
Rainfall influences dust deposition by both wetting surface material and thereby reducing the potential for dust
becoming airborne, as well as having a scrubbing effect on the atmosphere, potentially reducing wind-blown dust
entering the study area as well as removing dust from the air closer to local sources. Figure 9 presents both
historical rainfall data as well as data for the study period as a comparison. Historical average rainfalls are
compared graphically to the project period rainfall in Figure 10.
Figure 9 Bureau of Meteorology Rainfall Data
Figure 10 Comparison of Historical Rainfall and Project Period Rainfall
Comparison with historical data indicates that although the annual average for the study period was similar to long
term annual averages, some monthly rainfall figures varied significantly from long term averages. Most notably,
April 2015 recorded rainfall well in excess of what is typical for this month. The effect of such a large amount of
rainfall may be long lasting, with natural ground potentially staying wet for some time after such an event. The
months of October, November, February and March along with the three winter months experienced below
average rainfall during the study period while December, April, May and September experienced above average
rainfall. Rainfall data for January varied significantly between the Nobbys Head and Newcastle University
locations.

Lower Hunter Dust Deposition Study
11 AECOM
The average rainfall for each DDG monitoring period (calculated from the estimated volume of rainwater collected
in the DDG samples) is also provided in Table 11. It should be recognised that while DDG monitoring periods are
identified by month, the actual sampling periods are not necessarily calendar months e.g. The November DDG
monitoring period ran from 14 November 2014 to 12 December 2014.

Lower Hunter Dust Deposition Study
12 AECOM
This page has been left blank intentionally.
Lower Hunter Dust Deposition Study
13 AECOM
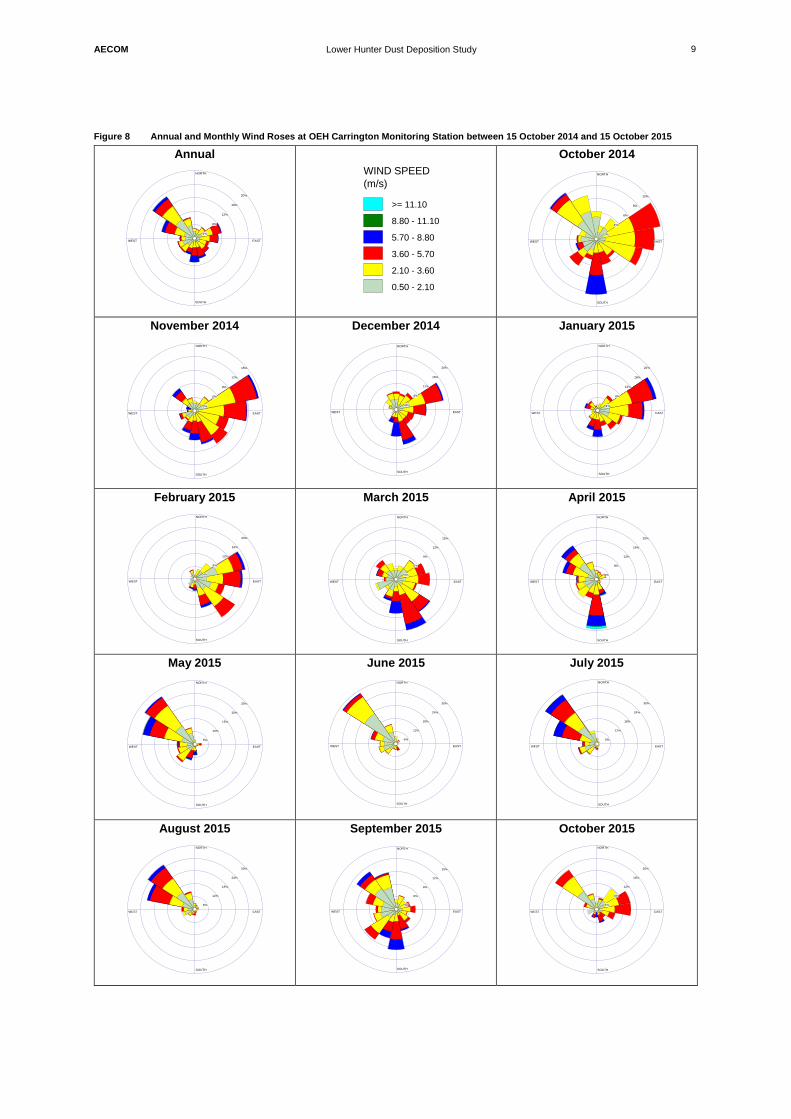
3.0 Impact Assessment Criteria
The assessment criteria applicable in NSW for the assessment of deposited dust are specified in the EPA’s
Approved Methods for the Modelling and Assessment of Air Pollutants in New South Wales (DEC, 2005b), and is
shown in Table 4. The criterion of 4g/m2.month refers to the total maximum dust deposition rate.
A literature review was conducted of international dust deposition criteria and guideline documents. Findings of
the literature review indicated that the NSW EPA total maximum criterion of 4g/m2.month is a conservative value
(generally lower than international standards) when compared to international deposition rate guidelines as listed
in Table 5.
Table 4 Ambient Air Quality Assessment Criteria (DEC 2005b)
Pollutant Averaging Period Criterion Units
Dust deposition as insoluble solids Annual 4 (total maximum) g/m2.month
The dust deposition criterion discussed in Table 4 of this report has been used to assess the dust deposition rates
measured at the DDG monitoring network set up as part of the LHDDP as discussed in Section 4.1.1 and
Section 4.1.2.
Table 5 International Impact Assessment Criteria – Deposited Dust
Source Averaging
Period
Concentration
g/m2.month mg/m2.day
NSW EPA Annual 2 (maximum increase) 67*
4 (maximum total) 133*-
NZ Ministry for the
Environment
Not specified 4 (as an increase above background
concentrations)
133*-
German Federal
Environment
Agency2
Annual 10.5 * 350
UK 'unofficial'
nuisance3
Annual mean 6* 200
Vallack, H. W. &
Shillito, D. E. (1998)4
Monthly mean Open Country 3* (complaints possible),
4.2* (complaints likely)
100 (complaints possible),
140 (complaints likely)
Residential 4.5* (complaints possible), 6*
(complaints likely)
150 (complaints possible),
200 (complaints likely)
Commercial centres 6* (complaints
possible), 7.8* (complaints likely)
200 (complaints possible),
260 (complaints likely)
West Australia
Nuisance Standard
Monthly mean 4* 133 (First loss of amenity)
10* 333 (Unacceptable reduction
in air quality)
West Germany
Nuisance Standard
Monthly mean 10.5* 350 (Possible nuisance)
19.5* 650 (Very likely nuisance)
Malaysia Air Quality
Standard
4* 133
2 Federal Ministry for Environment, Nature Conservation and Nuclear Safety (2002) Determination and Evaluation of Ambient
Air Quality - Manual of Ambient Air Monitoring in Germany 3 Quality of Urban Air Research Group. (1996) "Airborne Particulate Matter in the United Kingdom: Third Report of the Quality of Urban Air Review Group", prepared at the request of the Department of the Environment. University of Birmingham, Birmingham. 4 Vallack, H. W. & Shillito, D. E. (1998), “Suggested guidelines for deposited ambient dust”, Atmospheric Environment, Vol.32, pp.2737-2744

Lower Hunter Dust Deposition Study
14 AECOM
Source Averaging
Period
Concentration
g/m2.month mg/m2.day
* Converted from g/m2.day to g/m2/month for comparison with NSW EPA Standard (assumes 30 days per month)

Lower Hunter Dust Deposition Study
15 AECOM
This page has been left blank intentionally.

Lower Hunter Dust Deposition Study
16 AECOM
4.0 Methodology
4.1 Dust Monitoring Methods
The air quality monitoring comprised of 12 dust deposition gauges (DDGs) installed by AECOM in general
accordance with the Australian Standard AS/NZS 3580.1.1:2007. Samples were collected and analysed for
insoluble solids and ash residue in general accordance with the Australian Standard AS/NZS
3580.10.1:2003(R2014) and the EPA (DEC 2005a) guidelines.
AECOM’s Newcastle Office is National Association of Testing Authorities (NATA) accredited (Accreditation
Number 2778 [14391]) for the installation and collection of DDGs.
The following sections outline the monitoring undertaken for the study. Sampling methods were chosen to
establish long-term trends (dust gauges), undertake short-term spot checks (Petri dishes) and identify long term
composition (swab/brush samples).The monitoring program is summarised in Table 6 with laboratory analysis
detailed in the form of a flow chart in Figure 11.
Table 6 Monitoring Program Frequency by Analysis Counts
Sample Type Analysis Type Samples
per Quarter
Samples
per Year
Dust gauges
Standard suite (Insoluble matter, combustible matter, ash) 36 144
Stereomicroscopy and Scanning Electron Microscopy/Energy
Dispersive X-Ray Spectroscopy1 3 12
Image 3 12
Petri dish
Stereomicroscopy and Scanning Electron Microscopy/Energy
Dispersive X-Ray Spectroscopy 9 36
Image 9 36
Brush
samples
Stereomicroscopy and Scanning Electron Microscopy/Energy
Dispersive X-Ray Spectroscopy 6 24
Image 6 24 1 X-ray diffraction analysis was also originally included in the monitoring program however sufficient material was not collected in the DDG’s to enable these analyses to be undertaken; as such, they have not been included in the monitoring.

Lower Hunter Dust Deposition Study
17 AECOM
Figure 11 Sample Analysis Flow Chart
4.1.1 Dust Deposition Gauges (DDGs)
Dust deposition monitoring is a long-term monitoring strategy used to identify trends in local dust levels, primarily
to provide an indication of the potential nuisance effects of dust fallout. Results are used to determine compliance
with the EPA guideline (which requires at least 12 months of data to establish an annual average), and to identify
long-term dust deposition trends. Monitoring is typically undertaken for periods of at least 12 months in order to
account for seasonal factors
DDGs are collected every 30 ± 2 days and analysed in accordance with the requirements of
AS/NZS 3580.10.1:2003(R2014) (Methods for sampling and analysis of ambient air - Determination of particulate
matter - Deposited matter - Gravimetric method) and the NSW EPA Approved Methods (DEC 2005b). Samples
were analysed for the following parameters:
- Insoluble solids (required for regulatory compliance);
- Combustible material; and
- Ash content (non-combustible portion).
Each month following the collection of DDG samples, wind conditions for the monitoring period were analysed in
conjunction with the locations of potential dust sources and the sampling locations, with one appropriate DDG
sample selected for particle characterisation analysis by the University of Queensland Materials Performance
(UQMP) laboratory. Efforts were made to vary the sample chosen for additional analysis with samples from 11 of
the 12 DDG sites selected for particle characterisation. These samples were analysed using the following
analytical techniques:
- Stereomicroscopy;
- Scanning electron microscopy (SEM); and
- Energy dispersive x-ray spectroscopy (EDS).
The dates for the dust deposition sampling undertaken between October 2014 and October 2015 are shown in
Table 7.
To
ALS
Labora
tory
One Sample/Month to UQMP Laboratory
To UQMP Laboratory
Ash Analysis
(Non-combustible
material)
Calculated
Combustible Matter
(Organic material)
Dust Deposit Gauges
(DDG)
(28-32 days)
Petri Dish Samples
(Short term dust
deposition samples)
Brush Samples
(Surface dust samples)
Stereomicroscopy (StM)
(Initial particle characterisation
and % composition)
Scanning Electron Microscopy
(SEM) (Further characterisation
and % composition)
Energy Dispersive X-Ray
Spectroscopy (EDS) (Elemental
composition of particles)
Calculated Dust
Deposition Rate
(Insoluble solids
as g/m2.month)
Insoluble Solids
Analysis
(Solid particles)
Lower Hunter Dust Deposition Study
18 AECOM
Table 7 Deposited Dust Samples Collection Dates
Sampling Period Exposure Date Collection Date Sample Duration (days)
October 2014 - 17 October 2014
(Carrington and
Newcastle)
- 16 October 2014 (All
other sites)
14 November 2014
(All sites)
28 days Carrington and Newcastle
29 days all other sites
November 2014 14 November 2014 12 December 2014 28
December 2014 12 December 2014 9 January 2015 28
January 2015 9 January 2015 6 February 2015 28
February 2015 6 February 2015 6 March 2015 28
March 2015 6 March 2015 7 April 2015 32
April 2015 7 April 2015 5 May 2015 28
May 2015 5 May 2015 2 June 2015 28
June 2015 2 June 2015 3 July 2015 31
July 2015 3 July 2015 3 August 2015 31
August 2015 3 August 2015 3 September 2015 31
September 2015 3 September 2015 2 October 2015 29
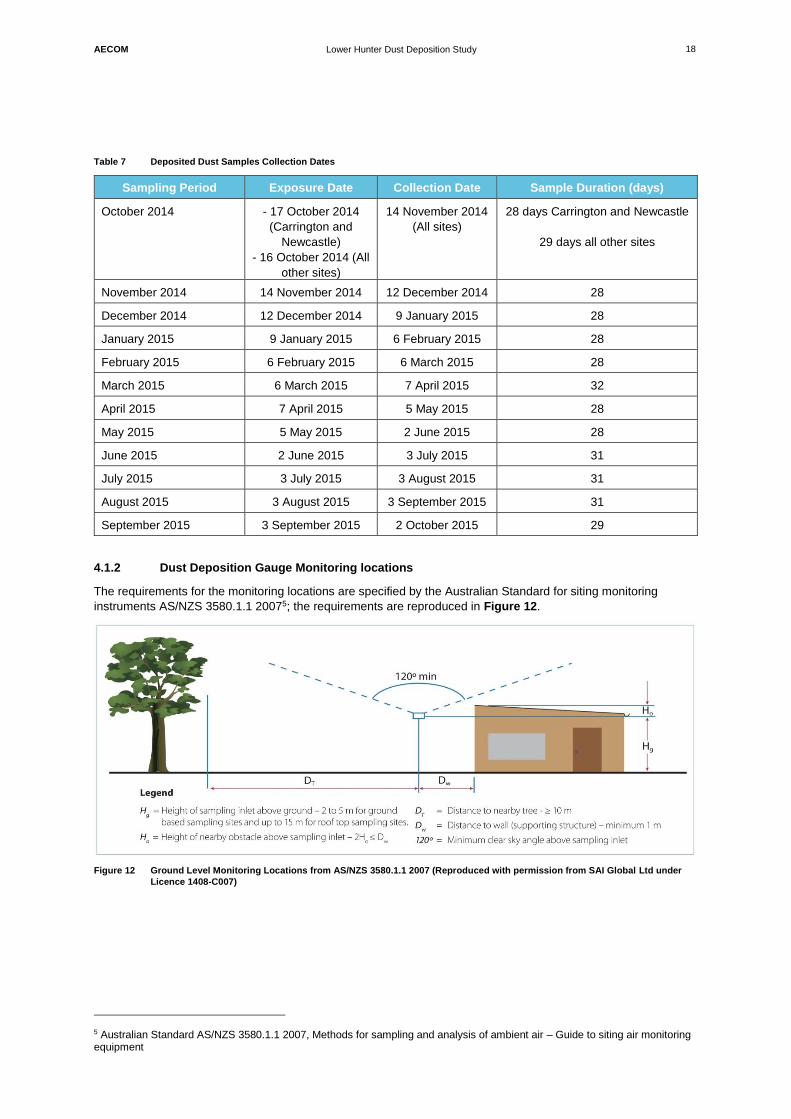
4.1.2 Dust Deposition Gauge Monitoring locations
The requirements for the monitoring locations are specified by the Australian Standard for siting monitoring
instruments AS/NZS 3580.1.1 20075; the requirements are reproduced in Figure 12.
Figure 12 Ground Level Monitoring Locations from AS/NZS 3580.1.1 2007 (Reproduced with permission from SAI Global Ltd under
Licence 1408-C007)
5 Australian Standard AS/NZS 3580.1.1 2007, Methods for sampling and analysis of ambient air – Guide to siting air monitoring equipment

Lower Hunter Dust Deposition Study
19 AECOM
Suburbs included in the monitoring program were chosen based on the history of complaints made to the EPA,
and sampling locations were selected in consultation with relevant community groups and residents. Efforts were
made to select sampling locations at residential properties that were compliant with the siting requirements.
Additional sampling locations were chosen to spatially represent the greater region, provide additional data from
sites near to rail lines, and to provide comparative data from locations not near to rail lines. Best efforts were
made to choose locations which generally meet the following standards however given the built up environment in
which the study was performed, some locations are not entirely compliant with the following siting requirements:
- Australian Standard AS/NZS 3580.1.1 2007, Methods for sampling and analysis of ambient air – Guide to
siting air monitoring equipment; and
- Australian Standard AS/NZS 3580.10.1 2003(R2014), Methods for sampling and analysis of ambient air –
Method 10.1: Determination of particulate matter - deposited dust – gravimetric method.
The locations of the monitoring sites are summarised in Table 8 and shown in Figure 13. A dust gauge was
located at each site and was sampled on a monthly basis. An example location of a DDG monitor is presented in
Figure 14.
Table 8 Monitoring Locations and Details
Suburb Location Selection Reason
Mayfield West OEH Monitoring Station Proximity to Industrial Drive
Mayfield East Public School Complaints
Waratah Community Centre Proximity to rail line
Islington Private Residence Proximity to rail line
Tighes Hill Private Residence Complaints
Carrington OEH Monitoring Station Complaints
Wickham Private Residence Proximity to rail line
Hamilton Retirement Village Proximity to rail line
Newcastle OEH Monitoring Station Complaints
Stockton North* OEH Monitoring Station Complaints
Stockton South* Private Residence Complaints
Newcastle East Foreshore Park Complaints
*For the purpose of monitoring the suburb of Stockton has been divided into two locations; Stockton North and Stockton
South

Lower Hunter Dust Deposition Study
20 AECOM
Figure 13 Dust Deposition Monitoring Locations (DDG’s)

Lower Hunter Dust Deposition Study
21 AECOM
Figure 14 Example DDG location (Waratah)
4.1.3 Petri Dish Sampling
The Petri dishes used in this study were cleaned and did not contain growth media as they were used to collect
dust fall rather than to grow bacteria. The purpose of the sampling is to collect specimens for analysis to identify
dust composition. Petri dish monitoring is a good method for collecting dust in areas where high dust loadings are
likely to occur (but that are not suitable for the installation of a DDG) or in response to dust complaints. Such
areas can include window sills or ledges located in proximity to dust sources. Short term sampling (< 5 days) was
conducted, with sampling sites chosen based on potential sources and the meteorological conditions at the time
of sampling. For the purpose of this study, Petri dish sampling was not used to calculate dust deposition rates,
rather to simply collect dust for particle characterisation analysis.
Petri dish samples were periodically collected at spatially variant locations as outlined in Table 9. For the first two
months, limited Petri dish samples were collected and analysed in order to provide a general understanding of the
likely composition of dust in the area. The required Petri dish exposure time in order to collect sufficient sample
material for analysis was also determined in these two months. This information was used to help guide the future
sampling events.
Efforts were made to sample during periods of higher winds, with locations chosen such that likely sources of dust
were upwind of the sampling locations. The sampling duration for this portion of work was largely dependent on
weather conditions. Efforts were made to avoid rainfall during the sampling periods so that dry samples were
collected, and efforts were made to avoid high variability in wind direction where possible.
Petri dish monitoring is a passive method, which relies on the natural deposition of dust onto the surface of the
dish. The Petri dish needs to remain in the monitoring location until sufficient dust has accumulated to enable
analysis to be undertaken. In the absence of a relevant Australian Standard, the required duration of exposure
varies depending on the deposition rate and the type of analysis required. Initial monitoring and analysis
determined that exposure for 1 - 2 days typically provided a sufficient dust sample for the required laboratory
analysis. Sampling protocols related to quality control and chain of custody procedures were similar to AS/NZS
3580.10.1:2003(R2014).

Lower Hunter Dust Deposition Study
22 AECOM
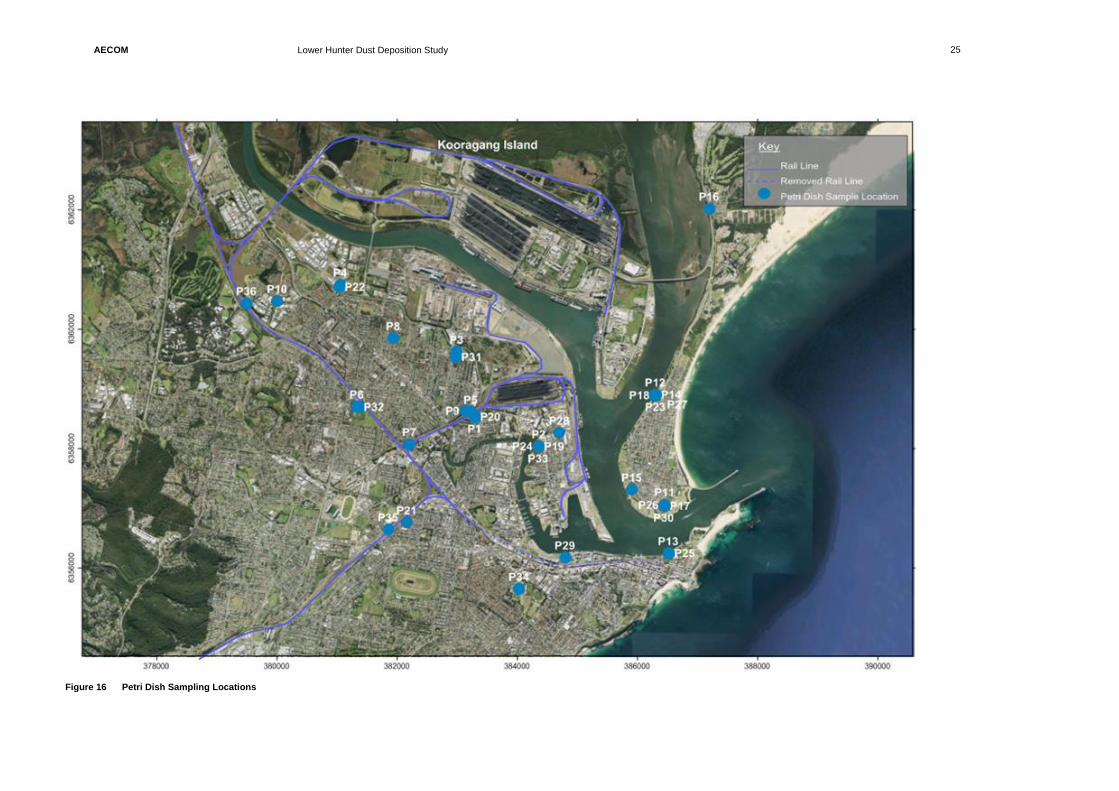
36 Petri dish samples were collected between October 2014 and October 2015. An example Petri dish sampling
location is shown in Figure 15 with a map showing all locations of all samples provided as Figure 16. Details of
meteorology conditions during each sampling period are provided in Table 9 with wind roses for each sampling
period overlayed onto sampling locations provided in Appendix C.
Figure 15 An Example Petri Dish Sample

Lower Hunter Dust Deposition Study
23 AECOM
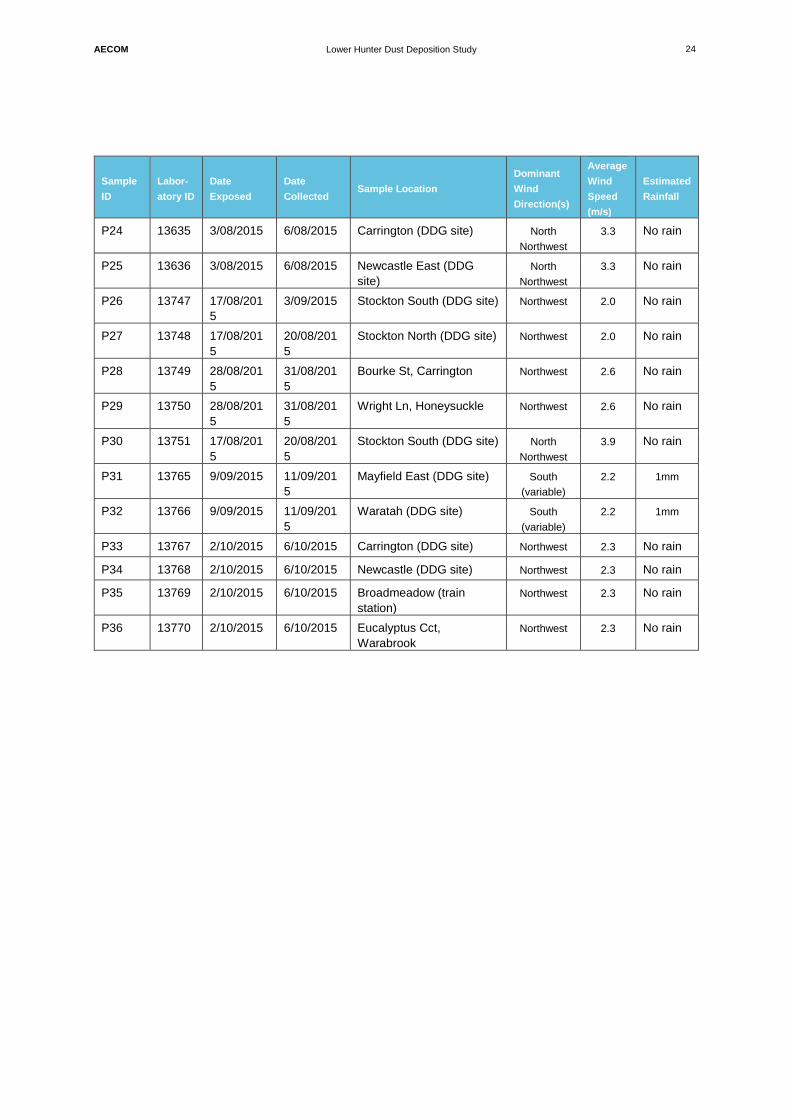
Table 9 Petri Dish Sample Meteorology Conditions
Sample
ID
Labor-
atory ID
Date
Exposed
Date
Collected Sample Location
Dominant
Wind
Direction(s)
Average
Wind
Speed
(m/s)
Estimated
Rainfall
P1 13080 14/11/201
4
15/11/201
4
Tighes Hill (DDG site) South, East
Northeast
3.5 <1mm
P2 13144 17/12/201
4
18/12/201
5
Carrington (DDG site) South
(variable)
3.7 <1mm
P3 13145 17/12/201
4
18/12/201
4
Mayfield East (DDG site) South
(variable)
3.7 <1mm
P4 13296 18/02/201
5
20/02/201
5
Mayfield West (DDG site) East 2.3 <1mm
P5 13297 18/02/201
5
20/02/201
5
Ferndale St, Tighes Hill East 2.3 <1mm
P6 13298 18/02/201
5
20/02/201
5
Waratah (DDG site) East 2.3 <1mm
P7 13299 18/02/201
5
20/02/201
5
Islington (DDG site) East 2.3 <1mm
P8 13300 5/03/2015 6/03/2015 Kerr St, Mayfield South
Southeast,
North
Northwest
3.8 No rain
P9 13301 5/03/2015 6/03/2015 Selwyn St, Tighes Hill South
Southeast,
North
Northwest
3.8 No rain
P10 13399 8/04/2015 8/04/2015 Warabrook Blvde,
Warabrook
North
Northwest
6.8 No rain
P11 13400 8/04/2015 8/04/2015 Stockton South (DDG site) North
Northwest
6.8 No rain
P12 13401 8/04/2015 8/04/2015 Stockton North (DDG site) North
Northwest
6.8 No rain
P13 13470 11/05/201
5
13/05/201
5
Newcastle East (DDG
site)
North
Northwest
4.4 <1mm
P14 13471 11/05/201
5
13/05/201
5
Stockton North (DDG site) North
Northwest
4.4 No rain
P15 13472 11/05/201
5
13/05/201
5
Punt Rd, Stockton North
Northwest
4.4 No rain
P16 13473 11/05/201
5
13/05/201
5
Taylor Rd, Fern Bay North
Northwest
4.4 No rain
P17 13556 3/07/2015 7/07/2015 Stockton South (DDG site) Northwest 2.8 No rain
P18 13557 3/07/2015 7/07/2015 Stockton North (DDG site) Northwest 2.8 No rain
P19 13558 3/07/2015 7/07/2015 Carrington (DDG site) Northwest 2.8 No rain
P20 13559 3/07/2015 7/07/2015 Tighes Hill (DDG site) Northwest 2.8 No rain
P21 13560 3/07/2015 7/07/2015 Hamilton (DDG site) Northwest 2.8 No rain
P22 13633 3/08/2015 6/08/2015 Mayfield West (DDG Site) North
Northwest
3.3 No rain
P23 13634 3/08/2015 6/08/2015 Stockton North (DDG site) North
Northwest
3.3 No rain
Lower Hunter Dust Deposition Study
24 AECOM
Sample
ID
Labor-
atory ID
Date
Exposed
Date
Collected Sample Location
Dominant
Wind
Direction(s)
Average
Wind
Speed
(m/s)
Estimated
Rainfall
P24 13635 3/08/2015 6/08/2015 Carrington (DDG site) North
Northwest
3.3 No rain
P25 13636 3/08/2015 6/08/2015 Newcastle East (DDG
site)
North
Northwest
3.3 No rain
P26 13747 17/08/201
5
3/09/2015 Stockton South (DDG site) Northwest 2.0 No rain
P27 13748 17/08/201
5
20/08/201
5
Stockton North (DDG site) Northwest 2.0 No rain
P28 13749 28/08/201
5
31/08/201
5
Bourke St, Carrington Northwest 2.6 No rain
P29 13750 28/08/201
5
31/08/201
5
Wright Ln, Honeysuckle Northwest 2.6 No rain
P30 13751 17/08/201
5
20/08/201
5
Stockton South (DDG site) North
Northwest
3.9 No rain
P31 13765 9/09/2015 11/09/201
5
Mayfield East (DDG site) South
(variable)
2.2 1mm
P32 13766 9/09/2015 11/09/201
5
Waratah (DDG site) South
(variable)
2.2 1mm
P33 13767 2/10/2015 6/10/2015 Carrington (DDG site) Northwest 2.3 No rain
P34 13768 2/10/2015 6/10/2015 Newcastle (DDG site) Northwest 2.3 No rain
P35 13769 2/10/2015 6/10/2015 Broadmeadow (train
station)
Northwest 2.3 No rain
P36 13770 2/10/2015 6/10/2015 Eucalyptus Cct,
Warabrook
Northwest 2.3 No rain
Lower Hunter Dust Deposition Study
25 AECOM
Figure 16 Petri Dish Sampling Locations

Lower Hunter Dust Deposition Study
26 AECOM
4.1.4 Brush Samples
Brush sampling is an active method for deposited dust collection, where the dust from a target surface is brushed
into a clean Petri dish. Similar to the Petri dish sampling described above, the purpose of brush sampling is to
collect a sample in order to analyse the composition of the dust. Brush sampling is a good method for assessing
the composition of dust which has accumulated over time, such as occurs on window sills or under structures.
As there is no time-dimension for the sample collected (that is, the dust has been landing on that area for an
unknown time period), the sample cannot be compared against a criterion and cannot be linked to a specific
source (as potential contributing sources may have been varied over the sample time). Sampling sites for this
portion of the study were based on proximity to potential sources and areas of interest such as the rail corridor
and around the port. Efforts were made to sample at residences in the community that expressed interest in
taking part in the study.
24 brush samples were collected over the duration of this study with details of the samples provided in Table 10.
An example of a typical brush sample location is shown in Figure 17 with Figure 18 presenting the locations of
the brush samples collected.
Figure 17 A Typical Brush Sample Location

Lower Hunter Dust Deposition Study
27 AECOM
Table 10 Brush Samples
Sample Location Sampling Date Sampling Notes
Islington (DDG site) 12/12/2014 Top of meter box. Generally out of the rain. Appeared to be uncleaned for long period.
Stockton South (DDG site) 12/12/2014 Outdoor sink. Significant amount of hair or fabric fibre in the sample. Unknown source.
Stockton South (DDG site) 6/03/2015 Sample collected from window sill on back porch. Protected from the weather.
Roxburgh Street, South
Stockton
6/03/2015 Sample collected from along a ledge below louvres on the back porch of the property.
Mayfield East (DDG site) 6/03/2015 Sample collected from the top of a fence - generally protected from the weather.
Ferndale St, Tighes Hill 6/03/2015 Sample collected from top of meter box on front porch. Porch faces the rail line with a large amount of brown dust collected.
Forbes St, Carrington 6/03/2015 Top of meter box on front porch. Protected from rain. Appeared to be uncleaned for long period. Large amount of loose brown
coloured dust.
Wickham (DDG site) 6/03/2015 Outdoor window sill on back porch. Protected from the weather.
Phillips St, Hamilton North 6/03/2015 Sample collected from window sill in back porch area. Protected from the weather.
Tighes Hill (DDG site) 6/03/2015 Sample collected from small ledge below windows in the back porch area. Protected from the weather.
Islington (DDG site) 6/03/2015 Sample collected from bathroom window sill (inside house). The window is left slightly open at one end, with the sill left uncleaned
for approximately 1 month before sample was taken. Small amount of dust collected.
Hamilton (DDG site) 2/06/2015 Sample collected from window sill on back porch.
Stockton South (DDG site) 2/06/2015 Sample collected from the top of the meter box (minimal dust) and fire hydrant box (significant amount of dust) situated under an
eave. Surfaces were exposed to the direction of the rail line.
Wickham (1) (DDG site) 3/09/2015 Sample collected from meter box at the side of the house.
Wickham (2) (DDG site) 3/09/2015 Sample collected from rafters on the back porch.
Lott St, Carrington 8/09/2015 Sample collected from top of meter box on porch.
Bull St, Mayfield 8/09/2015 Sample collected from top of horizontal wooden beam structure on outer edge of verandah. Verandah only 1 year old.
Elcho St, Hamilton 8/09/2015 Sample collected from top of meter box under porch. Protected from the weather.
Kings Rd, Tighes Hill 8/09/2015 Sample collected from top of meter box under porch. Protected from the weather.
Neville St, Mayfield 8/09/2015 Sample collected from top of meter box under porch. Protected from the weather.
Hargrave St, Carrington 8/09/2015 Sample collected from top of air conditioner under porch. Protected from the weather.
Bourke St, Mayfield 8/09/2015 Sample collected from top of air conditioner. Air conditioner is partially protected from the weather by the eave of the house. Sample
taken from closer to the house wall where undisturbed.
Stevenson Pl, Newcastle
East
9/09/2015 Sample taken from front porch window sill facing North (towards harbour mouth). Protected from Rain.
Gregson St, Mayfield West 9/09/2015
Sample taken from meter box on front porch. Meter box quite close to the roof but exposed to the direction of Industrial Drive.
Protected from rain. No signs of recent cleaning. Large amount of loose brown dust.

Lower Hunter Dust Deposition Study
28 AECOM
Figure 18 Brush Sampling Locations

Lower Hunter Dust Deposition Study
29 AECOM
4.2 Laboratory Analysis
The standard DDG analyses were performed by ALS, a NATA-accredited and registered laboratory for standard
dust gauge sample analysis. When particle characterisation analyses were required, a small known volume of the
DDG samples was collected prior to analysis and sent to University of Queensland Materials Performance
(UQMP). The calculated dust deposition rate for samples sent to UQMP accounts for the removed portion of
sample.
Petri dish and brush samples collected for dust composition analysis were analysed by UQMP.
- The following analysis was conducted:
Standard dust gauge sample analysis conducted by Australian Laboratory Services (ALS)
Environmental Laboratory, a NATA-accredited and registered laboratory for standard dust gauge
sample analysis (NATA accreditation number 825); and
Stereomicroscopy, scanning electron microscopy (SEM) and energy dispersive x-ray spectroscopy
(EDS) of selected samples by the University of Queensland Materials Performance (UQMP) laboratory.
4.2.1 Standard Depositional Dust Suite
The standard dust suite involved analysing samples for insoluble solids, ash content and combustible material.
Insoluble solids are the total filterable material within each sample. Once filtered, the remaining filtered portion
(solid portion) of the sample is dried and weighed, and the material is burned in a furnace at approximately 850
°C. Combustible materials, such as vegetative matter, coal and insects are lost in the process, and the remaining
non-combustible material is weighed and reported as ash. Although combustible matter is typically used as an
indicator of contamination due to insects and vegetation, coal fines are also combusted in this process. Should a
sample contain a high percentage of coal, the percentage of combustible material would also be expected to be
high. The resultant ash residue provides an indication of the ‘inorganic’ or non-combustible sample contents. As
the purpose of this study was to investigate black dust observed on surfaces around residential properties, the
soluble portions of the samples were not analysed.
Following the standard dust deposition analysis, the gravimetric weight of the solid portion of the sample is known,
allowing the deposition rate to be determined (g/m2.month). The percentage of combustible material within the
sample is also known, allowing the percentage of organic material to be identified (vegetation, insects, coal, soot,
rubber). The non-combustible portion of the sample (represented as ash, following the combustion process) is
also identified and includes mineral and rock particles along with other non-combustibles.
4.2.2 Stereomicroscopy (StM)
Stereomicroscopes have characteristics that are valuable in situations where three-dimensional observation and
perception of depth and contrast is critical to the interpretation of specimen structure. The wide field of view and
variable magnification displayed by stereomicroscopes makes it a useful tool for many tasks.
Stereomicroscopy is the first stage of the identification analyses for dust samples and combines microscopes with
digital cameras so that high magnification digital photos can be obtained. This method enables individual dust
particles to be identified through visual analysis. This method is satisfactory for the preliminary identification of
coarser dust particles. It should be noted that the percentages reported as a result of the sample composition
analysis are best estimates and do not take into account the particle density or the very small sample field
analysed under the microscope. Stereomicroscopy relies on the experienced operator to determine the sample
composition. Results of the stereomicroscopy assist to provide a percentage contribution for each of the
deposited dust components identified in Section 2.2.2.

Lower Hunter Dust Deposition Study
30 AECOM
Figure 19 Example StM Images
4.2.3 Scanning Electron Microscopy (SEM)
Scanning electron microscopy (SEM) is a method for high-resolution and long-depth-of-field imaging of the
sample surface and near-surface. The SEM uses a focused beam of high-energy electrons (produced at the top
of the microscope by an electron gun) to generate a variety of signals at the surface of solid specimens. The
electron beam follows a vertical path through the microscope, which is held within a vacuum. The beam travels
through electromagnetic fields and lenses, which focus the beam down toward the sample. Once the beam hits
the sample, electrons and X-rays are ejected from the sample. Detectors collect these X-rays, backscattered
electrons and secondary electrons and convert them into a signal that is sent to a screen similar to a television
screen.
The signals that derive from electron-sample interactions reveal information about the sample including external
morphology (texture), chemical composition, and crystalline structure and orientation of materials making up the
sample.
SEM is used when fine dust particles need more detailed investigation and characterisation and when semi-
quantitative and qualitative information is needed on the composition of the dust. The additional magnification
allows the particle geometry and structure to be observed further assisting in identifying dust particles and
confirming the findings of the StM analysis.
Figure 20 Example SEM images for multiple particles (left) and a single particle (right).
4.2.4 Energy Dispersive X-Ray Spectroscopy (EDS)
Energy Dispersive X-Ray Spectroscopy (EDS) systems are attachments to Electron Microscopy instruments
(SEM or Transmission Electron Microscopy (TEM)) where the imaging capability of the microscope identifies the
specimen of interest. The data generated by EDS analysis consist of spectra showing peaks corresponding to the
elements making up the true composition of the sample being analysed. Elemental mapping of a sample and
image analysis are also possible.

Lower Hunter Dust Deposition Study
31 AECOM
When combined with other imaging tools as discussed, EDS can provide elemental analysis on areas as small as
nanometres in diameter. EDS was used in combination with SEM to further confirm the composition of both
multiple particles and individual particles. The EDS scan area can be seen by the blue box (multiple particles) and
crosshair (single particle) in Figure 20 above, with the elemental composition of these scans shown in Figure 20.
Figure 21 Example EDS scans of the two SEM images above in Figure 20.
In order to undertake the EDS analytical process, sampled particulate material is collected on a carbon-based
backing tape for analysis. Ideally the coverage of the particles on this tape would be sufficient such that there is
no backing tape showing during the analysis. In some instances, small sample sizes, particularly for Petri dish
samples meant that often achieving a complete uniform coverage of particles on the backing tape was not
possible. The result of this is that the carbon backing tape is visible to the EDS analysis, resulting in an elevated
reading for carbon. Although affecting the EDS spectrum, this interference does not affect the percentages of
each particle type reported in the stereomicroscopy analysis (Section 5.2.1) and throughout this report. Samples
which have experienced this interference have been identified in the results section below.
4.2.5 Chain of Custody Protocols
Chain of Custody (CoC) procedures were followed to maintain and document sample possession from the time of
collection to handover to the laboratory for analysis. CoC records accompanied samples at all times once the
samples were collected. When transferring possession of the samples, the individuals relinquishing and receiving
the samples signed, dated, and noted the time of transfer on the CoC record. The CoCs also included any field
notes that may assist with analysis.
AECOM field staff reviewed all CoC documentation prior to dispatch of the samples to the laboratory.
Appropriately signed CoC records were sent from the laboratory to AECOM via email to confirm sample delivery.

Lower Hunter Dust Deposition Study
32 AECOM
5.0 Monitoring Results
The results of the monitoring undertaken between October 2014 and October 2015 are summarised in the
following sections. Field sheets relating to DDG sample collections are provided in Appendix D. The results of the
standard dust deposition analyses are discussed in Section 5.1 and laboratory analysis certificates for the
standard dust suite undertaken by ALS Environmental are presented in Appendix E. The results of the
composition identification analyses undertaken, including the results from the stereomicroscopy, scanning
electron microscopy and energy dispersive x-ray spectroscopy analysis are discussed in Section 5.2. Laboratory
test reports for the identification analyses undertaken by UQMP are presented in Appendix F.
5.1 Standard Dust Deposition Analyses
The levels of insoluble solids captured in the deposited dust are summarised in Table 11 and presented
graphically in Figure 22. Annual average dust deposition rates recorded during the monitoring period were below
the EPA 4g/m2.month maximum dust deposition criterion for all sites. The highest annual average dust deposition
rate was found to occur at Islington (1.1g/m2.month) and the lowest annual dust deposition rate occurred at
Newcastle (0.5g/m2.month). All other sites were found to have relatively similar dust deposition rates ranging from
0.7 to 0.9 g/m2.month resulting in an overall annual average of 0.8 g/m2.month for the study period.
It can be seen from Table 11 and Figure 22 that the highest monthly dust deposition rate (2.7g/m2.month)
occurred at Stockton South in the February 2015 monitoring period (6 February to 6 March 2015). During this
period dust deposition rates were found to be generally higher across the study area with the maximum monthly
dust deposition rate recorded for the sampling locations of Mayfield West, Mayfield East, Waratah, Islington,
Tighes Hill and Stockton South. Elevated dust deposition levels were also recorded at Carrington, Wickham and
Newcastle during the February 2015 monitoring period. This period returned an average deposition rate of
1.5g/m2.month against an overall average for the study of 0.8g/m2.month.
Meteorology data for February indicates winds were predominantly from the East quadrant, with the majority of
deposition gauges collecting in the order of 45mm of rainwater over this monitoring period. While there is an
increase in deposition rates measured during the February monitoring period, results remained below the EPA
annual average criterion.
Dust deposition was also above the study average for the October 2014 and November 2014 monitoring periods
with monthly maximums recorded at Carrington, Wickham, Newcastle and Stockton North.
Upon collection, DDG samples were assessed for water level (rainwater), colour, turbidity and decomposing
organic matter. These field notes are vital in determining whether a sample may be contaminated.
A sample may be deemed to be contaminated if it is either highly turbid or discoloured, shows visual evidence of
organic contamination (e.g. bird droppings, insects, vegetation) or appears to have been impacted by localised
dust generation (e.g. earthworks).
Several DDG samples have been deemed to be contaminated and these are identified in Table 11.

Lower Hunter Dust Deposition Study
33 AECOM
This page has been left blank intentionally.

Lower Hunter Dust Deposition Study
34 AECOM
Table 11 Deposited Dust – Insoluble Solids (g/m2.month)
Site Monthly Dust Deposition Rates (g/m2.month) Annual
Average
(g/m2.month) Oct 14 Nov 14 Dec 14 Jan 15 Feb 15 Mar 15 Apr 15 May 15 Jun 15 Jul 15 Aug 15 Sep 15
Mayfield West 0.6 1.3 0.7 0.8 2.2 0.4 0.2 0.3 1.4c 0.4 0.8 0.5 0.7
Mayfield East 2.6c 12.0c 3.3c 0.9 1.5 0.8 0.7 0.3 0.8 0.8 1.2 0.5 0.8
Waratah 1.1 0.9 0.5 0.6 1.4 1.0 0.5 0.2 1.2 1.4 0.6 0.5 0.8
Islington 1.9 1.3 1.4 0.8 2.0 0.9 0.6 0.6 0.9 1.3 1.3 0.4 1.1
Tighes Hill 1.6 1.3 1.4 0.5 2.2 0.7 0.3 0.5 0.8 0.7 1.0 0.3 0.9
Carrington 1.1 1.2 0.8 0.6 1.1 0.8 0.2 0.3 0.9 1.0 0.9 1.0 0.8
Wickham 1.2 1.4 1.2 0.5 1.3 0.6 0.3 0.6 0.9 0.8 0.9 0.4 0.8
Hamilton 1.3 1.1 0.8 0.3 1.1 0.8 1.3c 0.6 0.6 0.5 1.0 0.5 0.8
Newcastle 0.8 1.6 0.5 0.4 1.0 0.2 0.3 0.2 0.3 0.3 0.5 0.4 0.5
Stockton North 0.9 1.2 0.4 0.5 0.5 0.6 0.3 0.7 0.8 0.8 0.9 0.5 0.7
Stockton South 1.6 1.4 0.6 0.4 2.7 0.7 0.4 0.3 0.5 0.6 0.6 0.4 0.9
Newcastle
East
0.7 1.1 0.9 1.4 0.7 0.9 0.8 0.5 0.5 0.8 0.3 0.6 0.8
Average
Deposition 1.2 1.3 0.8 0.6 1.5 0.7 0.4 0.4 0.7 0.8 0.8 0.5 0.8
Average
Rainfall (mm) 30 110 25 175 50 160 >235* 70 95 20 30 145 NA
c = contaminated sample
* Samples full due to very high rainfall
Note 1: Samples collected at Mayfield East in October, November and December 2014 were considered to be contaminated due to the presence of beetles in the samples. The April 2015 sample
collected at Hamilton was found to contain a high percentage of organic material (vegetation), and the sample collected at Mayfield West in June 2015 contained glass fragments due to the stem of the
funnel breaking. Sample data deemed to be contaminated have been excluded from the annual average and plot for the relevant site.
Note 2: Average rainfall has been calculated from the estimated volume of rainwater collected in the DDG samples for each period. This should be considered indicative only.

Lower Hunter Dust Deposition Study
35 AECOM

Lower Hunter Dust Deposition Study
36 AECOM
Figure 22 Dust Deposition Monthly Results Plot

Lower Hunter Dust Deposition Study
37 AECOM
5.2 Identification Analyses
The following subsections discuss the results of the stereomicroscopy, SEM and EDS analysis. A total of 24 brush
samples, 12 DDG samples and 36 Petri dish samples underwent particle identification analysis at UQMP. Results
of the stereomicroscopy (used to classify dust particles through visual analysis) are presented in Section 5.2.1.
The SEM (used to characterise fine dust particles by their texture, chemical composition and crystalline structure)
and EDS (used to identify the elemental spectra of the sample materials) are presented in Section 5.2.2. As
noted in Section 1.3, the LHDDPRG agreed that for the purpose of this study, the term black dust would refer to
the total dust deposited and observed on surfaces around households and collected during the sampling program
for analysis to identify particle constituents. The laboratory analysis identified that the dust samples typically
contained predominantly brown inorganic material consisting of rock and soil particles and darker particles such
as coal, soot and rubber particles (identified as black particles).
Laboratory reports for the stereomicroscopy, SEM and EDS analysis undertaken by UQMP are presented in .
5.2.1 Stereomicroscopy
Results of the stereomicroscopy provide a percentage contribution for each of the deposited dust components
identified in Section 2.2.2. The percentages quoted are best estimates and do not take into account the particle
density or the very small sample field analysed under the microscope and rely on the experienced operator to
determine the sample composition. The average percentage contribution of components of deposited dust across
all samples that underwent composition analysis is presented in Figure 23. It can be seen in Figure 23 that the
primary source of deposited dust is soil and rock particles, on average making up 69% of deposited dust. Other
sources of deposited dust, on average are coal (10%), rubber (4%) and soot (3%), with salt and other (including
insects and vegetation) accounting for 14% of the composition.
Figure 23 Average Percentage Composition of Deposited Dust Samples (all samples)
A summary of the results of the stereomicroscopy analysis for each sampling technique are presented in Table 12
to Table 14. Table 12 to Table 14 provide a breakdown of the dust sample composition for brush, DDG and Petri
dish samples, including those identified as black particles (coal, soot and rubber). The percentage composition of
rock dust, other organics, inorganics and other materials are also shown in Table 12 to Table 14. A more
detailed summary of the results which provide a breakdown of the organic, inorganic and other constituents is
presented in Appendix G. Examples of images taken from the stereomicroscopy analysis are presented in
Figure 24 and are indicative of the wide range of particulates found within the dust samples collected.
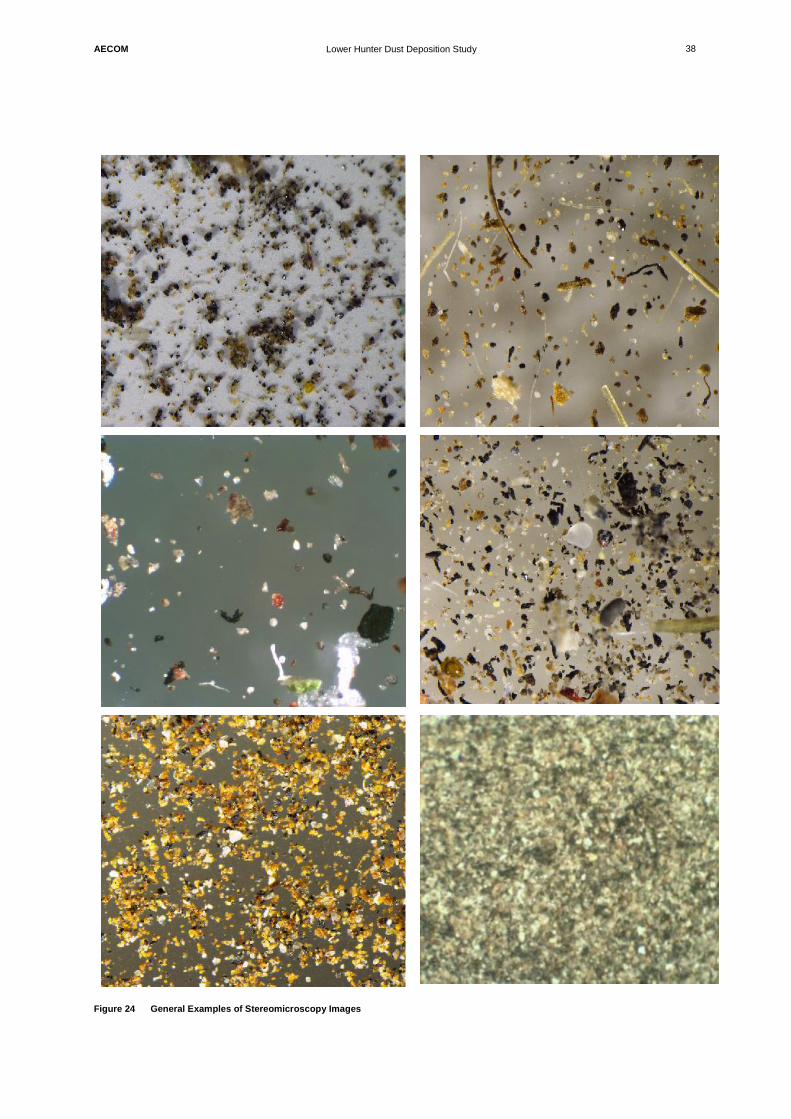
Lower Hunter Dust Deposition Study
38 AECOM
Figure 24 General Examples of Stereomicroscopy Images

Lower Hunter Dust Deposition Study
39 AECOM
5.2.1.1 Brush Sample Results
24 brush samples were collected as part of the study in order to analyse the composition and patterns of long
term dust accumulation. Based on the visual analysis shown in Table 12, brush samples indicate that long term
deposited dust was primarily composed of soil or rock making up 45 to 95% of the samples examined with an
average of 74%.
The black particles (coal, soot and rubber) observed in brush samples was found to be between 0 and 30%,
averaging 14% and was detected in 21 of the 24 samples. Of these, the major constituent of was found to be coal
(9% on average) in most cases with smaller contributions of soot (3% on average) and rubber (2% on average).
The highest percentages of black particles were recorded at Stockton South (sample B13), Wickham (B14) and
Newcastle East (B23), recording 30% of coal, soot and rubber combined within these samples. The contribution of
black particles at Stockton was found to be highly variable ranging from 7 to 30%, while the contribution black
particles at Wickham was relatively consistent ranging between 22 and 30% of the sample. Only one brush
sample was collected at Newcastle East which contained traces of coal, soot and rubber. No notable black
particles were recorded in brush samples for Mayfield East (B5), Hamilton North (B9), or one of two Tighes Hill
samples (B10).
When reviewing the breakdown of black particles (coal, soot and rubber) at each site, the following was noted
(refer to Table 12):
- The highest levels of coal within brush samples were observed at Wickham and Stockton South (20%), with
above average levels (15%) observed at Newcastle, Tighes Hill, Mayfield and Carrington;
- The highest levels of soot within brush samples were observed at Stockton South with two samples yielding
10% soot. All other samples were comprised of equal to or less than 5% soot; and
- The highest levels of rubber within brush samples were observed at Hamilton, Stockton South, Wickham and
Newcastle East (10%). All other samples were comprised of equal to or less than 5% rubber.
As there is no time-dimension for the brush samples collected (that is, the dust has been landing on that area for
an unknown time period), the results cannot be compared against a criterion and cannot be linked to a specific
source (as potential contributing sources may have been varied over the sample time).

Lower Hunter Dust Deposition Study
40 AECOM
Table 12 Stereomicroscopy Results for Brush Samples: Visual Composition Identification Analysis
Sample ID
Analysis ID
Date Collected
Sampling site
Coal,
Soot
and
Rubber
(%)
Percentage of Sample (%)
Coal Soot Black
Rubber Soil or
Rock
Other
Inorganics
and
Minerals
General
Organic Other
B1 13146 12/12/2014 Islington (DDG site) 5 5 0 0 95 0 0 0
B2 13147 12/12/2014 Stockton South (DDG site) 15 5 10 0 50 0 5 30
B3 13287 6/03/2015 Stockton South (DDG site) 7 5 2 0 68 0 20 5
B4 13288 6/03/2015 Roxburgh Street, South Stockton 20 10 10 0 65 0 5 10
B5 13289 6/03/2015 Mayfield East (DDG site) 0 0 0 0 95 5 0 0
B6 13290 6/03/2015 Ferndale St, Tighes Hill 5 5 0 0 80 5 5 5
B7 13291 6/03/2015 Forbes St, Carrington 5 5 0 0 90 5 0 0
B8 13292 6/03/2015 Wickham (DDG site) 22 20 2 0 73 0 5 0
B9 13293 6/03/2015 Phillips St, Hamilton North 0 0 0 0 80 10 10 0
B10 13294 6/03/2015 Tighes Hill (DDG site) 0 0 0 0 90 0 10 0
B11 13295 6/03/2015 Islington (DDG site) 15 10 5 0 55 0 30 0
B12 13497 2/06/2015 Hamilton (DDG site) 20 10 0 10 70 0 10 0
B13 13498 2/06/2015 Stockton South (DDG site) 30 20 0 10 65 5 0 0
B14 13752 3/09/2015 Wickham (1) (DDG site) 30 15 5 10 70 0 0 0
B15 13753 3/09/2015 Wickham (2) (DDG site) 20 10 5 5 65 0 15 0
B16 13754 8/09/2015 Lott St, Carrington 15 5 5 5 50 35 0 0

Lower Hunter Dust Deposition Study
41 AECOM
Sample ID
Analysis ID
Date Collected
Sampling site
Coal,
Soot
and
Rubber
(%)
Percentage of Sample (%)
Coal Soot Black
Rubber Soil or
Rock
Other
Inorganics
and
Minerals
General
Organic Other
B17 13755 8/09/2015 Bull St, Mayfield 15 5 5 5 60 25 0 0
B18 13756 8/09/2015 Elcho St, Hamilton 5 5 0 0 95 0 0 0
B19 13757 8/09/2015 Kings Rd, Tighes Hill 15 15 0 0 85 0 0 0
B20 13758 8/09/2015 Neville St, Mayfield 15 15 0 0 75 10 0 0
B21 13759 8/09/2015 Hargrave St, Carrington 15 15 0 0 75 10 0 0
B22 13760 8/09/2015 Bourke St, Mayfield 10 5 5 0 90 0 0 0
B23 13761 9/09/2015 Stevenson Pl, Newcastle East 30 15 5 10 45 10 15 0
B24 13762 9/09/2015 Gregson St, Mayfield West 15 10 5 0 85 0 0 0
Note: For the purpose of this report, results reported by UQMP as “trace” or “no result” have been assumed to be 0%.

Lower Hunter Dust Deposition Study
42 AECOM
5.2.1.2 DDG Sample Results
Visual analysis of the 12 DDG samples presented in Table 13 was performed in order to gain an understanding of
the likely composition of monthly dust deposits at DDG monitoring locations. Similar to the brush sample results,
the analysis shows that the major constituents of deposited dust were generally soil and rock, making up 50 to
95% of the sample6 with an average of 70%.
The combined percentages of coal, soot and rubber within samples was found to range between 0 and 35%,
averaging 18% and was observed at greater than trace levels within 107 of the 12 samples. On average coal was
found to be the largest contributor of black particles within DDG samples (12%) with smaller fractions of soot (4%)
and rubber (2%). The highest percentage of black particles within DDG samples was found at the Stockton North
DDG location; with both samples analysed for particle composition from this location consisting of over 30% black
particles, largely including coal and moderate traces of soot. Notable portions of black particles were also
recorded at Wickham, Hamilton (mainly coal) and Carrington (coal, soot and rubber). No notable black particles
were recorded at Stockton South in the single DDG sample analysed from this location.
When reviewing the percentages of coal, soot and rubber in each of the DDG samples presented in Table 13 the
following was noted:
- The highest levels of coal were observed at Wickham, Stockton North and Hamilton (20%), with above
average levels also observed at Newcastle East (15%).
- The highest levels of soot were observed at Stockton North with two samples yielding 10% soot. All other
samples were comprised of equal to or less than 5% soot; and
- All samples were comprised of equal to or less than 5 % rubber.
6 The sample taken at Mayfield East was deemed to be contaminated and was comprised of 18% soil and rock due to the sample containing high fractions of copper sludge, slime and insect and plant debris. 7 Trace amounts of black particles were found in the other two samples.

Lower Hunter Dust Deposition Study
43 AECOM
Table 13 Stereomicroscopy Results for DDG Samples: Visual Composition Identification Analysis
Sample ID
Analysis ID
Date Exposed
Date Collected
Sampling site
Coal, Soot and
Rubber (%)
Percentage of Sample (%)
Coal Soot Black
Rubber Soil or Rock
Other Inorganics
and Minerals
General Organic
Other
D1 13079 17/10/2014 14/11/2014 Carrington 20 10 5 5 75 0 5 0
D2 13143 12/12/2014 9/01/2015 Islington 5 5 0 0 95 0 0 0
D3 13173 12/12/2014 9/01/2015 Mayfield East 12c 10c 2c 0c 18c 0c 40c 30c
D4 13239 9/01/2015 6/02/2015 Mayfield West 5 5 0 0 95 0 0 0
D5 13286 6/02/2015 6/03/2015 Tighes Hill 0c 0c 0c 0c 50c 0c 30c 20c
D6 13398 6/03/2015 7/04/2015 Waratah 15 5 5 5 75 0 10 0
D7 13469 7/04/1945 5/05/2015 Stockton South 0 0 0 0 65 0 30 5
D8 13496 5/05/2015 2/06/2015 Stockton North 32 20 10 2 63 0 5 0
D9 13555 2/06/2015 3/07/2015 Stockton North 35 20 10 5 60 0 5 0
D10 13632 3/07/2015 3/08/2015 Newcastle East 17 15 2 0 73 0 10 0
D11 13746 3/08/2015 3/09/2015 Wickham 25 20 0 5 50 0 25 0
D12 13764 3/09/2015 2/10/2015 Hamilton 25 20 5 0 50 0 25 0
Note: For the purpose of this report, results reported by UQMP as “trace” or “no result” have been assumed to be 0%.
c = Contaminated (visual analysis). Sample D2 and D5 were encased in a polysaccharide slime and copper sludge preventing accurate visual analysis from being undertaken.
Contaminated D2 and D5 have been excluded from reported composition averages.

Lower Hunter Dust Deposition Study
44 AECOM
5.2.1.3 Petri Dish Sample Results
36 Petri dish samples were collected as part of the study to analyse short term deposited dust composition within
the study area. Results from the Petri dish samples presented in Table 14, like the DDGs and Brush samples,
show the majority of deposited dust is soil and rock particles, making up 40 to 95% of the samples.
Coal, soot and rubber were found to make up 0 to 45% of the samples, averaging 18% and were found to be
present in 318 of 36 samples. Constituent fractions on average were found to be 9% for coal, 3% for soot and 6%
for rubber. The coal and soot fractions were found to be comparative to both DDG and brush samples, but a
higher fraction of rubber dust was found within the Petri dish samples on average. The highest percentage of
black particles was found to occur at the Stockton South DDG site, comprising 45% of a sample from this location
(sample P30), largely including coal and soot with lower levels of rubber. Notable portions of black particles were
also recorded at a number of other sites with 21 of the samples containing 20% or higher fractions of coal, soot
and rubber combined. No black particles were recorded in samples taken at Carrington and Mayfield East
between 17 and 18 December 2014 (P2 and P3) or at Mayfield between 5 and 6 March 2015 (P8).
When reviewing the percentage coal, soot and rubber in each of the samples presented in Table 14 the following
was noted:
- The highest level of coal within Petri dish samples was observed at Stockton South (25%), with above
average levels observed at Stockton North, Fern Bay, Tighes Hill and Hamilton (15 to 20%).
- The highest levels of soot within Petri dish samples were observed at Stockton South with one sample
yielding 20% soot. Above average levels of soot were also observed at Carrington (15%) and Stockton North
(10%).
- The highest levels of rubber recorded in Petri dish samples were 20% recorded at Newcastle East,
Carrington, Honeysuckle, Mayfield East and Waratah. Above average levels of 10 to 15% rubber dust were
also recorded at Tighes Hill, Mayfield West, Newcastle, Broadmeadow and Warabrook.
8 Trace amounts of black particles were found in the remaining five samples.

Lower Hunter Dust Deposition Study
45 AECOM
Table 14 Stereomicroscopy Results for Petri Dish Samples: Visual Composition Identification Analysis
Sample ID
Analysis ID
Date Exposed
Date Collected
Sampling site
Coal,
Soot and
Rubber
(%)
Percentage of Sample (%)
Coal Soot Black
Rubber Soil or
Rock
Other
Inorganic
s and
Minerals
General
Organic Other
P1 13080 14/11/2014 15/11/2014 Tighes Hill (DDG site) 5 5 0 0 90 0 5 0
P2 13144 17/12/2014 18/12/2015 Carrington (DDG site) 0 0 0 0 90 10 0 0
P3 13145 17/12/2014 18/12/2014 Mayfield East (DDG site) 0 0 0 0 95 5 0 0
P4 13296 18/02/2015 20/02/2015 Mayfield West (DDG site) 5 5 0 0 75 0 20 0
P5 13297 18/02/2015 20/02/2015 Ferndale St, Tighes Hill 15 10 5 0 65 0 20 0
P6 13298 18/02/2015 20/02/2015 Waratah (DDG site) 10 10 0 0 60 20 10 0
P7 13299 18/02/2015 20/02/2015 Islington (DDG site) 5 5 0 0 90 5 0 0
P8 13300 5/03/2015 6/03/2015 Kerr St, Mayfield 0 0 0 0 70 20 10 0
P9 13301 5/03/2015 6/03/2015 Selwyn St, Tighes Hill 20 10 0 10 50 20 10 0
P10
13399 8/04/2015 8/04/2015
Warabrook Blvde,
Warabrook 10 10 0 0 50 0 40 0
P11
13400 8/04/2015 8/04/2015
Stockton South (DDG
site) 20 15 5 0 65 0 15 0
P12 13401 8/04/2015 8/04/2015 Stockton North (DDG site) 20 10 10 0 60 0 20 0
P13
13470 11/05/2015 13/05/2015
Newcastle East (DDG
site) 10 10 0 0 85 0 5 0
P14 13471 11/05/2015 13/05/2015 Stockton North (DDG site) 20 20 0 0 75 0 5 0
P15 13472 11/05/2015 13/05/2015 Punt Rd, Stockton 8 5 3 0 87 0 5 0

Lower Hunter Dust Deposition Study
46 AECOM
Sample ID
Analysis ID
Date Exposed
Date Collected
Sampling site
Coal,
Soot and
Rubber
(%)
Percentage of Sample (%)
Coal Soot Black
Rubber Soil or
Rock
Other
Inorganic
s and
Minerals
General
Organic Other
P16 13473 11/05/2015 13/05/2015 Taylor Rd, Fern Bay 25 20 0 5 75 0 0 0
P17
13556 3/07/2015 7/07/2015
Stockton South (DDG
site) 30 10 20 0 65 0 5 0
P18 13557 3/07/2015 7/07/2015 Stockton North (DDG site) 25 20 5 0 75 0 0 0
P19 13558 3/07/2015 7/07/2015 Carrington (DDG site) 20 10 5 5 75 0 5 0
P20 13559 3/07/2015 7/07/2015 Tighes Hill (DDG site) 25 20 0 5 75 0 0 0
P21 13560 3/07/2015 7/07/2015 Hamilton (DDG site) 25 20 0 5 75 0 0 0
P22 13633 3/08/2015 6/08/2015 Mayfield West (DDG Site) 10 0 0 10 70 0 20 0
P23 13634 3/08/2015 6/08/2015 Stockton North (DDG site) 15 10 5 0 75 0 10 0
P24 13635 3/08/2015 6/08/2015 Carrington (DDG site) 15 5 5 5 75 0 10 0
P25
13636 3/08/2015 6/08/2015
Newcastle East (DDG
site) 25 5 0 20 65 0 10 0
P26
13747 17/08/2015 3/09/2015
Stockton South (DDG
site) 15 10 0 5 55 0 30 0
P27 13748 17/08/2015 20/08/2015 Stockton North (DDG site) 20 15 0 5 75 5 0 0
P28 13749 28/08/2015 31/08/2015 Bourke St, Carrington 30 10 0 20 40 0 30 0
P29 13750 28/08/2015 31/08/2015 Wright Ln, Honeysuckle 25 5 0 20 45 0 30 0
P30
13751 17/08/2015 20/08/2015
Stockton South (DDG
site) 45 25 15 5 55 0 0 0

Lower Hunter Dust Deposition Study
47 AECOM
Sample ID
Analysis ID
Date Exposed
Date Collected
Sampling site
Coal,
Soot and
Rubber
(%)
Percentage of Sample (%)
Coal Soot Black
Rubber Soil or
Rock
Other
Inorganic
s and
Minerals
General
Organic Other
P31 13765 9/09/2015 11/09/2015 Mayfield East (DDG site) 25 5 0 20 45 0 25 5
P32 13766 9/09/2015 11/09/2015 Waratah (DDG site) 25 0 5 20 45 0 25 5
P33 13767 2/10/2015 6/10/2015 Carrington (DDG site) 35 10 15 10 55 0 10 0
P34 13768 2/10/2015 6/10/2015 Newcastle (DDG site) 25 5 5 15 40 10 25 0
P35
13769 2/10/2015 6/10/2015
Broadmeadow (train
station) 25 10 5 10 40 5 30 0
P36
13770 2/10/2015 6/10/2015
Eucalyptus Cct,
Warabrook 20 5 5 10 50 10 20 0
Note: For the purpose of this report, results reported by UQMP as “trace” or “no result” have been assumed to be 0%.

Lower Hunter Dust Deposition Study
48 AECOM
5.2.2 Scanning Electron Microscopy and Energy Dispersive X-Ray Spectroscopy
Scanning electron microscopy (SEM) was used to identify fine particulates and to provide a more detailed
investigation and characterisation of each sample as well as to support the results of the stereomicroscopy
analysis. The energy dispersive x-ray spectroscopy (EDS) was then used to identify the elemental composition of
dust particles within the samples.
A summary of the results of the SEM and EDS are presented in Table 15 to Table 17.
Table 15 to Table 17 provides a summary of the major elements found in each sample as well as the major and
minor particle types in each dust sample. Details of this analysis can be found in the UQMP laboratory reports
presented in Appendix F. A selection of images from the scanning electron microscopy analysis are presented in
Figure 25 and are indicative of the wide range of particulates found within the dust samples collected.
Wide view SEM image
Wide view SEM image
Pollen
Rubber
Pollen
Coal
Halite (Rock Salt)
Quartz
Soot
Mineral Dust
Copper Sludge (contaminant)9
Alumina
Figure 25 Example of Scanning Electron Microscopy Images (black and white)
9 DDG’s are dosed with Copper Sulphate to prevent organic growth as per the standard methodology.

Lower Hunter Dust Deposition Study
49 AECOM
5.2.2.1 Brush Samples – SEM and EDS Analysis
SEM and EDS analysis of samples of long term dust deposits showed the major contributor to brush samples was
aluminosilicate mineral dust. EDS analysis identified that the primary elements within the brush samples were
aluminium (Al) and silicon (Si). Other major elements included carbon (C), chlorine (Cl), oxygen (O), iron (Fe) and
zinc (Zn). A few brush samples were found to have carbon tape interference from the analytical process due to
the non-uniform sample coverage over the analysis area resulting in elevated readings of carbon in the EDS
analysis.
The results of the SEM and EDS analysis support the results of the Stereomicroscopy analysis, which identified
the major component of most samples as soil or rock and identified the presence of minor amounts of black
particles, with coal, soot and rubber detected in most samples.

Lower Hunter Dust Deposition Study
50 AECOM
Table 15 Energy Dispersive X-Ray Spectroscopy and Scanning Electron Microscopy Results for Brush Samples
Sample
ID
Analysis
ID
Major
Elements in
Sample
Carbon
Tape
Interference
Dust Particle Composition
Major Constituents Minor Constituents
B1 13146 Si, Al, C, O No - Aluminosilicate mineral dust - Halite (sodium chloride)
- Calcium sulphate
- Zinc rich mineral dust
B2 13147 Si, C, Al, O No - Aluminosilicate mineral dust
- Fibres
No data
B3 13287 No analysis (insufficient sample)
B4 13288 Si, C, Cl, Al No - Aluminosilicate mineral dust - Coal and soot
- Insect debris
- Fibres
B5 13289 Si, C, Cl, Al No - Aluminosilicate mineral dust - Coal, soot and rubber dust
- Halite (sodium chloride)
- Alumina
- Fibres
- Paint
B6 13290 Si, C, Al, O No - Aluminosilicate mineral dust - Coal, soot and rubber dust
- Fibres
- Paint
B7 13291 Si, Al, C, Cl, O No - Aluminosilicate mineral dust
- Halite (sodium chloride)
- Coal
- Fibres
- Paint
B8 13292 C, Si Yes - Aluminosilicate mineral dust - Coal and soot
- Plant debris
- Wood dust
B9 13293 Si, Cl, C, Al No - Aluminosilicate mineral dust - Coal and soot
- Plant and insect debris
- Wood dust
- Fibres
B10 13294 C, Si Yes - Aluminosilicate mineral dust - Coal, soot and rubber dust

Lower Hunter Dust Deposition Study
51 AECOM
Sample
ID
Analysis
ID
Major
Elements in
Sample
Carbon
Tape
Interference
Dust Particle Composition
Major Constituents Minor Constituents
- Iron rich particles
- Alumina
- Wood dust
- Fibres
B11 13295 Si, C, Al, O No - Organic particles including coal, soot, plant
and insect debris
- Soil and rock dust
B12 13497 Si, C, Fe, Al No - Mineral dust - Coal and rubber dust
- Plant and insect debris
- Iron oxide
- Fibres
- Paint
B13 13498 Si, Cl, C, No - Aluminosilicate mineral dust
- Halite (sodium chloride)
- Coal, soot and rubber dust
- Plant and insect debris
B14 13752 Si, Al No - Aluminosilicate mineral dust - Coal, soot and rubber dust
- Plant and insect debris
B15 13753 Si, Al, C No - Aluminosilicate mineral dust - Coal, soot and rubber dust
- Plant and insect debris
B16 13754 Si, Al No - Aluminosilicate mineral dust
- Alumina
- Coal, soot and rubber dust
- Plant and insect debris
B17 13755 Si, Al No - Aluminosilicate mineral dust
- Alumina
- Coal, soot and rubber dust
- Plant and insect debris
B18 13756 Si, Al No - Aluminosilicate mineral dust - Coal, soot and rubber dust
- Plant and insect debris
B19 13757 Si, Al No - Aluminosilicate mineral dust - Coal, soot and rubber dust
- Plant and insect debris
B20 13758 Si, Al No - Aluminosilicate mineral dust
- Alumina
- Coal and soot
B21 13759 Si, Al No - Aluminosilicate mineral dust
- Alumina
- Zinc
- Coal and soot

Lower Hunter Dust Deposition Study
52 AECOM
Sample
ID
Analysis
ID
Major
Elements in
Sample
Carbon
Tape
Interference
Dust Particle Composition
Major Constituents Minor Constituents
B22 13760 Si, Zn, Al No - Aluminosilicate mineral dust
- Alumina
- Zinc
- Coal and soot
B23 13761 Si, Al No - Aluminosilicate mineral dust - Coal, soot and rubber dust
- Plant and insect debris
B24 13762 Si, Al No - Aluminosilicate mineral dust - Coal and soot
- Plant debris
- Fibres

Lower Hunter Dust Deposition Study
53 AECOM
5.2.2.2 DDG Samples – SEM and EDS Analysis
EDS analysis from DDG samples showed the major elements within samples were aluminium (Al), silicon (Si),
carbon (C) and oxygen (O). Due to the relatively small sample sizes, the fraction of carbon observed in most DDG
samples has been over estimated due to the presence of exposed carbon tape, which interfered with sample
readings. Although affecting the EDS spectrum, this interference does not affect the percentages of each particle
type reported in the stereomicroscopy analysis (Section 5.2.1).
Scanning electron microscopy analysis revealed the major components of dust within the DDG samples was
aluminosilicate which is consistent with both the findings of the energy dispersive x-ray spectroscopy which also
identified the major elements as silicon and aluminium and the stereomicroscopy which identified the major
component of most samples as soil or rock. The results of the SEM/EDS analysis also identified the presence of
coal, soot and rubber in most samples similar to the findings of the stereomicroscopy.

Lower Hunter Dust Deposition Study
54 AECOM
Table 16 Energy Dispersive X-Ray Spectroscopy and Scanning Electron Microscopy Results for DDG Samples
Sample
ID
Analysis
ID
Major
Elements in
Sample
Carbon
Tape
Interference
Dust Particle Composition
Major Constituents Minor Constituents
D1 13079 C, Si, Al, No - Mineral dust - Coal, soot and rubber dust
- Plant and insect debris
- Copper sludge (contaminant)
D2 13143 C, Si, O Yes - Aluminosilicate mineral dust - Coal, soot and rubber dust
- Plant and insect debris
- Fibres
D3 13173 Sample contaminated
D4 13239 C, O Yes
- Aluminosilicate mineral dust - Coal, soot and rubber dust
- Plant and insect debris
D5 13286 Sample contaminated
D6 13398 C, O, Si, Al Yes
- Mineral dust - Coal and rubber dust
- Plant and insect debris
D7 13469 No analysis (insufficient particles)
D8 13496 C, Si, O, Al Yes - Aluminosilicate mineral dust - Coal, soot and rubber dust
- Plant and insect debris
- Paint
D9 13555 C, Si, Al, O, S Yes - Aluminosilicate mineral dust - Coal, soot and rubber dust
- Plant and insect debris
- Fibres
D10 13632 C, Si, Al, O Possible - Aluminosilicate mineral dust - Coal, soot and rubber dust
- Plant and insect debris
D11 13746 Si, C, Al Yes - Aluminosilicate mineral dust - Coal, soot and rubber dust
- Plant and insect debris
- Fibres
D12 13079 C, Si Yes - Aluminosilicate mineral dust - Coal and soot
- Plant and insect debris
Note: Samples D3 and D5 were contaminated. Contaminated samples were encased in a polysaccharide slime and copper sludge.

Lower Hunter Dust Deposition Study
55 AECOM
5.2.2.3 Petri Dish Samples – SEM and EDS Analysis
EDS analysis from short term Petri dish samples showed the major elements within the Petri dish samples were
aluminium (Al), silicon (Si), carbon (C), oxygen (O) and sodium (Na). Due to the small sample sizes, the fraction
of carbon observed in most Petri dish samples has been over estimated due to the presence of exposed carbon
tape, which interfered with sample readings. Some samples contained insufficient particles resulting in EDS
analysis unable to be undertaken.
SEM analysis revealed the major components of dust within the samples was aluminosilicate mineral dust which
is consistent with both the findings of the EDS (which identified the major elements as silicon and aluminium) and
the stereomicroscopy which identified the major component of most samples as soil or rock. The results of the
SEM and EDS analysis confirm the presence of black particles including coal, soot and rubber in most samples
which supports the findings of the stereomicroscopy.

Lower Hunter Dust Deposition Study
56 AECOM
Table 17 Energy Dispersive X-Ray Spectroscopy and Scanning Electron Microscopy Results for Petri Dish Samples
Sample
ID
Analysis
ID
Major
Elements in
Sample
Carbon
Tape
Interference
Dust Particle Composition
Major Constituents Minor Constituents
P1 13080 C, Si, Al, No - Aluminosilicate mineral dust - Coal, soot and rubber dust
- Plant and insect debris
P2 13144 Si, Al, Cl, C, O No - Aluminosilicate mineral dust - Coal and soot
- Halite (sodium chloride)
- Calcium sulphate
- Plant and insect debris
P3 13145 Si, Cl, Al, Na, O No - Aluminosilicate mineral dust - Coal and rubber dust
- Halite (sodium chloride)
- Calcium sulphate
- Plant and insect debris
P4 13296 SEM only (insufficient particles)
P5 13297 C, Cl Yes - Aluminosilicate mineral dust - Coal, soot and rubber dust
- Plant and insect debris
- Paint
P6 13298 C, Cl, Si, Na Yes - Aluminosilicate mineral dust
- Halite (sodium chloride)
- Coal, soot and rubber dust
- Plant and insect debris
- Fibres
P7 13299 C, Cl, Si, Na Yes - Aluminosilicate mineral dust
- Halite (sodium chloride)
- Coal, soot and rubber dust
- Fibres
P8 13300 C, Si, Cl Yes - Aluminosilicate mineral dust
- Halite (sodium chloride)
- Coal and soot
- Plant and insect debris
- Fibres
P9 13301 Si, Cl, C, Na No - Aluminosilicate mineral dust
- Halite (sodium chloride)
- Coal, soot and rubber dust
- Plant and insect debris
P10 13399 C, O, Si, Na, Cl Yes - Mineral dust - Coal and rubber dust
- Plant and insect debris
P11 13400 C, Si, O, Al, S Yes - Mineral dust - Coal and rubber dust
- Plant and insect debris

Lower Hunter Dust Deposition Study
57 AECOM
Sample
ID
Analysis
ID
Major
Elements in
Sample
Carbon
Tape
Interference
Dust Particle Composition
Major Constituents Minor Constituents
P12 13401 C Yes - Mineral dust - Coal and soot
- Plant debris
P13 13470 C, O, Si, Cl, S Yes - Mineral dust - Coal, soot and rubber dust
- Plant debris
P14 13471 C, Si, Al, O Yes - Mineral dust - Coal and soot
- Plant debris
- Fibres
P15 13472 C, O, Si Yes - Mineral dust - Coal and soot
- Plant debris
- Fibres
P16 13473 C, Si, O, Al, S Yes - Mineral dust - Coal, soot and rubber dust
- Plant and insect debris
P17 13556 C, Si, Al, O, Ca Yes - Aluminosilicate mineral dust - Coal, soot and rubber dust
- Plant and insect debris
- Fibres
P18 13557 C, Si, O, Al Yes - Mineral dust - Coal and soot
- Plant and insect debris
P19 13558 SEM only (insufficient particles)
P20 13559 SEM only (insufficient particles)
P21 13560 SEM only (insufficient particles)
P22 13633 SEM only (insufficient particles)
P23 13634 SEM only (insufficient particles)
P24 13635 SEM only (insufficient particles)
P25 13636 C, Si, Al, O Yes - Aluminosilicate mineral dust - Coal, soot and rubber dust
- Plant and insect debris
P26 13747 Si, C, Al No - Aluminosilicate mineral dust - Coal, soot and rubber dust
- Plant and insect debris

Lower Hunter Dust Deposition Study
58 AECOM
Sample
ID
Analysis
ID
Major
Elements in
Sample
Carbon
Tape
Interference
Dust Particle Composition
Major Constituents Minor Constituents
- Fibres
P27 13748 C, Al, Si Yes - Mineral dust - Coal, soot and rubber dust
- Plant and insect debris
- Fibres
P28 13749 C, Si, Al Yes - Mineral dust - Coal, soot and rubber dust
- Plant and insect debris
P29 13750 Si, C, Al Yes - Organic - coal, rubber, soot, plant (mostly
pollen), insects
- Mineral dust
P30 13751 Si, Al, C Yes - Mineral dust - Coal, soot and rubber dust
- Plant and insect debris
P31 13765 C, Si, Al Yes - Organic matter including coal, rubber, plant
and insect debris and fibres
- Aluminosilicate mineral dust
P32 13766 C, Si Yes - Aluminosilicate mineral dust - Coal, soot and rubber dust
- Plant and insect debris
P33 13767 Si, C, Al Yes - Aluminosilicate mineral dust - Coal, soot and rubber dust
- Plant and insect debris
P34 13768 C, Si, Al Yes - Aluminosilicate mineral dust - Coal, soot and rubber dust
- Plant and insect debris
P35 13769 Si, C, Al Yes - Aluminosilicate mineral dust - Coal, soot and rubber dust
- Plant and insect debris
P36 13770 Si, C, Al No - Aluminosilicate mineral dust - Organic material (unspecified)

Lower Hunter Dust Deposition Study
59 AECOM
6.0 Discussion and Recommendations
The following section provides a discussion of the results presented in Section 5.0 and recommendations for
further assessment.
6.1 Discussion of Results
6.1.1 Total Dust Deposition
Annual average dust deposition recorded in the study area was found to be below the EPA 4g/m2.month
maximum dust deposition criterion for all sites (refer to Section 5.2). The highest annual average dust deposition
rate was recorded at Islington at 1.1 g/m2.month. Little variation was observed between the remaining sites with
deposition rates varying between 0.7 to 0.9 g/m2.month with the exception of Newcastle which recorded a
deposition rate of 0.5 g/m2.month. The average annual average across all 12 DDG sites was found to be
0.8g/m2.month for the study period.
Results of the identification analysis determined soil or rock (primarily aluminosilicate) as the primary source of
deposited dust averaging 69% of all samples10. This is consistent with the findings of the deposited dust
composition studies conducted by the Queensland Government (refer to Section 2.2.4) which found the major
deposited dust to be soil and rock dust.
The remaining portion was largely found to be organic materials such as plant and insect debris, fibres, halite and
black particles from coal, soot and rubber (refer to Section 5.2.1, Section 5.2.2 and Appendix G). The proportion
of black particles in deposited dust samples is discussed below in Section 6.1.2.
Dust deposition monitoring is a long-term monitoring strategy used to identify trends in local dust levels, primarily
fallout. Monitoring was conducted over a twelve month period between October 2014 and October 2015 in
accordance with the EPA guideline however, longer term monitoring may account for additional seasonal factors
and potential variability in the collection method, as well as aid in establishing long term regional trends.
6.1.2 Deposition of Black Particles (Coal, Soot and Rubber)
The identification analysis undertaken for brush, DDG and Petri dish samples found that on average, deposited
dust within the region contained 17% black particles (refer to Section 5.2.1, Section 5.2.2 and Appendix G).
When accounting for the annual average deposition rates observed from the DDG monitoring network (refer to
Section 5.2 and Section 6.1.1) the average dust deposition rate for coal, soot and rubber combined would be in
the order of 0.09 to 0.19 g/m2.month.
Black particles within the study area was largely comprised of coal; accounting for approximately 10% of
deposited dust on average across all samples based on the stereomicroscopy analysis. This is similar to the
results of the Tennyson Dust Monitoring Investigation and Metropolitan Rail Systems Coal Dust Monitoring
Program (refer to Section 2.2.4) which both observed an average 10% contribution from coal to total deposited
dust. Smaller fractions of soot and rubber dust were also observed accounting for approximately 3% and 4% on
average across all samples. The contribution of rubber dust in the Queensland Government 2012 and 2013
studies both found higher fractions of rubber at 10%, while only trace amounts of soot were observed in the
studies. No regional background samples were taken as part of the LHDDP for comparison with the Metropolitan
Rail Systems Coal Dust Monitoring Program.
The following subsections provide a discussion of black particle contributions at each location and the
meteorological conditions and potential upwind sources at the time of sampling with regards to coal
(Section 6.1.2.1), soot (Section 6.1.2.2) and rubber (Section 6.1.2.3) dust deposition. Brush samples were
collected as part of the study to provide an analysis of long term dust accumulation patterns and hence are not
discussed in terms of associated meteorological data. For the monthly DDG samples and short term Petri dish
samples, associated meteorological conditions are discussed below. Figures pertaining to sample locations and
wind roses of each monitoring period for DDG and Petri dish samples are presented in Appendix C.
10 Including brush samples, DDG samples and petri dish samples.

Lower Hunter Dust Deposition Study
60 AECOM
6.1.2.1 Coal
Primary sources of coal within the study area include coal trains and three coal export facilities; two located at
Kooragang and a third located at Carrington.
Of the brush samples, the highest portion of coal was found to be 20% recorded at both Stockton South and
Wickham. Results of 15% (above the brush sample average of 9%) were also recorded at Newcastle, Tighes Hill,
Mayfield and Carrington. Samples recorded at Stockton South, Tighes Hill, Mayfield and Carrington were found to
have varying fractions of deposited coal with long term samples of 5% or lower also recorded in the area.
Samples at Wickham were found to be slightly more consistent with between 10 and 20% coal recorded from
samples collected. Only one sample was recorded at Newcastle as such no variability could be observed between
samples.
Similar to the brush samples analysed, DDG samples at Wickham (20%) and Newcastle East (15%) were found
to have an above average portion of coal. Higher than average coal fractions were also observed at Stockton
North (20%) and Hamilton (20%). During the monitoring periods for samples at Stockton North, Newcastle East
and Wickham, north-westerly winds were dominant (refer to Appendix C). Under these meteorological conditions,
upwind sources include both the rail and coal terminals for the Stockton North and Newcastle East sampling
locations, while only the rail was upwind of the Wickham location. At Hamilton, winds were more variable from the
north to north east indicating the rail line as a possible source of coal dust. Other DDG samples were also found
to be downwind of potential sources of coal during the sample periods but were found to contain 10% or less coal.
Higher levels of deposited coal were recorded in similar locations to the brush and Petri samples with 25%
observed at Stockton South and 15 to 20% at Stockton North, Tighes Hill and Hamilton. Additionally one sample
was taken at Fern Bay which yielded a result of 20% of the dust deposition. Above average coal deposits
recorded at Stockton South, Stockton North and Fern Bay are likely attributed to both rail and coal stockpiling at
terminals in conjunction with northwest to north north-westerly winds (refer to Appendix C). Above average coal
deposition samples at Tighes Hill and Hamilton are downwind of the rail line under these meteorological
conditions. Deposited coal, while varied, was generally present at Tighes Hill and Stockton South at not less than
5% while not less than 10% at Stockton North under north westerly winds. Only one sample at Hamilton was
taken, as such variability at this location could not be determined. All other locations were found to contain 10% or
less deposited coal and were generally downwind of some potential sources of coal dust during the sampling
period.
6.1.2.2 Soot
Potential sources of soot within the study area are most likely to include local industry primarily located in the
suburbs of Mayfield West, Mayfield East, Carrington and Kooragang Island as well as ships in the Port of
Newcastle, diesel train locomotives and vehicle exhaust emissions. Industry stack emissions and exhaust
emissions from ships were logged as the cause of 18 community complaints lodged with the EPA during the
monitoring period and is discussed in Section 2.3.2.
Two brush samples taken at Stockton South were found to have the highest fraction of soot (10%) within the long
term deposited dust samples. However two additional brush samples taken at Stockton South were found to have
soot at 2% or less. All other samples were comprised of equal to or less than 5% soot.
DDG samples collected for identification analysis showed two samples with 10% soot content. These were both
recorded at Stockton North. During both periods meteorological conditions were characterised by dominant winds
from the northwest. Directly upwind of this location are industrial areas at Kooragang Island, Mayfield East and
Mayfield West as well as shipping activities which may have attributed to the elevated soot deposition. All other
samples were comprised of equal to or less than 5% soot; and all samples with the exception to those recorded at
Wickham and Hamilton were downwind of industrial and shipping sources for part of the monitoring period.
Stockton South was observed to have the highest contribution (20%) of deposited soot within Petri dish samples,
consistent with the findings of the two brush samples taken at Stockton South. Higher levels of deposited soot
were also observed at Carrington (15%) and Stockton North (10%). These locations experienced northwest to
north north-westerly winds during the sampling periods (refer to Appendix C) and were downwind of industrial
and shipping activities with exception to the sample collected at Carrington which was largely only downwind from
industrial sources. Of these locations, percentage contribution of deposited soot was found to vary between
samples, with only trace amounts of carbon reported in some samples despite being downwind of industrial
and/or shipping activities. All other samples were comprised of equal to or less than 5% soot.

Lower Hunter Dust Deposition Study
61 AECOM
6.1.2.3 Rubber
The most significant source of rubber dust within the LGA is most likely tyre degradation on local roadways. Over
time the rubber tread on motor vehicles degrades generating rubber dust. This rubber dust both settles on the
road and is blown away from the road by winds and air turbulence generated by passing motor vehicles.
From the brush samples the highest levels of rubber were observed at Hamilton, Stockton South, Wickham and
Newcastle East (10%). Results were highly variable at Hamilton, Stockton South and Wickham with observed
rubber content recorded as low as 0% or found only in trace amounts in other samples. Only one sample was
taken at Newcastle East as such variability amongst samples at this location could not be observed. All other
brush samples were comprised of equal to or less than 5% rubber.
All DDG samples were found to comprise of equal to or less than 5% rubber. Within the Petri dish samples the
highest level of rubber dust recorded was 20% at Newcastle East, Carrington, Honeysuckle, Mayfield East and
Waratah. Higher levels of 10 to 15% rubber dust were also recorded at Tighes Hill, Mayfield West, Newcastle,
Broadmeadow and Warabrook. Similar to the brush samples, results were highly variable amongst samples and
69% of all Petri dish samples were found to contain 5% or less rubber dust.
The results did not indicate any trends where higher than average rubber dust concentrations may be occurring.
This would be fairly typical given the level of urbanisation in the study area and number or arterial and local roads.
6.1.3 Summary of Findings
In summary, dust deposition was measured at 12 locations across the Newcastle LGA with annual average
deposition rates for insoluble solids found to be between 0.5 and 1.1 g/m2.month for the study period, below the
EPA maximum dust deposition criteria of 4 g/m2.month.
Examination of the dust composition results has shown that deposited dust within the study area was comprised
of primarily soil and rock particles, averaging 69% for the study as a whole. Of the total dust deposited,
approximately 17% was identified as black particles (coal, soot and rubber), equating to an annual average
deposition rate in the order of 0.09 to 0.19 g/m2.month for black particles alone.
Coal, on average, formed 10% of total deposited dust, equating to 57% of dust identified as black by laboratory
analysis. Rubber dust made up 4% of total deposited dust, equating to approximately a quarter (24%) of black
particles while soot made up 3% of total deposited dust accounting for approximately a fifth (19%) of black
particles.
The highest levels of coal were generally observed in the east of the study area around Stockton and Newcastle
East, and closer to the rail line around Wickham, Hamilton and Tighes Hill. Short term samples indicated higher
concentrations downwind of the rail line and coal terminals; however the contribution of coal was highly variable
with some samples yielding little coal when downwind of potential sources. More data would be required to
establish any potential long term trends.
Analysis of both long term and short term soot contributions indicated higher deposition rates around Stockton.
Short term sampling indicated a high contribution of soot in deposited dust downwind from the industrial areas of
Mayfield, Carrington and Kooragang Island as well as the shipping channels and berths within the harbour though
some variability was also present between samples. It is unclear whether industry or shipping activities pose the
most significant contribution to deposited soot levels at this location, and further analysis would be required to
estimate source contributions.
With regards to the distribution of rubber dust the results did not indicate any significant trends. This would be
fairly typical given the level of urbanisation in the study area and number of arterial and local roads.

Lower Hunter Dust Deposition Study
62 AECOM
The project research questions are addressed below:
1) What is the association between proximity to potential sources, such as the rail corridor, and
rate of dust deposition?
There was little association between the proximity to potential sources and the rate of dust deposition. The
average dust deposition rate for the sampling period was 0.8 g/m2.month. Of the locations in close proximity
to the rail line the averages were:
a. Waratah 0.8 g/m2.month
b. Islington 1.1 g/m2.month
c. Tighes Hill 0.9 g/m2.month
d. Hamilton 0.8 g/m2.month.
Other potential sources such as industrial facilities in Waratah/Mayfield and coal handling facilities in Tighes
Hill were also in proximity to these locations.
Newcastle received the lowest annual deposition rate of 0.5 g/m2 month. It is noted that there is no industrial
rail corridor or industry in this location.
2) What is the level of dust deposition that is representative of specific areas in the Lower Hunter,
including the rail corridor?
Dust deposition was measured at 12 locations across the Newcastle LGA with annual average deposition
rates for insoluble solids found to be between 0.5 and 1.1 g/m2 month for the study period. Table 10 gives
the annual averages for each of the specific dust gauge locations.
3) How do measured dust deposition rates compare with international dust deposition criteria and
NSW criteria? - What is the composition of deposited dust?
As part of this study dust deposition was measured at 12 locations for a 12 month period. Annual dust
deposition rates for insoluble solids ranged between 0.5 and 1.1 g/m2.month, below the NSW EPA maximum
criteria of 4 g/m2.month. The deposition rates were also below the international criteria listed in Table 5 of
Section 3.0. Analysis indicates that the dust is generally comprised of soil and rock particles with smaller
fractions of coal, rubber and soot as well as inorganic matter such as insects and vegetation.
4) Is coal dust deposited at residential properties and/or other locations within the study area?
Coal dust was found in the majority of DDG, brush and Petri dish samples collected during this study.
Samples were collected from both residential and non-residential areas within the Newcastle LGA. On
average, coal accounted for 10% of the dust within samples analysed.
5) What is the composition of the ‘black dust’ identified at residential properties within the study
area?
Noting that for the purpose of this study that ‘black dust’ was considered to be the total dust observed by
residents on surfaces around their properties, the following was found. On average, samples were primarily
comprised of soil and rock, accounting for 69% of the composition of samples. Following this, coal was the
second largest contributor at 10%, with rubber (4%) and soot (3%) accounting for smaller portions. Particles
identified as black by laboratory analysis (coal, soot and rubber) therefore on average accounted for 17% of
the total deposited dust analysed.
6) What are the potential attributable sources of deposited dust/black dust?
Potential sources of deposited dust/black dust include natural ground (soil and rock dust). Such areas may
include natural earth, beaches, farming operations, construction sites and mining operations. Potential
sources of black particles (coal, soot and rubber) are likely to include coal handing operations, industrial
activities, shipping and automobile traffic and tyre degradation.

Lower Hunter Dust Deposition Study
63 AECOM
7) Are there geographical or spatial variations in dust deposition/black dust?
While there is some variation between dust deposition annual averages across the 12 DDG monitoring
locations selected for this study, it is relatively minimal. The Newcastle site returned the minimum annual
average at 0.5 g/m2.month with Islington recording the maximum of 1.1 g/m2.month. The other 10 sites
recorded annual averages ranging from 0.7 to 0.9 g/m2.month resulting in overall average deposition rate of
0.8 g/m2.month for the study area.
Black dust, or more specifically black particles did show some geographical variations. Coal was at times
observed in higher concentrations when sampling was performed downwind of coal handling operations.
However at other times, samples contained relatively low concentrations under these conditions downwind
of coal handling. Generally the percentages of coal found were higher in those areas surrounding the port
and coal handing areas.
Soot was also found in higher concentrations around and downwind of the port operations. Sources may
include ships, trains and tucks as well as industry located around the port area.
No observable pattern was observed when analysing the distribution across the sample area.
6.2 Recommendations
The findings of the investigation discussed in Section 6.1 observed some variability between samples, and longer
term monitoring may account for variability in meteorology and potential variability in the collection and analytical
methods, as well as aid in establishing long term regional trends, particularly with regards to dust deposition.
Additionally, further monitoring could be undertaken outside the study area to determine the background levels
and composition of deposited dust more widely in the Lower Hunter Region. Short term sampling and analysis is
also recommended, with strategic collection of samples upwind and downwind of sources to identify significant
contributors.
Although outside of the scope of the LHDDP, further monitoring could be undertaken with the aim of correlating
results against regional influences including rail, road and port movements as well as coal handling throughput.

Lower Hunter Dust Deposition Study
64 AECOM
This page has been left blank intentionally.

Lower Hunter Dust Deposition Study
65 AECOM
7.0 Conclusion
After a competitive tender process, AECOM was commissioned by the EPA to undertake a twelve month
monitoring program to assess the dust deposition rates and composition as well as to assess the geographical
and spatial distribution of deposited dust and its constituents as part of the LHDDP.
Dust sampling was undertaken over the twelve months between October 2014 and October 2015 using dust
deposition gauges, brush and Petri dish samples. All DDG samples underwent standard dust deposition analysis,
while Petri dish, brush samples and a selection of DDGs samples underwent dust composition identification
analysis using stereomicroscopy, SEM and EDS analysis. Results of the study found:
Annual average dust deposition was found to be below the EPA 4g/m2.month maximum dust deposition criterion
for all sites, ranging from 0.5 g/m2.month at the Newcastle monitoring location to 1.1g/m2.month at the Islington
location.
Results of the composition identification analysis identified:
a. Soil or rock (primarily aluminosilicate) as the primary source of deposited dust averaging 69%
of all samples with a range of 40% to 90%;
b. Insect and plant debris accounted for an average of 10% of all samples with a range of 0% to
40%;
c. Coal on average formed 10% of total deposited dust with a range of 0% to 25%;
d. Rubber dust on average made up 4% of total deposited dust with a range of 0% to 20%;
e. Soot accounted for an average of 3% of all samples with a range of 0% to 20%; and
f. The remainder of the deposit dust was largely comprised of halite (salt), fly ash, alumina, paint
and miscellaneous fibres.
g. Deposited dust within the study area is comprised of approximately:
i. 69% soil and rock dust; equating to a deposition rate in in the order of 0.35 to 0.76
g/m2.month;
ii. 17% black particles (coal, soot and rubber); equating to a deposition rate in in the
order of 0.09 to 0.19 g/m2.month; and
iii. 14% other material (including insects and vegetation); equating to a deposition rate
ranging from 0.07 to 0.15 g/m2.month.
The highest levels of coal deposition were generally observed in the east of the study area around Stockton and
Newcastle East, and closer to the rail line around Wickham, Hamilton and Tighes Hill, near to the rail line and coal
terminals. The contribution of coal however was highly variable with some samples yielding little coal when
downwind of potential sources.
Analysis of soot contributions indicated higher deposition rates around Stockton when downwind from the
industrial areas of Mayfield, Carrington and Kooragang Island as well as the shipping channels and berths within
the harbour though some variability was also present between samples.
The rubber dust results did not indicate any significant trends; and would largely be attributed to tyre degradation
along arterial and local roads.
It is recommended that longer term monitoring be undertaken to establish long term regional trends and account
for variability in meteorology as well as variability in the collection and analytical methodologies. Additionally,
further monitoring could be performed outside the study area to determine the background levels of dust
deposition and black particles more widely in the Lower Hunter Region. Short term sampling and analysis is also
recommended, with strategic collection of samples upwind and downwind of sources to identify significant
contributors of dust deposition.
Although outside of the scope of the LHDDP, further monitoring could be undertaken with the aim of correlating
results against regional influences including rail, road and port movements as well as coal handling throughput.

Lower Hunter Dust Deposition Study
66 AECOM
This page has been left blank intentionally.

Lower Hunter Dust Deposition Study
67 AECOM
8.0 References
AECOM (2015) Lower Hunter Dust Deposition Project; Methodology Paper, 29 January 2015, AECOM Australia
Pty Ltd, Warabrook, NSW, Australia.
DEC. (2005a). Approved Methods for the Sampling and Analysis of Air Pollutants in New South Wales,
Environment Protection Authority, Sydney.
DEC. (2005b). Approved Methods and Guidance for the Modelling and Assessment of Air Pollutants in New South
Wales, Environment Protection Authority, Sydney.
Standards Australia. (2003b). AS/NZS 3580.10.1: 2003(R2014), Methods for Sampling and Analysis of Ambient
Air-Determination of Particulate Matter – Deposited Matter – Gravimetric Method, Standards Australia.
Queensland Government (2012) Tennyson Dust Monitoring Investigation, September to October 2012,
Department of Science, Information Technology, Innovation and the Arts, Queensland Government, Brisbane,
Queensland, Australia.
Queensland Government (2013) Western – Metropolitan Rail Systems Coal Dust Monitoring Program, Final
Report, Department of Science, Information Technology, Innovation and the Arts, Queensland Government,
Brisbane, Queensland, Australia.
Bridgman, H.A. (2015), Personal communication, 10 December 2015. Data sourced originally from historical
records of Newcastle City Council.
Ferrari, L. (2015, 2000), Personal communication, 10 December 2015. Data sourced originally from historical
records NSW Department of Health and State Pollution Control Commission and presented in Ferrari L, Dust
Nuisance – An Australian Perspective, May 2000, Ministry for the Environment, Auckland New Zealand.

Lower Hunter Dust Deposition Study
68 AECOM
This page has been left blank intentionally.

Lower Hunter Dust Deposition Study
1 AECOM
This is the end of the document
AECOM Australia Pty Ltd
ABN 20 093 846 925