Lowell Elementary Science Fair · Project Timeline & Checklist ... Movies on Heart Rate”). 3...
19
1 Lowell Elementary Science Fair Tuesday, May 31, 2016 Friday, April 29: Science Fair packets distributed to students. Timelines discussed in class. Week of May 23-26: Completed display boards due in class. Students present projects to classmates. Tuesday, May 31, 6:00-7:30pm: Families and guests are invited to attend the Lowell Science Fair. Wednesday, June 1: All-School Fair. Classroom tours of displays throughout the day. Thursday, April 30, 2020 Monday, March 30 : Science Fair packets distributed to Thursday, April 30, 6:00-7:30pm Friday, May 1st : All-School Fair. Classroom tours of Week of April 28-29 : Families and guests
Transcript of Lowell Elementary Science Fair · Project Timeline & Checklist ... Movies on Heart Rate”). 3...

1
Lowell Elementary
Science Fair
Tuesday, May 31, 2016 Friday, April 29: Science Fair packets distributed to
students. Timelines discussed in class.
Week of May 23-26: Completed display boards due in
class. Students present projects to classmates.
Tuesday, May 31, 6:00-7:30pm: Families and guests
are invited to attend the Lowell Science Fair.
Wednesday, June 1: All-School Fair. Classroom tours of
displays throughout the day.
Thursday, April 30, 2020 Monday, March 30: Science Fair packets distributed to
Thursday, April 30, 6:00-7:30pm
Friday, May 1st : All-School Fair. Classroom tours of
Week of April 28-29
: Families and guests
2
Table of Contents
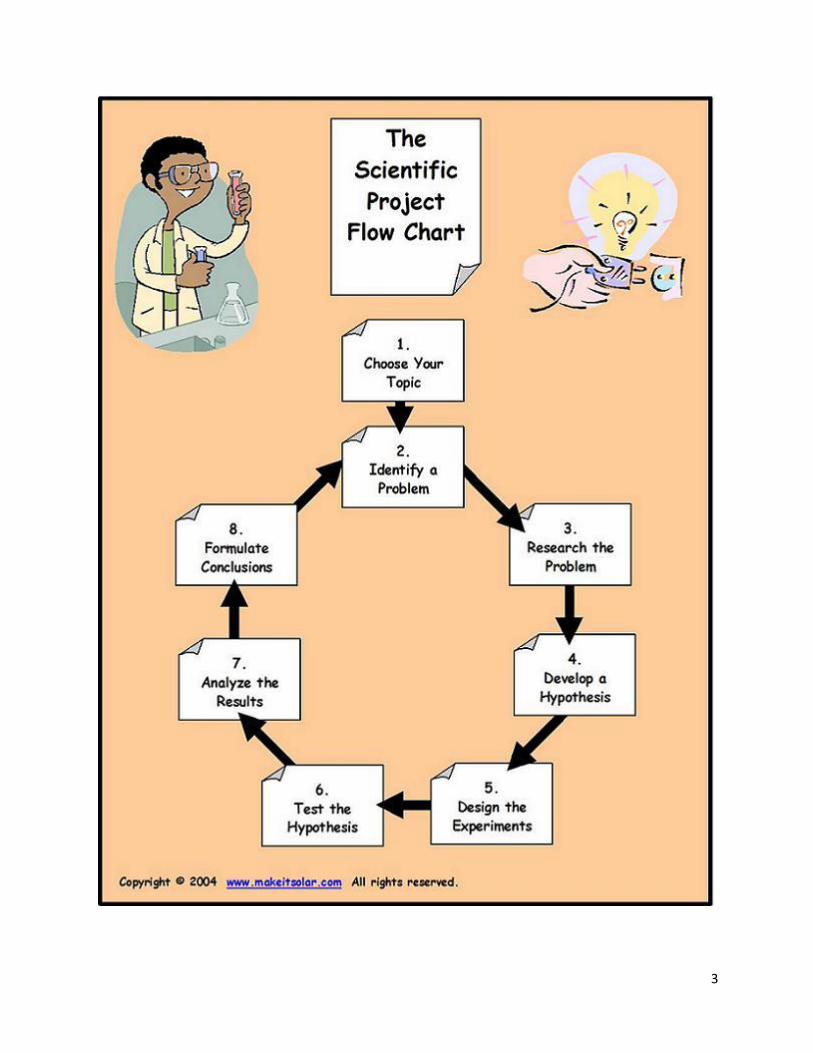
The Scientific Project Flowchart…………………………………… 3
Project Timeline & Checklist………………………………………… 4
Give Credit Where Credit is Due………………………………….. 7
How to Make a Data Table………………………………………….. 8
How to Make a Bar Graph…………………………………………… 9
How to Make a Line Graph………………………………………… 10
Writing a Conclusion in Science…………………………………. 11
Science Fair Student Project Packet…………………………… 12
Display Board Rubric………………………………………………… 19
3

4
Lowell Elementary Science Fair
Project Timeline & Checklist
Due Date
________
Share this packet with your family. Have a parent or guardian sign the cover.
Due Date
________
Choose a topic.
Pick something that you are interested in.
Ask your family or classmates for ideas.
Think about something that you already know a little about.
Consider the types of materials you already have at your home, at school,
or that you will be able to find or purchase.
Think about the questions you have about the world around you. What
are you wondering about?
Is there something that you have studied in school that you would like to
explore further?
You may use books or websites to help you decide on a topic. A list of both is
available at the back of this packet.
Due Date
________
Form a question.
You must come up with a question that can be made into a testable and
measurable investigation. The Science Fair is not the place for displays or
demonstrations (i.e., no volcano demonstrations). Remember that you will be
following the steps of the scientific method. Also, keep in mind that your project
should:
Follow common safety procedures
Have the approval of your teacher and parents
Use materials that are readily available
Avoid flames, live animals, and dangerous chemicals
Due Date
________
Share your question with your teacher.
Together you will discuss the feasibility of your project idea. Be ready to adjust
and refine your question.

5
Due Date
________
Conduct background research.
Use books and websites to develop a clear understanding of your topic. Keep of
list of your sources for the bibliography.
Due Date
________
Construct a hypothesis /prediction.
Your hypothesis should take the following “cause and effect” form:
I believe that if (manipulated variable)_____________then (responding
variable)______________because________________.
Due Date
________
Create a list of materials.
Your list should include any equipment you will need, as well as the “ingredients” of your project. Plan to review this list with your parents or guardians to
determine whether you will need to purchase or borrow any materials. Although
you do not need to include the decorative materials for your display board in
your list of materials, it is a good idea to create a separate list of these items so
that you will have them available when it is time to create your display. Set a
date to go shopping with your family.
Due Date
________
Define the variables.
1) Controlled Variable: this is what will be kept the same. For example, if
someone is testing the effect of light on plant growth, the controlled variables
would be the soil, the seeds, the amount of water, and the temperature of the
environment. These would remain the same for all test subjects.
2) Manipulated Variable: this is what will be changed during the experiment. In
the above example, only the amount of light would vary among the test subjects.
3) Responding Variable: this is what is measured. The amount of growth of each
of the test plants would be measured in the above experiment.
Due Date
Develop your procedure (steps for testing).

6
________ Your written procedure should be a detailed, sequential list of the steps you will
take to test your hypothesis. Write it so that another student could recreate your
experiment and obtain the same results, just by following your procedure and
using the list of materials.
Your procedure should also make reference to safety precautions and concerns.
Due Date
________
Perform your experiment!
Have your parents’/guardians’ permission before you begin. Make multiple trials or have several test subjects.
Be ready to record observations and data.
Measure your results.
If possible, document your progress with photographs.
Due Date
________
Results/Data Analysis
This is your record of what actually happened in your experiment. Your results
should be displayed on a table and graph. You should also write a paragraph or
two to provide a narrative account of your work. Drawings or photographs that
illustrate the progress of your experiments should be included in this section.
Due Date
________
Conclusion
Analyze your data and make a conclusion.
Your conclusion should provide a statement regarding whether or not you accept
or reject your hypothesis and explain why this is so. Remember that many
scientists wind up disproving their hypothesis.
Due Date
________
Create your display
Use the information in this packet to design your display. Each student will need
one cardboard tri-fold display board. Make sure your display has all of the
required elements and is colorful and neatly constructed.
May 31 Lowell Elementary Science Fair 2016
6:00 – 7:30pm
Lowell Elementary Science Fair 2020April 30th
7
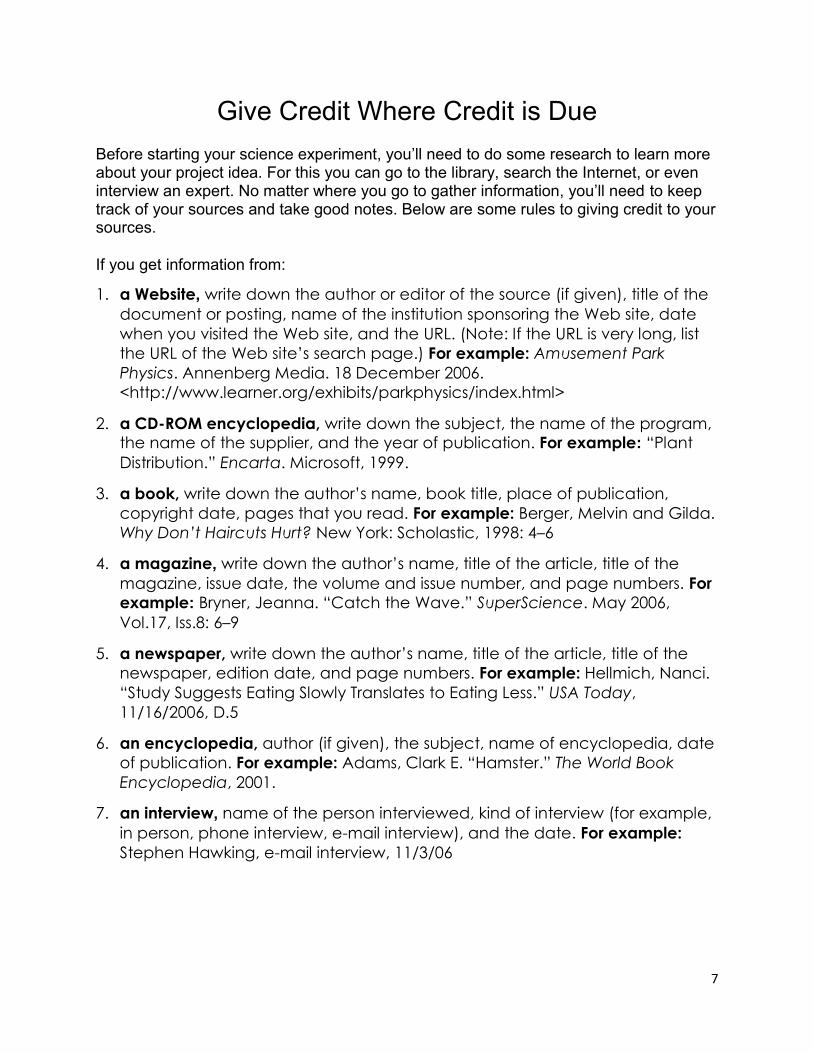
Give Credit Where Credit is Due
Before starting your science experiment, you’ll need to do some research to learn more about your project idea. For this you can go to the library, search the Internet, or even interview an expert. No matter where you go to gather information, you’ll need to keep track of your sources and take good notes. Below are some rules to giving credit to your sources.
If you get information from:
1. a Website, write down the author or editor of the source (if given), title of the
document or posting, name of the institution sponsoring the Web site, date
when you visited the Web site, and the URL. (Note: If the URL is very long, list
the URL of the Web site’s search page.) For example: Amusement Park
Physics. Annenberg Media. 18 December 2006.
<http://www.learner.org/exhibits/parkphysics/index.html>
2. a CD-ROM encyclopedia, write down the subject, the name of the program,
the name of the supplier, and the year of publication. For example: “Plant Distribution.” Encarta. Microsoft, 1999.
3. a book, write down the author’s name, book title, place of publication, copyright date, pages that you read. For example: Berger, Melvin and Gilda.
Why Don’t Haircuts Hurt? New York: Scholastic, 1998: 4–6
4. a magazine, write down the author’s name, title of the article, title of the magazine, issue date, the volume and issue number, and page numbers. For
example: Bryner, Jeanna. “Catch the Wave.” SuperScience. May 2006,
Vol.17, Iss.8: 6–9
5. a newspaper, write down the author’s name, title of the article, title of the newspaper, edition date, and page numbers. For example: Hellmich, Nanci.
“Study Suggests Eating Slowly Translates to Eating Less.” USA Today,
11/16/2006, D.5
6. an encyclopedia, author (if given), the subject, name of encyclopedia, date
of publication. For example: Adams, Clark E. “Hamster.” The World Book
Encyclopedia, 2001.
7. an interview, name of the person interviewed, kind of interview (for example,
in person, phone interview, e-mail interview), and the date. For example:
Stephen Hawking, e-mail interview, 11/3/06

8
TABLES, GRAPHS, AND CHARTS
How to Make a Data Table
Data tables keep your experiment results organized. Here are the steps to making a data table:
1 On a plain sheet of paper, use a ruler to draw a data table like the one shown
below.
2 Give your table a title that describes your variables (“The Effect of Different Types of Movies on Heart Rate”).
3 Label the column on the left as the independent variable (Type of Movie).
Underneath, list each type of movie you used for the independent variable (Drama,
Comedy, Horror).
4 Label the columns to the right as the dependent variable (Heart Rate [beats per
minute]). Draw boxes under these columns in which you can record the result of each trial
for each independent variable.
5 Include a column to record the average result for each independent variable. To
calculate the average result for each independent variable, just add the results of all trials
for a particular independent variable. Then divide the total by the number of trials. Repeat
this for the remaining independent variables.
The Effect of Different Types of Movies on Heart Rate
Type of Movie Heart Rate (beats per minute)
Trial 1 Trial 2 Trial 3 Average
Drama 89
90 91 90
Comedy 92
92 95 93
Horror 104
99 100 101

9

10

11
Writing a Conclusion in Science
3 parts to a science conclusion (3CPAS)
Prediction
Restate your prediction
Example:
According to my results the prediction I made was… __________________________________________________________________
__________________________________________________________________
__________________________________________________________________
Assess your data
Study your data chart or table.
You will want to explain which pieces of information told you that your prediction was right or wrong.
Compare the high and the low numbers from the data chart.
__________________________________________________________________
__________________________________________________________________
__________________________________________________________________
Summary
Include the important information (numbers) from your data table by comparing those numbers.
One way to do this is to find the difference between the numbers.
__________________________________________________________________
__________________________________________________________________
__________________________________________________________________
Combine all parts for you completed conclusion
Do the math
12
Student Name: _____________________________________________
Project Title: _______________________________________________
Lowell Science Fair 2016
Project Packet
Lowell Science Fair 2020
Project Packet
13
Name: _______________________________________________________________________
Project topic: _________________________________________________________________
______________________________________________________________________________
Project title: __________________________________________________________________
______________________________________________________________________________
1) Question: I plan to answer the following question with the results of my experiment. This
question will be testable and measurable.
______________________________________________________________________________
______________________________________________________________________________
______________________________________________________________________________
______________________________________________________________________________
2) Research: I used the following sources (books, magazines, encyclopedias, websites) to find out
more information about my topic. I will use “Give Credit Where Credit is Due” on page 7 to
properly record my sources for a bibliography.
1. __________________________________________________________________
2. __________________________________________________________________
3. __________________________________________________________________
4. __________________________________________________________________
5. __________________________________________________________________
6. __________________________________________________________________

14
3) Variables:
a. Manipulated (independent) variable, or the thing I plan to change is:
____________________________________________________________________
____________________________________________________________________
____________________________________________________________________
____________
b. Responding (dependent) variable, or the thing I will be measuring is:
____________________________________________________________________
____________________________________________________________________
____________________________________________________________________
____________
c. Controlled variable, or what I will be keeping the same is/are:
____________________________________________________________________
____________________________________________________________________
____________________________________________________________________
____________
4) Hypothesis: My hypothesis, or prediction, will state what I believe will be the outcome of
my experiment. I will write it in an “If (manipulated variable)…then (responding
variable)….because….” form.
___________________________________________________________________________
___________________________________________________________________________
___________________________________________________________________________
___________________________________________________________________________
___________________________________________________________________________
___________________________________________________________________________
___________________________________________________________________________
___________________________________________________________________________
15
5) Materials: I will list all the supplies and equipment that are needed to perform my tests
and make notes about those which need to be purchased or borrowed. I have talked to my
family about setting aside time to gather/buy these materials. Parent’s initials
1. _________________________________________________________________
2. _________________________________________________________________
3. _________________________________________________________________
4. _________________________________________________________________
5. _________________________________________________________________
6. _________________________________________________________________
7. _________________________________________________________________
8. _________________________________________________________________
9. _________________________________________________________________
10. _________________________________________________________________
11. _________________________________________________________________
12. _________________________________________________________________
13. _________________________________________________________________
14. _________________________________________________________________
15. _________________________________________________________________
16
5) Procedure/Steps for testing: I will create a detailed, sequential list of the steps for
testing my hypothesis.
1. ____________________________________________________________________
____________________________________________________________________
___________________________________________________________
2. ____________________________________________________________________
____________________________________________________________________
___________________________________________________________
3. ____________________________________________________________________
____________________________________________________________________
___________________________________________________________
4. ____________________________________________________________________
____________________________________________________________________
___________________________________________________________
5. ____________________________________________________________________
____________________________________________________________________
___________________________________________________________
6. ____________________________________________________________________
____________________________________________________________________
___________________________________________________________
7. ____________________________________________________________________
____________________________________________________________________
___________________________________________________________
17
8. ____________________________________________________________________
____________________________________________________________________
___________________________________________________________
9. ____________________________________________________________________
____________________________________________________________________
___________________________________________________________
10. ____________________________________________________________________
____________________________________________________________________
___________________________________________________________
11. ____________________________________________________________________
____________________________________________________________________
___________________________________________________________
12. ____________________________________________________________________
____________________________________________________________________
___________________________________________________________
13. ____________________________________________________________________
____________________________________________________________________
___________________________________________________________
14. ____________________________________________________________________
____________________________________________________________________
___________________________________________________________
15. ____________________________________________________________________
____________________________________________________________________
___________________________________________________________
18
16. Results/Data Analysis: I will use a table or graph to collect and record all of the
data from my experiment. My table or graph will reflect the fact that I have
performed several trials or have used several test subjects. My graphs will indicate
the system of measurement that I used to assess the responding variable. I will
attach the graph to this journal and have a duplicate graph on my display board.
17. Conclusion: Based on my observations and my analysis of the data I collected, I will
be able to come to a conclusion about my hypothesis. It will be possible to accept
or reject my hypothesis. I will also write a brief summary paragraph to describe my
findings. Use the guidelines on page 11 of the packet as you write your conclusion.
Statement:___________________________________________________________
____
______________________________________________________________________________
______________________________________________________________________________
______________________________________________________________________________
______________________________________________________________________________
______________________________________________________________________________
______________________________________________________________________________
______________________________________________________________________________
______________________________________________________________________________
______________________________________________________________________________
______________________________________________________________________________
______________________________________________________________________________
______________________________________________________________________________
19
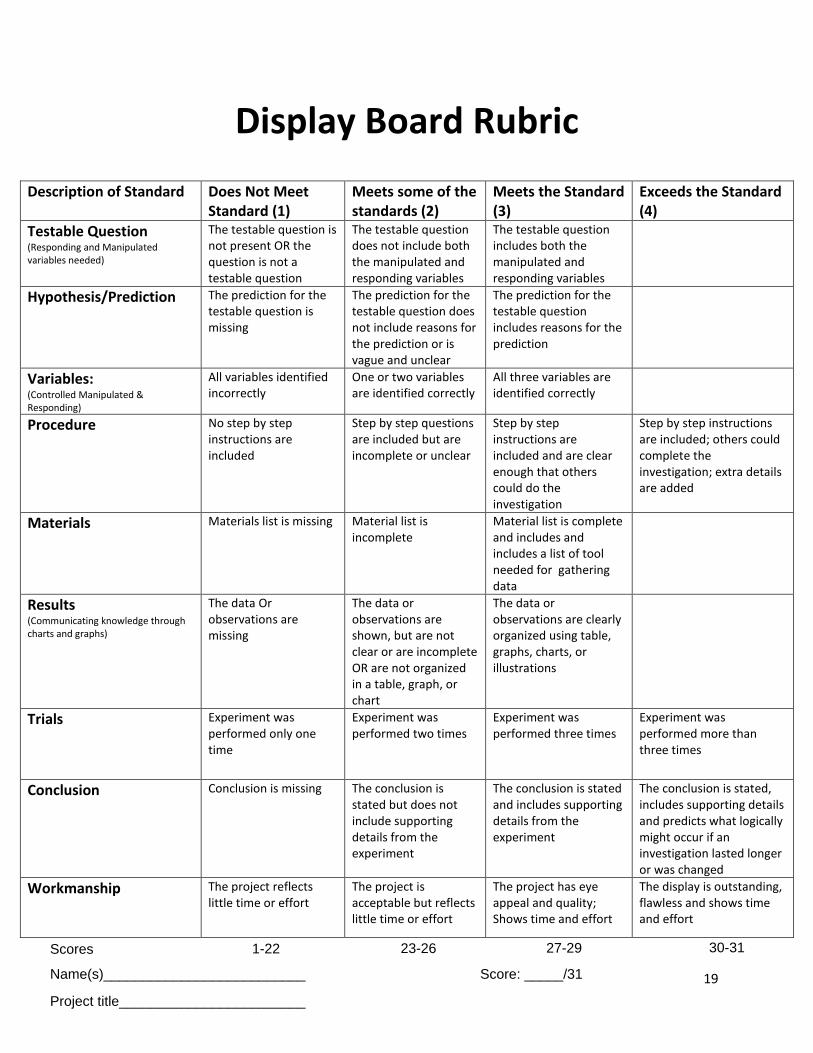
Display Board Rubric
Description of Standard Does Not Meet
Standard (1)
Meets some of the
standards (2)
Meets the Standard
(3)
Exceeds the Standard
(4)
Testable Question (Responding and Manipulated
variables needed)
The testable question is
not present OR the
question is not a
testable question
The testable question
does not include both
the manipulated and
responding variables
The testable question
includes both the
manipulated and
responding variables
Hypothesis/Prediction
The prediction for the
testable question is
missing
The prediction for the
testable question does
not include reasons for
the prediction or is
vague and unclear
The prediction for the
testable question
includes reasons for the
prediction
Variables: (Controlled Manipulated &
Responding)
All variables identified
incorrectly
One or two variables
are identified correctly
All three variables are
identified correctly Procedure No step by step
instructions are
included
Step by step questions
are included but are
incomplete or unclear
Step by step
instructions are
included and are clear
enough that others
could do the
investigation
Step by step instructions
are included; others could
complete the
investigation; extra details
are added
Materials Materials list is missing Material list is
incomplete
Material list is complete
and includes and
includes a list of tool
needed for gathering
data
Results (Communicating knowledge through
charts and graphs)
The data Or
observations are
missing
The data or
observations are
shown, but are not
clear or are incomplete
OR are not organized
in a table, graph, or
chart
The data or
observations are clearly
organized using table,
graphs, charts, or
illustrations
Trials Experiment was
performed only one
time
Experiment was
performed two times
Experiment was
performed three times
Experiment was
performed more than
three times
Conclusion
Conclusion is missing The conclusion is
stated but does not
include supporting
details from the
experiment
The conclusion is stated
and includes supporting
details from the
experiment
The conclusion is stated,
includes supporting details
and predicts what logically
might occur if an
investigation lasted longer
or was changed
Workmanship The project reflects
little time or effort
The project is
acceptable but reflects
little time or effort
The project has eye
appeal and quality;
Shows time and effort
The display is outstanding,
flawless and shows time
and effort
Scores 30-3127-2923-261-22
Project title________________________
Name(s)__________________________ Score: _____/31