Low pH induced aggregation of IgG1 and IgG2 … · 2011-11-14 · Elucidation of acid-induced...
31
Elucidation of acid-induced unfolding and aggregation of human immunoglobulin IgG1 and IgG2 Fc* Ramil F. Latypov 1 , Sabine Hogan 1 , Hollis Lau 1 , Himanshu Gadgil 1 , and Dingjiang Liu 2 1 Drug Product Development, Amgen Inc., Seattle, WA 98119 2 Drug Product Development, Amgen Inc., Thousand Oaks, CA 91320 *Running title: Fc aggregation in acidic conditions is determined by C H 2 stability To whom correspondence should be addressed: Ramil F. Latypov, Drug Product Development, Amgen Inc., 1201 Amgen Court West, Seattle, WA 98119, USA. Phone: (206) 265-8851; E-mail: [email protected] or [email protected]. Keywords: Fc denaturation; Fc aggregation; Fc glycosylation; Quality by Design; NMR; DSC; cation- exchange chromatography Background: Monoclonal antibodies and Fc- fusion proteins contain an IgG Fc moiety, which is associated with various degradation processes, including aggregation. Results: Fc unfolding is triggered by the protonation of acidic residues and depends on the IgG subclass and C H 2 domain glycosylation. Conclusion: Fc aggregation in acidic conditions is determined by C H 2 stability. Significance: Understanding Fc aggregation is important for improving the quality of Fc-based therapeutics. SUMMARY Understanding the underlying mechanisms of Fc aggregation is an important prerequisite for developing stable and efficacious antibody- based therapeutics. In our study, high- resolution two-dimensional nuclear magnetic resonance (NMR) was employed to probe structural changes in the IgG1 Fc. A series of 1 H- 15 N HSQC NMR spectra were collected between pH 2.5 and 4.7 to assess whether unfolding of C H 2 domains precedes that of C H 3 domains. The same pH range was subsequently screened in Fc aggregation experiments that utilized molecules of IgG1 and IgG2 subclasses with varying levels of C H 2 glycosylation. In addition, differential scanning calorimetry (DSC) data was collected over a pH range of 3- 7 to assess changes in C H 2 and C H 3 thermostability. As a result, compelling evidence was gathered that emphasizes the importance of C H 2 stability in determining the rate and extent of Fc aggregation. In particular, we found that Fc domains of the IgG1 subclass have a lower propensity to aggregate compared to those of the IgG2 subclass. Our data for glycosylated, partially deglycosylated, and fully deglycosylated molecules further revealed the criticality of C H 2 glycans in modulating Fc aggregation. These findings provide important insights into the stability of Fc-based therapeutics and promote better understanding of their acid-induced aggregation process. ABBREVIATIONS CEX, cation-exchange HPLC; CHO cells, Chinese Hamster Ovary cells; DSC, differential scanning calorimetry; ESI, electrospray ionization; Fab, fragment antigen-binding; Fc, fragment crystallizable; GuHCl, guanidine hydrochloride; HPLC, high performance liquid chromatography; mAb, monoclonal antibody; MG, molten globule; MS, mass spectrometry; pI, isoelectric point; QbD, Quality by Design; Q-TOF, quadripole-time-of- flight; rCE-SDS, capillary electrophoresis under reducing/denaturing conditions; RP-HPLC, reversed-phase HPLC; SDS-PAGE, sodium dodecyl sulfate polyacrylamide gel 1 http://www.jbc.org/cgi/doi/10.1074/jbc.M111.297697 The latest version is at JBC Papers in Press. Published on November 14, 2011 as Manuscript M111.297697 Copyright 2011 by The American Society for Biochemistry and Molecular Biology, Inc. by guest on September 8, 2018 http://www.jbc.org/ Downloaded from
Transcript of Low pH induced aggregation of IgG1 and IgG2 … · 2011-11-14 · Elucidation of acid-induced...

Elucidation of acid-induced unfolding and aggregation of human immunoglobulin IgG1 and IgG2 Fc*
Ramil F. Latypov
1, Sabine Hogan
1, Hollis Lau
1, Himanshu Gadgil
1, and Dingjiang Liu
2
1Drug Product Development, Amgen Inc., Seattle, WA 98119
2Drug Product Development, Amgen Inc., Thousand Oaks, CA 91320
*Running title: Fc aggregation in acidic conditions is determined by CH2 stability
To whom correspondence should be addressed: Ramil F. Latypov, Drug Product Development, Amgen
Inc., 1201 Amgen Court West, Seattle, WA 98119, USA. Phone: (206) 265-8851; E-mail:
[email protected] or [email protected].
Keywords: Fc denaturation; Fc aggregation; Fc glycosylation; Quality by Design; NMR; DSC; cation-
exchange chromatography
Background: Monoclonal antibodies and Fc-
fusion proteins contain an IgG Fc moiety, which is
associated with various degradation processes,
including aggregation.
Results: Fc unfolding is triggered by the
protonation of acidic residues and depends on the
IgG subclass and CH2 domain glycosylation.
Conclusion: Fc aggregation in acidic conditions is
determined by CH2 stability.
Significance: Understanding Fc aggregation is
important for improving the quality of Fc-based
therapeutics.
SUMMARY
Understanding the underlying mechanisms
of Fc aggregation is an important prerequisite
for developing stable and efficacious antibody-
based therapeutics. In our study, high-
resolution two-dimensional nuclear magnetic
resonance (NMR) was employed to probe
structural changes in the IgG1 Fc. A series of 1H-
15N HSQC NMR spectra were collected
between pH 2.5 and 4.7 to assess whether
unfolding of CH2 domains precedes that of CH3
domains. The same pH range was subsequently
screened in Fc aggregation experiments that
utilized molecules of IgG1 and IgG2 subclasses
with varying levels of CH2 glycosylation. In
addition, differential scanning calorimetry
(DSC) data was collected over a pH range of 3-
7 to assess changes in CH2 and CH3
thermostability. As a result, compelling
evidence was gathered that emphasizes the
importance of CH2 stability in determining the
rate and extent of Fc aggregation. In particular,
we found that Fc domains of the IgG1 subclass
have a lower propensity to aggregate compared
to those of the IgG2 subclass. Our data for
glycosylated, partially deglycosylated, and fully
deglycosylated molecules further revealed the
criticality of CH2 glycans in modulating Fc
aggregation. These findings provide important
insights into the stability of Fc-based
therapeutics and promote better understanding
of their acid-induced aggregation process.
ABBREVIATIONS
CEX, cation-exchange HPLC; CHO cells, Chinese
Hamster Ovary cells; DSC, differential scanning
calorimetry; ESI, electrospray ionization; Fab,
fragment antigen-binding; Fc, fragment
crystallizable; GuHCl, guanidine hydrochloride;
HPLC, high performance liquid chromatography;
mAb, monoclonal antibody; MG, molten globule;
MS, mass spectrometry; pI, isoelectric point; QbD,
Quality by Design; Q-TOF, quadripole-time-of-
flight; rCE-SDS, capillary electrophoresis under
reducing/denaturing conditions; RP-HPLC,
reversed-phase HPLC; SDS-PAGE, sodium
dodecyl sulfate polyacrylamide gel
1
http://www.jbc.org/cgi/doi/10.1074/jbc.M111.297697The latest version is at JBC Papers in Press. Published on November 14, 2011 as Manuscript M111.297697
Copyright 2011 by The American Society for Biochemistry and Molecular Biology, Inc.
by guest on September 8, 2018
http://ww
w.jbc.org/
Dow
nloaded from

electrophoresis; SEC, size-exclusion HPLC; UV
Abs, absorbance in the UV region.
INTRODUCTION
In order to ensure the safety and efficacy of
biotherapeutics, it is critical to understand and
prevent protein degradation. The presence of
aggregates in therapeutic proteins may jeopardize
their safety and efficacy by eliciting unwanted
immunogenic responses (1, 2). Mitigation of
aggregation processes while maximizing
biotherapeutic shelf-life remains one of the
outstanding challenges in biotechnology.
Monoclonal antibodies (mAbs) continue to
represent the leading group of biopharmaceutical
products (3−6). All currently approved therapeutic
mAbs belong to the IgG class and have a structure
schematically depicted in Figure 1. Intact mAbs
are composed of two identical light chains (LC)
and two identical heavy chains (HC) which are
covalently linked via several inter- and intra-chain
disulfide bonds. The LCs and HCs form two (VL,
CL) and four structurally homologous domains
(VH, CH1, CH2, CH3), respectively. The overall IgG
structure consists of two identical Fab domains
(VL, CL, VH, and CH1) and one Fc domain (CH2
and CH3) that are connected by a flexible hinge
region. The Fc portion harbors one conserved
Asn297 glycosylation site in each of its CH2
domains. The Fab and Fc regions of mAbs have
different biological functions. The Fab regions are
responsible for binding to the antigen whereas the
Fc portion plays a role in modulating immune cell
activity. In addition to mAbs, there are other
classes of biotherapeutics, such as Fc-fusion
proteins, that also contain Fc. These molecules are
composed of therapeutically active peptide or
protein moieties which are attached to either the
C-termini or N-termini of an IgG Fc. In such
cases, presence of an IgG Fc moiety may result in
improved physiological function, ease of
production, solubility, etc. However, the Fc region
is also associated with a range of degradation
processes, including oxidation (7) and aggregation
(8). A detailed understanding of how certain
structural changes within the Fc domain lead to
aggregation represents an important step towards
improving the quality of these therapeutic agents.
Fc-based biologics offer significant
manufacturing and physiological advantages.
Their purification process is greatly simplified by
the available selection of affinity resins targeting
the Fc portion (9, 10). Presence of a relatively
large (~50 kDa) and highly soluble Fc moiety
confers increased solubility and half-life (11). In
addition, the Fc region engages in specific
biologically relevant interactions that may require
CH2 glycosylation (antibody-dependent, cell-
mediated cytotoxicity; complement activation; in
vivo clearance; etc.) (12−15). Uncovering the
various sources of Fc instability that are connected
with particular CH2 glycoforms will enable
production of biologics with enhanced
pharmacological properties.
In a typical purification process, mAbs and
Fc-fusion proteins are exposed to acidic conditions
during viral inactivation and elution from affinity
resins (9, 16). It is well known that low pH
conditions may result in protein denaturation and
aggregation (17, 18). It was shown that acidic pH
and high ionic strength can promote formation of
nonnative protein structures. Some of the best
studied, partially folded, acid-denatured states (A-
states or MG-states) are populated at low pH in the
presence of salt. For example, an acid molten
globule state of cytochrome c is formed at pH 2.0-
2.5 in the presence of 0.5-1.5 M salt (19−21).
Apomyoglobin, -lactamase, and staphylococcal
nuclease also exhibit an acid- and salt-induced
formation of A-states at low pH (22−25).
Monoclonal antibodies and their fragments are no
exceptions to this rule. Buchner and co-workers
demonstrated that intact mAbs, Fab regions, and
even isolated CH3 domains form A-states at acidic
pH and high ionic strength (26−28). Although
stability and structure of these states are highly
dependent on the protein and experimental
conditions, their common characteristic is a
tendency to aggregate (17, 29, 30). Unlike small,
single-domain proteins, mAbs are complex
glycoproteins composed of several, independently
folded domains. Commercial mAb preparations
are rather heterogeneous and may contain
differentially processed, incompletely
glycosylated, and covalently modified forms (31).
The understanding of mAb aggregation is
challenged by the intrinsic and extrinsic
complexity (not to mention the storage history) of
antibody preparations.
Despite the aforementioned issues,
significant progress has been made in
understanding and preventing aggregation in
2
by guest on September 8, 2018
http://ww
w.jbc.org/
Dow
nloaded from

biopharmaceuticals (for a recent review see 32). It
was recognized that IgG aggregation can be
induced by various factors and proceed through
different mechanisms (33−36). However; the role
of individual antibody domains in aggregation
remained poorly understood. Recently, we
proposed that acid-induced aggregation of mAbs is
controlled by the stability of CH2 domains located
in the Fc region (8). At the time, no structural
evidence was generated concerning the extent of
CH2 unfolding associated with this aggregation
process. We are now filling this gap by gathering
all of the necessary structural and stability data to
implicate the CH2 domain. The scope of our study
was limited to Fc fragments to allow for the use of
high-resolution 2D NMR and to reduce the
number of DSC transitions. In addition, various
forms of Fc (i.e., with respect to IgG subclass and
degree of CH2 glycosylation) were analyzed under
conditions promoting acid-induced aggregation.
As a result, we revealed the aggregation rank order
of the most typical IgG Fc domains currently used
in biotechnology.
EXPERIMENTAL PROCEDURES
The E. coli-derived IgG1 Fc, CHO-derived
IgG1 Fc, CHO-derived IgG2 Fc, and the
uniformly 2H,
15N-labeled, E. coli-derived IgG1 Fc
were supplied by the Protein Sciences group at
Amgen, Inc. Intact mAbs (IgG1-A, IgG1-B, IgG2-
B, and IgG2-C) were supplied by the Process
Development group at Amgen, Inc. All purified
proteins were verified greater than 95 % pure by
SDS-PAGE and size-exclusion HPLC. Other
reagents and chemicals were of analytical grade or
better. All solutions were filtered through a 0.22
m filter prior to use.
Protein preparation, identification, and
characterization—The E. coli- and CHO-derived
Fc were supplied in 10 mM sodium acetate with 9
% (w/v) sucrose at pH 5.2. The purity and identity
of the Fc were verified by RP-HPLC and mass
spectrometry (see Figures S1-S3 of Supporting
Information for details). The E. coli-derived IgG1
Fc material was the most homogeneous. It
contained only one minor impurity, a species
presumably with an unpaired disulfide. The CHO-
derived IgG1 Fc contained fully glycosylated
species of expected mass and three minor species:
1) a singly oxidized species, 2) a species with an
unpaired disulfide, and 3) a partially glycosylated
species. The CHO-derived IgG2 Fc was more
heterogeneous, containing some clips and host cell
proteins. Its major fraction was composed of two
fully glycosylated species that presumably differed
in sulfation.
The IgG1-B-derived Fc fragments with
differing levels of CH2 glycosylation were
prepared as follows. Two milliliters of IgG1-B at 6
mg/mL were incubated with 24 µL of PNGase F
(New England Biolabs, Ipswich, MA) in 1X G7
buffer for 45 min at 37 °C. Endoproteinase Lys-C
(Roche Diagnostics, Basel, Switzerland) was then
spiked into the reaction mixture at a
protein/enzyme weight ratio of 200:1. The sample
was incubated at 37 °C for an additional 15 min
before quenching with 150 mM ammonium
acetate at pH 4.7 (37). The sample was then
cooled and maintained at 4 °C for immediate
purification or frozen at -80 °C to arrest further
enzyme activity.
Glycosylated, partially deglycosylated, and
fully deglycosylated Fc were purified using the
CEX method described below (also see 37).
Digested IgG1-B material was loaded onto the
column in multiple injections. An Agilent 1200
Series HPLC system with a 12/13 SelValve
external valve (Agilent Technologies, Santa Clara,
CA) was used to perform the fractionation.
Resulting fractions containing the same species
were pooled and concentrated, then re-analyzed by
CEX. Purity greater than 90 % was achieved for
all three Fc species based on RP-HPLC and mass
spectrometry (see Figure S4 of Supporting
Information).
Aggregation experiments—Previously, we
demonstrated that CEX can be used to measure the
aggregation propensity of both intact and
fragmented mAbs (8, 35). This same method was
applied in the current study where mAb and Fc
mixtures were exposed to different solution
conditions. In our experiments, each protein was at
0.5 mg/mL final concentration unless noted
otherwise. MAb and Fc mixtures were prepared in
a native buffer composed of 10 mM sodium
acetate at pH 5.2. They were subsequently diluted
into various solutions of interest and incubated
quiescently at 30 °C for up to several days. Sample
aliquots were taken at predetermined intervals and
analyzed immediately or stored on ice to reduce
further aggregation. The loss of soluble monomer
was determined for each individual protein relative
3
by guest on September 8, 2018
http://ww
w.jbc.org/
Dow
nloaded from

to an appropriate control stored refrigerated in 10
mM sodium acetate, pH 5.2. Unstable proteins
exhibited a faster decrease in the CEX monomer
concentration compared to more stable proteins (8,
35).
Cation-Exchange Chromatography (CEX)—
Aggregation of mAb and Fc mixtures was
investigated by cation-exchange chromatography
at pH 5.2 (35, 37). The method was run on an
Agilent 1100 Series HPLC system.
Chromatography was performed on a ProPac
WCX-10 analytical column (weak cation
exchange, 4 × 250 mm; Dionex, Sunnyvale, CA)
preceded by a ProPac WCX-10G guard column
(weak cation exchange, 4 × 50 mm; Dionex) at 25
°C. Protein samples were loaded onto the column
and analyzed at a flow rate of 0.7 mL/min. The
column was equilibrated with Buffer A (20 mM
sodium acetate, pH 5.2), and protein was eluted
with a linear gradient of Buffer B (20 mM sodium
acetate, 300 mM sodium chloride, pH 5.2) from 0
to 100 % over 35 minutes. Following elution, the
column was washed with Buffer C (20 mM
sodium acetate, 1 M sodium chloride, pH 5.2) for
5 minutes then re-equilibrated with Buffer A for
16 minutes. Absorbance was measured at 215,
235, and 280 nm. Data were analyzed with Dionex
Chromeleon© software and the 280 nm signal was
integrated to determine protein peak area.
Differential Scanning Calorimetry (DSC)—
DSC measurements were taken using a VP-
Capillary DSC system (MicroCal Inc.,
Northampton, MA) equipped with tantalum 61
cells, each with an active volume of 135 μL.
Protein samples, typically at 0.5 mg/mL, were
scanned from 20 to 110 °C at a rate of 60 °C/hour
following an initial 15-minute equilibration at 20
°C. A filtering period of 16 seconds was used, and
the data were analyzed using Origin 7.0 software
(OriginLab® Corporation, Northampton, MA).
Resulting thermograms were corrected by
subtraction of buffer control scans. The corrected
thermograms were normalized for protein
concentration.
Nuclear magnetic resonance (NMR)—Fc
NMR measurements were performed at 25 °C
using a Varian INOVA 800 MHz NMR
spectrometer (Varian Inc., Palo Alto, CA)
equipped with a 5 mm triple resonance probe. The
uniformly 2H,
15N-labeled E. coli-derived IgG1 Fc
was tested at 5 mg/mL in 10 mM sodium acetate
adjusted by HCl to pH 2.5, 3.1, 3.5, and 4.7. 1H-
15N HSQC spectra were acquired with 64
experiments run in the 15
N dimension (t1)
consisting of 16 scans and 1024 data points in the 1H dimension (t2). The total experimental time for
each spectral acquisition was 37 minutes. Spectra
were processed using NMRPipe (38) and analyzed
using NMRView (39). The 1
H-15
N cross-peak
assignments from Liu et al. were used (40).
The weighted average chemical shift
difference was calculated as previously described
(41). Reversed-phase chromatography and mass
spectrometry—Reversed-phase analysis of the E.
coli-derived IgG1 Fc, CHO-derived IgG1 Fc, and
CHO-derived IgG2 Fc was carried out on a Waters
(Milford, MA) Acquity system, equipped with a
Diphenyl 3 μm 1 × 50 mm column (Varian Inc.,
Palo Alto, CA) as previously described (42).
Typically, 5 μg of protein was injected on the
column. The column was held at 95 % solvent A
(0.1 % TFA in water) and 5 % solvent B (90 %
ACN and 0.085 % TFA in water) for 5 min
followed by a gradient from 5 % B to 38 % B over
13 min. Fc elution was achieved with a linear
gradient from 38 % B to 46 % B in 40 minutes at a
flow rate of 0.05 mL/min. The column
temperature was maintained at 75 °C throughout
the run and detection was at 214 nm.
Reversed-phase analysis of the IgG1-B-
derived Fc was carried out on a Waters Acquity
UPLC system as previously described (42).
Typically, 5 μg of sample was injected onto an
Acquity BEH 1.7 μm 1 × 50 mm phenyl column.
The column was held at 72 % solvent A (0.1 %
TFA in water) and 28 % solvent B (90 % ACN
and 0.085 % TFA in water) for 0.7 min. Solvent B
was increased to 31.4 % at 0.9 min, to 49.4 % at
3.4 min, and to 90 % at 3.5 min. At 4.10 min,
solvent B returned to the starting level (28 %) and
remained constant until the end of the assay at 5
min. The column temperature was maintained at
80 °C throughout the run, the flow rate was kept
constant at 0.35 mL/min, and the detection was at
214 nm.
The mass spectrometric analysis was carried
out in positive ion mode on a Waters Q-TOF
premier or LCT premier equipped with an
electrospray ionization (ESI) source. The capillary
and cone voltages were set at 3200 V and 60 V,
4
by guest on September 8, 2018
http://ww
w.jbc.org/
Dow
nloaded from

respectively. The desolvation and source
temperatures were set at 350 °C and 80 °C,
respectively. All other voltages were optimized to
provide maximal signal intensity. The instrument
was calibrated in the m/z range of 1500-4000
using multiply charged ions of a standard antibody
with a calculated MW value of 148251.2 Da or
commercial trypsinogen with a mass of 32300 Da.
All raw data were processed using Waters
MassLynx MaxEnt 1 software to obtain the
deconvoluted mass.
RESULTS
Effect of acidic conditions on IgG1 Fc
structure via NMR analysis—Although Fc is a
relatively large protein (~50 kDa), recent studies
demonstrated that it is amenable to high-resolution
2D NMR analysis (7, 43). Furthermore, resonance
assignments from Liu et al. made investigation of
pH effects on IgG1 Fc structure straightforward
(40). In the current study, the Fc conformation was
assessed between pH 2.5 and 4.7 by acquiring a
series of 1H-
15N HSQC spectra of the uniformly
2H,
15N-labeled E. coli-derived IgG1 Fc. Due to
the low ionic strength of the protein solutions (see
Experimental Procedures), no evidence of
aggregation was seen in any of the Fc samples
throughout the experiment. At pH 4.7, the amide
peaks of Fc were highly dispersed, which was
consistent with a folded conformation (see Figure
2A). A similar degree of dispersion was seen at pH
3.5, although a number of peaks were reduced in
intensity (Figure 2B). In addition, some new, low
intensity peaks emerged that were not present at
higher pH. At pH 3.1, a subset of native
resonances disappeared while a different set of
peaks appeared (Figure 2C). Spectral properties of
these new peaks were characteristic of a
disordered, largely unfolded protein conformation.
They resembled the minor resonances that were
barely visible at pH 3.5. The remaining native
resonances disappeared at pH 2.5 where NMR
showed limited peak dispersion consistent with an
unfolded state (Figure 2D).
At pH 3.5 and 4.7, the number of assigned
resonances available for analysis was 116 and 117,
respectively. This represented 51 % of the 227 Fc
amino acid residues. Many of the missing peaks
originated from the vicinity of the hinge region or
were due to peak overlap between the different pH
spectra. The number of native resonances dropped
to 46 at pH 3.1, and none were present at pH 2.5.
The weighted average, residue-specific,
chemical shift changes between pH 3.5-4.7 and
3.1-3.5 are shown in Figure 3. The most prominent
changes between pH 3.5-4.7 were clustered around
residue positions 250-255 and 310-315 (Figure
3A). These regions overlap with two short CH2 -
helices that interface with the CH3 domains (see
Discussion). In addition, notable chemical shift
changes (≥ 0.05 ppm) were associated with
positions corresponding to D280, Q295, L306, and
T335 of CH2 and G385 and K447 of CH3. Similar
regions produced peaks with reduced intensity at
pH 3.5, which likely reflected changes in the CH2
conformational dynamics. Moreover, some of the
native resonances that were present at pH 4.7
completely disappeared at pH 3.5, among them
resonances from K290 and possibly W277 and
V412 (see Table 1).
Peaks indicating the presence of a folded CH2
domain were virtually non-existent at pH 3.1,
suggesting that major unfolding had occurred
(Figure 2C). Therefore, estimates for the chemical
shift changes between pH 3.1-3.5 were only
available for CH3 domains (Figure 3B). At least
three residue positions showed significant
chemical shift changes at pH 3.1: R344, W381,
and K447. Of interest is the R344 residue, the
residue near the loop connecting the CH2 and CH3
domains. Changes at this position are likely the
result of structural changes in the adjacent CH2
domain. This is supported by the simultaneous
disappearance of many of the CH3 resonances
originating from positions 366-380 and 428-438
(Table 1). Both of these segments contain residues
forming the CH2-CH3 domain interface which
likely gets disrupted because of CH2 unfolding
(see Discussion).
A further reduction in pH from 3.1 to 2.5
resulted in the disappearance of all remaining
folded resonances (Figure 2D). The NMR
spectrum of Fc at pH 2.5 was now consistent with
an unfolded protein conformation devoid of stable
tertiary or secondary structure. The high affinity
CH3-CH3 interaction was likely disrupted also, as
demonstrated by the lack of native resonances
originating from the domain contact area.
Specifically, this was reflected by the absence of
native amide peaks from the following residues:
L351, E357, S364, L368, K370, T394, D399,
5
by guest on September 8, 2018
http://ww
w.jbc.org/
Dow
nloaded from

F405, and K409. Since all of these positions were
in a native-like environment at higher pH, the data
were consistent with a scenario where dissociation
and unfolding of the CH3-CH3 inter-chain complex
occurred simultaneously (see Discussion).
CEX analysis of Fc aggregation—
Previously, we demonstrated the utility of CEX in
measuring the aggregation propensity of both
intact and fragmented mAbs (8, 35). Similar to
SEC, CEX is a nondenaturing chromatographic
technique that can effectively separate aggregates
from monomers. However, in contrast to SEC,
CEX can resolve complex mixtures composed of
similarly sized proteins. Working with protein
mixtures allows us to monitor the aggregation of
different molecules simultaneously and under
identical conditions. Hence, CEX was selected to
establish the rank order of Fc aggregation as a
function of CH2 glycosylation and subclass (IgG1
vs. IgG2).
In addition to separating aggregates from
monomers, CEX is useful in detecting degraded or
chemically modified proteins (31, 37). This was an
added benefit as our goal was to measure Fc
aggregation with minimal interference from
chemical degradations. Our initial studies were
focused on finding conditions to induce Fc
aggregation within a short period of time at
moderately elevated temperatures. First, we
performed a pH screening experiment using
protein solutions buffered with 10 mM sodium
acetate to mimic the conditions that were used for
NMR. The samples contained a mixture of four
different molecules: three full-length mAbs (IgG1-
A, IgG2-B, and IgG2-C) and E. coli-derived IgG1
Fc. The choice to use the three mAbs was dictated
by our previous experience with these molecules
(8, 35). They served as internal controls to
optimize solvent composition and incubation time
to assess Fc aggregation. In agreement with the
NMR results, aggregation was not observed in
these low (10 mM) acetic acid solutions at pH 3-5
even after 2 days of storage at 30 °C (data not
shown). This was consistent with the important
role of the ionic strength and acid concentration in
low pH mAb aggregation (8). Subsequently, the
pH screening was repeated in the presence of high
(100 mM) sodium acetate with and without 50
mM NaCl (the corresponding solutions are
abbreviated as 100Ax and 100AxN, where A stands
for sodium acetate, x is the pH, and N is NaCl). All
four molecules were premixed in 10 mM sodium
acetate at pH 5.2 prior to being exposed to the low
pH conditions. Figures 4A and 4B show CEX
chromatographic traces for samples incubated in
100A37N and 100A34, respectively. Figure 5
summarizes results from various conditions in
terms of percent monomer recovery based on
CEX. It is evident that IgG1-A aggregated only at
pH 3.4 (Figures 5A and 5E), whereas aggregation
of Fc and the two IgG2s occurred at pH 3.7-4.1
(Figures 5B and 5F, 5C and 5G, and 5D and 5H,
respectively). Previously, we observed that low pH
aggregation of mAbs was dependent on CH2
glycosylation and the IgG subclass (8). In
particular, glycosylated IgG1 mAbs were more
resistant to aggregation compared to their
glycosylated IgG2 counterparts, whereas an
aglyco-IgG1 (an IgG1 mAb devoid of CH2
glycosylation) was the least stable molecule tested
(8). Consistent with these findings, Figure 5
reveals the following aggregation rank order of the
four molecules (listed from the highest
aggregation propensity to the lowest): E. coli-
derived IgG1 Fc (i.e., aglyco IgG1 Fc) > IgG2-C >
IgG2-B > IgG1-A. Aggregation propensity of Fc
in 100A34 and 100A34N was particularly high and
resulted in the loss of 30-40 % of monomer at t = 0
(Figures 5D and 5H, respectively). Thus, the CEX
data demonstrated an increased instability of
aglyco-IgG1 Fc compared to glycosylated mAbs.
Furthermore, the aggregation rank order for these
molecules was the same in either the 100Ax or
100AxN conditions, which indicated the following:
1) the underlying aggregation mechanism was
largely unaffected by NaCl; 2) the rate and extent
of Fc aggregation could be appropriately
modulated by varying the ionic strength. Since
covalent modification and fragmentation was not
evident in these experiments (see Figure 4),
protein aggregation was the major degradation
process. In summary, sufficient evidence was
gathered to support the low pH approach for
generating Fc aggregation data.
Our next experiment was performed on a
mixture composed of three different Fc moieties:
E. coli-derived IgG1 Fc, CHO-derived IgG1 Fc,
and CHO-derived IgG2 Fc. This mixture was
subjected to aggregation in the 100A31N and
100A35N conditions as outlined above. The CEX
overlays corresponding to aggregation in 100A35N
are shown in Figure 6A. Quantitative aggregation
6
by guest on September 8, 2018
http://ww
w.jbc.org/
Dow
nloaded from

results in 100A31N and 100A35N are summarized
in Figures 6B and 6C, respectively. Despite the
heterogeneous nature of the Fc samples, the CHO-
derived IgG1 Fc (including all minor forms) was
evidently more resistant to aggregation compared
to its aglycosylated (E. coli) variant or the CHO-
derived IgG2 Fc. Aggregation of the latter two
molecules appeared similar in 100A35N but
differed in 100A31N. In particular, aglyco-IgG1 Fc
lost ~55 % of monomer at t = 0 but aggregated
more slowly afterwards (gray symbols in Figure
6C). The initial monomer loss of the CHO-derived
IgG2 Fc was less than 40 %, but the remaining
monomer disappeared rapidly (open symbols in
Figure 6C). Since all three molecules were
premixed at pH 5.2 prior to the low pH exposure,
this result indicated a lack of stability of the
aglyco-IgG1 and glyco-IgG2 Fc. Consequently,
the rank order of Fc aggregation was found to be:
aglyco-IgG1 Fc ≥ IgG2 Fc (CHO) > IgG1 Fc
(CHO). This was consistent with our earlier
findings (8), as well as the aggregation rank order
that was drawn from Figure 5. Therefore, a
conclusion was made that the 100A31N and
100A35N conditions primarily promoted a CH2-
dependent aggregation mechanism.
Our last aggregation experiment utilized
differentially glycosylated Fc fractions generated
from another IgG1 mAb, IgG1-B. The success of
this experiment depended on: 1) the ability of
CEX to resolve Fc fragments with different levels
of CH2 glycosylation; 2) the optimization of
PNGase F treatment to achieve an optimal ratio of
glycosylated, partially deglycosylated, and fully
deglycosylated Fc for purification. The ability of
CEX to separate differentially glycosylated Fc was
verified by analyzing PNGase F treated and
untreated IgG1-B following Lys-C limited
proteolysis (data not shown). Subsequently, IgG1-
B and PNGase F concentrations were varied along
with incubation temperature and duration to
achieve an optimal rate of digestion and desired
ratio of glycosylated, partially deglycosylated, and
fully deglycosylated Fc. Storage temperature and
duration after digestion were also assessed to
ensure that this ratio was sufficiently maintained
over the course of purification (see Experimental
Procedures). The resulting Fc fractions were
verified by RP-HPLC and mass spectrometry (see
Figure S4), mixed together, and subjected to an
aggregation process in 100A31N. The
corresponding CEX results are shown in Figures
7A and 7B. In agreement with the data in Figure
6C, glycosylated Fc was more resistant to
aggregation compared to its fully deglycosylated
variant. The partially deglycosylated Fc exhibited
an intermediate stability. The initial monomer loss
of the glycosylated, partially deglycosylated, and
fully deglycosylated Fc was 8 %, 31 %, and 63 %,
respectively. Thus, the rank order of Fc
aggregation was found to be: fully deglycosylated
Fc > partially deglycosylated Fc > glycosylated
Fc. Such results provided compelling evidence for
the importance of CH2 glycosylation in
determining the rate and extent of Fc aggregation.
Effect of acidic conditions on Fc stability via
DSC analysis—Thermostability of E. coli-derived
IgG1 Fc, CHO-derived IgG1 Fc, and CHO-derived
IgG2 Fc was assessed under conditions mimicking
the CEX aggregation experiments (see above).
DSC samples were made by diluting protein stock
solutions into different 100Ax buffers, except for
pH 7 controls that were prepared in 100 mM
sodium phosphate (100NaPi70). Figure 8 shows
DSC traces for the three Fc variants. A summary
with all of the DSC data as a function of pH and
apparent Tm is given in Figure 9 and Table 2.
Although IgG Fc’s are known to consist of two
different, independently folded domains, CH2 and
CH3, some of the DSC profiles contained an
additional high temperature peak. We will refer to
this peak as an ―A-state‖ in accordance with
Buchner and co-workers (26).
At pH 7.0, the DSC profile of the E. coli-
derived IgG1 Fc was characterized only by the
presence of CH2 and CH3 transitions (Figure 8A).
Between pH 3.5-5.2, an additional A-state
transition was present, giving rise to a
characteristic three-peak profile (Figures 8B-E).
Below pH 3.5, the aglycosylated CH2 domain was
unfolded and no longer produced a peak. As a
consequence, the corresponding DSC profile
contained only CH3 and A-state transitions (Figure
8F).
Results for CHO-derived IgG1 Fc were
similar to E. coli-derived IgG1 Fc with respect to
the CH3 and A-state transitions (Figure 8). The
latter transition was now seen across the entire pH
range, including pH 7.0 (Figure 8A). As expected,
glycosylated CH2 had a higher Tm compared to its
aglycosylated counterpart, confirming the
important stabilizing role of CH2 glycans (see
7
by guest on September 8, 2018
http://ww
w.jbc.org/
Dow
nloaded from

Figure 9A and Table 2). The magnitude of this
difference increased as pH decreased: the initial
Tm difference of ~6 °C reached ~13 °C when the
pH dropped from 7.0 to less than 4.0. CH3 of the
CHO-derived Fc also appeared to have a higher Tm
but only at a pH below 3.5 (Figure 9A). Such a
result indicated that CH3 domains in the aglyco-Fc
were affected by the CH2 instability (unfolding) at
pH < 3.5, in agreement with the NMR data above.
The DSC profiles of the CHO-derived IgG2
Fc (Figures 8 and 9) generally resembled those of
the CHO-derived IgG1 Fc. The IgG2 Fc differed
notably from IgG1 Fc in the following ways: 1)
the A-state transition was less frequently observed;
2) the CH3 transition had a lower Tm across the
entire pH range; 3) the Tm of the CH2 transition
was comparable at pH 5.2-7.0, but a further
reduction in pH revealed a stability difference.
Specifically, the Tm of the IgG2 CH2 was much
more dependent on pH and decreased
significantly. The maximal difference seen in this
study (~7 °C at pH 3.5) agreed with our previously
reported value obtained at pH 3.5 in the presence
of 500 mM NaCl (8).
The following domain properties were the
same across all three Fc types (see Figure 9): 1)
the Tm of CH2 was higher at pH 7.0 compared to
5.2, and it decreased in a non-linear fashion upon
solution acidification; 2) the Tm of CH3 was nearly
identical between pH 7.0 and 5.2 but decreased in
a non-linear fashion upon further acidification; 3)
the Tm of the A-state seemed to be lower at pH 7.0
than at 5.2. It proceeded through a maximum at
pH ~5.2 before undergoing a non-linear decrease
upon further pH reduction.
In order to understand the nature of the A-
state transition, the concentration dependence of
the thermograms for CHO-derived IgG1 Fc was
investigated. For this purpose, 0.1, 0.2, 0.3, and
0.4 mg/mL protein samples were prepared in
100A35 and subsequently analyzed by DSC.
Although the signal at low protein concentrations
was weak, triplicate runs reproducibly revealed the
concentration-dependent nature of the A-state. The
characteristic three-peak profile was seen in all
cases, but the enthalpy of the A-state peak visibly
decreased at 0.1 mg/mL protein (see Figure S5 of
Supporting Information).
DISCUSSION
High-resolution structural analysis of Fc
unfolding—Analysis of chemical shift
perturbations via 1H-
15N HSQC NMR is a
powerful approach that allows a detailed
understanding of protein structural changes.
Changes in chemical shifts may originate from
changes in hydrogen bonding as there is a strong
correlation between hydrogen bond energies and
amide proton or amide nitrogen chemical shifts
(45). Protein unfolding is expected to result in
chemical shift and peak intensity changes, but
some regions of a molecule may exhibit greater
changes in conformational dynamics or in the
electronic/electrostatic environment than others.
This may especially be the case with proteins
composed of structurally distinct domains, such as
mAbs and their Fab and Fc fragments.
An IgG Fc molecule is composed of two
types of independently folded domains, CH2 and
CH3. Thus, denaturation of Fc is expected to be a
multi-stage process where changes in one domain
are not fully coupled with changes in another.
Until now this view was supported by evidence
from differential scanning calorimetry and optical
spectroscopy studies (46, 47). It has also been
known that CH2 domains tend to be less stable
than CH3 under a large variety of conditions. Our
residue-specific 2D NMR analysis provides direct
evidence for both of these notions. We
demonstrate that structural changes in CH2 and
CH3 are largely uncoupled and that unfolding of
CH2 precedes that of CH3. This mainly follows
from: 1) the chemical shift and peak intensity
changes at pH 3.5, indicating increased
susceptibility of CH2 to structural perturbations
(Figure 3A); 2) the absence of native peaks from
CH2 at pH 3.1, in contrast to the presence of at
least 46 assigned resonances from CH3 (Figures
2C and 3B).
Equilibrium GuHCl unfolding of isolated
CH2 was previously shown to be consistent with a
two-state process (48). Results from our study
suggest a more complex unfolding scenario that
invokes partially denatured conformations. Feige
and co-authors derived their conclusion based on
evidence provided by intrinsic fluorescence and
circular dichroism. Because of limited sensitivity
and structural resolution, optical spectroscopy may
not always reveal near-native protein
conformations accessible by NMR. The observed
discrepancy may also be explained by: 1)
8
by guest on September 8, 2018
http://ww
w.jbc.org/
Dow
nloaded from

differences in the experimental pH (the GuHCl
unfolding studies were performed at pH 7.5); 2)
differences in the mode of protein denaturation
(chaotrope- vs. acid-induced); 3) differences in the
unfolding mechanism of isolated CH2 domains vs.
CH2 domains within the context of an IgG Fc. All
of these aspects could possibly be addressed by
performing NMR-based unfolding experiments on
isolated CH2. However, such studies were beyond
the scope of our investigation.
Structural characteristics of CH2 at pH 3.5 are
indicative of partial denaturation caused by
protonation of acidic side chains. Particular
suspects are the E380 and E430 residues that form
salt bridges with K248 and K338, respectively.
Both glutamic acid residues reside in CH3 and
their side chains are expected to be largely
protonated at pH 3.5 (pK of free glutamic acid is
4.07). Their CH2 partners, K248 and K338, lay in
close proximity to the two CH2 -helices that
undergo the most significant perturbation at pH
3.5 (Figure 3A). The crystal structure of IgG1 Fc
(PDB entry 1HZH (49)) provides evidence that the
K248-E380 and K338-E430 ion pairs may be
required for stabilization of the CH2-CH3
interaction area. Therefore, it is plausible that the
loss of such interactions due to the E380 and E430
protonation could modulate the structure of the
CH2-CH3 interface. It is important to note that the
same region represents the Protein A-binding site
and its impairment causes acid elution of mAbs
from Protein A resins. Some CH2 destabilization
may also be brought about by the protonation of
D312, a residue that resides in one of the two CH2
helices and interacts with K317. Indeed, the amide
peak of D312 shows a significant chemical shift
perturbation and intensity loss at pH 3.5 (Figure
3A). Another interesting observation is related to
the L306 and W277 side chains that are packed
against each other in the hydrophobic core of the
CH2 domain. At pH 3.5, the L306 resonance
undergoes a notable chemical shift change,
whereas the peak for W277 apparently disappears
(Table 1). Moreover, chemical shift changes are
evident for the amide peak of the Q295 residue
that is located near the hinge region and is far
removed from the aforementioned helices. This
indicates that changes in the CH2 domain structure
extend well beyond the CH2-CH3 interface (see
Figures 10A and 10B). The potential outcome of
these changes is the exposure of buried
hydrophobic surfaces that can prime Fc for
aggregation. The scenario and regions involved
appear to be different from the computationally
predicted aggregation-prone regions in CH2 (50).
However, because of the differences in the
experimental pH (SAP analysis was performed at
pH 6.5), a direct comparison of the data may not
be appropriate.
In contrast to CH2, structural changes in CH3
are limited at pH 3.5. We only note the chemical
shift changes for G385 and K447 and the potential
absence of the V412 resonance (Table 1). At pH
3.5, native resonances from CH3 remain relatively
unperturbed, indicating that it maintains an overall
folded structure (Figures 2B and 3A).
The reduction in pH from 4.7 to 3.5 is
associated with only a partial denaturation of CH2,
whereas pH reduction from 3.5 to 3.1 results in a
major loss of tertiary and secondary structure. In
contrast, unfolding of CH3 only takes place below
pH 3.1, as evidenced by the dispersion of its amide
resonances. Although many of the native CH3
resonances are missing at pH 3.1, this is likely
related to the denaturation of CH2 rather than CH3.
This is supported by the location of the majority of
the missing peaks at the CH2-CH3 interface
(positions 366−380 and 428−438, see Figures
10C/D and Table 1). However, the absence of
some of the native CH3 peaks may simply be
caused by an overlap with resonances originating
from denatured CH2. Furthermore, there is indirect
DSC evidence suggesting only a slight difference
in CH3 Tm between the E. coli- and CHO-derived
IgG1 Fc at pH below 3.5 (Figure 9A). In the case
of these two Fc moieties, the difference in CH3
stability is likely determined by the presence or
absence of CH2 glycans. Since the magnitude of
the CH3 Tm difference is rather small, we can
deduce that CH2 denaturation has only a minor
impact on the stability of the adjacent CH3. The
CH3-CH3 contact area also remains relatively
unperturbed, but some changes within these
domains do take place, as evidenced by the W381
and Y391 resonances. The side chains of these two
residues form a tertiary contact by packing against
each other in the hydrophobic core. At pH 3.1, the
W381 resonance exhibits notable changes in its
chemical shift and intensity, whereas the peak for
Y391 disappears entirely (Figure 3B and Table 1).
Furthermore, V369 is another deeply buried CH3
residue that is missing its native resonance at pH
9
by guest on September 8, 2018
http://ww
w.jbc.org/
Dow
nloaded from

3.1 (Table 1). Therefore, it can be concluded that
although the CH3 domains are folded at this pH,
their tertiary structure is not fully native.
A further reduction in pH from 3.1 to 2.5
brings about major unfolding of CH3, as evidenced
by the disappearance of resonances from its folded
state (Figure 2D). An important feature of CH3
domain is the formation of a tightly bound CH3-
CH3 dimer. Upon inspection of the Fc crystal
structure, a number of CH3-CH3 inter-domain
interactions can be found. Among them, the ion
pairs E357-K370 and D399-K409 clearly stand
out. Although no direct NMR evidence is currently
available, one can hypothesize that protonation of
the E357 and D399 residues might contribute to
CH3 unfolding at pH 2.5. Protonation of these side
chains would be expected to result in
destabilization of the CH3-CH3 dimer due to the
loss of 4 inter-domain salt bridges. Another
interaction that may be influenced by the same
mechanism is the ion pair formed between D356
and K439. A more detailed analysis of the specific
role of acidic side chains in Fc stability will be
presented elsewhere.
CH2/CH3 stability and Fc aggregation in
acidic conditions—Direct investigation of Fc
aggregation by 1H-
15N HSQC NMR is precluded
by the large size of products of this reaction. To
forestall unwanted aggregation, our NMR
measurements were performed under low ionic
strength conditions. These experiments provided
information on the location and extent of structural
changes in CH2 and CH3, which is necessary for
improved understanding of Fc aggregation. Our
DSC experiments allowed us to extend this
analysis to the CHO-derived IgG1 and IgG2 Fc for
which isotopically enriched material was not
available. The intrinsic susceptibility of CH2 to
pH-induced changes is reflected by its Tm vs. pH
profile. For example, the pH profile of CH2 from
the E. coli-derived IgG1 Fc is less linear compared
to its CHO-derived counterpart (Figure 9A).
Similarly, the CHO-derived IgG2 Fc shows less
linear dependency on pH compared to the CHO-
derived IgG1 Fc (Figure 9B). The increased
susceptibility of aglycosylated CH2 is likely
caused by the absence of stabilizing interactions
from carbohydrates; the reasons for the higher
susceptibility of IgG2 CH2 are less obvious.
Previously, we speculated on the role of the CH2
sequence variations between the IgG1 and IgG2
subclasses (8). In particular, we hypothesized that
the region surrounding the YIgG1300FIgG2
substitution (Table 3) could be associated with
IgG2 CH2 instability at low pH. Our NMR data at
pH 3.5 for E. coli IgG1 Fc lend support to this
idea. As revealed by the chemical shift analysis,
the structural environment of Q295 undergoes a
significant change at this pH (Figure 3A). Q295 is
located near a tertiary contact formed by the side
chains of His268, Glu294, and YIgG1300FIgG2. It is
reasonable to presume that protonation of Glu294
at pH 3.5 would destabilize the His268-Glu294
charge-charge interaction. The specific residue
located at position 300 may further influence the
energy of this contact. Indeed, the Tm vs. pH
profiles of CH2 shown in Figure 9 are generally
consistent with protonation of a glutamic acid
residue(s). It would then follow, that the
mechanism of destabilization of the region
including Q295 is similar to the one proposed for
the two CH2 helices at the CH2-CH3 interface (see
above). Such scenarios tie together the wide-
spread structural perturbations in CH2 at pH 3.5
with the location of key acidic residues in the Fc
structure. Other mechanisms, including anion
binding, may contribute to this destabilization,
especially when the ionic strength is increased.
The above considerations are consistent with
our previous studies on low pH mAb aggregation.
Ten different IgG2s that were studied earlier
showed an increased aggregation propensity
compared to five different IgG1s (8). This subclass
dependency correlated with reduced
thermostability of IgG2 CH2 relative to IgG1 CH2.
In addition, regardless of the subclass, CH2
glycosylation was found to be an important
attribute that determined stability and aggregation
of Fc and intact mAbs. Some of these conclusions
have already been confirmed outside of our group
(50).
It is interesting to note that the Tm vs. pH
profiles for the CH3 domain of CHO-derived IgG1
and IgG2 Fc are very similar, but offset by 6-7 °C
(Figure 9B). There are only three sequence
positions that differ in these domains between the
IgG1 and IgG2 subclasses (see Table 3):
DIgG1356EIgG2, LIgG1358MIgG2, and VIgG1397MIgG2.
Therefore, some or all of these residues must be
responsible for the reduced stability of IgG2 CH3.
Commercial IgG1s tend to contain either
D356/L358 or E356/M358 substitutions (8, 51).
10
by guest on September 8, 2018
http://ww
w.jbc.org/
Dow
nloaded from

Thus, an opportunity exists to assess the impact of
these residues without the need for new mutant
construction. Our preliminary experiments on an
IgG1 containing D356/L358 vs. an IgG1 with
E356/M358 revealed no difference in their CH3
domain stability (data not shown). Given that this
finding is confirmed in the case of other IgG1s,
this result leaves the VIgG1397MIgG2 mutation as
the culprit for the reduced stability of IgG2 CH3.
The CHO-derived IgG1 Fc provided the most
complete pH profile for the A-state transition
(Figure 9). For reasons not fully understood, the E.
coli-derived IgG1 Fc and CHO-derived IgG2 Fc
failed to produce this transition at some of the pH
values. One possible explanation for this is the
narrow temperature range (20-110 °C) that was
probed in our experiments. Since the A-state
transition tends to occur at ≥ 100 °C, it may have
been necessary to extend the DSC measurements
up to at least 120 °C. Another possibility is to use
higher protein concentrations for improved
detection of this low enthalpy transition.
Nevertheless, three important conclusions can be
made based on the available data. First, the A-state
transition does not seem to be affected by CH2
glycosylation (or CH2 (de)stabilization as a result
thereof), suggesting that it forms independent of
CH2 (Figure 9A). This dovetails nicely with earlier
findings which show that the A-state is formed by
isolated CH3 domains (28). Such an agreement
serves to confirm that the A-state formation might
be CH3-dependent even in the case of a full-length
Fc. Second, the Tm vs. pH profiles of the A-state
for CHO-derived IgG1 and IgG2 Fc appear similar
but are offset by several degrees °C (Figure 9B).
The reason for this is currently unknown and
further studies in this area are warranted. Third,
the protein concentration dependence of the A-
state suggests that its formation requires the
association of several Fc molecules (Figure S5).
This is again consistent with the previous report
from Thies and co-workers (28). In particular, they
showed that CH3 domains formed a defined
oligomer consisting of 12-14 subunits at pH 2 in
the presence of salt. Although an assessment of the
Fc oligomeric structure was beyond the scope of
our investigation, the appearance of a well-defined
DSC transition is consistent with the formation of
a distinct protein complex or aggregate.
There are still many questions regarding the
A-state that need to be addressed in order to fully
understand Fc aggregation. Semantically, it is
unclear whether it is appropriate to call it an acid-
denatured state if it is present even at neutral pH
(Figure 9). Our findings to date favor the idea that
Fc aggregation in acidic conditions is primarily
determined by its CH2 domains. Nevertheless,
questions on the possible contributing role of the
A-state (or CH3 domains) in Fc aggregation remain
unanswered. There is also a necessity to discuss
the value of calorimetrically determined stability
in predicting Fc aggregation. For instance, is there
a correlation between DSC and increased
aggregation of aglyco-IgG1 Fc or glyco-IgG2 Fc
compared to glyco-IgG1 Fc? Figure 9 shows that
thermostability of the A-state does not correlate
with aggregation. For example, the Tm vs. pH
profiles of the A-states for aglyco- and glyco-IgG1
Fc overlay almost perfectly (Figure 9A). Yet,
aggregation propensity of these two Fc moieties is
dramatically different (Figure 6). The A-state
transition of the glyco-IgG2 Fc occurs at higher
temperatures than that of the glyco-IgG1 Fc
(Figure 9B). Yet, it is the CHO-derived IgG2 Fc
that aggregates more readily (Figure 6). The same
reasoning applies to CH3 domains. Their stability
in the aglyco- and glyco-IgG1 Fc is similar until
pH < 3.5 (Figure 9A). Yet, aggregation of the
aglyco-Fc is already underway at pH 3.7 (Figures
5D and 5H). As far as the IgG1 and IgG2 Fc, their
CH3 profiles are substantially shifted along the x-
axis (Figure 9B). Assuming that CH3 denaturation
was driving aggregation, aggregation of IgG2 Fc
would always be higher compared to both glyco-
and aglyco-IgG1 Fc. Is this really the case? Figure
9C shows an overlay of the Tm vs. pH profiles for
E. coli-derived IgG1 Fc and CHO-derived IgG2
Fc. Analysis of these profiles along with the
results from Figure 6 helps to identify domains
that correlate with aggregation. The aglyco-IgG1
Fc experiences a much larger loss of monomer at t
= 0 in 100A31N (Figure 6C), which is consistent
with the lower stability of its CH2 domains (Figure
9C). If Fc aggregation was primarily dependent on
CH3, one would have predicted the opposite result.
Thus, we can conclude that CH2 stability
differences from calorimetry are generally
reflective of Fc aggregation propensity. However,
a prediction based solely on Tm is not
recommended because aggregation may also be
influenced by structural perturbations or kinetic
aspects that escape DSC detection.
11
by guest on September 8, 2018
http://ww
w.jbc.org/
Dow
nloaded from

On the relationship of CH2 glycosylation and
product quality—The overall goal of
biopharmaceutical production is the achievement
of the highest possible yield and purity with
reduced aggregate levels. The recently introduced
concept of Quality by Design (QbD) provides a
description of the desired state for manufacturing
(52). Understanding the relationship between
product quality and manufacturing is one of the
main expectations of QbD. In this section we will
discuss how knowledge of Fc aggregation
mechanisms may help improve quality of Fc-based
therapeutics.
In the past few years, understanding of the
importance of CH2 glycosylation has improved
dramatically (14, 15). Apart from its biological
function, CH2 glycosylation may now be viewed
as one of the attributes determining mAb
aggregation during production and storage (8, 50).
The majority of therapeutic mAbs are produced in
a glycosylated form via the CHO cell expression
system. Subsequent purification steps are
streamlined and tightly controlled to ensure
consistency and reproducibility of product quality.
However, existing purification platforms rarely
result in bulk material that is devoid of
incompletely glycosylated species. The presence
of such molecules is routinely assayed via
capillary electrophoresis under reducing and
denaturing conditions (rCE-SDS) (14). Disulfide
reduction and denaturation of IgGs forces them to
dissociate into constituent light and heavy chains
that can be separated based on size. Migration of
the latter is influenced by the presence or absence
of CH2 glycans, resulting in the detection of two
distinct heavy chain peaks. Typical rCE-SDS
estimates for non-glycosylated heavy chain
(NGHC) are on the order of 1 % for different mAb
preparations (personal communication by Nancy
Nightlinger and Alison Wallace of Amgen Inc.).
Assuming that there is only one NGHC per
antibody molecule, this would translate into 2 %
of partially glycosylated species in the purified
bulk. Is there a particular role for these species in
mAb and Fc aggregation? Is their presence a
quality attribute that reflects risks of aggregation
in biopharmaceutical preparations?
Recent studies showed that aglycosylated
mAbs and Fc are unstable in acidic conditions or
at higher pH and elevated temperature (8, 50).
However, no information was available on the
aggregation propensity of a fully glycosylated
molecule relative to its aglycosylated and partially
glycosylated forms. To the best of our knowledge,
Figure 7 provides the first illustration of the effect
of all three levels of CH2 glycosylation in the case
of Fc. The data shown therein were generated
from a protein mixture to ensure identical
conditions for establishing aggregation propensity.
It is evident that Fc aggregation correlates strongly
with the degree of CH2 glycosylation. Since IgG
aggregation in acidic conditions proceeds
predominantly via a CH2-dependent pathway (see
above), we can argue that such results are relevant
also for intact mAbs and Fc-fusion proteins.
The fate of partially glycosylated species is
determined by their exposure to stress conditions
triggering nonnative aggregation. A typical
manufacturing process is a matrix of conditions,
some of which are known to be denaturing (acidic
pH during viral inactivation, freezing and thawing,
stirring, etc.). Therefore, it is possible that
biopharmaceutical preparations containing
increased levels of such species are at a higher risk
of forming aggregates. Even a fraction of
denatured, partially glycosylated species that could
form immunogenic aggregates may negatively
impact product quality. Moreover, the probability
of aglycosylated species (species that lack both
heavy chain carbohydrates) may be low, but it is
far from negligible. Such species are of even
greater concern because of their increased
aggregation propensity (Figure 7) and the inability
of most current techniques to detect them. In
particular, their direct assessment is complicated
by the prevalence of partially glycosylated mAbs.
The CEX traces in Figure 6A attest to the fact
that CH2 glycosylation and IgG subclass must be
the main determinants of Fc aggregation. This
follows from their overriding effects on stability,
even when considering all of the major and minor
species that are associated with Fc heterogeneity.
Therefore, considering all of the evidence
generated in this and preceding work (8), there is
sufficient knowledge to be applied in a practical
test. It is likely that opportunities exist to improve
the quality of biotherapeutics by increasing the
level of CH2 glycosylation, assuming that this does
not interfere with functional requirements (Fc
effector functions, in vivo clearance, etc.). This
may be achieved by improving cell culture and/or
purification processes. Alternatively, CH2
12
by guest on September 8, 2018
http://ww
w.jbc.org/
Dow
nloaded from
aggregation may be mitigated by finding
appropriate formulation and/or protein engineering
strategies. If tested, some of these ideas may prove
beneficial in reducing aggregation issues
associated with mAb- and Fc-based therapeutics.
The discussion above should not be viewed
as an argument against the production of
aglycosylated biologics. To the best of our
knowledge, they can be successfully developed
given that sufficient efforts are spent to optimize
manufacturing, storage, and delivery conditions.
Our goal was to highlight that the aggregation
propensity of fully glycosylated, partially
glycosylated, and aglycosylated mAbs can vary
significantly. And, that the cause of protein
instability may not necessarily be associated with
the main product, but with some of its unstable
forms that escape detection.
CONCLUSIONS
A combined use of 2D NMR, DSC, and CEX
proved useful for gaining a detailed understanding
of the mechanisms of unfolding and aggregation
of IgG Fc. Fc aggregation under acidic conditions
was found to be primarily determined by the CH2
domain stability. This process appeared to be
triggered by CH2 unfolding associated with the
protonation of specific acidic residues. The rate
and extent of Fc aggregation were shown to be
highly dependent on the subclass (IgG2 Fc was
less stable than IgG1 Fc) and the degree of CH2
glycosylation. The ionic strength of the solution
played an important role in Fc aggregation under
acidic conditions.
Acknowledgements—The authors thank Randall Bass, Feng He, Gerald W. Becker, Linda O. Narhi,
Michael J. Treuheit, and David N. Brems for general support, technical assistance, and helpful
discussions. They also thank Gerd R. Kleemann for help with the IgG schematic and Prof. Melanie Cocco
(University of California, Irvine, CA) for access to the UCI NMR facility.
REFERENCES
1. Koren, E., Zuckerman, L. A., and Mire-Sluis, A. R. (2002) Curr. Pharm. Biotechnol. 3, 349−360
2. Rosenberg, A. S. (2006) AAPS J. 8, E501−507
3. Carter, P. J. (2006) Nat. Rev. Immunol. 6, 343−357
4. Chames, P., Van Regenmortel, M., Weiss, E., and Baty, D. (2009) Br. J. Pharmacol. 157, 220−233
5. Huang, C. (2009) Curr. Opin. Biotechnol. 20, 692–699
6. Beck, A., Wurch, T., Bailly, C., and Corvaia, N. (2010) Nat. Rev. Immunol. 10, 345−352
7. Liu, D., Ren, D., Huang, H., Dankberg, J., Rosenfeld, R., Cocco, M. J., Li, L., Brems, D. N., and
Remmele, R. L. Jr. (2008) Biochemistry 47, 5088–5100
8. Hari, S. B., Lau, H., Razinkov, V. I., Chen, S., and Latypov, R. F. (2010) Biochemistry 49, 9328–
9338
9. Fahrner, R. L., Knudsen, H. L., Basey, C. D., Galan, W., Feuerhelm, D., Vanderlaan, M., and
Blank, G. S. (2001) Biotechnol. Genet. Eng. Rev. 18, 301–327
10. Low, D., O’Leary, R., and Pujar, N. S. (2007) J. Chromatogr. B: Anal. Technol. Biomed. Life Sci.
848, 48–63
11. Strohl, W. R. (2009) Curr. Opin. Biotechnol. 20, 685–691
12. Tao, M.-H., and Morrison, S. L. (1989) J. Immunol. 143, 2595–2601
13. Wright, A., and Morrison, S. L. (1997) Trends Biotechnol. 15, 26–32
14. Beck, A., Wagner-Rousset, E., Bussat, M.-C., Lokteff, M., Klinguer-Hamour, C., Haeuw, J.-F.,
Goetsch, L., Wurch, T., Van Dorsselaer, A., and Corvaïa, N. (2008) Curr. Pharm. Biotechnol. 9,
482-501
15. Chen, X., Liu, Y. D., and Flynn, G. C. (2009) Glycobiology 19, 240–249
16. Ejima, D., Tsumoto, K., Fukada, H., Yumioka, R., Nagase, K., Arakawa, T., and Philo, J. S. (2007)
Proteins 66, 954–962
17. Fink, A. L., Calciano, L. J., Goto, Y., Kurotsu, T., and Palleros, D. R. (1994) Biochemistry 33,
12504–12511
13
by guest on September 8, 2018
http://ww
w.jbc.org/
Dow
nloaded from

18. Ptitsyn, O. B. (1995) Adv. Protein Chem. 47, 83–229
19. Ohgushi, M., and Wada, A. (1983) FEBS Lett. 164, 21–24
20. Jeng, M. F., Englander, S. W., Elöve, G. A., Wand, A. J., and Roder, H. (1990) Biochemistry 29,
10433–10437
21. Nakamura, S., Seki, Y., Katoh, E., and Kidokoro, S. (2011) Biochemistry 50, 3116–3126
22. Goto, Y., and Fink, A. L. (1990) J. Mol. Biol. 214, 803–805
23. Goto, Y., Calciano, L. J., and Fink, A. L. (1990) Proc. Natl. Acad. Sci. USA 87, 573–577
24. Goto, Y., Takahashi, N, and Fink, A. L. (1990) Biochemistry 29, 3480–3488
25. Uversky, V. N., Karnoup, A. S., Segel, D. J., Seshadri, S., Doniach, S., and Fink, A. L. (1998) J.
Mol. Biol. 278, 879–894
26. Buchner, J., Renner, M., Lilie, H., Hinz, H. J., Jaenicke, R., Kiefhaber, T., and Rudolph, R. (1991)
Biochemistry 30, 6922–6929
27. Lilie, H, and Buchner, J. (1995) FEBS Lett. 362, 43–46
28. Thies, M. J. W., Kammermeier, R., Richter, K., and Buchner, J. (2001) J. Mol. Biol. 309, 1077–
1085
29. Uversky, V. N., Segel, D. J., Doniach, S., and Fink, A. L. (1998) Proc. Natl. Acad. Sci. USA 95,
5480–5483
30. Dobson, C. M. (2003) Nature 426, 884–890
31. Harris, R. J., Kabakoff, B., Macchi, F. D., Shen, F. J., Kwong, M., Andya, J. D., Shire, S. J., Bjork,
N., Totpal, K., and Chen, A. B. (2001) J. Chromatogr. B: Biomed. Sci. Appl. 752, 233–245
32. Manning, M. C., Chou, D. K., Murphy, B. M., Payne, R. W., and Katayama, D. S. (2010) Pharm.
Res. 27, 544–575
33. Wang, W. (2005) Int. J. Pharm. 289, 1–30
34. Kiese, S., Papppenberger, A., Friess, W., and Mahler, H.-C. (2008) J. Pharm. Sci. 97, 4347–4366
35. Chen, S., Lau, H., Brodsky, Y., Kleemann, G. R., and Latypov, R. F. (2010) Protein Sci. 19, 1191–
1204
36. Joubert, M. K., Luo, Q., Nashed-Samuel, Y., Wypych, J., and Narhi, L. O. (2011) J. Biol. Chem.
286, 25118–25133
37. Lau, H., Pace, D., Yan, B., McGrath, T., Smallwood, S., Patel, K., Park, J., Park, S. S., and
Latypov, R. F. (2010) J. Chrom. B: Anal. Technol. Biomed. Life Sci. 878, 868–876
38. Delaglio, F., Grzesiek, S., Vuister, G. W., Zhu, G., Pfeifer, J., and Bax, A. (1995) J. Biomol. NMR
6, 277–293
39. Johnson, B. A. (2004) Methods Mol. Biol. 278, 313–352
40. Liu, D., Cocco, M. J., Rosenfeld, R., Lewis, J. K., Ren, D., Li, L., Remmele, R. L. Jr., and Brems,
D. N. (2007) Biomol NMR Assign. 1, 233-235
41. Garrett, D.S., Seok, Y.-J., Peterkofsky, A., Clore, G.M., and Gronenborn, A.M. (1997)
Biochemistry 36, 4393–4398
42. Stackhouse, N., Miller, A., and Gadgil, H. S. (2011) J. Pharm. Sci. (DOI 10.1002/jps.22710)
43. Yamaguchi, Y., Nishimura, M., Nagano, M., Yagi, H., Sasakawa, H., Uchida, K., Shitara, K., and
Kato, K. (2006) Biochim. Biophys. Acta 1760, 693-700
44. Edelman, G. M., Cunningham, B. A., Gall, W. E., Gottlieb, P. D., Rutishauser, U., and Waxdal, M.
J. (1969) Proc. Natl. Acad. Sci. USA 63, 78–85
45. Wishart, D. S., Sykes, D. B., and Richards, F. M. (1991) J. Mol. Biol. 222, 311–333
46. Tischenko, V. M., Zav’yalov, V. P., Medgyesi, G. A., Potekhin, S. A., and Privalov, P. L. (1982)
Eur. J. Biochem. 126, 517–521
47. Vermeer, A. W. P., and Norde, W. (2000) Biophys. J. 78, 394–404
48. Feige, M. J., Walter, S., and Buchner, J. (2004) J. Mol. Biol. 344, 107–118
49. Saphire, E. O., Parren, P. W., Pantophlet, R., Zwick, M. B., Morris, G. M., Rudd, P. M., Dwek, R.
A., Stanfield, R. L., Burton, D. R., and Wilson, I. A. (2001) Science 293, 1155-1159
50. Kayser, V., Chennamsetty, N., Voynov, V., Forrer, K., Helk, B., and Trout, B. L. (2011)
Biotechnol. J. 6, 38–44
14
by guest on September 8, 2018
http://ww
w.jbc.org/
Dow
nloaded from
51. Wang, X., Das, T. K., Singh, S. K., and Kumar, S. (2009) mAbs 1, 254–267
52. Rathore, A. S. (2009) Trends Biotechnol. 27, 546–553
15
by guest on September 8, 2018
http://ww
w.jbc.org/
Dow
nloaded from

TABLES TABLE 1
Fc residues that lost their native amide resonances upon pH reductiona
pH Hinge CH2 CH3b
3.5 W277c, K290 V412
c
3.1 T223
V240, F243, K248, D249, T250, L251,
M252, S254, R255, E258, T260, C261,
V263, K274, N276, W277c, Y278,
V279, D280, G281,
V282, E283, K290, E294, S298, R301,
V303, S304, L306, T307, V308, H310,
Q311, D312, W313, N315, G316,
K317, Y319, K320,
V323, A330, T335, I336, S337, A339
G341d, E345, Q347,
T366, V369, G371, S375,
D376, I377, A378, E380,
Q386,
Y391, V397, Y407,
V412c, Q418, M428,
H429, A431, L432,
H433, Y436, Q438
2.5 alle all all
a Relative to the
1H-
15N HSQC spectrum acquired at pH 4.7 (Figure 2A).
b Disappearance of native CH3 resonances at pH 3.5 and 3.1 may not necessarily reflect CH3
unfolding. It may also result from peak overlap with resonances originating from denatured
CH2. c Disappearance of the native resonance from this residue is uncertain because of peak overlap.
d This residue resides between CH2 and CH3 domains.
e Since native resonance assignments for the hinge residues were incomplete (see text),
implications of CH2/CH3 denaturation on the hinge conformation are not fully understood.
16
by guest on September 8, 2018
http://ww
w.jbc.org/
Dow
nloaded from
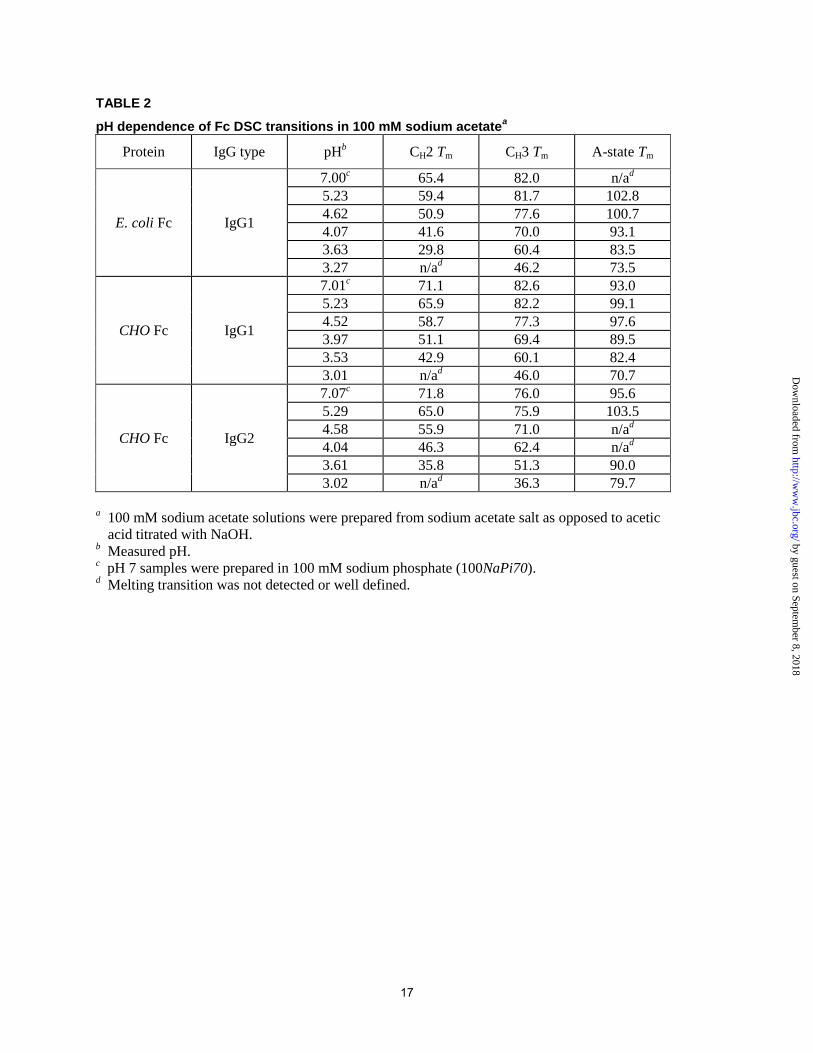
TABLE 2
pH dependence of Fc DSC transitions in 100 mM sodium acetatea
Protein IgG type pHb CH2 Tm CH3 Tm A-state Tm
E. coli Fc IgG1
7.00c 65.4 82.0 n/a
d
5.23 59.4 81.7 102.8
4.62 50.9 77.6 100.7
4.07 41.6 70.0 93.1
3.63 29.8 60.4 83.5
3.27 n/ad 46.2 73.5
CHO Fc IgG1
7.01c 71.1 82.6 93.0
5.23 65.9 82.2 99.1
4.52 58.7 77.3 97.6
3.97 51.1 69.4 89.5
3.53 42.9 60.1 82.4
3.01 n/ad 46.0 70.7
CHO Fc IgG2
7.07c 71.8 76.0 95.6
5.29 65.0 75.9 103.5
4.58 55.9 71.0 n/ad
4.04 46.3 62.4 n/ad
3.61 35.8 51.3 90.0
3.02 n/ad 36.3 79.7
a 100 mM sodium acetate solutions were prepared from sodium acetate salt as opposed to acetic
acid titrated with NaOH. b Measured pH.
c pH 7 samples were prepared in 100 mM sodium phosphate (100NaPi70).
d Melting transition was not detected or well defined.
17
by guest on September 8, 2018
http://ww
w.jbc.org/
Dow
nloaded from
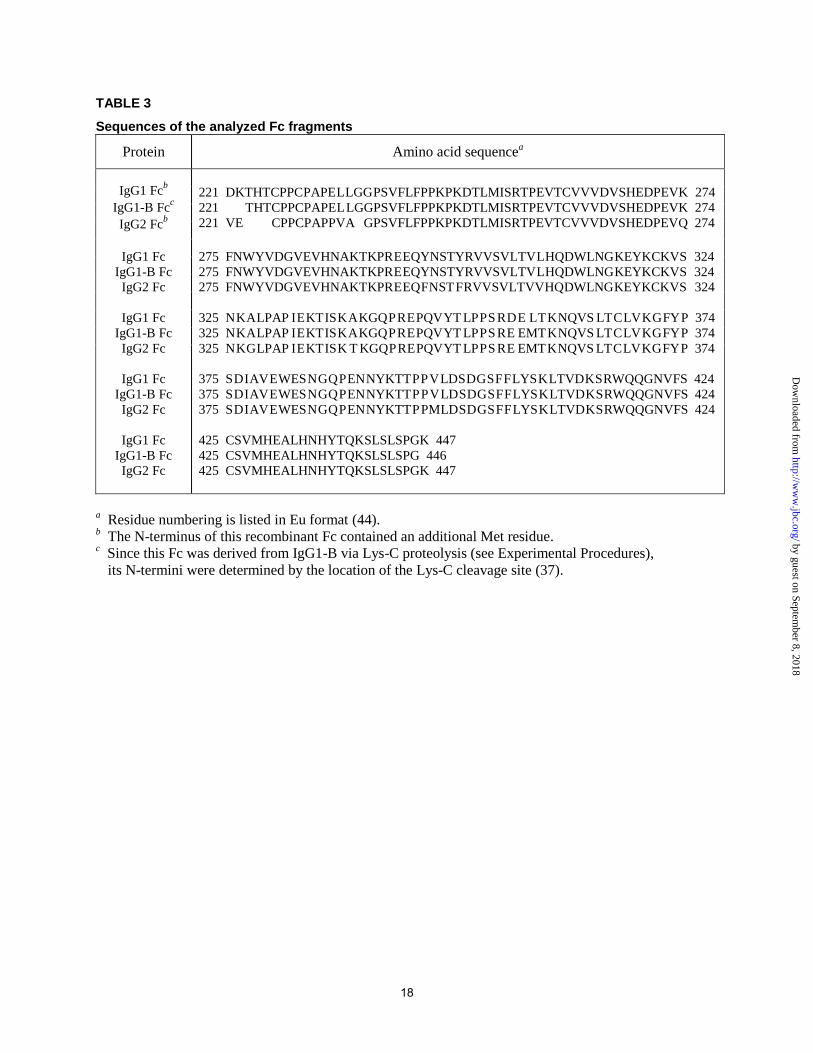
TABLE 3
Sequences of the analyzed Fc fragments
Protein Amino acid sequencea
IgG1 Fcb
IgG1-B Fcc
IgG2 Fcb
IgG1 Fc
IgG1-B Fc
IgG2 Fc
IgG1 Fc
IgG1-B Fc
IgG2 Fc
IgG1 Fc
IgG1-B Fc
IgG2 Fc
IgG1 Fc
IgG1-B Fc
IgG2 Fc
221 DKTHTCPPC PAPE L LGG PSVFLFPPKPKDTLMISRTPEVTCVVVDVSHEDPEVK 274
221 THTCPPCPAPE L LGGPSVFLFPPKPKDTLMISRTPEVTCVVVDVSHEDPEVK 274
221 VE CPPCPAPPVA GPSVFLFPPKPKDTLMISRTPEVTCVVVDVSHEDPEVQ 274
275 FNWYVDGVEVHNAKTKPR E EQYNSTYRVVSVLTV L HQDWLNG KEYKCKVS 324
275 FNWYVDGVEVHNAKTKPR E EQYNSTYRVVSVLTV L HQDWLNG KEYKCKVS 324
275 FNWYVDGVEVHNAKTKPR E EQ F NST F RVVSVLTVV HQ DWLNG KEYKCKVS 324
325 N K A LPAP I E KT IS K A KGQ P R E PQV YT LP P S R D E L T K NQVS LT C LV K G FY P 374
325 N K A LPAP I E KT IS K A KGQ P R E PQV YT LP P S R E EMT K NQVS LT C LV K G FY P 374
325 N K G LPAP I E KT IS K T KGQ P R E PQV YT LP P S R E EMT K NQVS LT C LV K G FY P 374
375 S D I AV E WES N G Q P EN NYKTT P P V LD S D G S F F LYS K LTVD K S RWQQGNVFS 424
375 S D I AV E WES N G Q P EN NYKTT P P V LD S D G S F F LYS K LTVD K S RWQQGNVFS 424
375 S D I AV E WES N G Q P EN NYKTT P PM LD S D G S F F LYS K LTVD K S RWQQGNVFS 424
425 CSVMHEALHNHYTQKSLSLSPGK 447
425 CSVMHEALHNHYTQKSLSLSPG 446
425 CSVMHEALHNHYTQKSLSLSPGK 447
a Residue numbering is listed in Eu format (44).
b The N-terminus of this recombinant Fc contained an additional Met residue.
c Since this Fc was derived from IgG1-B via Lys-C proteolysis (see Experimental Procedures),
its N-termini were determined by the location of the Lys-C cleavage site (37).
18
by guest on September 8, 2018
http://ww
w.jbc.org/
Dow
nloaded from

FIGURE LEGENDS
Figure 1. Schematic diagram of an IgG molecule. As indicated by the dashed line, an IgG structure consists of one Fc and two identical Fab regions. Thin blue lines represent intra- and inter-chain disulfide bonds. Structure of a carbohydrate unit attached to Asn297 of the CH2 domain is shown separately. Abbreviations used: LC, Light Chain; HC, Heavy Chain; G, galactose; GN, N-acetylglucosamine; F, fucose; M, mannose. Figure 2.
1H-
15N HSQC spectra of the uniformly
2H,
15N-labeled E. coli-derived IgG1 Fc at pH 4.7 (A),
3.5 (B), 3.1 (C), and 2.5 (D). The spectra were recorded at 25 °C. Figure 3. The weighted average chemical shift changes of the uniformly
2H,
15N-labeled E. coli-
derived IgG1 Fc. The graphs show residue-specific perturbations induced by a pH reduction from 4.7 to 3.5 (A) and from 3.5 to 3.1 (B). The location of the hinge region, as well as the CH2/CH3 domains is indicated in panel B. Residue numbering is listed in Eu format (44). Figure 4. Real-time aggregation of a protein mixture composed of three full-length mAbs (IgG1-A, IgG2-B, and IgG2-C) and the E. coli-derived IgG1 Fc at 30 °C. Shown are CEX overlays for samples incubated in 100A37N (A) or 100A34 (B). The green, blue, and red traces correspond to 0, 4, and 21 h time points, respectively. The black traces in (A) and (B) are the 100A52N and 100A52 controls, respectively. Protein monomers eluted between 17-39 min, whereas the majority of aggregates eluted at 41-42 min, corresponding to the column washing step with 1 M salt (see Experimental Procedures). The Fc concentration in these experiments was 1.5 mg/mL. All other proteins were at 0.5 mg/mL. Figure 5. Aggregation kinetics of a protein mixture composed of three full-length mAbs (IgG1-A, IgG2-B, and IgG2-C) and the E. coli-derived IgG1 Fc. The mixture was incubated at different pH at 30 °C in the presence of either 100 mM sodium acetate (the 100Ax buffer series to the left) or 100 mM sodium acetate with 50 mM NaCl (the 100AxN buffer series to the right). Aggregation profiles for each individual protein are shown in separate panels. Closed, gray, and open circles correspond to pH 5.2, 4.5 and 4.1, respectively (closed circles may be obscured by gray circles); triangles down and triangles up correspond to pH 3.7 and 3.4, respectively. The error bars were calculated from the standard deviation of replicate injections over several runs. Aggregation kinetics is expressed in % recovery of protein monomer relative to pH 5.2 control. The IgG1-A mAb (top panels) and the E. coli-derived IgG1 Fc (bottom panels) represented the most stable and unstable molecules in this study. Figure 6. Real-time aggregation of the E. coli-derived IgG1 Fc, CHO-derived IgG1 Fc, and CHO-derived IgG2 Fc at 30 °C. (A) CEX overlays where the pink, green, blue, and red traces correspond to 0, 2, 7.5, and 21.5 h time points in 100A35N. The black trace is pH 5.2 control. The Fc sample heterogeneteity resolved by CEX resulted in appearance of many minor species. The CHO-derived IgG2 Fc species eluted between 16-23 min, whereas the CHO- and E. coli-derived IgG1 Fc species eluted between 23-29 min and 29-34 min, respectively (see Experimental Procedures and Supplemental Figures S1-S3 for details). Aggregation kinetics in 100A35N (B) and 100A31N (C) are expressed in % recovery of Fc monomer relative to pH 5.2 control. Closed, gray, and open circles correspond to the CHO-derived IgG1 Fc, E. coli-derived IgG1 Fc, and CHO-derived IgG2 Fc, respectively. The error bars were calculated from the standard deviation of replicate injections over several runs. The CHO-derived IgG1 Fc represented the most stable Fc in these experiments. Figure 7. Real-time aggregation of glycosylated (Peak 1), partially deglycosylated (Peak 2), and fully deglycosylated (Peak 3) IgG1-B Fc in 100A31N at 30 °C. (A) CEX overlays where the green, blue, and red traces correspond to 0, 2.5, and 4.5 h time points, respectively. The black trace is pH 5.2 control. (B) Aggregation kinetics expressed in % recovery of Fc monomer relative to pH 5.2 control. The error bars were calculated from the standard deviation of replicate injections over several runs. Figure 8. DSC thermograms of the E. coli-derived IgG1 Fc, CHO-derived IgG1 Fc, and CHO-derived IgG2 Fc in 100NaPi70 (A), 100A52 (B), 100A45 (C), 100A40 (D), 100A35 (E), and 100A30 (F).
19
by guest on September 8, 2018
http://ww
w.jbc.org/
Dow
nloaded from

Experimentally measured pH of these samples is listed in Table 2. Note that in panel F the E. coli-derived IgG1 Fc was at pH 3.3, whereas both of the CHO-derived Fc were at pH 3.0. Figure 9. Apparent Tm versus pH profiles for the E. coli-derived IgG1 Fc, CHO-derived IgG1 Fc, and CHO-derived IgG2 Fc. (A) An overlay of the E. coli-derived IgG1 Fc (black symbols and solid lines) and CHO-derived IgG1 Fc (open symbols and dashed lines). (B) An overlay of the CHO-derived IgG2 Fc (gray symbols and solid lines) and CHO-derived IgG1 Fc (open symbols and dashed lines). (C) An overlay of the E. coli-derived IgG1 Fc (black symbols and solid lines) and CHO-derived IgG2 Fc (gray symbols and solid lines). Circles, triangles, and squares correspond to the CH2, CH3, and A-state transitions, respectively. Figure 10. Ribbon diagrams of IgG1 Fc (PDB entry 1HZH (49)) illustrating the location of structural perturbations at pH 3.5 (A, B) and 3.1 (C, D). In all cases the hinge region is on the top, and the CH3 domains are at the bottom. In B and D the molecule is rotated by 90° along the vertical axis parallel to the plane of the page. Unperturbed residue positions for which resonance data is available are colored blue. Residues colored red undergo weighted average chemical shift changes equal or exceeding 0.05 ppm (see the text and Figure 3). Positions colored magenta correspond to residues that lost their native resonances (see the text and Table 1). Residue positions for which resonance data is not available are shown in gray. The figures were generated using PyMOL (DeLano Scientific LLC, South San Francisco, CA).
20
by guest on September 8, 2018
http://ww
w.jbc.org/
Dow
nloaded from

VH
CH 1
VL
CL
CH 2
CH 3
N297
hinge
Fab
Fc
N297 — GN — GN — MM — GN — G
M — GN — GF
N297
Fab
Figure 1
LCLCHCHC
21
by guest on September 8, 2018
http://ww
w.jbc.org/
Dow
nloaded from

1H Chemical Shift (ppm)
15N C
hem
ical
Shi
ft (p
pm)
7 8 910
107
112
117
122
127
132 7 8 910
107
112
117
122
127
132
7 8 910
107
112
117
122
127
132 7 8 910
107
112
117
122
127
132
A B
C D
Figure 222
by guest on September 8, 2018
http://ww
w.jbc.org/
Dow
nloaded from

220 260 300 340 380 4200.0
0.1
0.2
220 260 300 340 380 420
Wei
ghte
d Av
erag
e C
hem
ical
Shi
ft C
hang
e (p
pm)
0.0
0.1
0.2
Residue Number
pH 3.5-4.7
pH 3.1-3.5
A
B
Residue Number
Figure 3
Hinge CH2 CH3
23
by guest on September 8, 2018
http://ww
w.jbc.org/
Dow
nloaded from

Figure 4
Elution time, min
18 21 24 27 30 33 36 41 42
UV
Abs
(280
nm
)
0
10
20
30
40
50
60
70BElution time, min
18 21 24 27 30 33 36 41 42
UV
Abs
(280
nm
)
0
10
20
30
40
50
60
70A
AggregatesE. coli IgG1 FcIgG2-C
IgG2-B
IgG1-A
AggregatesE. coli IgG1 Fc
IgG2-CIgG2-B
IgG1-A
24
by guest on September 8, 2018
http://ww
w.jbc.org/
Dow
nloaded from

Figure 5
IgG2-B in 100Ax
Time, h
0 20 40 60 80 100 120
% s
olub
le m
onom
er
0
20
40
60
80
100
IgG2-B in 100AxN
Time, h
0 20 40 60 80 100 120
% s
olub
le m
onom
er
0
20
40
60
80
100
B
IgG2-C in 100Ax
Time, h
0 20 40 60 80 100 120
% s
olub
le m
onom
er
0
20
40
60
80
100
IgG2-C in 100AxN
Time, h
0 20 40 60 80 100 120
% s
olub
le m
onom
er
0
20
40
60
80
100
C
IgG1 Fc (E. coli) in 100Ax
Time, h
0 20 40 60 80 100 120
% s
olub
le m
onom
er
0
20
40
60
80
100
IgG1 Fc (E. coli) in 100AxN
Time, h
0 20 40 60 80 100 120
% s
olub
le m
onom
er
0
20
40
60
80
100
D
IgG1-A in 100Ax
Time, h
0 20 40 60 80 100 120
% s
olub
le m
onom
er
0
20
40
60
80
100
IgG1-A in 100AxN
Time, h
0 20 40 60 80 100 120
% s
olub
le m
onom
er
0
20
40
60
80
100
A
F
G
H
E
25
by guest on September 8, 2018
http://ww
w.jbc.org/
Dow
nloaded from
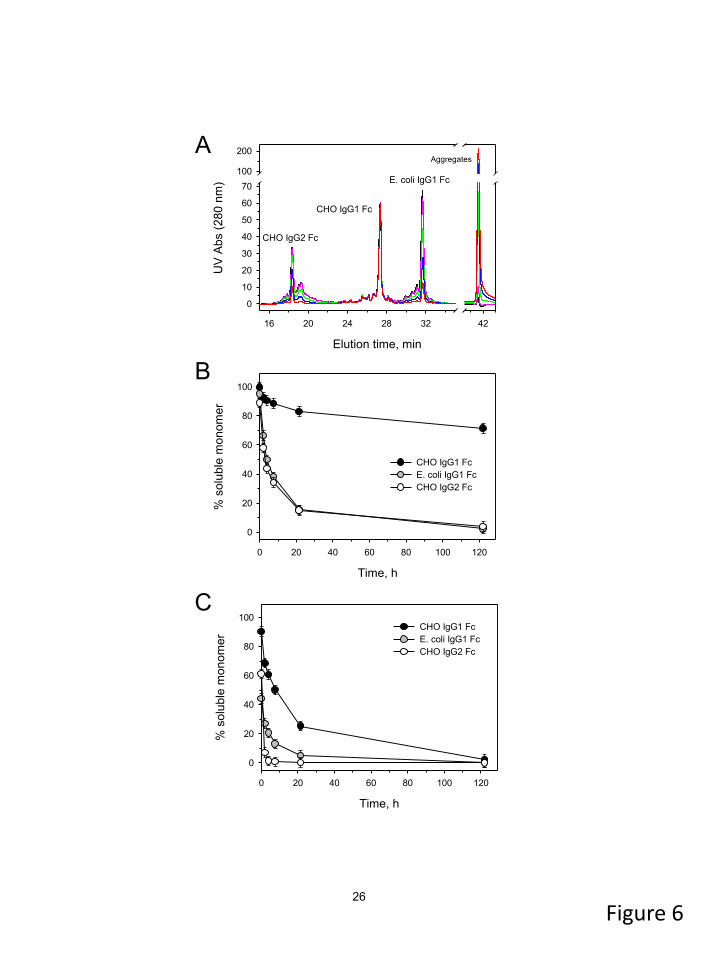
Figure 6
Time, h
0 20 40 60 80 100 120
% s
olub
le m
onom
er
0
20
40
60
80
100
CHO IgG1 FcE. coli IgG1 FcCHO IgG2 Fc
Time, h
0 20 40 60 80 100 120
% s
olub
le m
onom
er
0
20
40
60
80
100CHO IgG1 FcE. coli IgG1 FcCHO IgG2 Fc
B
C
Elution time, min
16 20 24 28 32 42
UV
Abs
(280
nm
)
0
10
20
30
40
50
60
70100
200AAggregates
E. coli IgG1 Fc
CHO IgG1 Fc
CHO IgG2 Fc
26
by guest on September 8, 2018
http://ww
w.jbc.org/
Dow
nloaded from

Figure 7
Elution time, min
28 29 30 31 32 33 34 41 42 43 44 45
UV
Abs
(280
nm
)
0
10
20
30
40
50A
Time, h
0 10 20 30 40 50
% s
olub
le m
onom
er
0
20
40
60
80
100 Peak 1Peak 2Peak 3
B
Aggregates
Peak 3
Peak 2
Peak 1
27
by guest on September 8, 2018
http://ww
w.jbc.org/
Dow
nloaded from

Figure 8
Temperature, oC
20 40 60 80 100
Cp
(kca
l / m
ol o C
)
0
25
50
75
Temperature, oC
20 40 60 80 100
Cp
(kca
l / m
ol o C
)
0
20
40
60B
Temperature, oC
20 40 60 80 100
Cp
(kca
l / m
ol o C
)
0
25
50
75
Temperature, oC
20 40 60 80 100
Cp
(kca
l / m
ol o C
)
0
20
40
60C
Temperature, oC
20 40 60 80 100
Cp
(kca
l / m
ol o C
)
0
25
50
75
Temperature, oC
20 40 60 80 100
Cp
(kca
l / m
ol o C
)
0
20
40
60A
E
F
DE. coli IgG1 Fc
CHO IgG1 Fc
CHO IgG2 Fc
E. coli IgG1 Fc
CHO IgG1 Fc
CHO IgG2 Fc
E. coli IgG1 Fc
CHO IgG1 Fc
CHO IgG2 Fc
E. coli IgG1 Fc
CHO IgG1 Fc
CHO IgG2 Fc
E. coli IgG1 Fc
CHO IgG1 Fc
CHO IgG2 Fc
E. coli IgG1 Fc
CHO IgG1 Fc
CHO IgG2 Fc
28
by guest on September 8, 2018
http://ww
w.jbc.org/
Dow
nloaded from

Figure 9
pH
3 4 5 6 7
T m, o C
10
30
50
70
90
110
CH2 (CHO IgG1 Fc)CH3 (CHO IgG1 Fc)A-state (CHO IgG1 Fc)CH2 (E. coli IgG1 Fc)CH3 (E. coli IgG1 Fc)A-state (E. coli IgG1 Fc)
pH
3 4 5 6 7
T m, o C
10
30
50
70
90
110
CH2 (CHO IgG1 Fc)CH3 (CHO IgG1 Fc)A-state (CHO IgG1 Fc)CH2 (CHO IgG2 Fc)CH3 (CHO IgG2 Fc)A-state (CHO IgG2 Fc)
A
B
pH
3 4 5 6 7
T m, o C
10
30
50
70
90
110
CH2 (E. coli IgG1 Fc)CH3 (E. coli IgG1 Fc)A-state (E. coli IgG1 Fc)CH2 (CHO IgG2 Fc)CH3 (CHO IgG2 Fc)A-state (CHO IgG2 Fc)
C
29
by guest on September 8, 2018
http://ww
w.jbc.org/
Dow
nloaded from

A
B
C
D
Figure 10
30
by guest on September 8, 2018
http://ww
w.jbc.org/
Dow
nloaded from

Ramil F. Latypov, Sabine Hogan, Hollis Lau, Himanshu Gadgil and Dingjiang LiuIgG1 and IgG2 Fc
Elucidation of acid-induced unfolding and aggregation of human immunoglobulin
published online November 14, 2011J. Biol. Chem.
10.1074/jbc.M111.297697Access the most updated version of this article at doi:
Alerts:
When a correction for this article is posted•
When this article is cited•
to choose from all of JBC's e-mail alertsClick here
Supplemental material:
http://www.jbc.org/content/suppl/2011/11/14/M111.297697.DC1
by guest on September 8, 2018
http://ww
w.jbc.org/
Dow
nloaded from