
LOW PERMEABILITY CONCRETE FOR BRIDGE DECK · PDF fileLOW PERMEABILITY CONCRETE FOR BRIDGE DECK...
47
LOW PERMEABILITY CONCRETE FOR BRIDGE DECK OVERLAY FINAL REPORT MlR-89-1 JULY 1993 Highway Division o Iowa Department '!;; of Transportation
Transcript of LOW PERMEABILITY CONCRETE FOR BRIDGE DECK · PDF fileLOW PERMEABILITY CONCRETE FOR BRIDGE DECK...

LOW PERMEABILITY CONCRETEFOR
BRIDGE DECK OVERLAY
FINAL REPORTMlR-89-1
JULY 1993
Highway Division
o Iowa Department'!;; of Transportation

.~...~ ...~...~.~~~
Low Permeability Concretefor Bridge Deck overlay
Final ReportMLR-89-1
By
Robert F. steffesAssistant to the Research Engineer
515-239-1392Office of Materials
Highway DivisionIowa Department of Transportation
Ames, Iowa 50010
July 1993
1. REPORT NO.
MLR-89-I
3. TITLE AND SUBTITLE
TECHNICAL REPORT TITLE PAGE
2. REPORT DATE
July 1993
4. TYPE OF REPORT &PERIOD COVERED
Low Permeability Concrete forBridge Deck Overlay
5. AUTHOR(S) 6.
Robert F. SteffesAssistant to the Research Engineer
Final Report 4-89 to 7-93
PERFORMING ORGANIZATION ADDRESS
Iowa Department of TransportationMaterials Department800 Li nco1n WayAmes, Iowa 50010
7. ACKNOWLEDGEMENT OF COOPERATING ORGANIZATIONS
8. ABSTRACT
The penetration of chloride-ions from deicing salts into the portlandcement concrete of bridge decks can cause corrosion and serious damageto the reinforcing steel. Concrete properties which prevent chloridepenetration into the bridge deck and provide a good structural andeconomic wearing surface are desirable. A variety of mix designs havebeen tried in the past in search of improved performance and lowercosts for bridge deck overlay concrete. Agroup of mixes with variousdesigns have been tested in this project and results are beingcompared to determine which concrete mix appears to be the most costeffective and resistant to chloride penetration for bridge deckoverlay use.
9. KEY WORDS
Concrete, permeabilityChloride, bridge deck
10. NO. OF PAGES
43

TABLE OF CONTENTS
Page
Introduction .
Objective ..
Scope ..
..............................
.. .. .. .. .. .. .. .. .. .. .. .. .. .. ..
1
2
3
Lab Procedures .••..•.•.••.. .............................................................. 3
Mater ials ~ .. .. .. .. .. .. .. .. .. .. .. .. .. .. .. .. .. .. .. .. .. 3Mixes.. .. .. .. .. .. .. .. .. .. .. .. .. .. .. .. .. .. .. .. .. .. .. .. .. .. .. .. .. .. .. .. .. .. .. .. .. .. .. .. .. .. .. .. .. .. .. .. 4
Testing .. ........................ 5
90-Day Salt Ponding Test............................. 5Rapid Determination Chloride Permeability Test....... 5Other Tests.................................................................................... 6
Material Cost Estimates •••.••..•.•..•.. ...................................... 6
Test Results . ...................................................... 8
Observations .. .............................. 13
Discussion of Results . .................. 14
Chloride Test .90-Day Salt PondingRapid Determination
Test . .................. 1415
Conclusions ..•...
Recommendations •.
.............................................................................
16
18
Acknowledgements ..•...•.......•...•... ................................ 18
References .
Appendices
.......................................................... 19
Appendix AAppendix BAppendix CAppendix DAppendix EAppendix F
Properties of Concrete Mixes Used ....•..Coarse Aggregate Gradations for Mixes .•.Test Results ..AASHTO T 259-80 .AASHTO T 260-84 •..•....•.......•....•...AASHTO T 277-89 .
DISCLAIMER
202224283139
The contents of this report reflectthe views of the author and do notnecessarily reflect the officialviews of the Iowa Department ofTransportation. This report doesnot constitute any standard,specification or regulation.

1
INTRODUCTION
A major problem facing the Iowa highway industry is the chloride
ion penetration of bridge decks. Chloride-ions, from the deicing
salts used for snow and ice removal, penetrate the bridge deck
concrete and corrode the reinforcing steel. As steel corrodes,
it expands and exerts stresses on the surrounding concrete. When
the stresses exceed the strength of the concrete, cracks and
delaminations form. Deterioration and spalling on bridge deck
surfaces result from the cracks and delaminations.
If the reinforcing steel is protected by low permeability
concrete and is not exposed to excessive chloride-ions, the steel
may not corrode for a long period of time and the bridge deck
will remain sound. Only when the chloride-ion content of the
concrete exceeds the threshold value at the reinforcing steel,
which is considered to be 1.5 pounds of chloride-ions per cubic
yard of cement, is corrosion of the steel expected to occur.
Many different techniques to prevent corrosion of the reinforcing
steel are being used. Galvanized reinforcing steel has been
used. Epoxy coated steel is being used and is quite effective at
resisting corrosion. The drawback with epoxy coated steel is
that if the epoxy coating gets chipped off or cracks or has
holidays (pinholes), the steel is no longer totally protected.
Non-corrosive deicers and corrosion inhibited salts are
available, but are considered quite expensive for use in the

2
field. A calcium nitrite additive can be used in concrete as a
corrosion inhibiter, but it is also expensive. Cathodic
protection, in which a metal net is placed within the bridge deck
and electrically prevents the corrosion process, is also being
used. A major drawback it has is that it needs continual
monitoring and has electrical power requirements, making it
somewhat impractical for some applications.
A possible solution to reduce chloride contamination is the use
of admixtures such as latex, fly ash and silica fume in the
portland cement concrete. These admixtures can reduce concrete
permeability to chloride-ions and, thereby, delay or prevent
corrosion of reinforcing steel. By experimenting with these
admixtures along with the accepted "Iowa Dense" overlay mix
design, we may be able to develop a low water/cement ratio
concrete which would provide an improvement in resistance to
penetration of chloride-ions. A concrete mix design for bridge
deck overlays with lower permeability to chlorides and low drying
shrinkage may prove to be economically viable in spite of the
high cost of some of the admixtures used.
OBJECTIVE
The objective of this project is to evaluate a variety of low
permeability concrete mix designs which have the potential to
minimize chloride penetration for bridge deck overlays.
3
SCOPE
The scope of this project is to evaluate 10 concrete overlay mix
designs covering the use of 4 different materials in various
proportions to obtain permeability reduction. The 10 mixtures,
including one standard 0-4 mix and one D-57 mix, were evaluated
by the AASHTO T 277-89, "Rapid Determination of the permeability
of Portland Cement Concrete" (3) test for 90 days. Additional
tests (AASHTO T 277-89) were performed at 180 and 360 days on the
mixes to observe a longer term development of permeability
reduction in the concrete. The 10 mixtures were tested by salt
ponding for 90 days as per AASHTO T 259-80, "Resistance of
Concrete to Chloride-Ion Penetration," (1) and AASHTO T 260-84,
"Sampling and Testing for Total Chloride-Ion in Concrete and
Concrete Raw Materials," (2) to obtain chloride content from the
salt ponding. Drying shrinkage was monitored up to 180 days to
determine any reduction in shrinkage achieved through these mix
designs. Compression tests were also performed on each of the 10
mixes to evaluate the variations in strength from the different
materials added to the concrete.
LAB PROCEDURES
Materials
1. Portland Cement: Type I, a lab blend of eight differentportland cement sources.
2. Class F Fly Ash:Clinton Fly Ash, Clinton, IA
3. Fine Aggregate:Mississippi River Sand, Cordova, IL
4. Coarse Aggregate:Martin-Marietta Limestone, Fort Dodge, IACoarse aggregate gradations are given in Appendix B

4
5. Water:city of Ames
6. Silica Fume:Force 10,000, W.R. Grace and Co.
7. Latex:Modifier A., Dow Chemical Co.
8. Air Entraining Agent:Ad-Aire Naturalized vinsol resin, single strengthCarter-Waters
9. Water Reducing Admixture:WRDA 82, W. R. Grace and Co.
10. Super Water Reducer:Daracem 100, W. R. Grace and Co.
Mixes
BRIDGE OVERLAY MIX PROPORTIONS
Mix Type Cement Fly Ash Latex Sil ica Fume AddNo. of Mix lbs/yd 3 Modifications Ibs/vd? gal/yd 3 lbs/yd 3 mix
1 D-57 710 Standard
2 0-4 823 IA Dense WR
3 D-57/w Latex 710 Latex 13.21n gal/SK
4 D-57/w Latex 710 Latex 26.423~ gal/SK
5 D-57-F 497 Fly Ash 266 WR30% F
6 D-57/W Si1ica 710 Sil ica Fume 71 SWR10%
7 0-4/w Latex 823 Latex 15.3n gal/SK
8 D-57-F/w Latex 497 Fly Ash 30% F 266 13.21 WRLatex n gal /SK
9 C-4/w Silica 624 Sil ica Fume 71 SWR11.3
10 D-57-F/w Sil ica 639 Fly Ash 10% F 89 71 SWRSilica Fume 10%
The slump and air data is given in Appendix C1.

5
From each mix:
Prepare two salt ponding slabs 12" x 12" x 4" and carry out 90day tests according to AASHTO T 259-80
Prepare one 4" x 8" cylinder for 90, 180 and 360 day RapidDetermination of the Chloride Permeability according to AASHTO T277-83.
Prepare three 4\" x 9" cylinders for compressive strength testsat 28 days according to AASHTO T 22-82.
Prepare one 4" cube for base chloride testing.
Prepare two 4" x 4" x 18" beams to measure drying shrinkage up to180 days.
TESTING
gO-Day Salt Ponding Test
For each mix, two 12" x 12" x 2" ponding slabs and a 4" cube were
made. Each slab was made and tested in accordance with the
requirements of AASHTO T 259-80, "Resistance of Concrete to
Chloride-Ion Penetration." After the procedures in AASHTO T 259-
80 were completed, three holes were drilled in each slab and in
the cube. At each hole, powdered concrete samples were taken
from depths of 1/16" to 1/2", 1/2" to 1", and 1" to 1 1/2" to
determine the chloride content by AASHTO T 260-84, "sampling and
Testing for Total Ion in Concrete and Concrete Raw Materials."
Rapid Determination Chloride permeability Test
Two 6" x 6" x 20" beams were made for each mix. Four-inch
diameter cores were drilled from each beam and sawed to two-inch
high specimens. Each core was then transferred to a moisture
room at a 100% humidity and at 73°F ± 30. After a 90 day curing
period, the cores were taken out of the moisture room. They were
then prepared for and tested in accordance with AASHTO T 277-89,

6
"Rapid Determination of the Chloride Permeability of Portland
Cement Concrete." This test was performed at 90, 180 and 360
days on each mix to observe a long term development of
permeability reduction in the concrete.
other Tests
Each mix was measured for its shrinkage and loss of weight during
curing. The 28-day compression strength test was also performed
in accordance to AASHTO T 22-82, "compressive strength of
Cylindrical Concrete Specimens."
MATERIAL COST ESTIMATES
The following material costs are based upon estimated industry
averages. The objective of the cost evaluations is to determine
the overall differences in material costs per cubic yard of
concrete or the total difference in costs between some mixes for
a hypothetical bridge deck.
TABLE 1Material Costs
(Estimated Industry Averages)
CementFly AshFine AggregateCoarse Aggregate
Modifier A LatexSilica Fume SlurryWRDA 82Daracem 100A<hAire
$65/ton$13/ton$5.10/ton$8.95/ton
$4.25/gal$2.60/gal$3.70/gal$5.25/gal$2.20/gal

7
TABLE 2Cost comparison of Mixes
Materialtvd3 Costtvd3
Mix #1 0-57CementC AggF AggAd Aire
710140414040.53
lbslbslbsoz (0.07 oz/94 lbs cement)
$23.086.283.580.01
$32.95
Mix #2 0-4CementC AggF AggAd AireWR
823 lbs1404 lbs1404 lbs2.62 oz (0.3
24.6 ozOZ/94 lbs cement)
$26.756.283.580.050.71
$37.37
Mix #3
Mix #4
0-57 with LatexCement 710 lbsC Agg 1404 lbsF Agg 1404 lbsLatex 13.21 gal (1.75 gal/94 lbs cement)
0-57 With LatexCement 710 lbsC Agg 1404 lbsF Agg 1404 lbsLatex 26.42 gal (3.5 gal/94 lbs cement)
$23.086.283.58
56.14$89.08
$23.086.283.58
112.29$145.23
Mix #5 0-57 with Fly AshCement 497 lbsC Agg 1404 lbsF Agg 1404 lbsFly Ash 266 lbsAd Aire 9.06 oz (1.2 oZ/94 lbs cement)WR 21. 3 oz
$16.156.283.581. 730.160.62
$28.52
Mix #6 0-57 With silica FumeCement 710 lbsC Agg 1404 lbsF Agg 1404 lbsSilica Fume 71 lbsAd Aire 9.06 oz (1.2 oz/94 lbs cement)SWR 99.4 oz
$23.086.283.58
33.560.164.08
$70.74

Mix #7
Mix #8
Mix #9
8
0-4 with LatexCement 823 lbsC Agg 1404 lbsF Agg 1404 lbsLatex 15.3 gal
0-57 With Fly Ash and LatexCement 497 lbsC Agg 1404 lbsF Agg 1404 lbsFly Ash 266 lbsLatex 13.21 galWR 21.3 OZ
C-4 with Silica FumeCement 624 lbsC Agg 1404 lbsF Agg 1404 lbssilica Fume 71 lbsAd Aire 7.9 OZ
$ 26.756.283.58
65.03$101. 64
$16.156.283.581. 73
56.140.62
$84.50
$20.286.283.58
33.560.14
$67.42
Mix #10 0-57 with Fly Ash and silica FumeCement 639 lbsC Agg 1404 lbsF Agg 1404 lbsFly Ash 89 lbssilica Fume 71 lbsAd Aire 12.2 oz (1.8 ozj94 lbs cement)SWR 99.4 OZ
TEST RESULTS
Test results are shown in the following figures:
$20.776.283.580.58
33.560.214.08
$69.06
Figure 1 -
Figure 2 -
Figure 3 -
Figure 4 -
Rapid Determination of the Chloride Permeability ofConcrete, AASHTO 277-89
Resistance of Concrete to Chloride-Ion penetration,AASHTO T 259-80
compressive strength of Cylindrical Concretespecimens, AASHTO T 22-82
Drying Shrinkage of 18" Beams at 180 Days

Rapid Determination of the Chloride Permeabilityof Concrete, AASHTO 277-89
2.500 ••.••••..•....•...•••..••...•••...•...••..•.•....••...•...•......•.......••....•...••........•....•...........
11190 Days 1lS1 180 Days 1m 360 Days IeY
~'b~~
~t()()()~········~········~······························ .•....•....•....•.........•...•.............•....•........•
co,4eY
...p
,4eY
4.,tf....peY
~V" __Htt-- ~fb~
...~ •••..••...••...••..••....•...•...•..~ ..•...•••..•.....•...•.......••...•....•
..••......................•.................................•.......•.........•...•...
..· ··.~I ·~~· · ·· · · .
O I ""I ""l"1 ... ", "'"Ii
500-······
-•e~IIi 1.5000.E.:;.fnE1.000...······o:iS
1 2 3 4 5 6 7 8 9 10Mix Number
Figure 1
"E~12e-.0:JU10LCDQ.
~ 8c:JoQ.
..: 6c.!c<3 4-··· ..
CD"0't:o-.s:.o
01
Resistance of Concrete to Chloride-IonPenetration, AASHTO T 259-80
.•••.......•••......•.•........•..........
......•.••.......••............
...........
1 2 3 4 5 6 7 8 9 10Mix Number
Figure 2
~
o

Compression Strength of Cylindrical ConcreteSpeclmenl, AASHTO T 22-82
~
~
2 3 4 5 6 7 8 9 10 11Mix NumberRgure 3
10,000
9,000
8,000-(IIQ..s: 7,000-CJ)
5; 6,000So.-(I)c 5,0000-=4,000II»So.Q.E 3,0000
02,000
1,000
0 • .0 1

12
.. • · ·· ·,... · ··• ·· 0Q ·· · ·· .....·· ·0 · ·· ·· ·· ·· ·CD · ·· ·· ·... ·· ··· ··.... · ·· ·• · 00· ·· ·· · ·· ·.. · · ··· · ·E · ·· ·· · I'· ·• · · ·· ·· ·• · ·· · I-m · ·· CD· · .q-· · co..o· · ·• · · · E· E• · · ·CD · · :.1· · · ·· · · % :.1· · ·... · · 01· · · LO· · · x ti:· ·... · · · -· · · :::IE· ·0 · · ·· ·· ·· ·• · · · .q-· ·· ·· ·ell · · ·· · ·• · · ·· · · ·· ·-'II: · ·· · · ·· · ·I:: · · ·· · · ·· · ·.- · · · ·.. · · ·· ·.-:•ellI:: ......-,.....
Q
0 0 0 0~
0 0 0 000 I' co LO I"') N ..... 00 0 0 0 0 0 0 0 00 0 0 0 0 0 0 0 0
• • • • • • • • •0 0 0 0 0 0 0 0 0
s840ul '4~6u81 ul 86D>lU1J4S

13
OBSERVATIONS
Some observations noted from results in Figures 1, 2, 3 and 4
were:
Figure 1 - Mixes Nos 6, 9 and 10 all have silica fume. A very
interesting observation here is that all three of the
mixes show a continuous increase in chloride
permeability with time by the AASHTO T 277-89 test.
Mix NO.8, 0-57-F with latex has the lowest chloride
permeability, being very low in all three tests done
at 90, 180 and 360 days by the AASHTO T 277-89 test.
Mixes Nos 1 and 2, the 0-57 standard and the 0-4 IA
dense, respectively, showed the highest chloride
permeability by the AASHTO T 277 test.
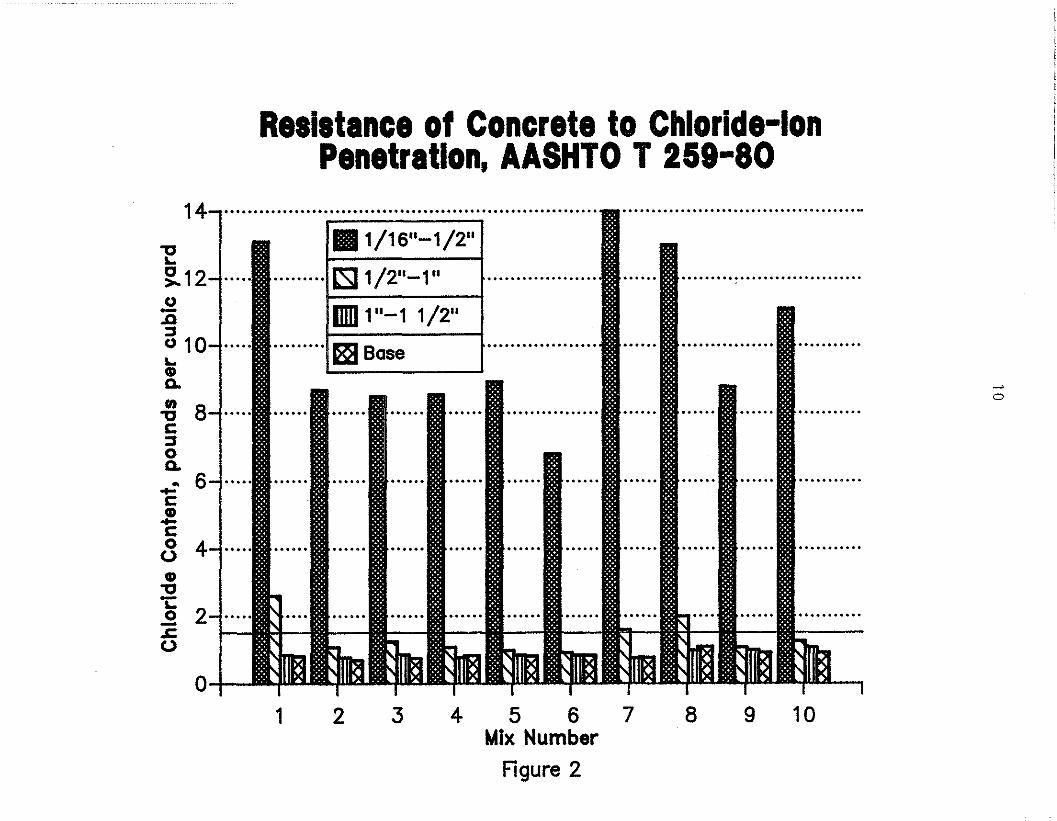
Figure 2 - Mix No.6, 0-57 with 10% silica fume has the lowest
overall percent chloride content by the AASHTO T 259
90-day salt ponding test.
Mix No.8, 0-57-F with latex has nearly the highest
overall chloride content by the AASHTO T 259 test.
The opposite indication was given by the AASHTO T 277
test.

14
There is not a consistent correlation of permeability
to chlorides or chloride contents between the two test
methods used for many mixes in this test.
Figure 3 - The three mixes with silica fume, No.6, 9 and 10, had
the highest values for compressive strength.
Mix No.5, 0-57-F, with 30% fly ash and 497 lbs/yd'
cement has the lowest 28-day compressive strength.
Although comparatively the lowest, it still had the
fairly high value of 5540 psi.
Figure 4 - Mix No.2, 0-4 IA dense, showed the highest amount of
shrinkage being 0.008 in. Mix NO.4, 0-57 with latex,
had the lowest amount of shrinkage, being 0.002 in.
From Table 2, the No. 2 mix, which is the commonly
used 0-4 Iowa dense, has a material cost of
$37.37/yd'. Mix No.5, 0-57-F, has the lowest
materials cost of $28.52/yd'. This cost is 24% less
than the Iowa dense mix currently used.
DISCUSSION OF RESULTS
gO-Day Salt ponding Test
The results of the chloride-ion content 90-day salt ponding tests
are shown in Figure 2. At depths near the surface, 1/16" to

15
1/2", there were some irregular results. The 0-4 with latex mix
had the highest chloride content. The 0-57 with silica mix gave
the best results at this depth. All of the mix designs exceeded
the threshold value of 1.5 lbs chloride per cubic yard concrete
at this depth.
At the depths between 1/2" and 1" only three of the mixes
exceeded the threshold value. They were the 0-57 mix, the 0-4
with latex mix and the 0-57-F with latex mix. The 0-4 with latex
mix showed higher permeability than the 0-4 mix without latex,
and the 0-57-F with latex mix permeability was also higher than
the 0-57-F mix without latex.
At the 1" to llz11 depths, all of the mixes were below the
threshold value. The 0-4 with latex mix had the best results at
this depth, however, it had poor values above this depth.
Rapid Determination Chloride Test
From results of AASHTO T 277 test, as shown in Figure 1, the
chloride permeability of Mix Nos. 6, 9 and 10 were continuously
increasing with time. This observation of increasing
permeability should certainly be investigated further. It should
also be noted that all 3 mixes which showed the increase in
permeability with time contained silica fume and also, all three
of these mixes contained super water reducer. This raises the
question about long term effects on permeability from use of

16
silica fume and/or super water reducer. An increase in
permeability could occur, over time, if there was also some
proportional reduction in surface tension occurring, over time,
within the system of pore channels.
CONCLUSIONS
From chloride content ponding test, Mix No. 6, D~57 with silica
fume, had the lowest overall chloride content, as shown in
Figure 2. However, the results of chloride permeability tests
from AASHTO T 277-89 show continuously increasing permeability
over the time span of 1 year for all 3 mixes having silica fume.
As a result of this finding, these 3 mixes will not be proposed
for field tests in this report.
Test results from AASHTO T 277-89 show that mix No.8,
D-57-F with latex, is a good mix as it has very low permeability.
The material cost of this mix is not excessively high as only 1/2
of the prescribed amount of the expensive latex was used. The
lower cost fly ash was added to compensate for the reduced amount
of latex.
Another good mix with low permeability is mix No.5, D-57-F. It
also has the benefit of having the lowest material cost. With
some adjustments in amounts of cement and fly ash, the
compressive strength could be increased, if required, while still
maintaining a very economical mix.

17
Both of the above proposed mixes, No. 8 and No.5, have a much
lower permeability than the commonly used Iowa dense mix No.2,
as shown in Figure 1.
Previous laboratory work done to compare concrete permeability to
chloride by AASHTO T 259 and AASHTO T 277 tests gave results
which were considered to have good correlation (4). Some test
results found in this study showed chloride permeability to be
extremely low by the AASHTO T 277 test method but not low by the
AASHTO T 259 test method for the same mix design. The test
results correlation was not real good, especially in Mix No. 8
when using the two different test methods.
Based upon costs given in Tables 1 and 2, the increase in cost
for materials in Mix No. 8 which gave very low permeability
(AASHTO T 277) compared to the Iowa dense Mix No. 2 would be
$1744.00, based on a 2" overlay for a 30' x 200' bridge deck
using 37 yd' concrete.
The reduction in materials cost from use of mix No. 5 compared to
the Iowa dense mix would be $327.00 on a 30' x 200' bridge deck.
However, the main benefit from this mix would be the lower
permeability of the concrete.

18
RECOMMENDATIONS
1. Based upon indications of increasing permeability over time
for all mixes having silica fume and super water reducer,
mixes Nos. 6, 9 and 10, it is recommended to run additional
similar tests for evaluation beyond one year.
2. A bridge deck overlay using Mix NO.8, with fly ash and latex
and mix No.5, with fly ash, should be tried under a research
project and compared with Mix No.2, the Iowa dense design,
possibly all on the same bridge. The AASHTO T 277 test
indicated chloride permeability was much lower in the Mix No.
8 than in mix No.2, the Iowa dense. Compared to mix No.2,
the increase in material cost for using Mix No. 8 on a bridge
deck overlay 30' x 200' X 2", using 37 yd> would be $1744.00.
The reduction in material cost when using mix No. 5 on the
same deck should be $327.00. An additional benefit from mix
No.5, beyond the economics, would be the very low
permeability.
ACKNOWLEDGEMENTS
Appreciation is extended to the Iowa Department of
Transportation, Materials Department, especially the Materials
Laboratory, for their support in laboratory analysis. Special
appreciation also goes to Kathy Davis and Steve Juhlin for their
support in preparing this report.

19
REFERENCES
1. AASHTO T 259-80. Standard Specifications for Transportation
Materials and Methods of Sampling and Testing, The American
Association of State Highway and Transportation Officials,
Fifteenth Edition, Part II, 1990, pp 769-70.
2. AASHTO T 260-84. Standard Specifications for Transportation
Materials and Methods of Sampling and Testing, The American
Association of State Highway and Transportation Officials,
Fifteenth Edition, Part II, 1990, pp 771-77.
3. AASHTO T 277-89. Standard Specifications for Transportation
Materials and Methods of Sampling and Testing, The American
Association of State Highway and Transportation Officials,
Fifteenth Edition, Part II, 1990, pp 836-839.
4. Nash, J. L., Evaluation of Rapid Determination of the
Chloride Permeability of Portland Cement Concrete AASHTO
T 277-83, Iowa Department of Transportation, Iowa DOT Project
No. MLR-86-11, September 1987.

20
Appendix AProperties of Concrete Mixes Used
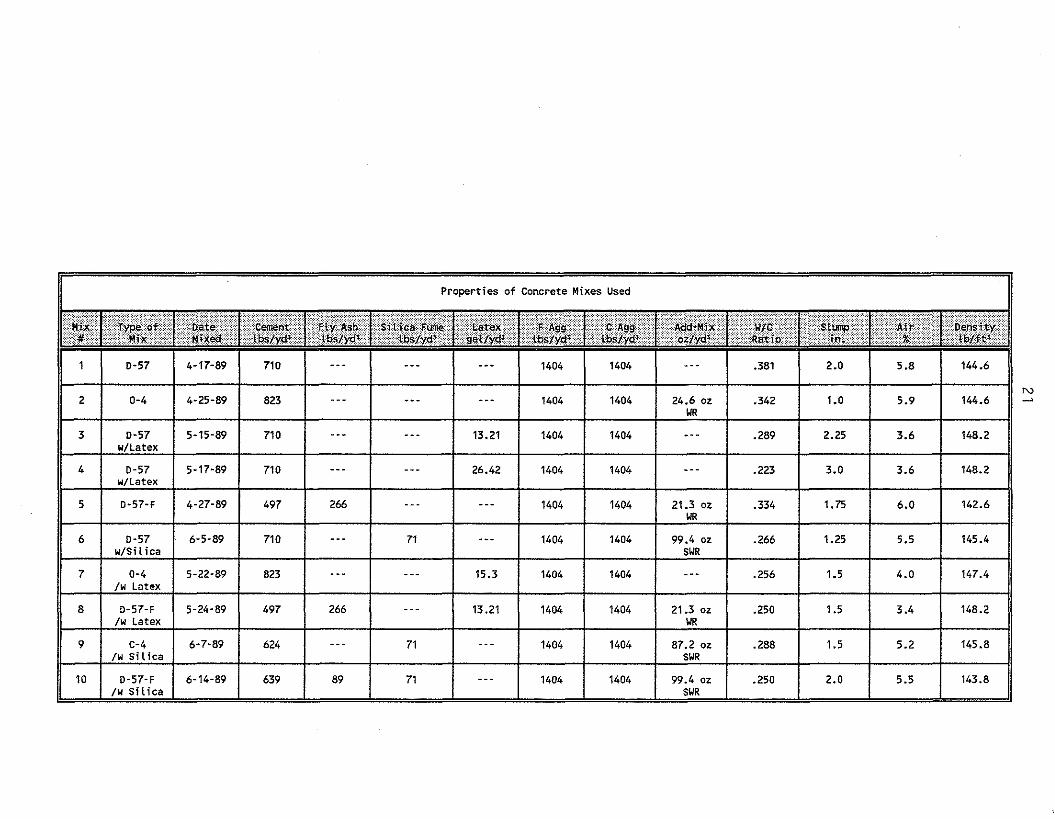
Properties of Concrete Mixes Used
0-57 I 4-17-89 I 710 I --- I --- I --- I 1404 1404 --- .381 2.0 5.8 144.6
:1 ~2 0-4 4-25-89 823 --- --- --- 1404 1404 24.6 oz _342 1.0 5.9 144.6WR
3 0-57 5-15-89 710 --- --- 13_21 1404 1404 --- .289 2.25 3.6 148.2w/Latex
4 I 0-57 5-17-89 710 --- --- 26.42 1404 1404 --- .223 3_0 3.6 148.2w/Latex
5 o-57-F 4-27-89 497 266 --- --- 1404 1404 21.3 oz .334 1.75 6.0 142.6WR
6 0-57 6-5-89 710 --- 71 --- 1404 1404 99.4 oz I .266 I 1.25 I 5.5 I 145.4w/Sil ica SWR
7 I 0-4 5-22-89 823 --- --- 15.3 1404 1404 --- .256 I 1.5 I 4.0 I 147.4Iw latex
8 I O-57-F 5-24-89 497 266 --- 13.21 1404 1404 21.3 oz .250 1.5 3.4 148.2Iw latex WR
9 I C-4 6-7-89 624 --- 71 --- 1404 1404 87.2 oz .288 1.5 5.2 145.8/w Sil ice SWR
10 I o-57-F 6-14-89 639 89 71 --- 1404 1404 99.4 oz .250 2.0 5_5 143.8/w Silica SWR

22
Appendix BCoarse Aggregate Gradations for Mixes
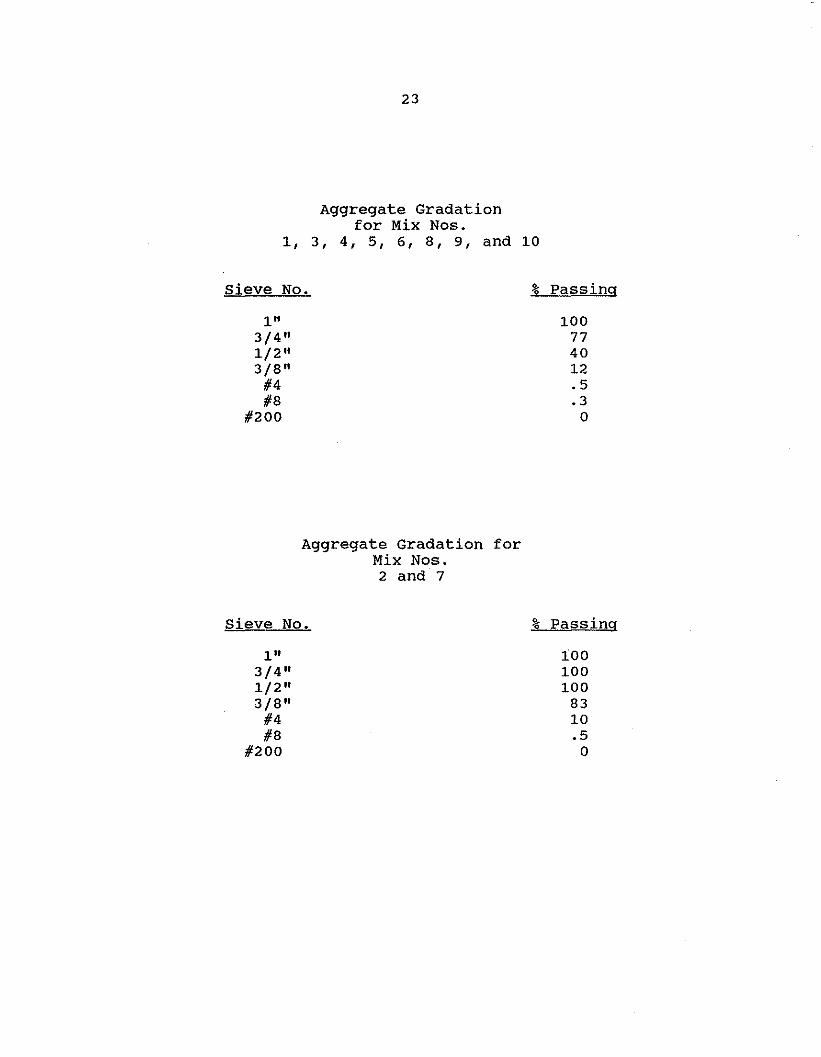
23
Aggregate Gradationfor Mix Nos.
1, 3, 4, 5, 6, 8, 9, and 10
Sieve No. % Passing
1" 1003/4" 771/2" 403/8" 12
#4 .5#8 .3
#200 0
Aggregate Gradation forMix Nos.2 and 7
Sieve No. % Passing
1" 1003/4" 1001/2" 1003/8" 83
#4 10#8 .5
#200 0

24
Appendix CTest Results
Appendix C-1 - Rapid Determination of the Chloride Permeabilityof Concrete, AASHTO 277-89
Appendix C-2 - Resistance of Concrete to Chloride-IonPenetration, AASHTO T 259-80
Appendix C-3 - Compressive strength (28 Day)and 18" Beam Drying Shrinkage (180 Day)

Appendix C-1
Rapid Determination of the Chloride Permeability of ConcreteBy AASHTO T 277-89
I0-57 .381 2.0 5.8 144.6 1190 Low 2074 Moderate 1600 I Low
2 I 0-4 .342 1.0 5.9 144.6 1600 Low 2080 Moderate 1253 I Low "Nen
I I I I I I I I I "3 0-57 .289 2.25 3.6 148.2 650 Very low 454 Very low 238 Very low/w Latex
4 I 0-57 .223 3.0 I 3.6 I 148.2 I 280 I Very Low I 173 I very Low I 86 I NegligibleIw Latex
5 0-57-F .334 1.75 6.0 142.6 345 Very Low 238 Very Low 194 Very Low
6 0-57 .266 1.25 5.5 145.4 173 Very Low 216 very low 268 Very low/w su ica
7 I 0-4 .256 1.5 I 4.0 I 147.4 I 670 I Very Low I 346 I very Low I 151 I Very Low/w Latex
8 I 0-57-F .250 1.5 I 3.4 I 148.2 I 130 I Very Low I 65 I Negl igible I 22 I Negl igible/w Latex
9 I C-4 .288 1.5 I 5.2 I 145.8 I 194 I Very Low I 216 I Very Low I 346 I Very Low/w sit tea
10 I 0-57-F I .250 I 2.0 I 5.5 I 143.8 I 151 I Very low I 173 I very Low I 194 I Very Low/w Silica

Appendix C-2
Resistance of Concrete to Chloride-Ion PenetrationAASHTO T 259-80
0-57 I .381 2 5.8 -144.6 0.347 0.069 0.023 0.021
2 I 0-4 I .342 1.0 5.9 144.6 0.230 0.029 0.021 0.018
I No-,
3 I 0-57 .289 I 2Y4 I 3.6 148.2 0.225 0.033 0.023 0.020,
Iw Latex
4 I 0-57 .223 I 3.0 I 3.6 I 148.2 I 0.226 I 0.029 I 0.021 I 0.022Iw Latex
5 0-57-F .334 1'1< 6.0 142.6 0.236 0.026 0.023 0.022.
6 0-57 .266 1.25 5.5 145.4 0.180 0.025 0.023 0.022Iw Sit ica
7 I 0-4 .256 I 1.5 I 4.0 I 147.4 I 0.370 I 0.042 I 0.020 I 0.021Iw latex
8 I 0-57-F .250 I 1.5 I 3.4 I 148.2 I 0.344 I 0.053 I 0.026 I 0.029Iw latex
9 I C-4 .288 I 1.5 I 5.2 I 145.8 I 0.232 I 0.029 I 0.027 I 0.024Iw Sit ica
10 I 0-57-F .250 I 2.0 I 5.5 I 143.8 I 0.294 I 0.033 I 0.029 I 0.024Iw Silica

Appendix C-3
Compressive Strength (28 Day)and 18" Beam Drying Shrinkage (180 Day)
1 D-57 .381 2.0 5.8 144.6 6650 .00575 9.51
2 0-4 .342 1.0 5.9 144.6 7740 .00795 10.4
3 D-57 .289 2.25 3.6 148.2 7780 .00325 5.08 II ~/w Latex
4 I D-57 .223 3.0 3.6 148.2 7360 .00210 3.00/w Latex
5 I D-57-F .334 1. 75 6.0 142.6 5540 .00475 7.71
6 I D-57 .266 1.25 5.5 145.4 8970 .00455 7.39/w Silica
7 I 0-4 I .256 I 1.5 I 4.0 I 147.4 I 7840 I .00345 I 4.83/w Latex
8 I D-57-F I .250 I 1.5 I 3.4 I 148.2 I 7450 I .00270 I 4.09/w Latex
9 I C-4 I .288 I 1.5 I 5.2 I 145.8 I 9010 I .00405 I 7.46/w Silica
10 I D-57-F I .250 I 2.0 I 5.5 I 143.8 I 8550 I .00385 I 7.50/w Silica

28
Appendix DAASHTO T 259-80

29
Standard Method ofIestfor
Resistance of Concrete to Chloride Ion Penetration
AASHTODESIGNATION: T 259-80(1990)
1.· SCOPE
1.1 .This method covers the determinationof- the resistanceof concretespeci
.mens to the penetration of chloride iOD. Itis intendedfor use in determiningtheeffects of variations in the propertiesofconcrete on the resistanceof the concreteto chloride ion penetration. Variations inthe concrete mayinclude,but are not limited to, changesin the cementtype andcontent, water-cement ratio.aggregatetype and proportions,admixtures, treatments, curing and consolidation. This testmethod is not intendedto providea quantitative measure of the lengthof servicethat maybe expected froma specific typeofconcrete.
2. TEST SPECIMENS
2.1 The specimensfor use in this testshall beslabs made and cnred in accordance with the applicable requirements ofAASIITOT 126, "Making and CuringConcreteThstSpecimens in theLaboratory:'
NOTE I-This method contemplates the useof a minimum of four specimens foreach evaluation with each slab not less than 3 inches(76 mm) thick and 12 inches (305 mm) square.
2.2 For this test the specimensshallberemoved from moistcuring at 14daysof age unlessearlier removal is recommendedby the manufacturerof a specialconcrete.The specimens shall then bestored until 28 daysof age in a dryingroom of the type specifiedby AASHTOT 160, LengthChangeof CementMortarand Concrete.
2.3 When the test method is used toevaluateconcrete treatments, the slabsshall befabricated from concretehavingacementfactorof 658 lbs (229 kg) percubic yard (0.76m3), a water-cement ratios
• •
by weight of 0.5. and an air content of6± 1 percent.
The concrete treatment shall beappliedat 21 days of age and in accordance withthe manufacturer's recommendationsforfield usage.
NOTE 2-1f field application of a sealer byspraying is recommended, the seaJershould beapplied to the specimens by spraying rather thanbrushing.
2.4 When a special overlaymaterial isto beevaluated, the concrete slab shall becast 2 inches (5I mm) thick using the mixdesign specified under Section 2.3 andthen the special overlaymaterial shall beplaced 1 inch (25 mm) thick, unless specified otherwise, according to the manufacturer's recommendations.
3. PROCEDURE
3.1 Immediately after the specifieddrying period stipulated in Section 2.2 (i.e29th day of specimen age), 0.125 ± 0.625in. (3.2 ± 1.6 mm) of the slab surfaceshall beabraded using grinding or sandblasting techniques if the concrete or treatment are to besubjected to the wearingeffect of vehicular traffic. No watershallbeused in the abrading process. If theconcrete or treatment is to beused on surfaces not subject to wear from vehiculartraffic then the abrading step shall beomitted.
3.2 Place approximately0.75 in.(19 mm) high by 0.5 in. (13 mm) widedams around the top edge of all slabsexcept one, which will then become thecontrol slab. In lieu of this, a dam meetingthese dimension requirements may becastas an integral part of the slab. However.such previouslycast dams shall not interfere with the abrasion of the surface asspecified under Section 3. I.
3.3 All slabs shall then bereturned to
the drying room as specified under Section 2.2 fur an additional 13 days (i.e nntil42 daysof age).
NOTE 3-The degree of saturation of thespecimens at the time of ponding will affectchloride ingress. In general, water saturatedconcrete will absorb significantly less chlorideduring the 90 days of ponding than a drier butsimilar material. Thus, for proper definition ofchloride ingress by this method, the requirements in Sections 2.2 and 3.1 through 3.3 (for atotal of 28 days of air drying prior to ponding)must befollowed.
3.4 The slabs with dams shall besubjected to continuouspoDding with 3-percent sodiumchloride solution to a depth ofapproximately 0.5 in. (13 mm) fur 90days. Glass plates sball be placed over thepondedsolutions to retard evaporationofthe solution. Placementof the glass platesshall not be done in such a manner that thesurface of the slab is sealed from the surroundingatmosphere. Additional solutionshall beadded if necessary to maintain the0.5 in. (13 mm) depth. All slabs shallthen bereturned to the drying room asspecifiedunder Section 2.2.
3.5 After 90 days of exposure the .solutionshall beremovedfrom the slabs.The slabs shall beallowed to dry and thenthe surfaces shall bewire brushed until allsalt crystal buildup is completelyremoved.
3.6 Samplesfor chloride ion analysisshall then be taken from all slabs inaccordance with the procedure describedin AASHTO T 260. These samples shallbeobtained from each slab at each of thefollowing depths unless otherwise directedby the specifyingagency:
0.0625 in. (1.6 mm) to 0.5 in. (13 mm)0.5 in. (13 mm) to 1.0 in. (25 mm)
The chloride contentof each sampleshall bedetermined in accordance withthe instructions in AASHTO T 260.
30
METHODS OF SAMPLING AND TESTING T259
NOTE 4-Many starter bits for use insidehollow rotary hammer pulverizing bits are significantly longer than the pulverizing bit. Thisresults in a sampling depth which is greater inthe center of the "core hole" than at the edges.To minimize this effect, the chuck end of the"starter bit should becut off such that its overalllength does not exceed that of the outside bit bymore than VI~ in. (i.e., such that the variation insamplingdepth is not greaterthan VI6 in.). Whenit isdesired to remove only V'6 in. (1.6 mm) ofmaterial fromthesurfaceof a test specimen or abridgedeck, it maybe moreconvenient to cernplete that operation by use of a grinder. Thesample can then be taken with the rotary hammer without fear of contamination from the salton the surfaceof the item beingsampled.
•
4. CALCULATIONS
4.1 The baseline chloride ion contentfor the test specimens shan bedeterminedas the average chloride ion content of samples obtained from the 0.0625 in.(1.6 mm) to 0.5 in. (13 mm) and 0.5 in.(13 mm) to 1.0 in. (25 mm) depths withinthe slab that was not ponded with 3 percent sodium chloride solution.
4.2 The absorbed chloride ion contentof eaeh sample from the ponded slabs.shall be determined as the differencebetween the total chloride ion content ofthat sample and the baseline value calculated in Section 4.1. If the result is lessthan zero, the result shall be reported as
zero. The average chloride ion absorbed ateach sampling depth shall be calculated.
5. REPORT
5.1 Reportiug shall include (I) eachtotal chloride ion value determined in Section 3.6, (2) the average and maximumbaseline chloride ion (Section 4.1), (3)each calculated absorbed chloride ionvalue determined in Section 4.2, (4) theaverage and maximum absorbed chlorideion values calculated in Section 4.2 foreach depth, (5) a statement detailingwhether or not the surface abrasiondescribed in Section 3.1 was performed.

31
Appendix EAASHTO T 260-84

32Standard Method
of
Sampling and Testing for Total Chloride Ion in Concrete and Concrete Raw Materials
AASHTO DESIGNATION: T 260-84
3.5 Distilled Water.
3. REAGENTS
N = (0.0100) (W""",,)NaJ 0.5844
= Normality of AgNO, Solution= Volume (ml) of NaCI Solution= Normality of NaCI Solution= Volume (ml) of AgNO,
.Solution
NAgNOl
VN.cJ
NNaCl
VAgNO,
3.6 Methyl orange indicator.3.7 Ethanol,denaturedor methanol,
technical.
NorE 4-Deionized water may be used inplace of distilled water for samples whereextreme precision and accuracy are notdemanded.
3.1 Concentrated HNO, (sp gr 1.42).3.2 Sodium chloride, NaCI. reagent
grade (primary standard).3.3 Standard 0.01 N NaCI solation.
Dry reagent grade NaCI in an oven at 105C. Cool, in a dessicator; weighout approximately 0.5844 to the nearest 0.0001gram, dissolve in distilled H20, and transfer to a I litre volumetric flask. Make upto the mark with distilled H20 and mix.Calculate the exact normalityas follows:
W.-.J = actual weight of NaCINNaJ = normality of NaCI solution
3.4 Standard 0.01 N AgNO,. Weigh1.7 grams of reagent AgNO" dissolve indistilledH20, filter into a 1 litre brownglass bottle, fill, and mix thoroughly.Standardize against 25.00 ml of the NaCIsolution by the titrationmethodgiven inSection5.4. Calculate the exact normalityas follows: "
NOTE 3-If equivalent filter papers areused, they should bechecked to confirm they donot contain chloride which will contaminate thesample.
2.2.3 Magneticstirrer and teflon stirring bars.
2.2.4 Burette with O.I ml graduations.
2.2.5 Balance complying with M 231.Class A.
2.2.6 Balance complying with M 231.ClassG2.
2.2.7 Hot plate, 250 to 400 Cheatingsurface temperature.
2.2.8 Glassware, 100 and 250 mlbeakers,filter funnels, stirring rods, watchglasses, dropper, wash bottles.
2.2.9 Sieve, U.S. Standard No. 50(0.300 mm).
2.2.10 Whatman No. 40 and No. 41filter papers (or equivalent).
2.2.2 A millivoltmeter compatiblewith the ion electrode.
NOTE I-Suggested electrodes are theOrion 96~17 Combination Chloride Electrode orthe Orion 94-6 Silver/Sulfide Electrode orequivalents. The Silver/Sulfide electroderequires use of an appropriate reference electrode (Orion 90-02 or equivalent).
NOTE 2-Suggested millivoltmeter is theOrion Model 701 A Digital phlmv meter orequivalent.
collect the sample from the drilled holes.2.1.2.3 A "blow ont" bulb or other
suitablemeans of removingexcess pulverizedmaterial from the hole prior tore-drilIingoperations.
2.1.2.4 A device capable of determining the location and depth of steel reinforcement to :t Ys in. (:t 3 mm).
2.2 Equipmentfor Chemical Testing2.2.1 Chloride ion or silver/sulfide
ionselectiveelectrode and manufacturerrecommended filling solutions.
1.1- This method covets proceduresfor the determinationof the total chlorideion contentor the water-soluble chlorideion content of aggregates. portlandcement, mortar or concrete.The method islimited to materialsthat do notcontainsulfides.
1.2 The age of concretemortar, orhydrated portland cement at the time ofsampling will havean affecton the watersolublechloride ioncontent. Therefore,unless early age studiesare desired, it isrecommended that the material he wellcured and at least 28 days of age heforesampling.
1.3 This Standard provides for thedeterminationof chlorideioncontentbytwo procedures:ProcedureA, Determination of Total Chloride Ion Content andWater-Soluble Chloride Ion Content byPotentiometricTitration or Ion-SelectiveElectrode and Procedure B. Total Chloride Ion by Atomie Absorption.
2.1 Equipment for two methods ofsampling arc listed in Sections 2.1.1 or2.1.2.
2.1.1 Core drill.2.1.2 Rotary impact type drill with a
depth indicatorand drill or pulverizingbits of sufficientdiameter to providearepresentative sampleof sufficientsize fortesting.
2.1.2.1 Sample containets capable ofmaintaining the samplein an uncontaminated state.
2.1.2.2 Spoons of adequate size to•
1. SCOPE
2. APPARATUS
PROCEDURE A-Total Ion andWater-Solnble Ion by PotentiometricTitration or Ion SelectiveElectrode
•

33
METHODS OF SAMPLING AND TESTING T260
4. METHOD OF SAMPLING
4.1 ConcreteSample:4.1.1 Determine the depth within the
concrete for which the chloridecontentisdesired.
NOTE 5-A convenient methodof determlning the location and depth of reinforcement barsis a pachometer capableof determining the location and depth of steel reinforcement to ± Va in.(± 3 mm).
4.1.2 CoreMethod-Drill the core tochosendepth and retrieve.
4.1.2.1 When samplesare receivedinthe laboratory in other than pulverizedcondition, the sample shall becrushed andground to a powder. AUsawingor crushing shall be done dry (l.e. withoutwater).All material shall pass a number50(0.300 mm) sieve.All pulverizing toolsand sieves shall be washedwith alcoholordistilled water and shall be dry beforeusewith each separate sample (see note Section 4.1.3.7).
4.1.3 Pulverizing Method:4.1.3.1 Set the rotary hammerdepth
indicator so that it will drill to V2 in.(13 mm) above the desired depth.
4.1.3.2 Using a drill or pulverizingbit, drill until the depth indicatorseatsitself on the concrete surface.
4.1.3.3 Thoroughly clean the drilledhole and surrounding area utilizingthe"blow out" bulb or other suitablemeans.
4.1.3.4 Reset the depth indicator topermit V, in. (13 mm) additionaldrilling.
4.1.3.5 Pulverize the concrete untilthe depth indicatoragain seats itselfon theconcrete.
NOTE 6-Care must beexercised during thispulverizing operation to prevent the drill bitfrom abrading concrete from the sides of thehole above the sampling depth. To insure againstthis, some users utilize an 0.25 in, (6 mm)smaller diameter bit in this step than that used inSection4.1.3.2.
4.1.3.6 Collect at least 10 grams ofthe material remaining in the holeusingaspoon and place in the samplecontainer.
4.1.3.7 Ifthe sample. as collected,does not completelypass a No. 50(0.300 mm) sieve, additional pulverizingshall be performed in the laboratory untilthe entire sample is finer than 0.300 mm ..(No. 50 sieve).
NOTE 7-During sample collection and pulverizing, personnel shall use caution to preventcontact of the sample with hands, or othersources of body perspiration or contamination.Further, all sampling tools (drill bits, spoons,bottles, sieves, etc.) shall be washed with alcohol or distilled water and shall be dry prior touse on each separate sample. Alcohol is normally preferred for washing because of the rapiddrying which naturally occurs.
4.2 Raw Material Somple:4.2.1 Cement samples shall be taken
and prepared as prescribed in AASHTOT 127, SamplingHydraulic Cement.
4.2.2 Coarse and fine aggregate 'samplesshall be taken as prescribed inAASHTO T 2. Sampling Stone, Slag,Gravel,Sand and Stone Block for Use inHighway Materials. Samples shall bereduced in accordance with AASfITOT 248. ReducingField Samples of Aggregate to 'Iesting Size.
4.2.3 Testsamples shall contain thefollowing minimum sizes:
cement-IOO g. Sand-300 g,coarse aggregate-3,OOO g
4.2.4 Coarse aggregate samples shallhecrushed to pass a No.4 (4.75 mm)sieveand then reduced down to about300 g. The final 300 g of coarse or fineaggregate shall be ground to a minus No.50 (0.300 mm) sieve.
5. PROCEDURE
Twodistinct procedures are presentedhere for determination of total chloride ionor water-soluble chloride ion content. Fortotal chloride ion content follow 5.1 and5.2, then continue with Section 5.4. Forwater-soluble chloride ion content follow5. I and 5 .3. then continue with Section5.4.
5.1 Weighto the nearest milligram a3 g powderedsample representativeof thematerial under tests.
NOTE 8-Some users dry the sample to constant weight in a 105 C oven and determine thedry sample prior to analysis. This optional procedure provides a constant base for comparisonof all results by eliminating moisture content asa variable. It is generally believed that drying isonly necessary when very high accuracy isdesired (see Reference I for data in this area).
5.2 Procedure for TotalChloride IonContent:
5.2.1 Transferthe samplequantitativelyto a beaker, add 10ml of distilledH20, swirlingto bring the powder intosuspension. Add3 ml of concentratedHNOs with continuedswirlinguntil thematerial is completely decomposed. Breakup any lumps with a stirring rod anddilute with hot H20 to 50 ml. Stir thoroughly to ensure completesample digestion. Add five drops of methylorangeindicatorand stir. If yellow to yelloworange color appears, solutionis not sufficientlyacidic. AddadditionalconcentratedHN0 3 dropwise with continuous stirringintil a faint pink or red color persists in thesolution. Cover with a watch glass, retaining the stirring rod in the beaker. Heat theacid solutionor slurry to boilingon a hotplateat medium heat (250 to 400 C) andboil for about 1 minute. Remove from thehot plate. filter through double filter paper(Whatman No.4 lover No. 40 filter paperor equivalent).
5.2.2 Wash the filter paper ten timeswith hot distilled H20 , being careful notto lift the paper away from the funnel surface. Finally,lift the filter paper carefullyfrom the funnel and washthe outside surface of the paper with hot distilled H20 ;then washthe tip of the funnel. The finalvolumeof the filtered solutionshouldbe125to 150 ml. Coverwith a watchglassand allowto cool to room temperature inan Hel fume-freeatmosphere.
NOTE 9-Due to the presence of relativelyinsoluble materials in the sample, the solutiongenerally will have a strong gray color, makingthe detection of indicator color difficult at times.Running of several trial samples is suggested togive the analyst practice in detecting the indicator color.
NOTE lO-A sample prepared to tOO percent passing 0.300 mm (No. 50 sieve) shouldgenerally allow determination of any expectedchloride level with adequate precision an accuracy. Samples containing highly siliceous aggregates may require finer grinding to minimizebumping during step 5.2. This may also be thecase when the concrete contains modifiers suchas latex or polymer.
5.3 Procedure for Water-Soluble Chloride IonContent:
5.3.1 Transfer the samplequantitativelyto a beaker, add 60-70 ml distilledH20. Cover the beaker with a watchglassand bring to a boil on a hot plate-magnetic

T260
34
METHODS OF SAMPLING AND TESTING
stirrer using a small magnet. Boil for 5minutes, then let stand for 24 hours in anHCl fume-free atmosphere.
5.3.2 Filter the clear supernatant liquid in the beaker through double filterpaper (Whatman No. 41 over No. 40 orequivalent) into a 250 ml beaker; take careto quantitatively transfer any adheringdrops on the watch glass, and use a stirring rod to aid transfer. Addsufficient hotdistilled H20 to cover any residue left inthe original beaker. stir 1 minute on amagnetic stirrer. and filter into the 250 mlbeaker with a swirlingaction. Wash thebeaker and the stirring rod once into thefilter with hot distilled H20. Wash the filter paper oncewith hot distilled H2O. Liftthe filter paper carefully from the funneland wash the outside surface of the paperwith hot distilled H20. Set aside the paperand wash the interior of the funnel and itstip with hot distilled H20. Finally, add 1-2drops of methyl orange indicator to the150 ml beaker; then add concentratedHN03 dropwise withcontinuous stirringuntil a permanent pink to red color isobtained. Make up the volume to 125 to150 ml with distilled H20.
5.4 Three alternate methods are available to determine the CI- content of thesolution. All methods utilizean ionselective electrode (Cl" or Ag ") and all methods for the purpose of this analysisgiveresults of essentially equal accuracyandprecision.
5.4.1 Method I: Potentiometric Titration-Fill the Cl" or the Ag + electrodewith the solution(s) recommended by themanufacturer.plug it into the millivoltmeter (preferahly the type with a digitalrather than a dial readout), and determinethe approximateequivalence point byimmersing the electrode in a beakerofdistilled H20. Note the approximate millivoltmeter reading (which maybeunsteadyin H20). Take the cooled sample beakerfrom Section 5.3 and carefully add 4.00ml of 0.0100 N NaCI, swirling constantly.Remove the beaker of distilled H20 fromthe electrode, wipe the electrodewithabsorbent paper,and immerse the electrode in the sample solution. Place theentire beaker-electrode assembly on amagnetic stirrer and begingentlestirring.Using a calibrated buret, add graduallyand record the amount of standard 0.01 NAgN03 solutionnecessary to bring themillivoltmeterreading to - 40 mvof the"equivalence point determined in distilled
H20. Then add standard 0.01 N AgNO,solution in 0.10 ml increments recordingthe millivoltmeter reading after eachaddition.
As the equivalence point is approached,the equal additions of AgNO, solution willcause larger and larger changes in the millivoltmeter reading. Past the equivalencepoint, the changes per unit volume willagaindecrease. Continuethe titration untilthe millivoltmeter reading is at least 40mv past the approximateequivalencepoint.
The endpointof the titration usually isnear the approximateequivalence point indistilled water and may be determined by(I) plotting the volume of AgNO, solutionadded versus the millivoltmeterreadings.The endpointwill correspond to the pointof inflection of the resultant smoothcurve, or (2) calculating the differences inmillivoltmeter readings between successiveAgN03 additions and calculating thetotal volume of AgNO, which correspondswitheach difference(i.e., the midpointsbetween successive additions).
Raw Data Differences
TItrant Millivolt Titrant MillivoltVolume Reading Midpoints Difference
4.2ml 130.0 4.25ml 5.04.3ml 135.0 4.35ml 7.04.4ml t42.0 4.45 ml 10.04.5 ml 152.0 etc.
etc.
The endpoint will he near the midpointwhich producedthe largest change in millivoltmeter reading. It may be determinedby plottingmidpoints versus differencesand defining the AgNO, volume whichcorresponds to the maximum differenceon a smooth, symmetrical curve drawnthrough the points. However, it can usually beestimated accurately without plotting the curve by choosingthe midpointwhich corresponds to the maximum difference and adjusting for asymmetry, if any.In other words, if the differences on eachside of the largest difference are not symmetrical, adjust the endpoint mathematically in the direction of the largest differences. Detailed examplesof this adjustmentare contained in Reference 1.
5.4.1.1 Calculations:Determine the endpoint of the titration
as described in Section5.4.1 by eitherplottinga curve or estimating from the
numericaldata. Calculatethe percentCIion from the equation:
Cl- percent = (3.5453 (Y,N, - V2N2
W
where:
V, endpoint in ml of AgNO,tv., normality of AgNO,W Weight of original concretesample
in gramsV2 Volume of NaCI solution added, in
mlN2 = Normality of NaCI solution
5.4.2 Method II: Gran Plot MethodThis methodis compatible witheither aCl" or Ag+ ionselectiveelectrode. Attachthe electrodeof choiceto a compatibledigital millivoltmeter after filling therequired solutions as per the electrodemanufacturer's instructions. Clean theelectrode with distilled H20 and pat drywithabsorbentpaper.
Weigh the solutionand beakerfromSection5.3 withoutthe watch glass andrecord the weight. Using a calibratedburet, titrate the sampleto 225 mv± 5 mv(Cl" electrode) or 310 mv ± 5 mv (Ag+electrode) with standard O.OIN AgNO,solution. Recordthe volume added and themillivoltmeter reading.
Continue to titrate in 0.50 ml increments recordingthe volume added and themillivoltmeter reading foreach increment.Add and record the data for at least fiveincrements. Empty, clean, dry and weighthe beaker. Subtract beaker weight frombeaker + solution weight determinedaboveto define solution weight.
Exampleshownin Figure 1. Additionalinformation on the Gran Method is givenin Reference 2.
5.4.2.1 Gran MethodCalculations:Calculatecorrected values for each of
the volumes recordedin Section5.4.2 bythe equation:
v _ Vrecordcorrect - WIlOO
W = Original solution weight ingrams
Vrecord = Volumes recorded in ml
If anyof the V correct valuesaregreater than 10, see Section 5.4.2.2. Ifless than 10, plot thesecorrected valuesversusthe corresponding millivolt readingson Orion Gran Plot Paper (10 percent

35METHODS OF SAMPLING AND TESTING T260
volumecorrected type witheach majorvertical scale division equal to 5 millivolts) or equivalent. Draw the best straight
. line through the points and read the endpoint at the intersection of the line withthe horizontal axis of the graph. Calculatethe actual endpoint by the equation.
Ea, ACTUAL ENDPOINT = s, ( I~ )
where:
Ee = Endpoiut determined from graphin ml
W = Weightof solution in grams
Th t CI 3.5453EaNen percen = ---
W,
where:
B, :::= Actualendpoint, in mlN = Normality of AgNO, solutionWe = Concrete sample weight in grams
5.4.2.2 Supplementary Gran MethodCalculations:
Whenthe V correct volumesdeterminedin Section5.4.2.1 are greater than10, discard the values and follow the following procedure.
Choosea constant which, when subtractedfrom an V record volumes, yieldsvaluesless than 10 ml.
NOTE Ii-This constant, designated as X inthe formulas below, is normally assigned anevenvalue such as 5, 10. 15.20, etc.
Calculate a revised solution weight Wr as
W, = W + X
where:
W = Original solutionin gramsX = The constant.
Then calculatecorrected volumes foreachrecorded volumeas:
v=' = V"""" .. XW,/lOO
Plot these values and determine thegraph endpoint Eg as described in Section5.4.2.1. The actual endpoint Ea is then,
Ea=Ee(~)+X
'"
...,.:•~i ...r.
I ..."."".........
---===~='=11~n-j:'t
,
~jt
-i t+ '-;
:J II I i !
JU ! .-Hi+.J
.~. ...: I t ~ r: ~
- ,, H-i,
}JI~
H t- t - ,
- . -.Il
.- ,:;.. - + - I
l- !
- 1 IL it. ! oil I.. , .1-': . L ...
- , ,j' I : I 1 . : ,
! :. , !"
, .i : ; , ;.- : ..
- L; 11 1; ! j ! , j i ·1 : i, .j l I ; Tj : U i .: ! :
: .. .- , :
; , ; , . .-, , j-., , ..
i I . I , , I.. ,1 ~..:':
V Endpoint. . ).45 , 0.02 all : , , ; . i' I· i___ ..
where:
Eo = Actual endpoint in mlEe = Endpoint from graph in mlWr = Revised solution weightin gramsX = The constantchosenabove.
Calculate the chloridecontentusing theformulagivenin Section5.4.2.1.
5.4.3 Method 111; AutomaticTitrator-This methodis compatible witheither a CI- or Ag + ion-selective electrode. The millivolt endpointdetermination and testing procedureshall be inaccordance with the instrumentmanufacturer's recommendation.
5.4.3.1 Automatic TitratorCalculations:
Havingdetermined the endpointwiththe automatic titrator,calculations will beidentical with Section 5.4.Li:
5.5 The percent chloride may beconverted to pounds of CI per cubic yard ofconcreteas follows:
lbs Cnyd' = percent CI (~~)
where:
UW= Unit weightof concreteper cubicyard
NOTE 12-A unit weight of 3,915lbs/yd3 isoften assumed for normal structural weight concrete when the actual unit weight is unknown.
• • 5 • 7 • 6. PRECISION
FIGURE 1 Use of Gran Method to'Determine Endpoint in the PotentiometricTitration of an Acid Extract of Concrete
6.1 The precisionstatements presented below are based on guidelinespresented in ASTM C 670, "Preparing Preci-

T260
36
.METHODS OF SAMPLING AND TESTING
•
NOTE-The figures given in Column 2 are the standard deviations that have been found to beappropriate for the chloride ion concentrations described in column 1.The figures given in Column 3are the limits that should not be exceeded by the difference between the results of two properly condueted tests.
• These numbers represent, respectively, the (15) and (D2S) limits as described in ASTM C 670,Recommended Practice for Preparing Precision Statements for Test Methods for Construction Materials.
StandardDeviationa
Multilaboratory Precision
0.00850.00880.00910.01050.01360.0195
AcceptableRange of Two
Results"
See Section 4 for method of sampling.
9. METHOD OF SAMPLING
10. STANDARDIZATION
10.1 Dry a sufficient quantity of standard materials (AgNO" NaCI, CaCO"and NaNO,) at 105C to constant weight.Cool and retain in a dessicator.
10.1.1 Weigh a sufficient sample ofeach of the above standards to effect thefollowing solutions:
Ag+ 100 ppmCI- - lOOppmNa+ - 100.ppmea+ + - 500 ppm
10.2 Add 10 mL of I + 9 HNO, toeach of eight 100 mL low actinic volumetric flasks. Aliquotsufficientchloride solution so that each flask will contain a chloride ion concentration of 0.0, 0.1, 0.25,0.50,0.75, 1.0,2.0, and 3.0 ppm respectively. -The0.0 concentration will be the10 ppm silver standard.
10.3 Proceed with the eight volnmetric flasks following Sections 11.7.1through 11.7.3.
10.4 Set the operating parameters forA.A. in accordance with the manufacturer's procedures whenusing a silver lamp.
10.5 Aspirate the 10 ppm Ag+ standard with a zerochloride ionconcentration, and set 10 ppm in the readout window.
0.00300.00310.00320.00370.00480.0069
Percent ChlorideConcentration
Multilaboratory Precision
0.01760.02680.03130.05920.13390.2618
NOTE 14-If equivalent filter membranesare used, they should be checked to confirm theydo not contain chloride which will contaminatethe sample.
8. REAGENTS
8.1 Calcium Carbonate, ReagentGrade.
8.2 Hydrogen Peroxide (30%~
8.3 Methyl Orange.8.4 Nitric Acid, Concentrated (sp gr
1.42).8.5 Silver Nitrate, Reagent Grade (pri
mary standard).8.6 Sodium Chloride, Reagent Grade
(primary standard).8.7 Sodinm Nitrate, Reagent Grade.8.8 Water.Distilled.
7.2.3 100-mL volumetric flasks withglass stoppers (clear glass).
7.2.4 lOQ-mL volumetric flasks (low.actinic with glass stoppers).
7.2.5 Pipettes of suitable sizes, whichmeetor exceedthe tolerances specified inNBS circular 602 for Class A Volumetricware.
7.2.6 Analytical balance sensitive to0.0001 g complying with M 231 Class A.
7.2.7 Fisher filtrator (vacuum) witheither a glass or plastic bell jar, tallenough to place a lOQ-mL volumetricflask underneath.
7.2.8 Hot plates (electric).7.2.9 Vacuumsource.7.2.10 Vinyl tubing.
sion Statementsfor TestMethods forConstruction Materials." They are, of necessity slightly different since the withinlaboratory standard deviationwas essentially constant over the chloride levelsexamined while the between-laboratoryprecision varied with chloride level. Bothstatements, however, are based onthe difference two-sigma limit, (D2S). The(D2S) index is the difference between twoindividnal test resnlts that would beequaled or exceeded in the long run inonly one case in 20 in the normal and correet operation of the chemical analysis.
6.2 Single-Operator-The singleoperator standard deviationhas beenfound to be 0.0024 percent chloride",Therefore, results of two properlyconducted tests by the same operator on thesame material should not differ by morethan 0.0068 percent chloride/,
6.3 Multllnhoratmy PrecisIon-Criteria for judging the acceptability of chloride ion concentrationtest results obtainedby different laboratories by this testmethod are given in the table entitled"Multilaboratory Precision."
7. APPARATUS
PROCEDURE B-Total Ion byAtomic Absorption
7.1 See Section 2.1 for samplingequipment.
7.2 Equipment for Chemical Testing.7.2.1 Atomic Absorption Spectropho
tometer.
NOTE 13-The text of this method is mostapplicable [0 the use of a Perkin Elmer Model503 A.A., with a z-tnch path length burner anddigital readout. Laboratories using instrumentsother than Perkin Elmer should utilize themethod to the fullest extent possible.
7.2.2 Millipore filter assembly No.XXI 104710 (47 mm in diameter), orequivalent. Millipore filter membrane No.HAWP04700 (0.45 urn membrane), orequivalent.
2 The numbers represent, respectively, the (IS) and(D2S) limits as described in ASTMRecommended...Practice C 670, for Preparing PrecisionStatementsforTestMethodsfor ConstructionMaterials.

37METHODS OF SAMPLING AND TESTING T260
7.0
8.0
3.0
the material under test. Transfer to a150mL beaker. and add 10 mL of dilutenitric acid (1 + 9) to dissolve as muchofthe sample as possible. Break up anylumps with a stirring rod.
11.4 If carbonates are present, letsample stand until all effervescenceiscompleted.
U.S If the solution is not acid at thispoint. add only enough nitric acid to produce a red color with methyl orange.
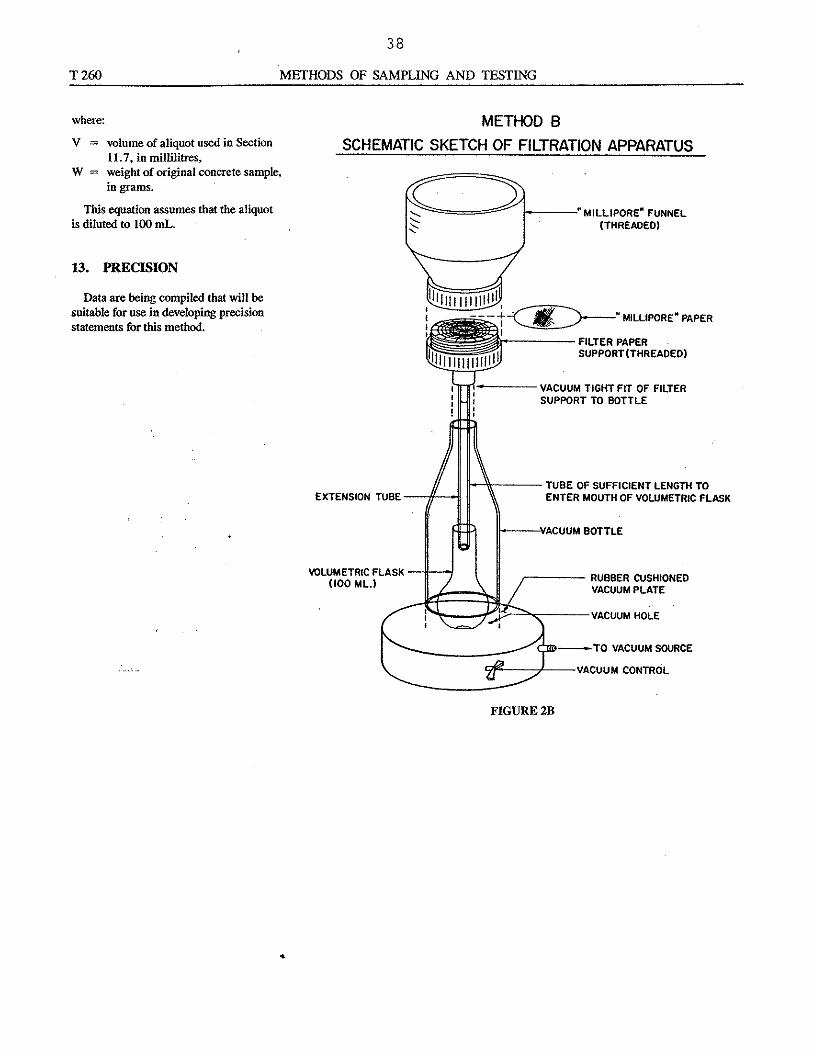
n.6 Heat the slurry on a hot plate tojust under boiling. and digest for five minutes or until all reaction ceases. Removefrom hot plate and cool. Vacuumfilter(Fisher filtrator or equivalent through a0.45 J.Lm membrane (Milllpore filterassembly No. XXI 104710.Millipore filtermembrane No. HAWP04700. or equivalents) into a 100 mL volumetric flask.Wash the precipitate with three or foursmall portions of distilled water. Dilute tovolume (see Figure 2B).
n.7 Aliquot 10 mL of the filteredsample solution into a 100mL volumetricflask (low actinic), Savebalance of thesample;other dilutions may be needed ifconcentration is relativelyhigh.
n.7.1 Add V, mL hydrogen peroxideand agitate for one minute.
n.7.2 Add 10 mL of the 100ppm silver nitrate solution. Agitate the flask onceagain and let stand forone hour.
11.7.3 Vacuumfilter. using aboveMillipore or equivalentequipment, into a100mL volumetric flask (low actinic)containing 5 mL of the sodium solutionand 1 mL of the calcium solution. Washthe precipitate with three or four smallportionsof distilled water. Dilute to volume (see Figure 3). This filtrate containsthe unreacted silver ionsfrom the silverchloride precipitation which are found bystandard atomic absorption procedures forsilver, including measurementsof suitablestandards during the determinations.
11.7.4 Enter the curve (see Figure 1)with Ag" remaining, and determine thechloride concentration (ppm).
11. PROCEDURE
H.l The sample as received shall bemade to pass a No. 50 sieve, after removing any free iron that may have been introduced in samplepreparation. If receivedsample is excessively large. quarteringmaybe necessary before grinding.
H.2 Dry sample at 105 C to constantweightand cool in dessicator,
11.3 Weigh to the nearest mg a one(I) g powderedsample representativeof
Ag+ CONCENTRATIONVS.
CI- CONCENTRATION
2.0
6.0
;-'"<t~
:::IE 5.0a.a.
4.0
10.0
METHOD B
9.0
10.6 Aspirate the remaining Seven
volumetrics containing 0.1 through3.0 ppm chloride ion concentrations, andnote the readings. Repeat this procedure atleast three times on three different days toobtain an average reading. Developthe standardization data by aspiratingrandomly.
10.7 Prepare a curve on linear graphpaper, plotting remaining Ag+ ionsdetermined by A.A. against the sevenchloridestandards (see Fignre 2A).
1.0
12. CALCULATION
•FIGURE2A
PPM(Cn
percentcr- = ( ~) ( pp~CI-)
Calculate the percentage of chloride inthe concrete or concrete raw material, asindicated below:
3.02.01.00.0 +------r--------,,---------,--
o
38
T260 METHODS OF SAMPLING AND TESTING
1------:"MILLIPORE" FUNNEL(THREAOED)
:-.-rl·---- VACUUM TIGHTFIT OF FILTERSUPPORT TO BOTTLE
METHOD B
SCHEMATIC SKETCH OF FILTRATION APPARATUS
It---'\.--- TUBE OFSUFFICIENTLENGTH TOEXTENSION TUBE--11'----1 ENTER MOUTH OF VOLUMETRIC FLASK
v = volumeof aliquot used in Section11.7, in millilitres,
W = weightof originalconcrete sample,in grams.
Thisequation assumes thatthe aliquotis dilnted to 100 mL.
where:
Data are being compiled that will besuitable foruse in developing precisionstatements for this method.
13. PRECISION
II----VACUUM BOTTLE
~---~:#L-J=-- TO VACUUM SOURCEVACUUM CONTROL
VACUUM HOLE
rr-r-r-r--r-: RUBBER CUSHIONED__~~==-~i:-~, VACUUM PLATE
VOLUMETRIC FLASK -11--1(100 MU
FlGURE2B
•
39
Appendix FAASHTO T 277-89
40
Standard Method ofTest
for
Rapid Determination of the Chloride Permeability of Concrete
AASHTO DESIGNATION: T 277-89
5.1 Obtain samples from the structureto beevaluated using a core drilling rigequipped with a nominaI4-in. (102 mm)diameter (3. 75-in. (95 mm) actuall.D.)diamond-dressed core bit. Select and COresamples following procedures in AASHTOMethod T 24. Place the cores in a plasticbag for transport to the laboratory.
5.2 Using the diamond saw.cut a2-inch (51 mm) slice from the top of thecore, with the cut parallel to the top of thecore. This slice will be the test specimen.Use a belt sander to remove any burrs onthe end of the specimen.
4.4.1 Specimen-cell sealant-RTVsilicone rubber or silicone rubbercaulking.
4.4.2 Sodium chloride solution3.0 percent by weight (reagent grade) indemineralized water.
4.4.3 Sodium hydroxide solution0.3N. reagent grade.
4.4.4 Filter papers-No.2, 90 mmdiameter.
4.4.5 Digital voltmeter(DVM)4V,-digit, 200 mV full scale.
4.4.6 Digital voltmeter-3Vi digit,99.9 V full scale.
4.4.7 Shunt resistor-loo mY. 10 Arating.
4.4.8 Constant voltagepowersupply-O - 80 V de, 0 - 6 A. capableof holding voltage constant at 60 ± 0.1 Vover entire range of currents.
4.4.9 Cable-two conductor, No. 14(1.6 mm), insulated. 600 V.
4.4.10 Funnel-plastic, long stem.4.4.11 Applied voltage cell (see Fig
ures 2 and 3, Appendix).4.4.12 Thermocouplewire and readout
... device (optional)-0-120 C (30-250 F)range.
5. TEST SPECIMENS
APPARATUS, REAGENTS,AND MATERIALS
3.4 The method may beused on coresof diameters Other than 95 mm (3.75 in.)and thickness other than 51 mm (2 in.),The values in Table 1 are not valid for anyother size specimens, however, and norelationships have been established toadjust the values in that table for otherspecimensizes. Data for specimens ofother sizes may be used for relative comparisonsof chloride perrneabilities amongspecimensof the same size.
4.1 Vacuum Saturation Apparatus (seeFigure 1).
4.1.1 Separatoryfunnel-5oo mlcapacity.
4.1.2 Beaker-I,OOO ml.4.1.3 Vacuum desiccatol-250 mm
J.D.4.1.4 Vacuum pump-capable of
maintaining a pressure of less than I mmHg (133 Pal in dessicator,
4.1.5 Vacuum gage or manometeraccurate to ± 0.5 mm Hg (± 66 Pal overrange 0-10 mm Hg (0-13, 30 Pal pressure.
4,2 Epoxy Coating Apparatus andMaterials: .
4.2.1 Epoxy resin-rapid setting,capableof sealing side surface of concretecores.
4.2.2 Balanceor scale, paper cups,woodenspatulas, and disposablebrushes-for mixing and applying epoxy.
4.3 SpecimenSizing Equipment:4.3.1 Movable beddiamond saw.4.4 Voltage Application Apparatus,
Reagents, and Materials:
I Desiccatormust allow two hose connections, throughrubberstopper and sleeveor through rubber stopperonly.Eachconnection must be equipped with a stopcock.
SCOPE1.
1.1 This method covers the determinationof the permeability of conventionalportland cement and specialized. e.g.,latex-modified and polymer.concretes tochloride ions. It consists of monitoring theamount of electrical current passedthrough 95 mm (3.75 in.) diameter by51 mm (2 in.) loug cores when one end ofthe core is immersed in a sodium chloridesolutionand a potential difference of60 V de is maintained across the specimenfor 6 hours. The total charge passed, in . 4.coulombs, is related to chloride permeability.
2. REFERENCED DOCUMENTS
•
3. SIGNIFICANCE AND USE
2.1 AASHTO Standards:T 24 Obtaining and Testing
Drilled Cores and SawedBeams of Concrete
T 259 Resistance of Concrete toChloride Ion Penetration
3.1 This method covers the laboratoryevaluationof the relative permeability ofconcrete samples to chloride ions. The testresults haveshowngood correlation withthe results of 9O-daychloride pondingtests (AASHTO T 259) on companionslabs cast from the same concrete mixes.
3.2 The method is suitable for specification acceptance, design purposes,service evaluation,and research anddevelopment.
3.3 Care should be taken in interpreting results of this test when it is used onsurface-treated concretes. The resultsfrom this test on some such concretesshowhigh chloride permeabilities, while9O-day chloride ponding tests on compan- ...ion slabs showlow permeabilities.

41
T277 METHODS OF SAMPLING AND TESTING
6. CONDITIONING
Mesh ,olderedbel'll&6ll 'hlms
mm"in. I( 25.4
Glut Join ,cre,nunll to eeu
2" T'llounlit ~q'd.
," -if
e.o.. 5~1.. 002 1<1, tl\lc~ 6 • 60 .oll~ ...""I.. -C_, 11014 ... (1<1". <lGd 1210.
h"o"" Ply. "'001 '"."",lo"" 2To, .. ,•• , '2-,0 - ~ l
NOTE I-If temperature exceeds 190 F(88 C), discontinue test in order to avoid damage
meable material such as solid rubbersheeting. Place rubber stopper in cell venthole to-restrict moisture movement. Allowsealant to cure per manufacturer'sinstructions.
7.5 Repeatsteps 7.3 and 7.4 on second half of cell. (Specimen in applied voltage cell nowappears as shown inFigure 4.)
7.6 Usingthe long stem funnel. fillleft hand ( - ) side of cell, i.e., the sidecontaining the top surface of the specimen, with 3.0 percentNaCIsolution. Fillright hand ( + ) side of cell with 0.3NNaOHsolution. .
7.7 Attach lead wires to cell bananaposts. Make electrical connectionsas .shown in Figure 5. Thrn power supply on,set to 60.0 ± 0.1 Y. and record initial CUrrent reading (When the 4V,-digitDVMspecified in Section4.4.5 is used with the100 mV shunt, the DVM display can heread directly in milliamps disregardingthe decimal point, i.e., 0.01 mY equalsI milliamp).
7.8 Read and record current every 30minutes. Monitortemperature inside ofcell if desired (thermocouplecan heinstalled through V. in. (3 mm) venthole
. in top of the cell).
r-----------, II " l.~:I d'" ~l I, V ,
...................------- ...._l"."
~.
'1..-28 NFr~=''''----;'''''''''~-----r---r:,::1J>
FIGURE 3 Applied Voltage Cell (Construction Drawing)
Pressure should decrease to less thanI mm Hg (I. 330 kPa) withina fewminutes. Maintainvacuum for 3 hours.
6.4 Fill 500 ml separatory funnel withde-aeratedwater. With vacuum pump stillrunning, open waterstopcock and drainsufficientwater into beaker to coverspecimen (do not allowair to enter desiccatorthrough this stopcock).
6.5 Close waterstopcock and allowvacuumpump to run for 1 additional hour.
6.6 Close vacuum line stopcock, thenturn off pump. Turn vacuumline stopcockto allow air to reenter desiccator.
6.7 Soak specimen under water in theheaker for 18 ± I hours.
7. PROCEDURE
7.1 Remove specimen from water, blotoff excesswater, and transfer specimen tocan and seal temporarily.
7.2 If using two-part specimen-cellsealant, prepare approximately 20 g.
7.3 Place filter paper over one SCreenof the applied voltagecell; trowel sealantover brass shimsadjacent to cast acryliccell body. Carefully remove filter paper.
7.4 Press specimenonto screen;remove excesssealant which has flowedout of specimen/cell boundary. Coverexposed face of specimen with an imper-
•
•
FIGURE 2 Applied VoltageCell-Face View
FIGURE I Vacuum SaturationApparatus
6.1 Vigorously boil tapwater in alarge (2L) florence flask. Remove flaskfrom heat, cap tightly, and allow water tocool to ambient temperature.
6.2 Allow specimen prepared in Section5 to surface dry in air for 1 hour. Prepare approximately 10g of.rapid settingepoxyand brush onto sides of specimen.Place sampleon sample-support studwhile coating to ensure complete coatingof sides; Allowcoating to cure per manufacturer's instructions.
6.3 Check coating for tack-free surface..Place specimen in 1,000 ml beaker,then place beaker in vacuum desiccator.Seal desiccatorand start vacuum pump.

42
METHODS OF SAMPLING AND TESTING T277
to cell. Such temperatures generally occur onlyfor high permeability concretes and for specimens thinner than 51 mm (2 in.).
7.9 Terminate test after 6 hours.7.10 Remove specimen. Rinse cell
thoroughly in tapwater; strip out and discard residual sealant.
8. CALCULATION ANDINTERPRETATION OFRESULTS
8.1 Plot current (in. amperes) vs. time(in seconds). Drawa smooth curvethrough the data, and integrate the areaunderneath the curve in order to obtain
the ampere-seconds. or coulombs, ofcharge passed during the 6-hour testperiod.
NOTE 2-While conventional integrationtechniques such as planimetryor paper weighing can be used, programmable hand-held calculators which are now available can be used tonumerically integrate the plots.
FIGURE 4 Specimen Ready for Test
3! Digit DVM
IOCV F. S. -- No.14 Wire
-- Hookup Wire
Power Supply 4t Oi911 DVM
O-BOV de200 mv F.S.
0- 6A 100 mv Shunt
(- (+ , , I ,1...-1 1
I
~To 3.0"/" Noel To O.3N NoOH
•FIGURE 5 Electrical Block Diagram
8.2 Use Table I to evaluate the lestresults. These values were developed fromdata on 3.75-in. (95 mm) diameter x2-in. (51 mm) long core slices taken fromlaboratory slabs prepared from varioustypes of concretes.
NOTE 3-The terms in the middle column ofTable I are not absolute. They are relativedescriptions of the perrncabilities of carefullyprepared laboratory specimens.
9. REPORT
9.1 The report shall include thefollowing:
9.1.1 Source of core, in terms of thestructure and the particular location in thestructure from which the core wasobtained.
9.1.2 Identification number of coreand specimen.
9.1.3 Location of specimen withincore.
9.1.4 Typeof concrete. includingbinder type, water-cement ratio, and otherrelevant data supplied with cores.
9.1.5 Description of specimen,including presence and location of reinforcing steel, presence and thickness ofoverlay, and presence and thickness of surface treatment.
9.1.6 Unusual specimen preparation,e.g., removal of surface treatment.
9.1.7 Test results, reported as thetotal charge passed over the test periodand the maximum current recorded duringthe test period.
9.1.8 The chloride permeabilityequivalent to the calculated charge passed(from Table I).
10. PRECISION AND BIAS
10.1 Single-OperatorPrecision-Thesingle-operator coefficient of variation of asingle test result has been found to be12.3% (Note 4). Therefore the results of

43
T277 METHODS OF SAMPLING AND TESTING
Z Whiting, D., «Rapid Determination of the Chloride Permeability of Concrete:' Report No.FHWAlRD·81/119, August 1981, available from NTIS, PB No. 82140724.
Chloride Permeability Based on Charge Passed (from Reference 2)
ChloridePermeability Typicalof-
NOTE 5-Although the test method does notrequire the reporting of more than one testresult, testing of replicate test specimens is usu-
ATTACHMENT OF SCREENTO CELL
2.
Solder a 12-10\4ring terminal onto thebare end of the lead wire, keepingexcesswire length to a minimum. Run thethreadedend of the banana plug throughthe eyeletof the ring terminal, then threadbanana plug into the \4-28 threaded holein the side of the cell, tighten securely.Then fill the V" in. (1.5 mm) hole withclear silicone rubber caulk.
3. ATTACHMENT OF LEADWIRE TO BANANA PWG
The screen is bonded to the cell byusinga high quality waterproofadhesive.Scour both the screen shim and the cell lipwith medium sandpaper prior to applyingadhesivein order to obtain good metal toplasticbond. Apply a coating of adhesiveto both cell and screen, run lead wirethrough V,. in. (1.5 mm) hole inside ofcell, then gently push screen into placeoncell lip. Wipe excessadhesive off facesideof screen shim and place a weightonscreen until adhesive has fully cured(24 hours).
4. MATERIALS QUANTITIESAND COST
Some materials may not beavailableinthe small quantities necessary to constructa singlecell. In these cases'package quantities havebeen quoted. Cast acrylic sheetstock will probablyneed to beprecut bythe suppliers, and the buyer will need topaycutting charges unless he has anotheruse for the full stock width.
10.3 Bias-The procedureof this testmethodfor measuring the chloride permeability of concretehas no bias becausethevalueof this permeabilitycan bedefinedonly in terms of a test method.
ally desirable. The precision statement for theaverages of three results is given since laboratories frequently will run this number of specimens. The percentage cited represents the(D28%) limit divided by the square root of 3.
APPENDIX-NOTES ONAPPLIED VOLTAGE CELL
CONSTRUCTION (REFER TOFIGURE 3)
Solderone end of the nylclad lead wireto the outer edge of the brass shim whichholds the screen.The nylclad insulationshouldbe removed prior to solderingbyburningoff witha propane torch and thenremoving the charred residue with wirewool.
1. ATTACHMENT OF LEADWIRE TO SCREEN
High water-cement ratio, conventional (>0.6) PCCModeratewater-cement ratio, conventional (0.4-0.5) PeCLow water-cement ratio,conventional «OA) PeCLatex-modified concreteInternally sealed concretePolymerimpregnatedconcretePolymer concrete
HighModerate
LowVery Low
Negligible
Charge Passed(coulombs)
TABLE!
<100
> 4,0002,000-4,000l,OOOw2.000
100·1.000
NOTE 4-These numbers represent, respectively, the (18%) and (D2S%) limits asdescribed in ASTM Practice C670, for Preparing Precision Statements for Test Methods forConstruction Purposes. The precision statements are based on the variations in tests onthree different concretes, each tested in triplicate in 11 laboratories. All specimens had thesame actual diameters, but lengths varied withinthe range 51 ± 3 mm (2 ± VB In.j.
twoproperlyconducted tests by the sameoperatoron concrete samples from thesamebatch and of the same diametershould notdiffer by more than 35%(Note4).
10.2 Multilaboratory Precision-Themultilaboratory coefficientof variationofa singletest result has been found to be18.0%(Note4). Therefore results of twoproperly conductedtests in different laboratories on the same material should notdiffer by more than 51% (Note 4). Theaverage of three test results in two different laboratories should not differ by morethan 29% (Note 5).
•


