Low-Dose Imaging Techniques for Transmission Electron Microscopy
16
5 Low-Dose Imaging Techniques for Transmission Electron Microscopy David B. Carlson and James E. Evans Department of Molecular and Cellular Biology, University of California at Davis, USA 1. Introduction Transmission electron microscopes have the ability to visualize almost any specimen at the nanoscale. Unfortunately, modified imaging protocols are needed when samples are composed predominantly of low atomic number elements. In this chapter we review several methods that are currently employed to mitigate the adverse effects caused by electron irradiation to materials at the interface of biology and nanotechnology. We also highlight future technological advancements to the microscope platform that may further enhance the quality of imaging for beam sensitive samples. 2. Need for low-dose imaging with transmission electron microscopy Although material scientists are able to routinely image inorganic specimens at atomic resolution, the same is not true for organic and biological specimens. This divergence in attainable resolution is largely a result of varying tolerance to electron beam exposure. Organic and biological specimens exhibit increased sensitivity to high-energy electron irradiation as compared to inorganic materials. For example, metals and monocrystals of silicon can handle very large doses of radiation without showing significant signs of damage. However, radiation damage, in the form of bond breakage and mass loss, from the electron beam is both deleterious and unavoidable for organic samples made of low atomic number elements such as carbon, nitrogen, and oxygen (Thach & Thach, 1971). The damage response of biological specimens is dependent on the cumulative exposed dose and was estimated using spot fading diffraction experiments on two-dimensional (2D) crystals of the amino acid L-valine. In those experiments, a dose of 6 e - /Å 2 at 80 keV resulted in the complete disappearance of diffraction spots and this value is typical, within an order of magnitude, of most biological specimens (Glaeser, 1971). Aliphatic polymers such as polyethylene are equally sensitive to electron irradiation and display similar critical doses to that of proteins (Revol & Manley, 1986). However, more aromatic polymers such as polystyrene, anthracence and poly-xylene can withstand higher irradiation doses due to the stability of the phenyl group (36, 42 and 120 e - /Å 2 respectively) (Kumar & Adams, 1990; Williams & Carter, 2004). Importantly, it should be noted that although zeolites and ceramics are technically inorganic specimens consisting of high atomic number elements, they exhibit intermediate sensitivity to electron irradiation with critical doses of approximately 100 and 600 e - /Å 2 , respectively (Pan & Crozier, 1993). www.intechopen.com
Transcript of Low-Dose Imaging Techniques for Transmission Electron Microscopy
5
Low-Dose Imaging Techniques for Transmission Electron Microscopy
David B. Carlson and James E. Evans Department of Molecular and Cellular Biology, University of California at Davis,
USA
1. Introduction
Transmission electron microscopes have the ability to visualize almost any specimen at the nanoscale. Unfortunately, modified imaging protocols are needed when samples are composed predominantly of low atomic number elements. In this chapter we review several methods that are currently employed to mitigate the adverse effects caused by electron irradiation to materials at the interface of biology and nanotechnology. We also highlight future technological advancements to the microscope platform that may further enhance the quality of imaging for beam sensitive samples.
2. Need for low-dose imaging with transmission electron microscopy
Although material scientists are able to routinely image inorganic specimens at atomic resolution, the same is not true for organic and biological specimens. This divergence in attainable resolution is largely a result of varying tolerance to electron beam exposure. Organic and biological specimens exhibit increased sensitivity to high-energy electron irradiation as compared to inorganic materials. For example, metals and monocrystals of silicon can handle very large doses of radiation without showing significant signs of damage. However, radiation damage, in the form of bond breakage and mass loss, from the electron beam is both deleterious and unavoidable for organic samples made of low atomic number elements such as carbon, nitrogen, and oxygen (Thach & Thach, 1971). The damage response of biological specimens is dependent on the cumulative exposed dose and was estimated using spot fading diffraction experiments on two-dimensional (2D) crystals of the amino acid L-valine. In those experiments, a dose of 6 e-/Å2 at 80 keV resulted in the complete disappearance of diffraction spots and this value is typical, within an order of magnitude, of most biological specimens (Glaeser, 1971). Aliphatic polymers such as polyethylene are equally sensitive to electron irradiation and display similar critical doses to that of proteins (Revol & Manley, 1986). However, more aromatic polymers such as polystyrene, anthracence and poly-xylene can withstand higher irradiation doses due to the stability of the phenyl group (36, 42 and 120 e-/Å2 respectively) (Kumar & Adams, 1990; Williams & Carter, 2004). Importantly, it should be noted that although zeolites and ceramics are technically inorganic specimens consisting of high atomic number elements, they exhibit intermediate sensitivity to electron irradiation with critical doses of approximately 100 and 600 e-/Å2, respectively (Pan & Crozier, 1993).
www.intechopen.com
The Transmission Electron Microscope 86
2.1 Primary damage mechanisms
There are two main types of primary damage (radiolysis and knock-on damage) that occur in samples following exposure to high-energy electrons (Ugurlu et al., 2011). Both knock-on damage and radiolysis are examples of inelastic scattering in which a portion of the incident energy of an imaging electron is lost due to a collision event. Knock-on damage occurs when an incident electron directly interacts with the nucleus and transfers enough energy to eject the atom from the specimen. Thus, knock-on damage is manifested as the displacement of atoms within a sample and results in the formation of point defects in a periodic lattice. Radiolysis damage arises due to sample ionization by incident electrons interacting with valence electrons and breaking chemical bonds (Williams & Carter, 2004).
Knock-on damage can be quite substantial for inorganic specimens but is generally less significant for biological samples. Although the use of higher incident electron energies (≥300 keV) increases the likelihood of knock-on damage it also decreases the frequency of radiolysis (Csencsits & Gronsky, 1987). At lower incident electron energies, knock-on damage can be completely mitigated if the energy transferred during inelastic scattering events is below the threshold energy for displacement of a particular atom. When imaging graphene sheets, an accelerating voltage less than 80 keV has been shown to prevent knock-on damage to individual carbon atoms during continuous imaging (Girit et al., 2009).
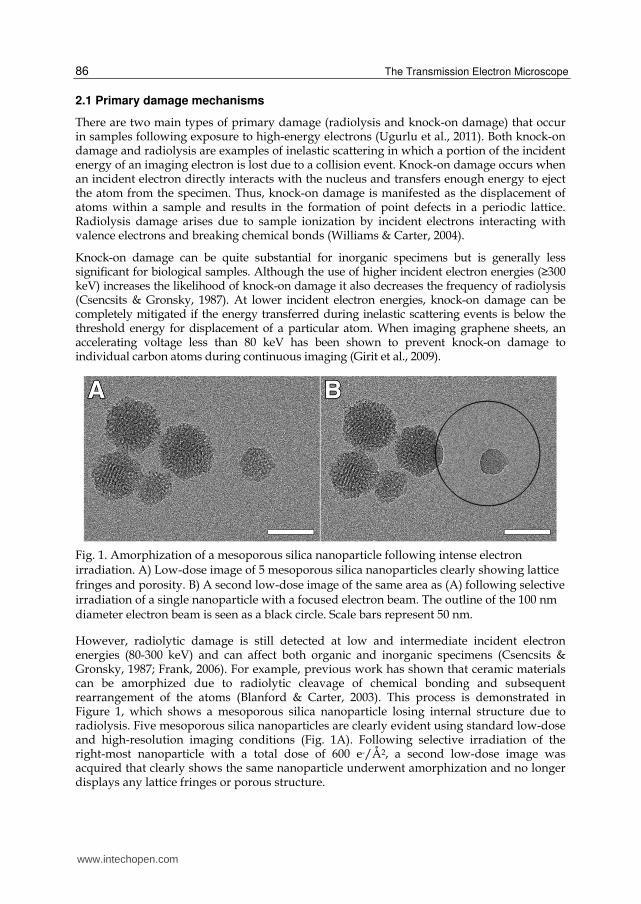
Fig. 1. Amorphization of a mesoporous silica nanoparticle following intense electron irradiation. A) Low-dose image of 5 mesoporous silica nanoparticles clearly showing lattice fringes and porosity. B) A second low-dose image of the same area as (A) following selective irradiation of a single nanoparticle with a focused electron beam. The outline of the 100 nm diameter electron beam is seen as a black circle. Scale bars represent 50 nm.
However, radiolytic damage is still detected at low and intermediate incident electron energies (80-300 keV) and can affect both organic and inorganic specimens (Csencsits & Gronsky, 1987; Frank, 2006). For example, previous work has shown that ceramic materials can be amorphized due to radiolytic cleavage of chemical bonding and subsequent rearrangement of the atoms (Blanford & Carter, 2003). This process is demonstrated in Figure 1, which shows a mesoporous silica nanoparticle losing internal structure due to radiolysis. Five mesoporous silica nanoparticles are clearly evident using standard low-dose and high-resolution imaging conditions (Fig. 1A). Following selective irradiation of the right-most nanoparticle with a total dose of 600 e-/Å2, a second low-dose image was acquired that clearly shows the same nanoparticle underwent amorphization and no longer displays any lattice fringes or porous structure.
www.intechopen.com
Low-Dose Imaging Techniques for Transmission Electron Microscopy 87
2.2 Secondary and tertiary damage mechanisms
In addition to the primary damage mechanisms of radiolysis and knock-on damage, one must also consider secondary and tertiary damage. Secondary damage results from inelastic collision events which form phonons, free radical species and secondary electrons that can each propagate through the sample and heat the sample or cause further damage via chemical reaction or secondary scattering (Williams & Carter, 2004). Tertiary damage effects arise from the evolution and buildup of gas (generally hydrogen and oxygen) following the decomposition of organic specimens via radiolysis (Meents et al., 2010).
For specimens that are good thermal conductors, phonon induced heating is usually negligible (Williams & Carter, 2004). However, the majority of biological and organic specimens (as well as ceramics) are thermal insulators and therefore such heating can be considerable, sometimes to the point of melting the sample. Simulations of proteins frozen and imaged at liquid nitrogen temperature (77 K) suggest that this heating may be insignificant if the dose rate is less than 50 e-/Å2 per second (Karuppasamy et al., 2011).
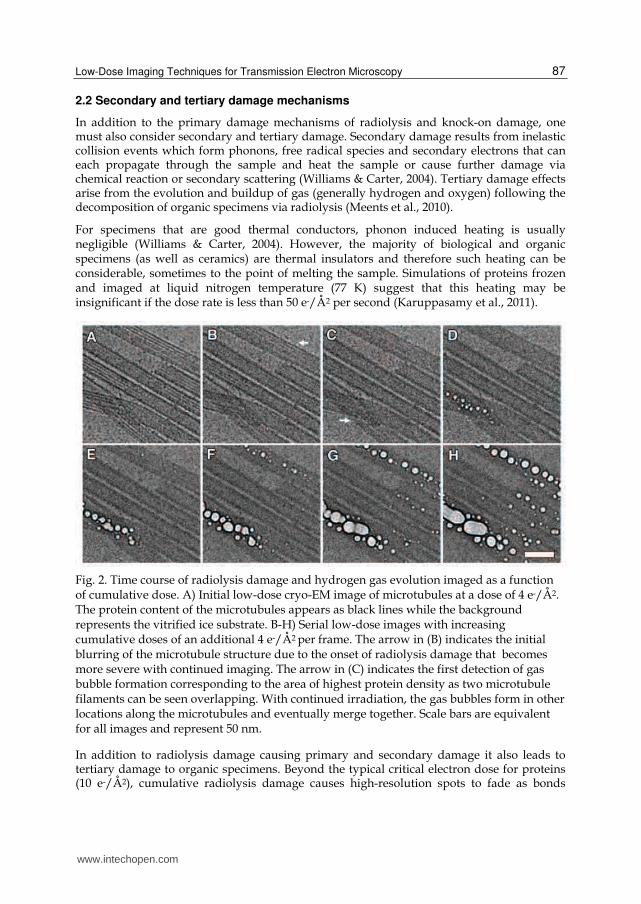
Fig. 2. Time course of radiolysis damage and hydrogen gas evolution imaged as a function of cumulative dose. A) Initial low-dose cryo-EM image of microtubules at a dose of 4 e-/Å2. The protein content of the microtubules appears as black lines while the background represents the vitrified ice substrate. B-H) Serial low-dose images with increasing cumulative doses of an additional 4 e-/Å2 per frame. The arrow in (B) indicates the initial blurring of the microtubule structure due to the onset of radiolysis damage that becomes more severe with continued imaging. The arrow in (C) indicates the first detection of gas bubble formation corresponding to the area of highest protein density as two microtubule filaments can be seen overlapping. With continued irradiation, the gas bubbles form in other locations along the microtubules and eventually merge together. Scale bars are equivalent for all images and represent 50 nm.
In addition to radiolysis damage causing primary and secondary damage it also leads to tertiary damage to organic specimens. Beyond the typical critical electron dose for proteins (10 e-/Å2), cumulative radiolysis damage causes high-resolution spots to fade as bonds
www.intechopen.com
The Transmission Electron Microscope 88
stabilizing the native structure are broken (Chiu & Jeng, 1982). Since hydrogen bonding is highly prevalent in biological specimens, radiolysis damage results in the release of hydrogen atoms from the protein backbone (Dubochet et al., 1982; Leapman & Sun, 1995). Due to the sample being frozen, released hydrogen and other trapped atoms cannot easily diffuse and therefore gas bubbles begin to form. Figure 2, shows the preferential evolution of gas bubbles in areas of high protein density. An initial blurring of the protein density (black lines) can be seen due to radiolysis damage to high-resolution components. After a cumulative dose of 12 e-/Å2 small gas bubbles can be seen forming in areas occupied by protein filaments. Finally, with continued irradiation the gas bubbles continue to expand.
2.3 Benefits of low temperature imaging
There are two major benefits to TEM imaging at low temperatures. First, vitrified samples can be imaged in a frozen hydrated state allowing optimal sample preservation of the native structure (Adrian et al., 1984; Taylor & Glaeser, 1976). Second, lower temperatures enable an increased tolerance to ionizing radiation damage (Chiu et al., 1987).
While the process of plunge freezing dynamically fixes the sample to maintain atomic resolution for organic specimens, the ultimate benefit of low temperature imaging is the reduction in radiation damage at temperatures below ~170 K (Frank, 2006). This radiation protection is a direct result of dynamically immobilizing the sample through embedment into vitrified ice (Knapek & Dubochet, 1980). By caging the sample in a frozen environment, free radicals generated from inelastic scattering events are unable to diffuse through the sample and cause secondary damage (Knapek & Dubochet, 1980). In addition, the freezing also constrains the movement and degrees of freedom for the atoms of a molecule after a bond is broken thereby limiting the structural rearrangement produced during irradiation (Frank, 2006). As a result, embedment in vitrified ice and imaging at liquid nitrogen temperature improves radiation tolerance 2 to 6 fold over room temperature imaging (Chiu et al., 1987; Frank, 2006). Further cooling to liquid helium temperature (4 K) has shown an additional two-fold increase in radiation tolerance of vitrified two-dimensional (2D) membrane protein crystals to 20 e-/Å2 (Fujiyoshi, 1998).
3. Low-dose imaging techniques
3.1 Conventional low-dose imaging
Low-dose imaging is a standard technique and is ubiquitously used in nearly all cryogenic-Electron Microscopy (cryo-EM) applications. The main goal of low-dose imaging is to locate an area of interest on the grid surface and accurately determine the appropriate focus without significantly pre-exposing the location to be imaged at high-resolution. If done correctly, the effective pre-exposure dose to the sample is less than 0.2 e-/Å2 (Sun & Li, 2010).
Most modern microscopes come with pre-installed low-dose software. JEOL microscopes have a Minimal Dose System (MDS) interface that stores three different sets of lens values for efficient swapping between imaging modes. SEARCH mode is generally a low-magnification overview image used to identify areas of interest while PHOTO mode is used for actual data collection at high-magnification. FOCUS mode is set at the same or higher magnification as PHOTO mode, but the beam and image is shifted to an adjacent area to avoid pre-exposing the area of interest identified for high-resolution imaging in PHOTO mode. Reliable swapping between the three modes is possible since the last lens settings of each mode are automatically saved and recalled whenever transferring modes.
www.intechopen.com
Low-Dose Imaging Techniques for Transmission Electron Microscopy 89
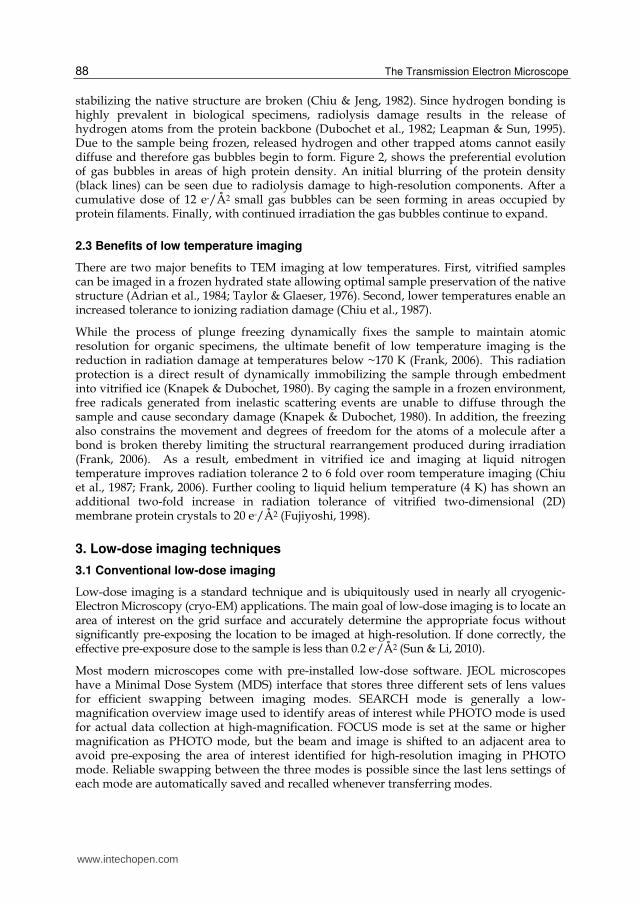
Fig. 3. Demonstration of the areas used for low-dose cryo-EM imaging. A) SEARCH mode: Low-magnification overview of the sample grid used to identify areas of interest. Black arrow points to the area that will be used for FOCUS mode while the white arrow indicates the sample area of interest that will be used to record the PHOTO mode data. B) FOCUS mode: High-magnification image of an adjacent area used to manually find eucentric height and determine optimal defocus parameters. C) PHOTO mode: High-magnification image of the sample area of interest (catalase crystal). The inset shows the corresponding FFT with lattice spots verifying the presence of the protein crystal. D) Same area as (A) but after acquiring (B) and (C). The white dotted circle represents the electron beam diameter used for imaging in PHOTO mode. The black dotted ¾ circle indicates the irradiated area while working in FOCUS mode. Note that the location imaged for FOCUS mode shows damage to the edge of the catalase crystal as well as a thinned circular region of vitreous ice. However, the adjacent area used for PHOTO mode remained unaltered and pristine for data collection and the single low-dose image did not cause any detectable damage. Scale bars represent 2 micrometers in (A&D) and 100 nanometers in (B&C).
The MDS interface is accessed by selecting “MDS” under the TEMCON “Alignment” tab and is activated upon clicking on the PHOTO mode button. To ensure the best high-resolution imaging capabilities, the microscope should be aligned in PHOTO mode. This can be done at the beginning of any microscope session. Once the microscope is optimally aligned in PHOTO mode, the user should select the appropriate magnification and brightness settings for the desired experiment. Next, all lens values should be recorded in a notebook for later reference. At this point the remaining modes can be setup. Ideally, the only differences between the three modes should be magnification, brightness, image shift and beam shift. Therefore, the first step in setting up the SEARCH and FOCUS modes is to guarantee that all three modes are initially perfectly aligned. To do this, the PHOTO mode lens values recorded in the laboratory notebook can be duplicated for both SEARCH and FOCUS modes. Now that all three modes are equivalent, SEARCH mode can be set to a low-magnification overview and perfectly centered with PHOTO mode by using a combination of beam shift and image shift. It should be noted that some researchers use a defocused diffraction pattern rather than low-magnification TEM for SEARCH mode. In this case, a focused diffraction pattern is defocused and projects an image of the sample onto the viewing screen that can be perfectly centered with PHOTO mode using the projector lens shift. In both cases, the beam diameter used for SEARCH mode should be large enough to minimize the electron dose during screening but bright enough to detect small or low contrast features. After successfully aligning SEARCH mode, the last step is to align FOCUS mode. Here, the magnification is usually the same or higher than that used for PHOTO mode to ensure the accuracy of defocus measurements. Using beam shift and image shift,
www.intechopen.com
The Transmission Electron Microscope 90
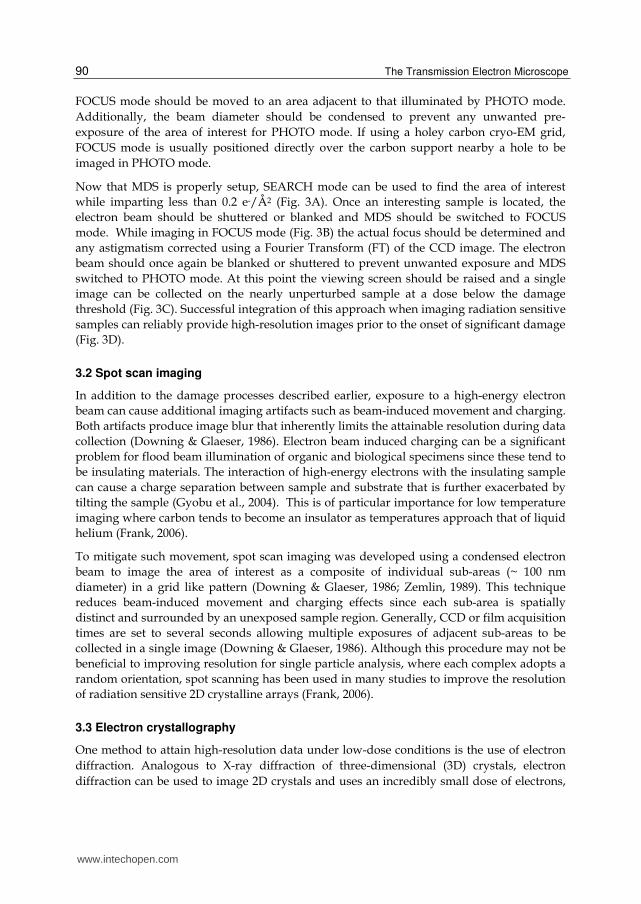
FOCUS mode should be moved to an area adjacent to that illuminated by PHOTO mode. Additionally, the beam diameter should be condensed to prevent any unwanted pre-exposure of the area of interest for PHOTO mode. If using a holey carbon cryo-EM grid, FOCUS mode is usually positioned directly over the carbon support nearby a hole to be imaged in PHOTO mode.
Now that MDS is properly setup, SEARCH mode can be used to find the area of interest while imparting less than 0.2 e-/Å2 (Fig. 3A). Once an interesting sample is located, the electron beam should be shuttered or blanked and MDS should be switched to FOCUS mode. While imaging in FOCUS mode (Fig. 3B) the actual focus should be determined and any astigmatism corrected using a Fourier Transform (FT) of the CCD image. The electron beam should once again be blanked or shuttered to prevent unwanted exposure and MDS switched to PHOTO mode. At this point the viewing screen should be raised and a single image can be collected on the nearly unperturbed sample at a dose below the damage threshold (Fig. 3C). Successful integration of this approach when imaging radiation sensitive samples can reliably provide high-resolution images prior to the onset of significant damage (Fig. 3D).
3.2 Spot scan imaging
In addition to the damage processes described earlier, exposure to a high-energy electron beam can cause additional imaging artifacts such as beam-induced movement and charging. Both artifacts produce image blur that inherently limits the attainable resolution during data collection (Downing & Glaeser, 1986). Electron beam induced charging can be a significant problem for flood beam illumination of organic and biological specimens since these tend to be insulating materials. The interaction of high-energy electrons with the insulating sample can cause a charge separation between sample and substrate that is further exacerbated by tilting the sample (Gyobu et al., 2004). This is of particular importance for low temperature imaging where carbon tends to become an insulator as temperatures approach that of liquid helium (Frank, 2006).
To mitigate such movement, spot scan imaging was developed using a condensed electron beam to image the area of interest as a composite of individual sub-areas (~ 100 nm diameter) in a grid like pattern (Downing & Glaeser, 1986; Zemlin, 1989). This technique reduces beam-induced movement and charging effects since each sub-area is spatially distinct and surrounded by an unexposed sample region. Generally, CCD or film acquisition times are set to several seconds allowing multiple exposures of adjacent sub-areas to be collected in a single image (Downing & Glaeser, 1986). Although this procedure may not be beneficial to improving resolution for single particle analysis, where each complex adopts a random orientation, spot scanning has been used in many studies to improve the resolution of radiation sensitive 2D crystalline arrays (Frank, 2006).
3.3 Electron crystallography
One method to attain high-resolution data under low-dose conditions is the use of electron diffraction. Analogous to X-ray diffraction of three-dimensional (3D) crystals, electron diffraction can be used to image 2D crystals and uses an incredibly small dose of electrons,
www.intechopen.com
Low-Dose Imaging Techniques for Transmission Electron Microscopy 91
0.5 e-/Å2, to generate enough signal to accurately describe high-resolution data (Schenk et al., 2010; Unwin & Henderson, 1975). This is possible because electron crystallography amplifies the redundant unit cell information within the crystal (Unwin & Henderson, 1975). The more unit cells imaged, the greater the signal for a given dose, as seen by bright spots corresponding to repetitive crystal spacings within the Fourier transform or diffraction image (Downing & Li, 2001). Currently, the highest resolution structure determined by electron microscopy was solved using electron diffraction (Gonen et al., 2005).
While electron diffraction suffers from the same lack of phase information as X-ray diffraction and requires some method of phase retrieval, there are several advantages over real space imaging. First, diffraction patterns are not effected by sample movement resulting from beam-induced charging or drift. Second, and arguably more important to resolution gain, much larger crystals can be imaged and used to generate more accurate diffraction spots through improved statistics (Downing & Li, 2001). Alternatively, gathering low-dose real-space images of 2D crystals provides both the phases and amplitudes of the diffraction spots in the FT. However, the Fourier transforms are subjected to information loss when the contrast transfer function equals zero, therefore, at least two images are needed to recover any missing information (Unwin & Henderson, 1975). Additonally, diffraction patterns do not exhibit the resolution-dependent falloff of spot amplitude generated during real-space imaging due to the contrast transfer function.
3.4 Single shot dynamic TEM
Single shot dynamic TEM (DTEM) has opened up an exciting new avenue for electron microscopy. Since high-energy electrons accelerated to 200 keV travel at approximately 2/3 the speed of light, only a single electron is within the microscope column at any given time for conventional TEM. However, for DTEM an ultrafast laser pulse illuminates a photocathode source causing upwards of 1 billion electrons to be photoemitted as a single packet on the nanosecond timescale (LaGrange et al., 2006). Since the number of electrons in a single pulse are fairly constant for a given laser power, the dose is determined by the beam diameter used during imaging. For example, 1 billion electrons spread to a beam diameter of 5.0 micrometers results in a dose of 0.5 e-/Å2 per pulse while a beam diameter of 1.2 micrometers would yield a dose of 8.8 e-/Å2. In addition, DTEM is compatible with MDS, and allows screening and focusing the sample in SEARCH and FOCUS modes using continuous wave laser pulses and then acquiring the final image with single shot pulsed mode.
Currently the major advance with this technology is the ability to study the transient behavior of materials such as reaction boundaries looking at deformation and phase transformations in inorganic materials (LaGrange et al., 2006). However, with brighter and faster pulses, DTEM may allow for “diffract then destroy” imaging of beam sensitive samples, in which the packet of electrons interacts with and passes through the sample before damage propagates and affects imaging (Reed et al., 2009). If this type of ultrafast imaging does “outrun” the mechanisms of damage, drift and movement, then doses far greater than 10 e-/Å2 could be used yielding greater contrast and higher resolution for cryo-EM structure determination of proteins. Second generation DTEMs are currently being
www.intechopen.com
The Transmission Electron Microscope 92
installed to evaluate such ultrafast imaging capabilities for organic material research (Evans et al., 2011).
4. Solving the attainable contrast versus resolution tradeoff
Contrast, by definition, is the difference in intensity of two adjacent pixels. Our eyes have difficulty detecting contrast at levels less than 10% and are unable to detect differences at 5% (Williams & Carter, 2004). The Rose Criterion was originally developed to estimate the visibility or detectability of an object within an X-Ray image based upon irradiation dose. However the Rose Criterion is also applicable to TEM imaging and suggests that to truly resolve a feature at any resolution, the signal needs to be 3-5 times the value of the average background or noise. Since the amount of signal is dependent on the sampling dose, there is a direct relationship between irradiation dose and attainable resolution (Yakovlev & Libera, 2008).
4.1 Identifying location of specimen within image due to low contrast
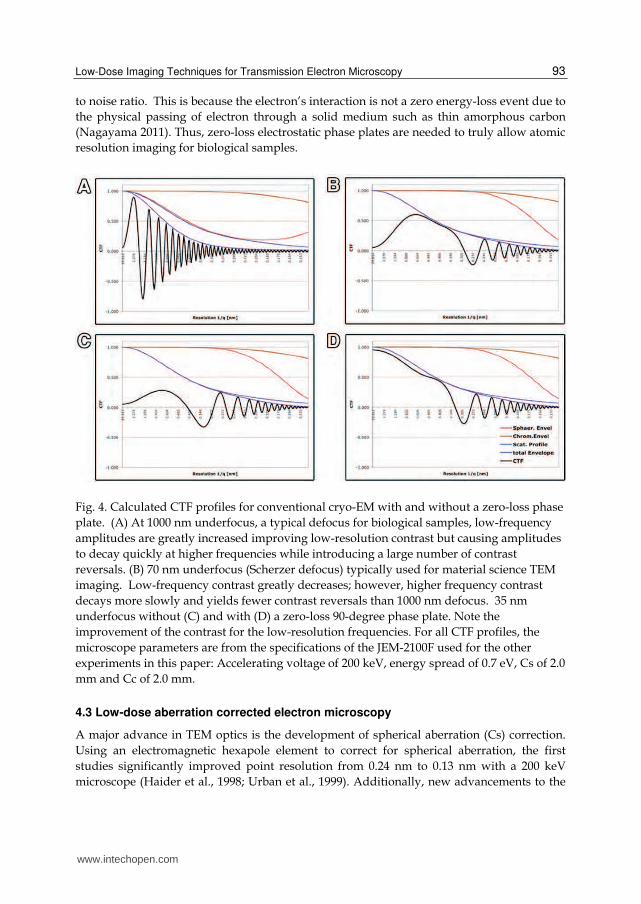
Low signal-to-noise ratios are the major limiting factor for high-resolution structure determination of beam sensitive samples (Evans et al., 2008; Okamoto, 2008). For organic specimens, the limited contrast is caused by a combination of the maximum dose allowed to maintain high-resolution structures (roughly 10 e-/Å2), and the low scattering cross-section of low atomic number elements that constitute the sample. In certain cases, the low signal-to noise may be so low that single proteins and 2D crystals may be indiscernible from the surrounding vitreous ice layer in cryo-EM at perfect focus. Therefore, to locate a given protein, it has been necessary to acquire significantly under-focused images at values ranging from 10-30 times Scherzer defocus (Evans et al., 2008) to enhance contrast of low-resolution components. Unfortunately, with the typical defocus used for cryo-EM, the contrast transfer function (CTF) exhibits many contrast reversals at high-resolution producing information gaps where the CTF equals zero and limiting the directly interpretable image information to the point resolution (Fig. 4A).
4.2 Phase shifting technology
Without advances in imaging technology, it is necessary to compromise resolution for contrast. One solution to this problem is the introduction of a phase plate in the back focal plane of the objective lens (Nagayama, 2011). With a phase device installed in the microscope, imaging can take place at or near Gaussian defocus (Fig. 4D) as compared to the 1-4 microns underfocus used for cryo-EM 3D reconstructions of single protein molecules (Fig. 4A). The resulting in-focus image has increased contrast at low-resolution while greatly flattening CTF reversals, yielding less data loss at higher frequencies (Figure 4). Ultimately, such increased contrast will permit more accurate angle assignments and alignment of single particles and 2D crystals for averaging and 3D reconstructions.
Unfortunately, the direct interaction of the electron with the phase plate is a major hurdle associated with current phase plate designs. In addition to changing the phase of the electron, the interaction between the phase plate material and the electron can result in secondary scattering that results in the loss of information and effectively reduces the signal
www.intechopen.com
Low-Dose Imaging Techniques for Transmission Electron Microscopy 93
to noise ratio. This is because the electron’s interaction is not a zero energy-loss event due to the physical passing of electron through a solid medium such as thin amorphous carbon (Nagayama 2011). Thus, zero-loss electrostatic phase plates are needed to truly allow atomic resolution imaging for biological samples.
Fig. 4. Calculated CTF profiles for conventional cryo-EM with and without a zero-loss phase plate. (A) At 1000 nm underfocus, a typical defocus for biological samples, low-frequency amplitudes are greatly increased improving low-resolution contrast but causing amplitudes to decay quickly at higher frequencies while introducing a large number of contrast reversals. (B) 70 nm underfocus (Scherzer defocus) typically used for material science TEM imaging. Low-frequency contrast greatly decreases; however, higher frequency contrast decays more slowly and yields fewer contrast reversals than 1000 nm defocus. 35 nm underfocus without (C) and with (D) a zero-loss 90-degree phase plate. Note the improvement of the contrast for the low-resolution frequencies. For all CTF profiles, the microscope parameters are from the specifications of the JEM-2100F used for the other experiments in this paper: Accelerating voltage of 200 keV, energy spread of 0.7 eV, Cs of 2.0 mm and Cc of 2.0 mm.
4.3 Low-dose aberration corrected electron microscopy
A major advance in TEM optics is the development of spherical aberration (Cs) correction. Using an electromagnetic hexapole element to correct for spherical aberration, the first studies significantly improved point resolution from 0.24 nm to 0.13 nm with a 200 keV microscope (Haider et al., 1998; Urban et al., 1999). Additionally, new advancements to the
www.intechopen.com
The Transmission Electron Microscope 94
aberration corrected microscope platform have given rise to imaging of inorganic specimens with sub-angstrom spatial resolution.
In order to study samples at atomic resolution, it was necessary to image at relatively high accelerating voltages, generally 200 keV or higher (Haider et al., 1998). These electrons have far more energy than needed to produce knock-on damage to graphitic carbon with a critical threshold at 60 keV (Egerton et al., 2004). Therefore, carbon-based samples will succumb to ionizing damage rather quickly. Using a low voltage (80 keV) Cs corrected microscope is one method to reduce or potentially eliminate knock-on damage. In addition, lower accelerating voltages are beneficial to sample preservation and also improve phase contrast. While low voltage Cs corrected microscopes may not have the point resolution of higher voltage microscopes, the added sample stability has the potential to allow the dose necessary to study single atom dynamics and EELS (Chuvilin et al., 2008). It should be noted that while low voltage electrons produce less knock-on damage, the slower electrons interact with the sample more frequently causing increased ionization and localized heating, both of which are potentially detrimental to image quality (Blanford & Carter, 2003).
4.3.1 Low-dose aberration corrected TEM
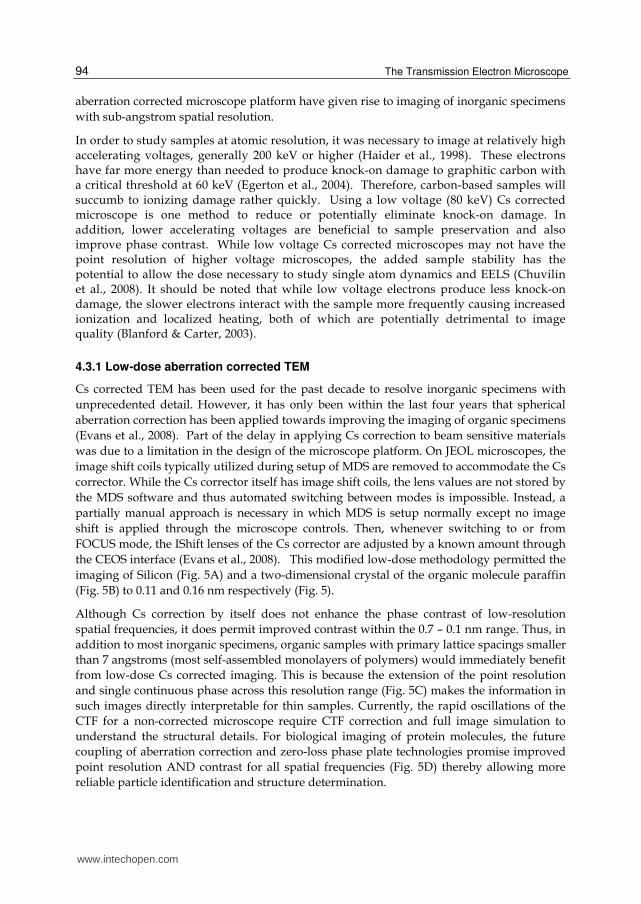
Cs corrected TEM has been used for the past decade to resolve inorganic specimens with unprecedented detail. However, it has only been within the last four years that spherical aberration correction has been applied towards improving the imaging of organic specimens (Evans et al., 2008). Part of the delay in applying Cs correction to beam sensitive materials was due to a limitation in the design of the microscope platform. On JEOL microscopes, the image shift coils typically utilized during setup of MDS are removed to accommodate the Cs corrector. While the Cs corrector itself has image shift coils, the lens values are not stored by the MDS software and thus automated switching between modes is impossible. Instead, a partially manual approach is necessary in which MDS is setup normally except no image shift is applied through the microscope controls. Then, whenever switching to or from FOCUS mode, the IShift lenses of the Cs corrector are adjusted by a known amount through the CEOS interface (Evans et al., 2008). This modified low-dose methodology permitted the imaging of Silicon (Fig. 5A) and a two-dimensional crystal of the organic molecule paraffin (Fig. 5B) to 0.11 and 0.16 nm respectively (Fig. 5).
Although Cs correction by itself does not enhance the phase contrast of low-resolution spatial frequencies, it does permit improved contrast within the 0.7 – 0.1 nm range. Thus, in addition to most inorganic specimens, organic samples with primary lattice spacings smaller than 7 angstroms (most self-assembled monolayers of polymers) would immediately benefit from low-dose Cs corrected imaging. This is because the extension of the point resolution and single continuous phase across this resolution range (Fig. 5C) makes the information in such images directly interpretable for thin samples. Currently, the rapid oscillations of the CTF for a non-corrected microscope require CTF correction and full image simulation to understand the structural details. For biological imaging of protein molecules, the future coupling of aberration correction and zero-loss phase plate technologies promise improved point resolution AND contrast for all spatial frequencies (Fig. 5D) thereby allowing more reliable particle identification and structure determination.
www.intechopen.com
Low-Dose Imaging Techniques for Transmission Electron Microscopy 95
Fig. 5. Analysis of low-dose aberration corrected TEM performance on inorganic Si (110) and organic paraffin crystal specimens recorded under low-dose cryo-conditions at 10 e-/Å2. (A) Under low-dose conditions, atomic fringes within the crystal lattice of Si (110) are directly visible. The Fourier transform in the upper right corner shows lattice spacings to 0.11 nm resolution. (B) Paraffin crystals, consisting of low atomic number elements carbon and hydrogen, directly show lattice fringes with Cs corrected optics to 0.16 nm resolution. (C&D) CTF simulations of a 200 keV Cs corrected microscope without (C) and with (D) a 90-degree phase shift from a zero-loss phase plate.
4.3.2 Low-dose aberration corrected STEM
Currently, Cs corrected scanning TEM (STEM) can achieve higher spatial resolution and better contrast for robust inorganic samples than Cs corrected TEM. The first description of low-dose Cs corrected STEM used a dedicated 200 keV Cs corrected JEOL 2100F/Cs retro-fitted with a CEOS Cs corrector. By reducing the dwell time for each pixel to 1.0 microseconds per pixel and reducing the beam current to about 1 pA with a pixel size of 0.4 Å2, atomic resolution could be seen in the power spectrum of strontium titanate crystal lattices. Although real space images could not discern any structures, Fourier filter algorithms detected reflections to 0.28 nm for Cs corrected STEM images at a dose of 15 e-/Å2 (Buban et al., 2010). Those results suggested that Cs corrected STEM can be used under low-dose conditions and achieve atomic resolutions that make it amenable to studying beam sensitive materials, however, further research is needed to prove the capabilities of the technique with organic specimens.
www.intechopen.com
The Transmission Electron Microscope 96
5. Conclusion
Proteins, polymers, zeolites, and ceramics are all examples of specimens that are sensitive to exposure by high-energy electrons (Csencsits & Gronsky, 1987; Glaeser, 1971; Revol & Manley, 1986). Cumulative exposure of such samples to high-energy electrons causes structural changes that limit interpretation of the native structure via bond breakage, displacement, and gas evolution (Frank, 2006; Williams & Carter, 2004). In particular, radiolysis damage destroys high-resolution information rather quickly once exposed to even a small number of electrons, typically 10 e-/Å2 for protein in cryo-EM (Frank, 2002). Therefore, in order to generate a high-resolution image at the appropriate focus, a method for limiting pre-exposure is needed to localize the sample and allow for proper defocusing prior to image acquisition. This is done using low-dose procedures that are easily adaptable and can be used in synergy with all of the other advanced imaging techniques mentioned above.
As it stands, this paper outlines methods to retain the maximum resolution of the sample, but no one technique alone allows for sub-angstrom imaging of beam sensitive biological materials. Future advances in technique and instrumentation must be developed in order to push through to the next level of resolution while maintaining the dose requirements needed to preserve native structures and dynamics. While structural biologists are limited to looking at static images of single proteins and protein crystals, new advances in in-situ stages have the potential of opening the door into protein dynamics that may require even lower radiation doses to ensure the integrity of enzyme functionality. In addition, new ways of dealing with even lower signal-to-noise, inherent with in-situ fluid stages, will most likely need development before high-resolution dynamics can be explored. As a result, this may only be possible by implementing DTEM with spherical and chromatic aberration correction as well as zero-loss obstruction-less phase optics and single-electron CCD detectors. If realized, rapid acquisition at the microsecond timescale could allow direct viewing of intermolecular conformational changes (McPherson and Eisenberg, 2011). Ultimately, moving to the nanosecond timescale could be possible with ultrafast imaging (Reed et al., 2009) and allow exploration of protein domain movements responsible for converting between an active and inactive functional state (McPherson & Eisenberg, 2011).
6. Acknowledgements
This work was supported by NIH grant number 5RC1GM091755.
7. References
Adrian, M.; Dubochet, J.; Lepault, J. & McDowall, A. W. (1984). Cryo-electron microscopy of viruses. Nature, Vol. 308, No. 5954: pp. 32-36, ISBN
Blanford, C. F. & Carter, C. B. (2003). Electron Radiation Damage of MCM-41 and Related Materials. Microscopy and Microanalysis, Vol. 9, No. 03: pp. 245-263, 1431-9276 ISBN
Buban, J. P.; Ramasse, Q.; Gipson, B.; Browning, N. D. & Stahlberg, H. (2010). High-resolution low-dose scanning transmission electron microscopy. Journal of Electron Microscopy, Vol. 59, No. 2: pp. 103-112, ISBN
Chiu, W.; Downing, K. H.; Dubochet, J.; Glaeser, R. M.; Heide, H. G.; Knapek, E.; Kopf, D. A.; Lamvik, M. K.; Lepault, J.; Robertson, J. D.; Zeitler, J. D. & Zemlin, F. (1987). Cryoprotection in electron microscopy. J. Microsc., Vol. 141, No.: pp. 385-391, ISBN
Chiu, W. & Jeng, T. W. (1982). Electron radiation sensitivity of protein crystals. Ultramicroscopy, Vol. 10, No. 1-2: pp. 63-69, 0304-3991 ISBN
www.intechopen.com
Low-Dose Imaging Techniques for Transmission Electron Microscopy 97
Chuvilin, A.; Kkaiser, U.; Obergfell, D.; Kkhlobystov, A. & Roth, S. (2008). Application of 80kV Cs-corrected TEM for nanocarbon materials. Proceedings of European Microscopy Conference, Aschen, Germany, month year
Csencsits, R. & Gronsky, R. (1987). Damage of zeolite Y in the TEM and its effects on TEM images. Ultramicroscopy, Vol. 23, No. 3-4: pp. 421-431, 0304-3991 ISBN
Downing, K. H. & Glaeser, R. M. (1986). Improvement in high resolution image quality of radiation-sensitive specimens achieved with reduced spot size of the electron beam. Ultramicroscopy, Vol. 20, No. 3: pp. 269-278, 0304-3991 ISBN
Downing, K. H. & Li, H. (2001). Accurate Recording and Measurement of Electron Diffraction Data in Structural and Difference Fourier Studies of Proteins. Microscopy and Microanalysis, Vol. 7, No. 05: pp. 407-417, ISBN
Dubochet, J.; Lepault, J.; Freeman, R.; Berriman, J. A. & Homo, J. C. (1982). Electron microscopy of frozen water and aqueous solutions. Journal of Microscopy, Vol. 128, No. 3: pp. 219-237, 1365-2818 ISBN
Egerton, R. F.; Li, P. & Malac, M. (2004). Radiation damage in the TEM and SEM. Micron, Vol. 35, No. 6: pp. 399-409, 0968-4328 ISBN
Evans, J. E.; Hetherington, C.; Kirkland, A.; Chang, L.-Y.; Stahlberg, H. & Browning, N. (2008). Low-dose aberration corrected cryo-electron microscopy of organic specimens. Ultramicroscopy, Vol. 108, No. 12: pp. 1636-1644, 0304-3991 ISBN
Frank, J. (2002). SINGLE-PARTICLE IMAGING OF MACROMOLECULES BY CRYO-ELECTRON MICROSCOPY. Annual Review of Biophysics and Biomolecular Structure, Vol. 31, No. 1: pp. 303-319, 1056-8700 ISBN
Frank, J. (2006). Three dimensional electron microscopy of macromolecular assemblies: Visualization of biological molecules in their native state. (2nd), Oxford University Press, USA,
Fujiyoshi, Y. (1998). The structural study of membrane proteins by electron crystallography. Advances in Biophysics, Vol. 35, No. 0: pp. 25-80, 0065-227X ISBN
Girit, Ç. Ö.; Meyer, J. C.; Erni, R.; Rossell, M. D.; Kisielowski, C.; Yang, L.; Park, C.-H.; Crommie, M. F.; Cohen, M. L.; Louie, S. G. & Zettl, A. (2009). Graphene at the Edge: Stability and Dynamics. Science, Vol. 323, No. 5922: pp. 1705-1708, ISBN
Glaeser, R. M. (1971). Limitations to significant information in biological electron microscopy as a result of radiation damage. Journal of Ultrastructure Research, Vol. 36, No. 3-4: pp. 466-482, 0022-5320 ISBN
Gonen, T.; Cheng, Y.; Sliz, P.; Hiroaki, Y.; Fujiyoshi, Y.; Harrison, S. C. & Walz, T. (2005). Lipid-protein interactions in double-layered two-dimensional AQP0 crystals. Nature, Vol. 438, No. 7068: pp. 633-638, 0028-0836 ISBN
Gyobu, N.; Tani, K.; Hiroaki, Y.; Kamegawa, A.; Mitsuoka, K. & Fujiyoshi, Y. (2004). Improved specimen preparation for cryo-electron microscopy using a symmetric carbon sandwich technique. Journal of Structural Biology, Vol. 146, No. 3: pp. 325-333, 1047-8477 ISBN
Haider, M.; Rose, H.; Uhlemann, S.; Schwan, E.; Kabius, B. & Urban, K. (1998). A spherical-aberration-corrected 200 kV transmission electron microscope. Ultramicroscopy, Vol. 75, No. 1: pp. 53-60, 0304-3991 ISBN
Karuppasamy, M.; Karimi Nejadasl, F.; Vulovic, M.; Koster, A. J. & Ravelli, R. B. G. (2011). Radiation damage in single-particle cryo-electron microscopy: effects of dose and dose rate. Journal of Synchrotron Radiation, Vol. 18, No. 3: pp. 398-412, 0909-0495 ISBN
Knapek, E. & Dubochet, J. (1980). Beam damage to organic material is considerably reduced in cryo-electron microscopy. Journal of Molecular Biology, Vol. 141, No. 2: pp. 147-161, 0022-2836 ISBN
www.intechopen.com
The Transmission Electron Microscope 98
Kumar, S. & Adams, W. W. (1990). Electron beam damage in high temperature polymers. Polymer, Vol. 31, No. 1: pp. 15-19, 0032-3861 ISBN
Leapman, R. D. & Sun, S. (1995). Cryo-electron energy loss spectroscopy: observations on vitrified hydrated specimens and radiation damage. Ultramicroscopy, Vol. 59, No. 1-4: pp. 71-79, 0304-3991 ISBN
McPherson, A. & Eisenberg, D. (2011). Advances in Protein Chemistry & Structural Biology: Protein Structure and Diseases. In, R. Donev, pp. 189-190. Academic Press,
Meents, A.; Gutmann, S.; Wagner, A. & Schulze-Briese, C. (2010). Origin and temperature dependence of radiation damage in biological samples at cryogenic temperatures. Proceedings of the National Academy of Sciences, Vol. 107, No. 3: pp. 1094-1099, ISBN
Nagayama, K. (2011). Phase Plate Electron Microscopy Supramolecular Structure and Function 10. In, J. Brnjas-Kraljević and G. Pifat-Mrzljak, pp. 101-113. Springer Netherlands, 978-94-007-0893-8,
Okamoto, H. (2008). Noise suppression by active optics in low-dose electron microscopy. Appl. Phys. Lett., Vol. 92, No. 6: pp. 063901, ISBN
Pan, M. & Crozier, P. A. (1993). Quantitative imaging and diffraction of zeolites using a slow-scan CCD camera. Ultramicroscopy, Vol. 52, No. 3-4: pp. 487-498, 0304-3991 ISBN
Reed, B. W.; Armstrong, M. R.; Browning, N. D.; Campbell, G. H.; Evans, J. E.; LaGrange, T. & Masiel, D. J. (2009). The evolution of ultrafast electron microscope instrumentation. Microsc Microanal, Vol. 15, No. 4: pp. 272-281, 1435-8115 (Electronic) 1431-9276 (Linking) ISBN
Revol, J. F. & Manley, R. S. J. (1986). Lattice imaging in polyethylene single crystals. Journal of Materials Science Letters, Vol. 5, No. 3: pp. 249-251, 0261-8028 ISBN
Schenk, A. D.; Castaño-Díez, D.; Gipson, B.; Arheit, M.; Zeng, X. & Stahlberg, H. (2010). Chapter Four - 3D Reconstruction from 2D Crystal Image and Diffraction Data. In: Methods in Enzymology, J. J. Grant, pp. 101-129. Academic Press, 0076-6879,
Sun, J. & Li, H. (2010). Chapter Ten - How to Operate a Cryo-Electron Microscope. In: Methods in Enzymology, J. J. Grant, pp. 231-249. Academic Press, 0076-6879,
Taylor, K. A. & Glaeser, R. M. (1976). Electron microscopy of frozen hydrated biological specimens. Journal of Ultrastructure Research, Vol. 55, No. 3: pp. 448-456, 0022-5320 ISBN
Thach, R. E. & Thach, S. S. (1971). Damage to biological samples caused by the electron beam during electron microscopy. Biophysical journal, Vol. 11, No. 2: pp. 204-210, ISBN
Ugurlu, O.; Haus, J.; Gunawan, A. A.; Thomas, M. G.; Maheshwari, S.; Tsapatsis, M. & Mkhoyan, K. A. (2011). Radiolysis to knock-on damage transition in zeolites under electron beam irradiation. Physical Review B, Vol. 83, No. 11: pp. 113408, ISBN
Unwin, P. N. & Henderson, R. (1975). Molecular structure determination by electron microscopy of unstained crystalline specimens. Journal of Molecular Biology, Vol. 94, No. 3: pp. 425-440, 0022-2836 ISBN
Urban, K.; Kabius, B.; Haider, M. & Rose, H. (1999). A way to higher resolution: spherical-aberration correction in a 200 kV transmission electron microscope. Journal of Electron Microscopy, Vol. 48, No. 6: pp. 821-826, ISBN
Williams, D. B. & Carter, C. B. (2004). Transmission Electron Microscopy: A textbook for materials science. (1st), Springer,
Yakovlev, S. & Libera, M. (2008). Dose-limited spectroscopic imaging of soft materials by low-loss EELS in the scanning transmission electron microscope. Micron, Vol. 39, No. 6: pp. 734-740, 0968-4328 ISBN
Zemlin, F. (1989). Dynamic focussing for recording images from tilted samples in small-spot scanning with a transmission electron microscope. Journal of Electron Microscopy Technique, Vol. 11, No. 4: pp. 251-257, 1553-0817 ISBN
www.intechopen.com
The Transmission Electron MicroscopeEdited by Dr. Khan Maaz
ISBN 978-953-51-0450-6Hard cover, 392 pagesPublisher InTechPublished online 04, April, 2012Published in print edition April, 2012
InTech EuropeUniversity Campus STeP Ri Slavka Krautzeka 83/A 51000 Rijeka, Croatia Phone: +385 (51) 770 447 Fax: +385 (51) 686 166www.intechopen.com
InTech ChinaUnit 405, Office Block, Hotel Equatorial Shanghai No.65, Yan An Road (West), Shanghai, 200040, China
Phone: +86-21-62489820 Fax: +86-21-62489821
The book "The Transmission Electron Microscope" contains a collection of research articles submitted byengineers and scientists to present an overview of different aspects of TEM from the basic mechanisms anddiagnosis to the latest advancements in the field. The book presents descriptions of electron microscopy,models for improved sample sizing and handling, new methods of image projection, and experimentalmethodologies for nanomaterials studies. The selection of chapters focuses on transmission electronmicroscopy used in material characterization, with special emphasis on both the theoretical and experimentalaspect of modern electron microscopy techniques. I believe that a broad range of readers, such as students,scientists and engineers will benefit from this book.
How to referenceIn order to correctly reference this scholarly work, feel free to copy and paste the following:
David B. Carlson and James E. Evans (2012). Low-Dose Imaging Techniques for Transmission ElectronMicroscopy, The Transmission Electron Microscope, Dr. Khan Maaz (Ed.), ISBN: 978-953-51-0450-6, InTech,Available from: http://www.intechopen.com/books/the-transmission-electron-microscope/low-dose-imaging-techniques-for-transmission-electron-microscopy

© 2012 The Author(s). Licensee IntechOpen. This is an open access articledistributed under the terms of the Creative Commons Attribution 3.0License, which permits unrestricted use, distribution, and reproduction inany medium, provided the original work is properly cited.