Low Cost Steel Bridge Pile Inspection...
31
High-Speed Rail IDEA Program Low Cost Steel Bridge Pile Inspection Technology Final Report for High-Speed Rail IDEA Project 57 Prepared by: Thomas R. Hay WavesinSolids LLC State College, PA October 2009
Transcript of Low Cost Steel Bridge Pile Inspection...

High-Speed Rail IDEA Program
Low Cost Steel Bridge Pile Inspection Technology
Final Report for High-Speed Rail IDEA Project 57 Prepared by: Thomas R. Hay WavesinSolids LLC State College, PA October 2009

INNOVATIONS DESERVING EXPLORATORY ANALYSIS (IDEA) PROGRAMS MANAGED BY THE TRANSPORTATION RESEARCH BOARD This investigation was performed as part of the High-Speed Rail IDEA program supports innovative methods and technology in support of the Federal Railroad Administration’s (FRA) next-generation high-speed rail technology development program. The High-Speed Rail IDEA program is one of four IDEA programs managed by TRB. The other IDEA programs are listed below. NCHRP Highway IDEA focuses on advances in the design, construction, safety, and maintenance of highway
systems, is part of the National Cooperative Highway Research Program. Transit IDEA focuses on development and testing of innovative concepts and methods for improving transit
practice. The Transit IDEA Program is part of the Transit Cooperative Research Program, a cooperative effort of the Federal Transit Administration (FTA), the Transportation Research Board (TRB) and the Transit Development Corporation, a nonprofit educational and research organization of the American Public Transportation Association. The program is funded by the FTA and is managed by TRB.
Safety IDEA focuses on innovative approaches to improving motor carrier, railroad, and highway safety. The program is supported by the Federal Motor Carrier Safety Administration and the FRA.
Management of the four IDEA programs is integrated to promote the development and testing of nontraditional and innovative concepts, methods, and technologies for surface transportation. For information on the IDEA programs, contact the IDEA programs office by telephone (202-334-3310); by fax (202-334-3471); or on the Internet at http://www.trb.org/idea IDEA Programs Transportation Research Board 500 Fifth Street, NW Washington, DC 20001
The project that is the subject of this contractor-authored report was a part of the Innovations Deserving Exploratory Analysis (IDEA) Programs, which are managed by the Transportation Research Board (TRB) with the approval of the Governing Board of the National Research Council. The members of the oversight committee that monitored the project and reviewed the report were chosen for their special competencies and with regard for appropriate balance. The views expressed in this report are those of the contractor who conducted the investigation documented in this report and do not necessarily reflect those of the Transportation Research Board, the National Research Council, or the sponsors of the IDEA Programs. This document has not been edited by TRB. The Transportation Research Board of the National Academies, the National Research Council, and the organizations that sponsor the IDEA Programs do not endorse products or manufacturers. Trade or manufacturers' names appear herein solely because they are considered essential to the object of the investigation.

Low Cost Steel Bridge Pile Inspection Technology
IDEA Program Final Report
For the Period June/2007 through December/2008 HSR-57
Prepared for The IDEA Program
Transportation Research Board National Research Council
PI: Thomas R. Hay WavesinSolids LLC
2134 Sandy Drive, Suite 14 State College, PA 16803
Submittal Date
October 14, 2009

IDEA PROGRAM
Funding and technical support for this project was provided by the High-Speed Rail IDEA Program. The mission of the High-Speed Rail-IDEA Program is to foster innovation in rail transportation by providing start-up R&D funding and support for promising but unproven concepts.
The High-Speed Rail-IDEA Program is funded by the Federal Railroad administration and managed by the Transportation Research Board (TRB) of the National Research Council. The High-Speed Rail-IDEA Program is one of four IDEA programs managed by TRB. The other three are Highway IDEA, Transit IDEA, and Safety IDEA..
NCHRP Highway IDEA, which focuses on advances in the design, construction, safety, and maintenance of
highway systems, is part of the National Cooperative Highway Research Program. Transit IDEA, which seeks advances in efficiency, safety, and maintenance of transit systems, is part of the
Transit Cooperative Research Program and funded by the Federal Transit Administration. Safety IDEA focuses on innovative approaches to improving railroad, intercity bus, and truck safety. The
program is supported by the Federal Motor Carrier Safety Administration and the FRA. IDEA programs support new concepts often too risky for traditional R&D funding. The focus is on concepts with potential for technology breakthroughs rather than incremental improvements to conventional technology.
Proposals to the IDEA program are welcome from any business, organization, institution, or individual. All proposals are evaluated by committees established by TRB. Technical guidance for projects is provided by expert panels with members that possess relevant technical expertise and that represent the user community for the specific IDEA product under development.
Additional information can be obtained on the IDEA website at: www.trb.org/idea
The publication of this report does not necessarily indicate approval or endorsement of the findings, technical
opinions, conclusions, or recommendations, either inferred or specifically expressed therein, by the National
Academy of Sciences or the sponsors of the IDEA programs from the United States Government.
i
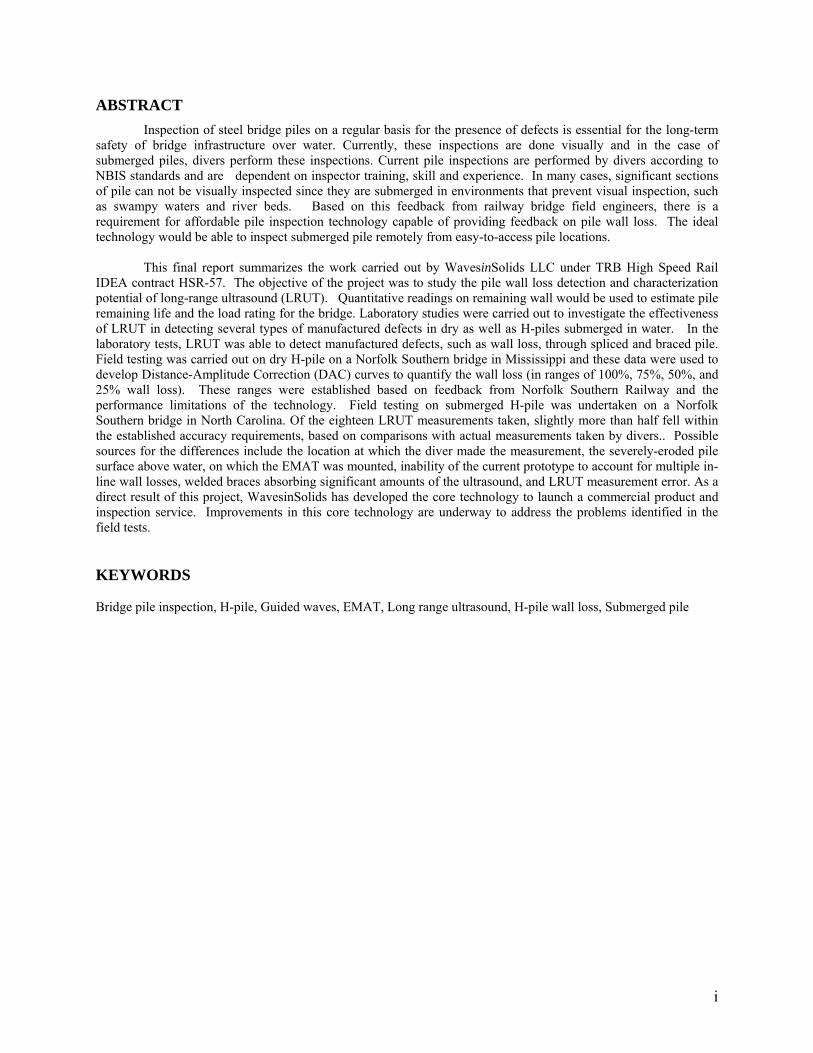
ABSTRACT
Inspection of steel bridge piles on a regular basis for the presence of defects is essential for the long-term safety of bridge infrastructure over water. Currently, these inspections are done visually and in the case of submerged piles, divers perform these inspections. Current pile inspections are performed by divers according to NBIS standards and are dependent on inspector training, skill and experience. In many cases, significant sections of pile can not be visually inspected since they are submerged in environments that prevent visual inspection, such as swampy waters and river beds. Based on this feedback from railway bridge field engineers, there is a requirement for affordable pile inspection technology capable of providing feedback on pile wall loss. The ideal technology would be able to inspect submerged pile remotely from easy-to-access pile locations. This final report summarizes the work carried out by WavesinSolids LLC under TRB High Speed Rail IDEA contract HSR-57. The objective of the project was to study the pile wall loss detection and characterization potential of long-range ultrasound (LRUT). Quantitative readings on remaining wall would be used to estimate pile remaining life and the load rating for the bridge. Laboratory studies were carried out to investigate the effectiveness of LRUT in detecting several types of manufactured defects in dry as well as H-piles submerged in water. In the laboratory tests, LRUT was able to detect manufactured defects, such as wall loss, through spliced and braced pile. Field testing was carried out on dry H-pile on a Norfolk Southern bridge in Mississippi and these data were used to develop Distance-Amplitude Correction (DAC) curves to quantify the wall loss (in ranges of 100%, 75%, 50%, and 25% wall loss). These ranges were established based on feedback from Norfolk Southern Railway and the performance limitations of the technology. Field testing on submerged H-pile was undertaken on a Norfolk Southern bridge in North Carolina. Of the eighteen LRUT measurements taken, slightly more than half fell within the established accuracy requirements, based on comparisons with actual measurements taken by divers.. Possible sources for the differences include the location at which the diver made the measurement, the severely-eroded pile surface above water, on which the EMAT was mounted, inability of the current prototype to account for multiple in-line wall losses, welded braces absorbing significant amounts of the ultrasound, and LRUT measurement error. As a direct result of this project, WavesinSolids has developed the core technology to launch a commercial product and inspection service. Improvements in this core technology are underway to address the problems identified in the field tests. KEYWORDS Bridge pile inspection, H-pile, Guided waves, EMAT, Long range ultrasound, H-pile wall loss, Submerged pile
ii
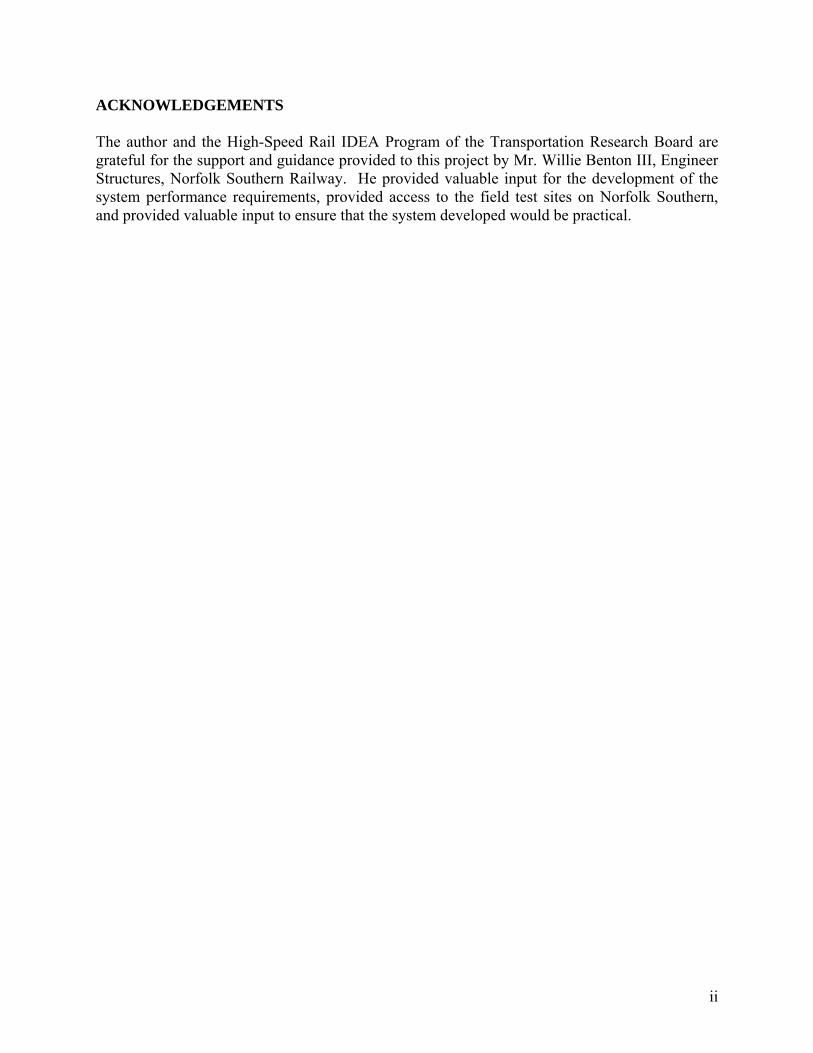
ACKNOWLEDGEMENTS The author and the High-Speed Rail IDEA Program of the Transportation Research Board are grateful for the support and guidance provided to this project by Mr. Willie Benton III, Engineer Structures, Norfolk Southern Railway. He provided valuable input for the development of the system performance requirements, provided access to the field test sites on Norfolk Southern, and provided valuable input to ensure that the system developed would be practical.

iii
TABLE OF CONTENTS
ABSTRACT ...................................................................................................................................................................i ACKNOWLEDGEMENTS…………………………………………………………………………………………....ii EXECUTIVE SUMMARY ........................................................................................................................................ivv 1. BACKGROUND AND OBJECTIVES .................................................................................................................1 2. DESCRIPTION OF IDEA PRODUCT .................................................................................................................3 3. CONCEPT AND INNOVATION .........................................................................................................................4 4. INVESTIGATION ................................................................................................................................................5
4.1 Modeling of Guided Wave Propagation in H-pile and Fabrication of EMATs ...................................................5 4.2 Documentation of H-pile Inspection Specifications ............................................................................................7 4.3 Laboratory Testing ..............................................................................................................................................7 4.3.1 Results from Laboratory Tests..........................................................................................................................9 4.4 Field Testing ......................................................................................................................................................12 4.4.1. H-Pile Field Inspection Procedure.................................................................................................................13 4.4.2 Results from Field Inspection of H-piles in Mississippi.................................................................................13 4.5 Development of Data Interpretation Procedure .................................................................................................14 4.6 Evaluation of Data Interpretation Procedure .....................................................................................................16 4.7 Limitations of Technology ...............................................................................................................................18
5. PROJECT PANEL ..............................................................................................................................................20 6. SUMMARY OF RESULTS ................................................................................................................................20 7. IMPLEMENTATION..........................................................................................................................................21 GLOSSARY................................................................................................................................................................21

iv
EXECUTIVE SUMMARY
The goal of this project was to develop long range ultrasonic technology (LRUT) for submerged bridge pile wall loss detection and characterization. During this project, electromagnetic acoustic transducers (EMATs) were used to generate shear-horizontal waves (SH-waves) that have the unique capability to inspect submerged H-pile. Compared to other types of ultrasonic guided waves, these waves are not attenuated significantly by water. A prototype hand-held EMAT scanner for H-pile inspection was developed during this project and a simple interpretation procedure to quantify the observed wall losses was also developed. Bridge piles are currently visually inspected annually. Pile inspections as carried out currently, are highly subjective and will vary depending on the inspector’s training, skill and experience. Submerged piles are typically inspected using divers. In many cases, significant sections of pile cannot be visually inspected since they are submerged in environments, such as swamp water and river beds, that prevent visual inspection. The condition of underwater bridge substructures was determined to be the cause for several bridge collapses over the last few decades. Therefore, there is a requirement for affordable pile inspection technology capable of providing feedback on the condition of bridge piles. The ideal technology would be able to inspect submerged pile remotely at easy-to-access pile locations above water. Quantitative readings on remaining wall could then be used to estimate pile remaining life and load rating for the bridge. Submerged H-piles are difficult to inspect visually since access to the structure is limited. Long range ultrasound (sometimes referred to as guided waves) is currently being used to inspect underground pipelines and the inspection of long sections of rail lends itself naturally to this technology. Long-range ultrasound can penetrate underneath coatings, water, soil, and mud to provide quantitative feedback on the H-pile remaining wall thicknesses. The investigative approach for this project involved the following steps:
Modeling of long range ultrasound (LRUT) wave propagation in H-piles and fabrication of electromagnetic acoustic transducers (EMATs)
Documentation of H-pile inspection requirement specifications
Laboratory testing of the EMAT prototype for the inspection of dry and submerged H-piles with manufactured defects
Field testing of the EMAT prototype for the detection of wall loss in H-piles
Development of interpretation procedure to quantify wall loss in H-piles
The performance specifications were defined in collaboration with the Norfolk Southern Railway Corporation (NSCORP) in terms of wall loss. It was determined that the technology should be capable of detecting wall loss in 25%, 50%, 75%, and 100% increments. Wall loss in this scenario refers to the percentage of wall loss compared to the original pile wall thickness. Laboratory tests were conducted on H-pile sections obtained from NSCORP. Defects were machined into the H-pile flanges and webs to simulate wall loss. Experiments were conducted on dry as well as submerged piles. The LRUT using EMATs successfully demonstrated wall loss detection and location in the H-piles through braces and splices. Field tests were carried out on H-piles of NSCORP bridges in Mississippi and North Carolina. During these tests, measurements were made with the proposed technology and confirmed with measurements supplied by underwater divers. Data from different wall loss amounts were obtained at varying sensor-to-wall loss distances to develop distance-amplitude-correction (DAC) curves. Detailed pile inspection and interpretation procedures have been developed as a result of the laboratory and field tests. The data obtained using WinS’ prototype inspection system was compared with visual and ultrasonic thickness gage inspection data from the H-pile by underwater divers. Testing on submerged H-pile was undertaken in North Carolina. Of the eighteen LRUT measurements taken, ten (56%) were within the established accuracy requirements. Explanations for why the other observations fell outside the accuracy limits include one or a combination of the following:
The EMAT scanners, in some instances, had to be mounted on heavily-corroded pile surfaces. Heavy surface corrosion would require significant surface grinding to prepare the surface for testing. In severe cases, the surface may be too damaged for mounting the sensors.

v
Detection and characterization was possible beyond one pile brace or splice. The characterization beyond two may be difficult, as the welds absorb a significant amount of the ultrasound. This capability is untested at this point.
Detection and characterization of wall loss below large wall losses may be compromised since the majority of ultrasound is reflected back towards the sensors and not transmitted though the initial wall loss area. As a result, less energy will reach any deeper wall losses.
Another error source was the inherent LRUT measurement error.
The initial laboratory tests and field evaluation described in this report have lead to the development of improvements to the initial prototype, resulting in a first-generation H-pile wall inspection tool.

1
1. BACKGROUND AND OBJECTIVES
Inspection of bridge piles on a regular basis for the presence of defects is essential for the long term safety of bridge infrastructure over water. Currently these inspections are done visually and in the case of submerged piles, divers perform these inspections. Current pile inspection approaches are highly subjective and will vary depending on inspector training, skill and experience. In many cases, significant sections of pile can not be visually inspected since they are submerged in environments that prevent visual inspection. H-pile wall loss is of primary concern in aerobic water zones. Aerobic zones are those that exist only in the presence of air or free oxygen. Therefore, these zones are found near the water surface. The most severe wall loss is typically observed on the section of H-pile that experiences the most aerobic cycles. A description of common wall loss is shown in Figures 1. Wall loss commonly initiates towards the edge of the H-pile flange and is semi-circular in shape. The most severe wall loss is commonly towards the edge. Wall loss decreases towards middle of the beam. Wall loss is observed on the top and bottom surfaces of the flange.
FIGURE 1 Common Wall loss in H-pile
The following sources/mechanisms are common causes of and accelerators of wall loss:
Submersion and oxidation cycles in aerobic zones
Impact damage
Tannic acid in water due to local vegetation run-off
Acid rain
Coastal zone fusion
The sand blast effect on submerged h-pile in rivers accelerates wall loss. Flanges are particularly susceptible to this effect since 99% of flanges are perpendicular to the track and are therefore parallel to the river current
Ultrasonic guided waves can travel hundreds of feet in straight sections of pipes, plates etc., since the wave is confined and guided by the inner and outer boundaries. Long Range Ultrasonic Testing (LRUT) provides a sound basis for determining the need for and timing of maintenance actions on specific H-pile. This technology developed in this project will make information from LRUT much more widely available on a more cost effective basis. It will provide the bridge owner/operator directly with timely data on the bridge without the need for extensive inspector/analyst intervention. The net result will be improved bridge reliability and safety.

2
The objectives of the efforts carried out by WavesinSolids were to:
Model guided ultrasonic wave propagation in H-piles and fabricate EMATs
Document of H-pile inspection requirement specifications
Carry out laboratory testing of the EMAT prototype for the inspection of dry and submerged H-piles with manufactured defects
Conduct field testing of the EMAT prototype for the detection of wall loss in H-piles
Develop interpretation procedure to quantify wall loss in H-piles
3
2. DESCRIPTION OF IDEA PRODUCT
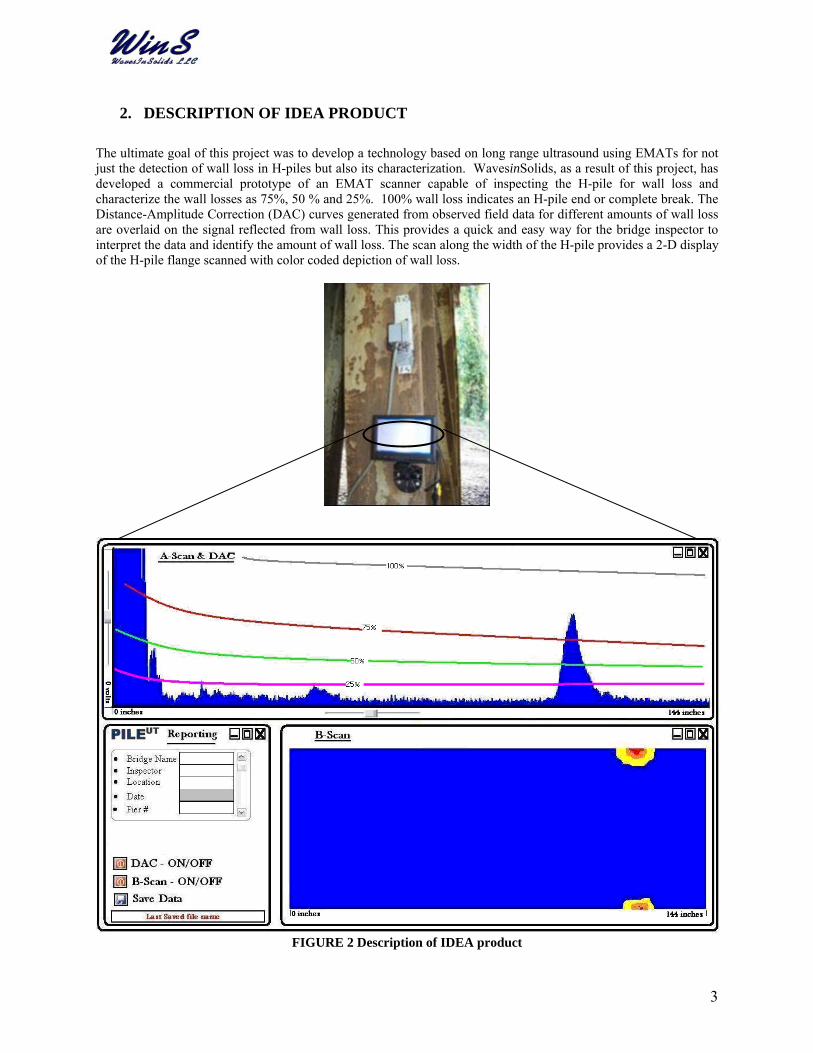
The ultimate goal of this project was to develop a technology based on long range ultrasound using EMATs for not just the detection of wall loss in H-piles but also its characterization. WavesinSolids, as a result of this project, has developed a commercial prototype of an EMAT scanner capable of inspecting the H-pile for wall loss and characterize the wall losses as 75%, 50 % and 25%. 100% wall loss indicates an H-pile end or complete break. The Distance-Amplitude Correction (DAC) curves generated from observed field data for different amounts of wall loss are overlaid on the signal reflected from wall loss. This provides a quick and easy way for the bridge inspector to interpret the data and identify the amount of wall loss. The scan along the width of the H-pile provides a 2-D display of the H-pile flange scanned with color coded depiction of wall loss.
FIGURE 2 Description of IDEA product

4
3. CONCEPT AND INNOVATION
Using WavesinSolids’ LRUT inspection technology, it is possible to inspect submerged pile from above the water line. Current methods for underwater inspection of submerged bridge structures require that divers visually inspect 100% of the underwater structures. The developed technology will be cost-effective because it minimizes the requirement to send divers underwater to inspect all piles for wall loss or failure. The inspection principle using LRUT is illustrated in Figure 3. Guided wave transducers (EMATs) are mounted above the waterline. LRUT is generated above the waterline and then travels underwater then underground. Where wall loss is present, ultrasound is partially reflected backwards and transmitted forward. The reflected ultrasound locates and sizes the wall loss. This TRB project is the first effort to apply guided wave ultrasound to H-pile inspection.
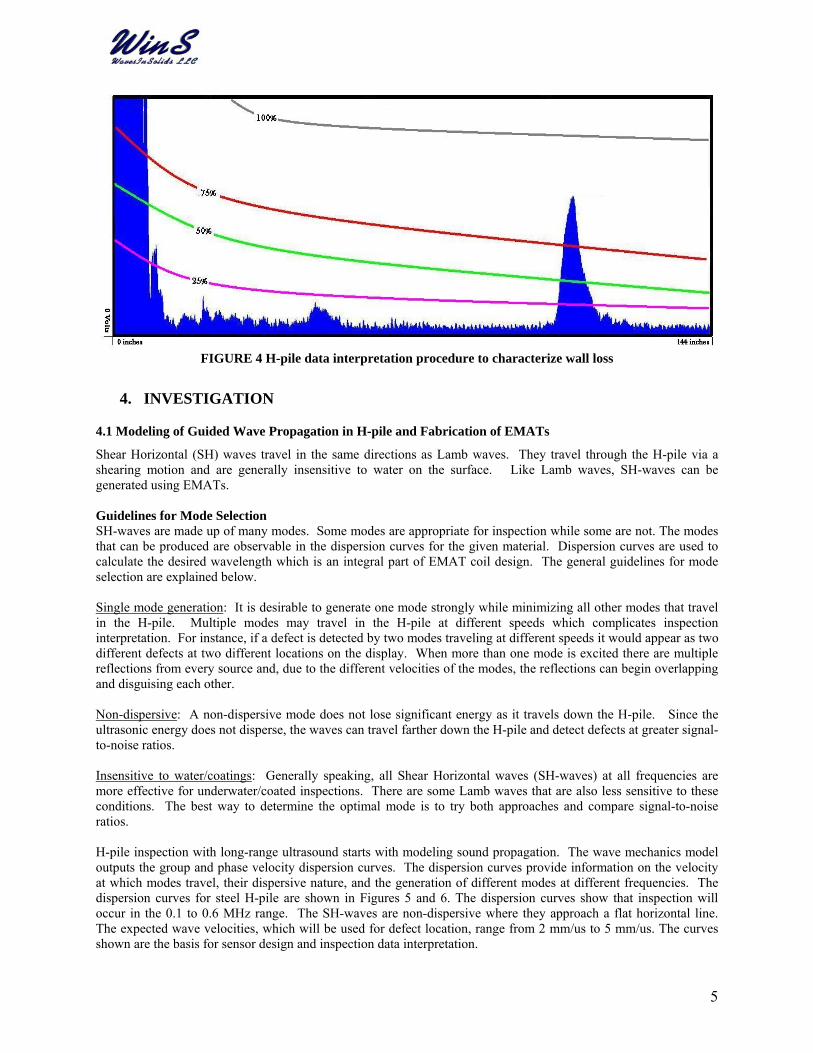
FIGURE 3 H-pile inspection principle using long range ultrasound generated by EMATs The objective of the inspection is not only to detect wall loss in H-piles but also to characterize it in terms of 25%, 50%, 75% and 100% wall loss. The ability to characterize wall loss is accomplished using Distance Amplitude Correction (DAC) curves for each wall loss category. DAC curves are calculated using experimental data from known wall loss. For instance, to generate the 50% DAC curve data were acquired from more than 10 pile flanges with approximately 50% wall loss at sensor-to-wall loss distances ranging from 18 to 100 inches. The amplitudes of the reflections were used to generate the 50% wall loss DAC. The same procedure was used for the 25%, 75% and 100% wall loss scenarios. Once the DACs are superimposed on to the amplitude scan (A-scan), interpretation becomes quick and easy. In Figure 4, a reflection exceeds the 75% wall loss DAC at approximately 100 inches. This means there is 75% wall loss at 100 inches from the sensor location.
5
FIGURE 4 H-pile data interpretation procedure to characterize wall loss
4. INVESTIGATION
4.1 Modeling of Guided Wave Propagation in H-pile and Fabrication of EMATs
Shear Horizontal (SH) waves travel in the same directions as Lamb waves. They travel through the H-pile via a shearing motion and are generally insensitive to water on the surface. Like Lamb waves, SH-waves can be generated using EMATs. Guidelines for Mode Selection SH-waves are made up of many modes. Some modes are appropriate for inspection while some are not. The modes that can be produced are observable in the dispersion curves for the given material. Dispersion curves are used to calculate the desired wavelength which is an integral part of EMAT coil design. The general guidelines for mode selection are explained below. Single mode generation: It is desirable to generate one mode strongly while minimizing all other modes that travel in the H-pile. Multiple modes may travel in the H-pile at different speeds which complicates inspection interpretation. For instance, if a defect is detected by two modes traveling at different speeds it would appear as two different defects at two different locations on the display. When more than one mode is excited there are multiple reflections from every source and, due to the different velocities of the modes, the reflections can begin overlapping and disguising each other. Non-dispersive: A non-dispersive mode does not lose significant energy as it travels down the H-pile. Since the ultrasonic energy does not disperse, the waves can travel farther down the H-pile and detect defects at greater signal-to-noise ratios. Insensitive to water/coatings: Generally speaking, all Shear Horizontal waves (SH-waves) at all frequencies are more effective for underwater/coated inspections. There are some Lamb waves that are also less sensitive to these conditions. The best way to determine the optimal mode is to try both approaches and compare signal-to-noise ratios. H-pile inspection with long-range ultrasound starts with modeling sound propagation. The wave mechanics model outputs the group and phase velocity dispersion curves. The dispersion curves provide information on the velocity at which modes travel, their dispersive nature, and the generation of different modes at different frequencies. The dispersion curves for steel H-pile are shown in Figures 5 and 6. The dispersion curves show that inspection will occur in the 0.1 to 0.6 MHz range. The SH-waves are non-dispersive where they approach a flat horizontal line. The expected wave velocities, which will be used for defect location, range from 2 mm/us to 5 mm/us. The curves shown are the basis for sensor design and inspection data interpretation.

6
0
0.5
1
1.5
2
2.5
3
3.5
0 0.1 0.2 0.3 0.4 0.5 0.6Frequency (MHz)
Gro
up
Ve
loci
ty (
mm
/us)
SH0
SH1
SH3
SH4SH5
FIGURE 5 SH-wave group velocity dispersion curves for 12.5-mm thick H-pile
0
1
2
3
4
5
6
7
8
0 0.1 0.2 0.3 0.4 0.5 0.6
Frequency (MHz)
Ph
as
e V
elo
cit
y (
mm
/us
)
6.3 mm wavelength
10.2 mm wavelength
SH0
SH1 SH2 SH3 SH4
FIGURE 6 SH-wave phase velocity dispersion curves for 12.5-mm thick H-pile showing the 10.2 and 6.3 mm wavelength activation lines.

7
Fabrication of EMATs A custom SH EMAT coil and magnet set, for testing steel H-pile, is shown in Figure 7. The coil pattern is etched on to both sides of flexible Kapton, a polyimide insulating material. Note that the same coil may be used with different sets of magnets. The thicker magnets sets are used to generate lower frequency (larger wavelength) guided waves. For example, the 6 mm wavelength ( of the generated wave is determined by the 3mm magnet width.
FIGURE 7 SH EMAT coil and magnets placed on top of coil to generate guided waves in H-pile
4.2 Documentation of H-pile Inspection Specifications
The inspection requirements are defined in terms of the submerged H-pile length to be inspected and the, wall loss size, and shape to be detected. The inspection requirements are listed in Table 1 and depicted in Figure 8. Inspection obstacles, including welded repairs and diagonal H-pile reinforcements, were to be identified as well. The inspection requirements were determined and documented after visits to bridge pile locations in Alabama, and also from helpful discussions with Mr. Willie Benton, and Assistant Bridge Engineer for NSCORP.
TABLE 1 Description of inspection specification requirements Item Specification Inspection depth underwater 3 to 9 feet Inspection depth underground 6” beyond water depth
Wall loss location Starts at edge of flange and works in towards web Minimum wall loss size 50% wall loss – 1” wide sectional loss. Wall loss size Circular and semicircular Obstacles through which system must perform Welded repairs and diagonal reinforcements
4.3 Laboratory Testing
Two H-pile sections were obtained from NSCORP. The first was a 10-foot section with a weld at approximately 4 feet from one end. Simulated defects were inserted in this specimen to determine if the LRUT technology can detect wall loss beyond a weld. On the second H-pile section, horizontal and diagonal H-Pile braces were welded to it on opposite sides (Figure 9). This specimen was used to determine if the LRUT technology can detect defects beyond braces and reinforcements. The diagonal brace was oriented at 45 to the longitudinal axis of the pile and was welded 5 inches into the flange. The horizontal brace was welded on to the pile at the same location with its edge located roughly 6 inches from the pile edge. In this specimen, simulated wall loss was inserted at the locations circled in Figure 9. The edge wall loss behind the diagonal brace measured 9 in. (L) x 3 in. (W). The circular wall loss behind the horizontal brace is of 4 inch diameter. The spliced pile and wall loss beyond the splice is shown in Figure 10. The circular wall loss behind the splice was 4 inches in diameter. Experiments were conducted for submerged piles as well (Figure 11). Drums of 9 feet height and 60 gallon capacity were used. There were two wall loss sections inserted at the middle and edge of the flange. The middle (circular) wall loss in the submerged pile was of 4-inch diameter. The wall loss at the edge of the flange measured 6 in. (L) by 3 in. (W). All wall loss was roughly 50% of the pile wall thickness or 0.25-inch deep.

8
FIGURE 8 Description of inspection requirements specifications
FIGURE 9 H-pile specimen with welded diagonal and horizontal braces (The locations of simulated wall loss beyond the braces are circled)
Common H-pile wall loss type
H-piles are typically submerged under 6 to 9 feet of water
Water level
Fill level
H-piles are drive 30-40 feet underground

9
FIGURE 10 Spliced pile with wall loss located beyond the defect FIGURE 11 Submerged pile
4.3.1 Results from Laboratory Tests
Braced Pile The objectives of these tests were to confirm that the long-rang ultrasound generated from above the pile bracing could penetrate through the bracing to detect a 50% wall loss beyond the bracing. Sample data from the braced pile are shown in Figure 12 for (a) edge and (b) interior wall loss, respectively. The wall loss was successfully identified (boxed) by the software as shown in these figures. The data shown was acquired at 66 inches from the wall loss. The bracings shown in Figure 9 were located approximately midway to the wall loss.
-2
-1.5
-1
-0.5
0
0.5
1
1.5
2
0 200 400 600 800 1000 1200
time (s)
Am
plitu
de
(V)
FIGURE 12(a) Edge wall loss detection through the diagonal braces from 66 inches away

10
-2
-1.5
-1
-0.5
0
0.5
1
1.5
2
0 200 400 600 800 1000 1200
time (us)
Am
plitu
de (
V)
FIGURE 12(b) Circular wall loss detection through the diagonal braces from 66 inches
Spliced Pile Testing was conducted to determine if long range ultrasound could penetrate through splices to detect wall loss beyond the splice. The full splice used for testing is shown in Figure 10. Sample data from the spliced pile is shown in Figure 13. The reflection from the simulated wall loss is observed at 48” from the scanner. The splice was located midway between the scanner and wall loss. The reflection from the wall loss is shown boxed in Figure 13 and is clearly observable above the baseline noise.
-2
-1.5
-1
-0.5
0
0.5
1
1.5
2
0 100 200 300 400 500 600 700 800 900 1000
time(s)
Am
plitu
de (
V)
FIGURE 13 Circular wall loss detection through splice from 48 inches

11
Submerged Pile Testing was undertaken on the submerged pile in a 9-foot drum which was filled with local creek water. Wall loss was machined into the H-pile. Data was acquired from the pile at different water levels to study the attenuation effect of the water. Data are presented here at minimum and maximum water depths for both wall losses. Data are presented for the edge wall loss in Figure 14. The distance to the defect from the scanner was 85 inches. The wall loss was 17 inches below the water level. The data shows that the ultrasonic wave attenuation in water in negligible, ~ 0.31 dB. Similar results are observed in Figure 15 for the circular wall loss. The data in Figure 15 was acquired at submerged depths of 40 inches. Again, negligible attenuation of the ultrasound reflected from the wall loss was observed, ~ 0.29 dB.
-2
-1.5
-1
-0.5
0
0.5
1
1.5
2
0 200 400 600 800 1000 1200 1400
time (s)
Am
plitu
de (
V)
FIGURE 14 Detection of edge wall loss 85 inches away from scanner through 17 inches of water
-2
-1.5
-1
-0.5
0
0.5
1
1.5
2
0 200 400 600 800 1000 1200 1400
time(s)
Am
plit
ud
e (V
)
FIGURE 15 Detection of Circular wall loss 72 inches from the scanner through 40 inches of water
12
4.4 Field Testing
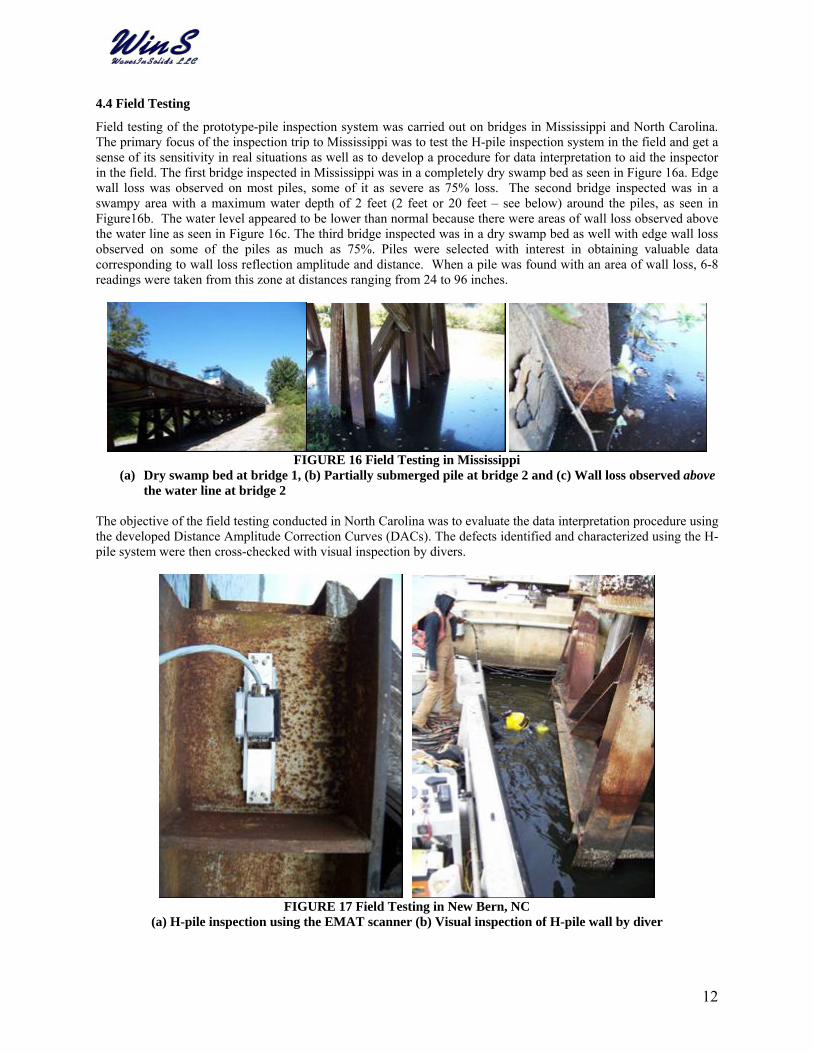
Field testing of the prototype-pile inspection system was carried out on bridges in Mississippi and North Carolina. The primary focus of the inspection trip to Mississippi was to test the H-pile inspection system in the field and get a sense of its sensitivity in real situations as well as to develop a procedure for data interpretation to aid the inspector in the field. The first bridge inspected in Mississippi was in a completely dry swamp bed as seen in Figure 16a. Edge wall loss was observed on most piles, some of it as severe as 75% loss. The second bridge inspected was in a swampy area with a maximum water depth of 2 feet (2 feet or 20 feet – see below) around the piles, as seen in Figure16b. The water level appeared to be lower than normal because there were areas of wall loss observed above the water line as seen in Figure 16c. The third bridge inspected was in a dry swamp bed as well with edge wall loss observed on some of the piles as much as 75%. Piles were selected with interest in obtaining valuable data corresponding to wall loss reflection amplitude and distance. When a pile was found with an area of wall loss, 6-8 readings were taken from this zone at distances ranging from 24 to 96 inches.
FIGURE 16 Field Testing in Mississippi
(a) Dry swamp bed at bridge 1, (b) Partially submerged pile at bridge 2 and (c) Wall loss observed above the water line at bridge 2
The objective of the field testing conducted in North Carolina was to evaluate the data interpretation procedure using the developed Distance Amplitude Correction Curves (DACs). The defects identified and characterized using the H-pile system were then cross-checked with visual inspection by divers.
FIGURE 17 Field Testing in New Bern, NC
(a) H-pile inspection using the EMAT scanner (b) Visual inspection of H-pile wall by diver

13
4.4.1. H-Pile Field Inspection Procedure
Before any inspection took place it was necessary to calibrate the system. Calibration of the system consisted of finding an H-pile with an unobstructed end. Bracing members were typically used. The scanner was placed 3 feet from this end and the data acquisition system settings were adjusted in such a way that the end reflection was maximized on the screen as seen Figure 18. Once calibrated, the system could not be shut down or adjusted in any way without at least confirming that the calibration was still accurate by taking another 3-foot end reading. This voltage level is then called “Full Screen Height Voltage at 3 feet (FSH @ 3 feet)”. This value is then used for standardizing future field data.
-0.5
-0.4
-0.3
-0.2
-0.1
0
0.1
0.2
0.3
0.4
0.5
0 200 400 600 800 1000
Time (us)
Am
pli
tue
d (
v)
FIGURE 18 Calibration Waveform
After calibration, defects were located either by visual inspection (if the pile was on dry ground) or by guided wave inspection (if the pile was submerged in water). Once a defect was found a reading was taken from 2 feet away, 3 feet away, 4 feet away, etc. When taking readings the scanner was placed approximately 2 inches from the edge of the pile and was maneuvered until the reflection from the wall loss was maximized. After the ultrasonic waveform data had been acquired, physical measurements of remaining thickness and length of loss were taken. For Bridge 3 (dry swamp bed) this same procedure was followed for every edge of every pile in one of the piers. Wall loss found in this group was between 25% loss and 75% loss.
4.4.2 Results from Field Inspection of H-piles in Mississippi
Wall loss found in the pile ranged from very minor edge loss to more severe edge loss (75%). Comparisons of the physical observations and resulting waveforms from the three categories of wall loss are shown in Figures 19 through 21. The percent wall loss was calculated using the ratio of remaining wall thickness and the measured thickness of the pile where no obvious wall loss was observed.
-1
-0.8
-0.6
-0.4
-0.2
0
0.2
0.4
0.6
0.8
1
0 500 1000 1500 2000
Time (us)
Am
pli
tue
d (
v)
Pile end
Wall loss

14
FIGURE 19 25% wall loss and corresponding waveform from 36 inches
-1
-0.8
-0.6
-0.4
-0.2
0
0.2
0.4
0.6
0.8
1
0 500 1000 1500 2000
Time (us)
Am
pli
tud
e (
v)
FIGURE 20 50% wall loss and corresponding waveform from 36 inches
-1
-0.8
-0.6
-0.4
-0.2
0
0.2
0.4
0.6
0.8
1
0 500 1000 1500 2000
Time (us)
Am
pli
tud
e (
v)
FIGURE 21 75% wall loss and corresponding waveform from 36 inches
4.5 Development of Data Interpretation Procedure
Interpretation of field test data will be assisted using software customized for the pile inspection application. A critical component for this interpretation is the Distance Amplitude Correction (DAC) curve for the H-pile. For example, a 50% wall loss at 36 in. from the EMAT sensors will provide a larger reflection than the same defect located at 72 inches due to distance attenuation. Both defects are the same size, however, and if interpretation is based uniquely on reflection amplitude the defect located at 72 inches may be mistaken for a smaller wall loss. The DAC curve accounts for the ultrasonic attenuation in the pile. Generation of a DAC curve for a specific structure and defect is a straightforward process. On the H-pile, data were acquired at increasing distances from the wall loss with reflection amplitudes recorded at each position. The amplitude and distance information are used to define the attenuation characteristics of the pile. Data in the field were categorized as 25%, 50%, 75% or 100% wall loss (pile end) from many different EMAT sensor distances from these wall loss defects. DAC curves for these wall loss amounts were obtained (using exponential fit to the data points Y = A0e
-αx, where Y is the waveform amplitude, A0 is a user-defined constant that adjusts the function’s bias, α is the attenuation coefficient that was obtained experimentally using the procedure describe above, and x is the distance from the scanner). Using the DAC curves the inspector should be able to classify wall loss waveforms as 25%, 50%, 75%, and 100% at some distance relative to the inspection location reference point. The first step in generating any DAC curve is to experimentally
Pile end
Wall loss
Pile end
Wall loss

15
determine the reflection amplitudes of wall loss from 25%, 50%, 75% and 100% wall loss at increasing sensor-to–wall-loss distances. This information was captured during the field tests. The DAC functions (Table 2) for each wall loss category are given here noting that they have a tolerance and do overlap. The second step is to normalize the DAC curves before any inspection to reflect relevant inspection conditions like surface roughness, paint, etc. This is accomplished through an instrument calibration procedure. Calibration was performed at a distance of 3 feet from an end of the H-Pile. The receiver gain is adjusted until the amplitude of the reflected signal from the H-pile end achieves Full Screen Height (FSH) Voltage. Full Screen Height (FSH) Voltage observed for this calibration is 0.5089 V. The DAC curves must be constructed as follows:
1. Establish baseline DAC using user-defined function. 2. Amplitude-adjust this DAC by multiplying the DAC function with the FSH voltage as shown in Table 2.
Table 2 DAC Curves for different H-pile wall loss amounts
Wall Loss Function
25% TBD
50% (0.14370.03306)*FSH*e-0.0029X
75% (0.16890.03179)*FSH*e-0.002X
100% (2.66370.1664)*FSH*e-0.024X
The DAC curves in Table 2 are shown in Figure 22. The upper and lower bounds for each wall loss amount (tolerance) were obtained using the standard deviation and were plotted in the DAC curves as shown in the same figure. Note that the 100% DAC is significantly higher than the other DACs. Note also that the other DACs are distributed over a much smaller voltage range. For this reason voltage scale adjustment will be incorporated into the display. The DAC curves displayed over a smaller voltage range are shown in Figure 23.
0
0.1
0.2
0.3
0.4
0.5
0.6
0.7
0.8
0.9
1
0 12 24 36 48 60 72 84 96 108Distance (inches)
Am
plit
ud
e (V
)
50% lossU
50% loss
50% loss L
75% loss U
75% Loss
75% loss L
100% loss U
100% loss
100% loss L

16
FIGURE 22 DAC Curves for H-pile wall losses of 100%, 75% and 50% with upper and lower bounds for each wall loss amount
0.08
0.1
0.12
0.14
0.16
0.18
0.2
0 12 24 36 48 60 72 84 96Distance (inches)
Am
plit
ude
(V)
50% lossU
50% loss
50% loss L
75% loss U
75% Loss
75% loss L
FIGURE 23 DAC Curves (Zoomed in on 50% and 75% wall loss)
4.6 Evaluation of Data Interpretation Procedure
The effectiveness of the DAC curves for identifying and characterizing wall loss in H-pile was tested by analyzing the waveform data obtained from H-piles (Mississippi) that were not utilized for developing these curves. For ease of interpretation and display, the waveform (Amplitude vs. Time or A-Scan) is rectified and the DAC curves are overlaid on it. The H-pile inspection system was used to characterize wall loss in H-piles in North Carolina and these results were compared to visual inspection performed by underwater divers who measured the H-pile remaining wall thickness using calipers. Figure 24 shows the rectified A-scan waveform from a defect (identified as 75% wall loss) that was located approximately 72 inches away from the EMAT scanner. The field data from this defect was not used to develop the DAC curves. The inspected H-pile was 10 feet in length (120 inches). The H-pile end was roughly 48 inches from the EMAT scanner. The DAC curves for 100%, 75% and 50% wall loss amounts were then overlaid on the A-Scan waveform. As can be seen from Figure 24, the A-scan has two significant peaks, one near the 48-inch mark and the other near the 72-inch mark. The first peak (at 48 inches) exceeds the DAC curve for the 100% wall loss, thereby identifying the H-pile end, and the one near the 72-inch mark, exceeds the 75% wall loss DAC curve. Thus, it could be seen that this data interpretation procedure could be used to characterize the wall loss defects in H-piles. Due to an extended drought, these inspections were carried out when the H-pile was standing in a water depth of only 6 inches and a mud depth of 6 inches. The EMAT scanner detected a 50% defect 6 feet (72 inches) from it (Figure 25). After the data were acquired, the mud around the H-pile was cleared to verify the presence of the wall loss defect. The remaining wall thickness was measured to be 0.3 inches and classified as a 50% wall loss (design thickness was 0.5 inches). The pile end was 48 inches from the scanner and a corresponding signal was seen in the A-scan waveform but not picked up by the “100% DAC”. This could be due to the presence of braces near the pile end which reduces the amplitude of the reflected signal. Accommodations for such situations will be incorporated in the DAC curves in the future.

17
0
0.1
0.2
0.3
0.4
0.5
0.6
0.7
0.8
0.9
1
0 12 24 36 48 60 72 84 96 108 120
Distance (in)
Am
pli
tud
e (
V)
50%
75%
100%
Rectified A-scan Waveform
FIGURE 24 Rectified A-scan Waveform and the DACs overlaid showing the 75% wall loss defect “identified”
Bridge2-Defect6-6"water-6"Mud
0
0.1
0.2
0.3
0.4
0.5
0.6
0.7
0.8
0.9
1
0 12 24 36 48 60 72 84 96 108 120
Distance (in.)
Am
pli
tud
e (V
)
50%L
50%
50%U
100%
75%
A-scan
FIGURE 25 50% Wall loss defect identified by the H-pile inspection system through water and mud
Main bang
Pile end
75% wall loss defect
50% wall loss defect “identified” by the 50% DAC tolerance
Main bang
pile end

18
Table 3 compares the effectiveness of the developed H-pile inspection system and the associated data interpretation procedure with the visual inspection data of the H-pile wall loss as observed by the underwater divers in North Carolina. The far left column is the observation number. The “Diver” column provides the measured H-pile wall thickness. The “LRUT” column presents the wall loss detected by the EMAT scanner mounted on the pile above the water line. Of the eighteen LRUT measurements shown in Table 3, five matched the wall loss measured by the diving team exactly. Six additional measurements were in the same wall loss range. Five LRUT measurements differed by over 25% wall loss. Two measurements differed by over 50%. A summary, including possible reasons for wall loss measurement differences, is provided in the right hand column of Table 3 for each measurement.
4.7 Limitations of Technology
The field tests provided valuable feedback on the capabilities and limitations of the LRUT technology. It was determined that the EMATs did not couple enough ultrasound into piles through heavy corrosion as shown in Figure 26 (left). This heavy corrosion acts like an extremely thick coat of paint and minimizes acoustic coupling into the metal. The second limitation is the inability to scan beyond complete section loss as shown in the middle of Figure 26. It is impossible for the ultrasonic waves to travel beyond this loss. Similarly, it would be difficult to transmit ultrasound beyond heavily corroded areas to detect wall loss beyond these zones. A third limitation relates to bracing of the pile as shown in on the right of Figure 26. The left side of the pile would be difficult to inspect because of the multiple braces but the right side would be fairly straightforward to inspect. When a pile is double braced the welds absorb a significant amount of ultrasound.
Figure 26: Pile scenarios affecting technology performance.
.

19
TABLE 3 Field testing in North Carolina: H-pile system data vs. visual inspection wall loss data Location Diver LRUT Comments 1 10% 25 % The measured wall loss is in the 0 – 25% range. LRUT detected 25%.
2 12% 50% The diver measured wall loss is in the 0 – 25%. LRUT detected 50% wall loss. Possible sources for the difference may include the location at which diver made the measurement, the severely eroded pile surface on which the EMAT was located, and LRUT measurement error.
3 27% 50%+ The measured wall loss is in the 25 – 50% range . On this flange there was wall loss in the 25-50% range above the waterline that was detected prior to the underwater wall loss. The interpretation DACs do not account for multiple in-line wall loss at this point.
4 32% 50%+ The measured wall loss is in the 25 – 50% range. On this flange there was wall loss in the 25-50% range above the waterline that was detected prior to the underwater wall loss. The interpretation DACs do not account for multiple in-line wall loss at this point.
5 32% 75%* In this zone, there was a 100% semi-circular wall loss where LRUT detected 75% wall loss. The diver-measured wall loss represents the estimated wall thickness just beyond the full wall loss.
6 33% 75%+ The measured wall loss is in the 25 – 50% range. LRUT detected 75 % wall loss. Possible sources for the difference may include the location at which diver made the measurement, the severely eroded pile surface on which the EMAT was located, and LRUT measurement error. On this flange there was wall loss in the 25-50% range above the waterline that was detected prior to the underwater wall loss. The interpretation DACs do not account for multiple in-line wall loss at this point.
7 37% 50%+ The measured wall loss is in the 25 – 50% range. Whereas 50% was detected by the LRUT. On this flange there was wall loss in the 25-50% range above the waterline that was detected prior to the underwater wall loss. The interpretation DACs do not account for multiple in-line wall loss at this point.
8 39% 75%+ The measured wall loss is in the 25 – 50% range . LRUT detected 75 % wall loss. . Possible sources for the difference may include the location at which diver made the measurement, the severely-eroded pile surface on which the EMAT was located, and LRUT measurement error. On this flange there was wall loss in the 25-50% range above the waterline that was detected prior to the underwater wall loss. The interpretation DACs do not account for multiple in-line wall loss at this point.
9 48% 75% The measured wall loss is in the 25 – 50% range. LRUT detected wall loss at 75%.. Possible sources for the difference may include the location at which diver made the measurement, the severely-eroded pile surface on which the EMAT was located, and LRUT measurement error.
10 56% 50% Both the diver and LRUT detected wall loss in the 50% range.
11 57% 75% The measured wall loss is in the 50-75% range while LRUT detected wall loss at the upper limit of this range – 75%.
12 58% 50% Both the diver and LRUT detected wall loss in the 50% range.
13 61% 75% The measured wall loss is in the 50-75% range while LRUT detected wall loss at the upper limit of this range – 75%.
14 62% 25% In this case the diver measured over 50% and LRUT detected 25% wall loss. Possible sources for the difference may include the location at which diver made the measurement, the severely eroded pile surface on which the EMAT was located, and LRUT measurement error.
15 71% 100%* In this zone, there was a semi-circular wall loss where LRUT detected 100% wall loss. The dive- measured wall loss represents the estimated wall thickness just beyond the full wall loss.
16 72% 75% Both the diver and LRUT detected wall loss in the 75% range
17 75% 75% Both the diver and LRUT detected wall loss in the 75% range
18 77% 50% In this zone, LRUT detected 50% wall loss where the diver measured 77% wall loss. Possible sources for the difference may include the location at which the diver made the measurement, the severely-eroded pile surface on which the EMAT was located, and LRUT measurement error.

20
5. PROJECT PANEL
6. SUMMARY OF RESULTS
The end goal of this project was to develop a long range ultrasonic technology for the detection and characterization of wall loss in H-piles. WavesinSolids, working under TRB High-Speed Rail IDEA contract HSR 57, developed and tested a prototype handheld EMAT scanner for detecting and quantifying wall loss in H-piles. The objectives of this project included documentation of H-pile inspection requirements, sensor design and fabrication, modeling of guided wave propagation in H-piles, determination of the optimal ultrasonic wave mode for detection and characterization of wall loss, laboratory and field testing of a system prototype, and the development of a data interpretation procedure that permits rapid H-pile inspection. With the help of NSCORP, WavesinSolids was able to identify and document the H-pile inspection specification requirements. The project team, with input from NSCORP, determined that an inspection system should be able to inspect H-piles up to 9 feet under water and reliably characterize any detected wall loss into one of four categories: 25%, 50%, 75%, or 100%. The system should also be able to detect wall loss beyond obstructions such as welds, splices, braces, and beyond other wall losses. Dispersion curves for the guided waves in H-pile were obtained by modeling the wave propagation. Shear horizontal waves (SH-wave) were selected as the preferred mode since they are generally insensitive to water around the pile, coatings etc. SH EMATs were fabricated by WavesinSolids for generating guided waves in the H-piles. For the laboratory tests, two 10-foot H-pile sections were obtained from NSCORP and simulated wall loss defects were machined into them. Real-world situations such as welds, splices, etc. were added to the piles as well. The laboratory test results indicated that SH-wave EMATs have the potential for detecting wall loss in accordance with the inspection specification requirements. Field tests were carried out on bridges in Mississippi and North Carolina with the help of NSCORP. Data from different wall loss amounts in H-piles were acquired to develop Distance-Amplitude Correction (DAC) curves. These DAC curves, combined with the calibration procedure and the reflected waveforms obtained from the wall loss defects, enabled the generation of a display that aids the bridge inspector to not only identify the location of wall loss from the EMAT scanner but also the amount of wall loss (50%, 75% etc). During the field tests in North Carolina (in water up to 20 feet deep), the H-pile inspection system and the associated data interpretation procedure results were compared to the visual inspection results obtained from underwater divers.
Panel Members Affiliation Contact info
Chuck Taylor [email protected]
Tom Hay [email protected] 814-571-6530
Willie Benton
Jim Carter Hugh Hyder
Ethan Ray [email protected]
814-237-1031

21
Comparison of the EMAT scanner data with the diver measurements revealed good or acceptable correspondence for about half of the observations. Explanations for why the other observations fell outside the accuracy limits include one or a combination of the following:
The EMAT scanners, in some instances, had to be mounted on heavily-corroded pile surfaces. Heavy surface corrosion can inhibit the transmission of the ultrasonic signals into the pile, resulting in weak signals. In severe cases, the surface may be too damaged for mounting the sensors.
Accurate detection and characterization of losses was often not possible beyond pile braces or splices. The welds absorb a significant amount of the ultrasound.
Detection and characterization of wall loss below large wall losses may be compromised since the majority of ultrasound is reflected back towards the sensors and not transmitted though the initial wall loss area. As a result, less energy will reach any deeper wall losses.
Another error source was the inherent LRUT measurement error.
The significant achievements of this project are listed as follows:
Documentation of H-pile inspection specification requirements
Modeling of guided wave propagation in H-piles
Fabrication of a Shear Horizontal EMAT scanner for H-pile inspection
Demonstration of the effectiveness of the EMAT scanner in detecting simulated H-pile wall loss defects in
the laboratory
Laboratory demonstration of the potential to detect simulated defects through welds, splices, braces etc.
Laboratory demonstration of the capability of the LRUT technology to inspect submerged H-piles
Field tests to investigate the capabilities and limitations of the EMAT scanner to inspect H-piles
Development of a data interpretation procedure to not just detect H-pile wall loss but also to characterize it in
terms of the amount of wall loss
7. IMPLEMENTATION
WinS will transfer the technology developed in this project into a commercial system for delivery to the client base comprising railroad operators, public utilities and highway systems. A complete system, including the EMAT scanner, communications system, and a system for processing and displaying the results in the office of the maintenance personnel will be provided in the final commercial system. As the technology evolves, WinS will work with NSCORP to ensure that the technology satisfies this railroad’s inspection requirement specifications.
GLOSSARY
EMAT – Electro-Magnetic Acoustic Transducer Guided waves – Ultrasonic waves whose propagation in a medium is guided by the finite dimensions of medium Dispersion curves – Graphs that indicate the change in the ultrasonic wave velocities with respect to the frequency DAC curves – Distance-Amplitude Correction curve. It is constructed from the peak amplitude responses from reflectors/defects of equal area at different distances in the same material

22
A-Scan – Amplitude Scan. It is one of the formats used to display ultrasonic data. The A-scan presentation displays the amount of received ultrasonic energy as a function of time. The energy could be presented in terms of voltage amplitude, intensity etc. SH-waves – Shear Horizontal waves. These are shear waves polarized in the horizontal direction. These waves have little or no vertical displacement component. LRUT – Long Range Ultrasonic Technology