Low Cost Revamp
6
Debottlenecking a re nery fuel gas absorber T he purpose of a fuel gas absorber is to selectively remove components, prima- rily H 2 S and to a lesser extent CO 2 , using a solvent (amines) that absorbs these specic components. The product fuel gas can then be burned with reduced environmen- tal impact. One of the fuel gas absorbers at the Irving Oil Renery in Saint John, New Brunswick, Canada, had a maximum sustainable rate of approximately 980 mscfh. Increasing the gas ow rate beyond this point had resulted in increased column differential pressure (an indicator of the onset of column ooding) and amine carryover (increasing operating cost and operational chal- lenges). This column was limiting the ability to increase overall plant capacity, since Irving Oil Rening has strict operating requirements for environmental stewardship. Dsgn objtvs and path Irving Oil Rening wanted to proc- ess as much material through the column while maintaining product quality (H 2 S in fuel gas not to exceed 50 ppm[v]) with minimum modications to the plant during a planned shutdown in the autumn of 2009. It considered multiple options to debottleneck the column and settled on studying changes to column internals for increased throughput while maintaining or improving product quality. The newly designed high-performance trays would need to address the following criteria: • The new design will take into consideration the foaming tendency of amine A n y f gas abso b was vapd to nas apa ty wh a nta n ng H 2 S n th podt w b ow spaton DAriuS remeSAT Koch-Glitsch Canada micHAel BeSHArA Irving Oil Refning • The expected rich amine loading shall not exceed API guidelines for carbon steel in specic amine serv- ice at the anticipated temperatures. Based on past successes with high-capacity trays at the site and from other references, 1,2,3 Irving Oil Rening commissioned Koch- Glitsch to: • Model the operation of the fuel gas absorber (C14001) and validate current operation versus design, based on a comprehensive unit test run conducted in January 2009 and on existing internal drawings • Recommend and model internal changes to increase column capac- ity while retaining 60% turndown capability (maximum throughput with given constraints is desired) • Limit the extent of modications to reusing the existing tray ring supports, including downcomers. Tray number and spacing to be retained, with 25 trays in total at 2ft spacing • Retain current absorbent (amine at 25–30 wt%) and limit the ow and temperature that can be provided with existing equipment, such as recirculation pumps and exchangers • Revamp work to t within the set turnaround schedule. mthods and toos The rst and most important step in any revamp study is to generate an accurate characterisation of the process. 3 The test run performed in January 2009 gathered data using calibrated instrumentation, creating a closed mass and energy balance. The next step is to take the data from the test run and to create a representative model of the plant that can be used to predict the future performance with the new tower internals. cho of odng poga Numerous programs are available to assist in representing a column that uses amines to remove H 2 S and CO 2 from fuel gas streams. From the authors’ experience, rate-based models provide the best overall representation for new columns in this service, especially for packed columns. As an example, the rigor - ous, mass transfer rate approach used for all column calculations eliminates the need for empirical adjustments to simulate new appli- cations correctly. However, for column revamps, especially with trays, the use of an equilibrium-based model that has the necessary, proven adjustable parameters from operating experi- ence is a suitable alternative to rate-based models, provided the necessary specic equipment char - acteristics of the high-capacity tray can be appropriately represented in the simulation model. www.eptq.com REVAMPS 2010 23 Nos pogas a avaab to assst n psntng a on that ss ans to ov H 2 S and cO 2 fo f gas stas PDF courtesy of PTQ. First published in PTQ REVAMPS 2010.
-
Upload
behnam-hosseinzadeh -
Category
Documents
-
view
234 -
download
0
Transcript of Low Cost Revamp
7/29/2019 Low Cost Revamp
http://slidepdf.com/reader/full/low-cost-revamp 1/6
Debottlenecking a renery fuelgas absorber
The purpose of a fuel gasabsorber is to selectivelyremove components, prima-
rily H2S and to a lesser extent CO
2 ,
using a solvent (amines) thatabsorbs these specic components.
The product fuel gas can then be burned with reduced environmen-tal impact.
One of the fuel gas absorbers atthe Irving Oil Renery in Saint
John, New Brunswick, Canada, hada maximum sustainable rate of approximately 980 mscfh. Increasingthe gas ow rate beyond this pointhad resulted in increased columndifferential pressure (an indicatorof the onset of column ooding)
and amine carryover (increasingoperating cost and operational chal-lenges). This column was limitingthe ability to increase overall plantcapacity, since Irving Oil Reninghas strict operating requirementsfor environmental stewardship.
Dsgn objtvs and pathIrving Oil Rening wanted to proc-ess as much material through thecolumn while maintaining productquality (H
2S in fuel gas not to
exceed 50 ppm[v]) with minimummodications to the plant during aplanned shutdown in the autumnof 2009. It considered multipleoptions to debottleneck the columnand settled on studying changes tocolumn internals for increasedthroughput while maintaining orimproving product quality. Thenewly designed high-performancetrays would need to address thefollowing criteria:
• The new design will take intoconsideration the foaming tendencyof amine
A ny f gas absob was vapd to nas apaty whantanng H
2S n th podt w bow spaton
DAriuS remeSAT Koch-Glitsch Canada micHAel BeSHArA Irving Oil Refning
• The expected rich amine loadingshall not exceed API guidelines forcarbon steel in specic amine serv-ice at the anticipated temperatures.
Based on past successes withhigh-capacity trays at the site and
from other references,1,2,3 IrvingOil Rening commissioned Koch-Glitsch to:• Model the operation of the fuelgas absorber (C14001) and validatecurrent operation versus design,
based on a comprehensive unit test
run conducted in January 2009 andon existing internal drawings• Recommend and model internalchanges to increase column capac-ity while retaining 60% turndowncapability (maximum throughputwith given constraints is desired)• Limit the extent of modicationsto reusing the existing tray ringsupports, including downcomers.Tray number and spacing to beretained, with 25 trays in total at 2ftspacing• Retain current absorbent (amine
at 25–30 wt%) and limit the owand temperature that can beprovided with existing equipment,
such as recirculation pumps andexchangers• Revamp work to t within the setturnaround schedule.
mthods and toos
The rst and most important stepin any revamp study is to generatean accurate characterisation of theprocess.3 The test run performed in
January 2009 gathered data usingcalibrated instrumentation, creatinga closed mass and energy balance.The next step is to take the datafrom the test run and to create arepresentative model of the plantthat can be used to predict thefuture performance with the new
tower internals.
cho of odng pogaNumerous programs are availableto assist in representing a columnthat uses amines to remove H
2S and
CO2
from fuel gas streams. Fromthe authors’ experience, rate-basedmodels provide the best overallrepresentation for new columns inthis service, especially for packedcolumns. As an example, the rigor-ous, mass transfer rate approach
used for all column calculationseliminates the need for empiricaladjustments to simulate new appli-cations correctly.
However, for column revamps,especially with trays, the use of anequilibrium-based model that hasthe necessary, proven adjustableparameters from operating experi-ence is a suitable alternative torate-based models, provided thenecessary specic equipment char-
acteristics of the high-capacity traycan be appropriately represented inthe simulation model.
www.eptq.com REVAMPS 2010 23
Nos pogas
a avaab to assst
n psntng aon that ss
ans to ov
H2S and cO
2fo
f gas stas
PDF courtesy of PTQ. First published in PTQ REVAMPS 2010.
7/29/2019 Low Cost Revamp
http://slidepdf.com/reader/full/low-cost-revamp 2/6
The simulation user needs to besensitive to the fact that even the
most sophisticated equilibrium-stage model uses only two of veelements employed in the rate-
based model; namely, mass andenergy balances around an entireideal stage, plus thermodynamic-phase equilibrium. Programs thatinclude reaction kinetics by empiri-cal modelling via an adjustableparameter (H
2S and CO
2tray ef-
ciencies and/or liquid residencetimes) that forces the simulationto reproduce a conventionally
operated column’s treated gascomposition can only be effectiveif comprehensive operating
24 REVAMPS 2010 www.eptq.com
experience has been gained andvalidated. In addition, the equilib-
rium-based program should have areliable feature to include tray ef-ciencies to convert ideal stages intoactual trays so that the tray charac-teristics can be represented pre- andpost-revamp. VMGSim4 usesspecic mass transfer multipliersthat can be tuned to match plantdata and provides the ability to usetray and component efciencies inthe model. As a result, VMGSimhas been used successfully to modelexisting plants and to accurately
predict tray revamps in thisservice.
Of note, the solvents used in
amine absorbers are rarely puresolutions of water and amine.
Contaminants entering with thefeed gas or makeup water canchange the chemistry of the solventsignicantly. This can both worsenand, in some cases, enhance theabsorption efciency. To improvethe accuracy of the simulation, theimpact of heat-stable salts and othercontaminants on the performanceof the amine should be factoredinto the evaluation.
Poss vaaton
A simulation using VMGSim(equilibrium-based model) with anappropriate amine thermodynamicpackage (validated with bothProtreat and Ratefrac rate-basedmodels) was developed based onplant data provided from January2009. The fuel gas absorber wasrunning at ~921 mscfh charge to theunit. Simulation cases were run at:• 921 mscfh to match plant data• 980 mscfh demonstrated sustain-
able limit of absorber columnperformance• 1175 mscfh based on expected
cas (onstant an an, %) H2S, H
2S/an, Ad gas/an, lan an,
pp o/o o/o BPD920 mscfh - plant data 5 0.49 0.573 10 500
980 mscfh - 5 ppm H2S 4.88 0.49 0.569 11 200
980 mscfh - max H2S in amine 22 0.527 0.605 10 500
1175 mscfh - 5 ppm H2S 5.27 0.49 0.562 13 600
1175 mscfh - max H2S in amine 17.7 0.523 0.6 12 700
VmGS sts — nasd ow thogh pant
Tab 1
8
&EEDEXCHANGER
#OOLER
4O
COOLER 4OPUMP
-
0UMP
2ICHLOADING
CONTROLLER
7ATERBALANCE
CALCULATOR
3OLIDLINESPROCESSSTREAMS
$ASHEDLINESCONTROLSCHEMEANDCALCULATORS
-AKEUP
WATER
&LASH
TANK
VENT
&LASH
TANK
2ICHAMINETO
CROSSEXCHANGE2EGENERATED
AMINE
&ROMCROSS
EXCHANGE
2ICHLEAN
CROSSEXCHANGER
(EATEDRICH
AMINE
2ICH
!MINE
4O
FLASH
TANK
!BSORBER
!MINELOADINGCALCULATOR
#ONTROLVALVE
'ASTOCOLUMN
3OURGAS
3WEET
'AS
)NLETSEPARATOR
,EAN
!MINE!CIDGAS
2EGENERATOR
Fg 1 Primary simulation topology used
PDF courtesy of PTQ. First published in PTQ REVAMPS 2010.

7/29/2019 Low Cost Revamp
http://slidepdf.com/reader/full/low-cost-revamp 3/6
acid gas loading limit of 0.6 (molesacid gas/moles amine).
Acid gas is primarily H2S and
CO2. The hydraulic limit of a
proposed tray change would be1234 mscfh, which is 5% above theexpected revamp design value of 1175 kscfh. The primary objectiveof the simulation work was todetermine what maximum ow theabsorber could handle within theexisting 5ft (1.5m) shell diameterand the supporting equipment(coolers and pumps) while stillmeeting desired product specica-tions. The regenerator was includedin the evaluation and simulation toprovide a closer representation of the plant (see Figure 1) and to
better extrapolate the performanceof the unit at higher rates.
In addition to tray modications,process modications can be consid-ered (see Figure 2) to increasefurther the capacity of the fuel gasabsorber. An approximately 4%decrease in amine ows for the sameoutlet H
2S ppmv value can be real-
ised by increasing the lean amineconcentration from 23.5–25.5%.
Saton sts (possbnasd hag ats)
Taking the base representativesimulation (VMGSim) for the 921mscfh plant data of January 2009,which was within 5% of the plantdata, and adhering to the designcriteria, the following cases werereviewed:• Maintaining sweet gas H
2S at
approximately 5 ppm(v)• Minimising lean amine rate to amaximum of 0.6 (mol acid gas/molamine) acid gas loading.
Feed rates of 980 and 1175 mscfh
were used in the evaluation.The reduced amine circulation
was reviewed to determine howmuch more capacity the tower had
by ofoading liquid to allow morevapour while still meeting mini-mum product specications. Thecases used the identical thermody-namics and tuning developed tomatch the plant data.
The 980 mscfh simulation wasdeveloped to determine a baseline
for the limit of the trays, becauseoperational feedback indicated thatamine carryover began to occur at
this feed rate. The 1175 mscfh casesimulation was developed to reectthe expected maximum feed ratethat the absorber could handlehydraulically (after a revamp to
higher capacity internals). For the1175 mscfh case, the total acid gasload (mol acid gas/mol amine) of 0.6 was the limiting process variablewhen trying to keep amine ow toa minimum. Table 1 shows thesimulation output results for thefour cases evaluated. The sweet gasH
2S composition is below the speci-
cation of 50 ppm(v) for all cases.As noted previously, the limitingparameter was the acid gas loading
www.eptq.com REVAMPS 2010 25
of 0.6 for the existing case and theexpected revamp case.
evaaton of xstng ntnasUsing the simulation output resultsfor the 920 and 980 mscfh cases, theexisting tray internals were evalu-ated. A system factor (foaming) of
0.83 was used in calculating thetray performance. From past expe-rience, a typical system factor of 0.73–0.85 for heavy foaming systemssuch as amine absorbers is applied.Using 0.83 for the study was wellwithin what is expected for thisservice and provided a representa-tive match to the plant performance.Table 2 shows the tray evaluationresults for the 920 and 980 mscfhcases. It appears that the primary
limit on the trays was the activearea, with a jet ood of 100% forthe 980 mscfh case. Such a high jetood value matches with the obser-vation of amine carryover due tohigh froth heights on the trays.From the plant data at 980 kscfhand the hydraulic evaluation, traysmay not still be at incipient pointof ood, yet operation and evalua-tion indicates that entrainmentmay be the primary issue and thusthis phenomenon needs to be
Tays Top Top Bt BtDescription 920 mscfh 980 mscfh 920 mscfh 980 mscfhSystem factor 0.83 0.83 0.83 0.83
Hydraulic data
Jet ood, % 85 93 89 100
Downcomer ood, % 41 44 41 44Downcomer backup, in liq 9.2 10.0 9.6 10.7
Total tray,∆
P * in liq 5.9 6.7 6.4 7.5Total tray, ∆P * mm Hg 11.3 12.3 12.1 13.7
Tay hydas vaaton fo 920 and 980 sfh
Tab 2
Th pat of
hat-stab sats and
oth ontanants
on th pfoan
of th an shod
b fatod nto th
vaaton
T B H U F F X T o N Q Q 4
)
-FBO%&"þPXCQE
XUBNJOF
XUBNJOF
Fg 2 Amine concentration vs product H2S purity @ 1175 mscfh plant feed rates
PDF courtesy of PTQ. First published in PTQ REVAMPS 2010.
7/29/2019 Low Cost Revamp
http://slidepdf.com/reader/full/low-cost-revamp 4/6
features and enhanced contact (forexample, the Minivalve movablevalve - MV-1) and enhanced down-comers were considered for thisrevamp. These trays, illustrated in
Figure 3, reduce the dead space ontrays to increase capacity yet stillmaintain the necessary contact time(with bubble promoters and otherfeatures) between the amine andgas to ensure optimum absorptionoccurs.
Table 3 shows the results fromthe tower internals hydraulic analy-
sis using high-performance trays.Using 85% for both downcomerand jet ood limits in a revamp, thehydraulic limit is at 5% above the1175 mscfh revamp design feedrate, or 1234 mscfh. Factoring ininaccuracies in eld measurements,delity of the simulation andhydraulic calculations, the towerlimit should be expected to easilyhandle 1175 mscfh of feed and meetsweet gas product specication.
To meet the increased ows, thedowncomer size and shape wouldneed to be optimised, along withchanges to the active area, with theuse of Minivalve high-performancevalves included in the active areachanges. Table 4 shows a genericcomparison of the characteristics of the existing and proposed traydesigns.
The tray evaluation was based onreusing all existing tower attach-ments, with no welding required on
the vessel shell or tower attach-ments to meet the shutdownschedule. Since the existing traysare one-pass, cross-ow trays, anymodication to increase capacitypreferably should be based oncross-ow trays so that the existingtower attachments can be reused.The foaming factor for therevamped tray evaluation willremain at 0.83 due to uncertainty inthe level of foaming in the future. If
the same conditions persist after therevamp, the Superfrac trays usingmovable valves could be evaluated
26 REVAMPS 2010 www.eptq.com
considered during the revampdesign.
rvap onsdatonsBy using a high-performance traydevice, the increase in capacity overthe 980 mscfh current maximum
was determined to be 1175 mscfh(an increase of 20% over currentmaximum sustainable rates). Therevamp product type chosen main-tained the overhead H
2S to below
50 ppm (v) and the acid gas load-ing on the amine below anacceptable maximum (0.6 mol acidgas/1.0 mol rich amine).
Using the information fromTables 1 (to set the column processperformance) and 2 (to set the inter-
nals hydraulics performance), adebottleneck evaluation resulted inthe recommendation that thecolumn could favourably (that is,maintain H
2S on specication)
support a process gas feed rate of up to 1175 mscfh.
Superfrac trays with valve push
Tay # Tay a qd Foth(1-botto) hght, n hght, n11–25 2–3 8–9
1–10 2 7–9
Tao san sts5 say
Tab 5
Spfa tays dth dad spa on
tays to nas
apaty yt st
antan th nssay
ontat t btwn
th an and gas
exstng PoposdNet top DC area, ft2 3.5 2.7
Active area, ft2 12.7 15.8
Valve type Sieve MV-1
Tay goty
Tab 4
Tays Top Top md md Bt BtDescription 1175 mscfh 1175+ 5% 1175 mscfh 1175+ 5% 1175 mscfh 1175+ 5%
System factor 0.83 0.83 0.83 0.75 0.83 0.83
Hydraulic data Jet ood, % 75 79 75 78 81 85
Downcomer ood, % 79 83 76 80 81 85
Downcomer backup, in liq 6.7 6.9 6.6 6.8 6.9 7.2
Total tray,∆
P * in liq 3.5 3.6 3.4 3.6 3.6 3.8Total tray, ∆P * mm Hg 6.6 6.8 6.5 6.7 6.7 7.0
Dbottnk as (1175 and 1234 sfh) hgh-pfoan tay hyda atng
Tab 3
Fg 3 Sketch of Superfrac tray setup
PDF courtesy of PTQ. First published in PTQ REVAMPS 2010.
7/29/2019 Low Cost Revamp
http://slidepdf.com/reader/full/low-cost-revamp 5/6
with a foaming factor of 0.9 (inother words, a further increase of capacity of around 8%, or up to1460 mscfh feed rate). The featuresof the MV-1 valve’s active area arecongured in such a manner as toreduce the promotion of foam inthis service. Since a denitive anal-ysis of foaming tendencies was notperformed, the foaming benet wasnot included in the revamp’s design
expectations.
Post-vap tst stsA test run and tower scan wereperformed in May 2010, to validatethe performance of the columnpost-revamp. Since startup post-revamp, the column feed hadreached up to 1160 mscfh at 20wppm H
2S with no operational
28 REVAMPS 2010 www.eptq.com
issues. Using a material balancewith sulphur, the column ow ratefor the test run was calculated/conrmed to be in the range 1150–1170 mscfh, with no indication of amine carryover and a sweet gasH
2S concentration of 18–20 wpmw.
The VMGSim simulation wasupdated and corroborated the post-revamp plant data. The tower scanindicated that, at these rates, there
was still ample room on the traysto handle ows of up to 1340 mscfh.Table 5 shows the calculated activ-ity on the trays in the form of clearliquid height on the tray and frothheight. Adding these two valuestogether gives the total height occu-pied by the liquid (clear andaerated) on the tray deck, which isin the 9–12in (22.5–30cm) range
across the tower. Using the sameprocess data from the test run inthe simulation to generate the inter-nal loads, the KG-Design hydraulicrating program from Koch-Glitschprovided 70% jet ood results. Bothvalues, the froth height and the jetood, would tend to indicate thatthe trays still have room to processmore material.
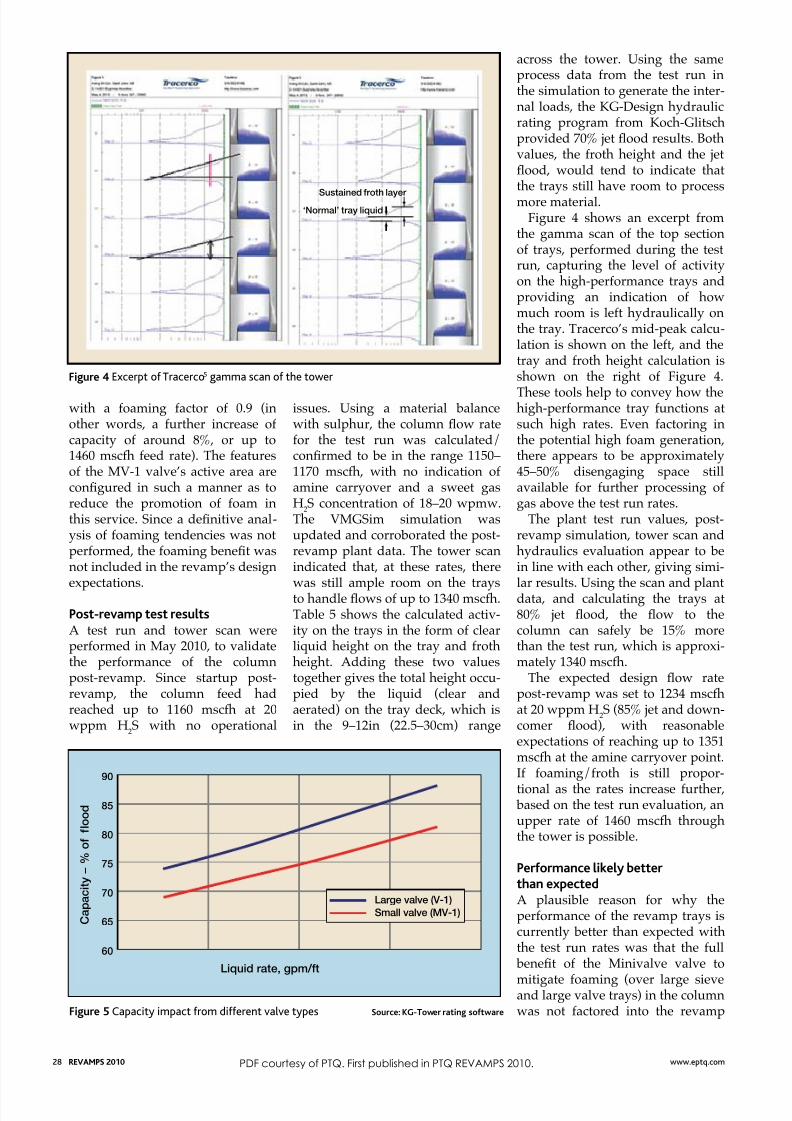
Figure 4 shows an excerpt fromthe gamma scan of the top sectionof trays, performed during the testrun, capturing the level of activityon the high-performance trays andproviding an indication of howmuch room is left hydraulically onthe tray. Tracerco’s mid-peak calcu-lation is shown on the left, and thetray and froth height calculation isshown on the right of Figure 4.
These tools help to convey how thehigh-performance tray functions atsuch high rates. Even factoring inthe potential high foam generation,there appears to be approximately45–50% disengaging space stillavailable for further processing of gas above the test run rates.
The plant test run values, post-revamp simulation, tower scan andhydraulics evaluation appear to bein line with each other, giving simi-
lar results. Using the scan and plantdata, and calculating the trays at80% jet ood, the ow to thecolumn can safely be 15% morethan the test run, which is approxi-mately 1340 mscfh.
The expected design ow ratepost-revamp was set to 1234 mscfhat 20 wppm H
2S (85% jet and down-
comer ood), with reasonableexpectations of reaching up to 1351mscfh at the amine carryover point.If foaming/froth is still propor-
tional as the rates increase further, based on the test run evaluation, anupper rate of 1460 mscfh throughthe tower is possible.
Pfoan ky btt than xptdA plausible reason for why theperformance of the revamp trays iscurrently better than expected withthe test run rates was that the full
benet of the Minivalve valve to
mitigate foaming (over large sieveand large valve trays) in the columnwas not factored into the revamp
‘Normal’ tray liquidSustained froth layer
Fg 4 Excerpt of Tracerco5 gamma scan of the tower
E P P M G G
P
¦ Z U J D B Q B $
-JRVJESBUFHQNGU
-BSHFWBMWF7
4NBMMWBMWF.7
Fg 5 Capacity impact from different valve types So: KG-Tow atng softwa
PDF courtesy of PTQ. First published in PTQ REVAMPS 2010.

7/29/2019 Low Cost Revamp
http://slidepdf.com/reader/full/low-cost-revamp 6/6
design. As was noted previously, afoaming factor of 0.83 was used forthe conventional trays because itresulted in a good match of theplant data and pre-revamp gammascan results. For the revamp study,the foaming factor was kept at 0.83,not accounting for the benet of theMinivalve, which can reducetendency to foam.
Considering the tower scanresults post-revamp, a foamingfactor of 0.9 could be used for theSuperfrac trays with MV-1 movablevalves. With the tower exhibitingan improvement over design expec-tations, the difference could beattributed to the reduced foamgenerated by the valve type orsimply that the added capacity of the valve’s active arrangement on
the tray provides even more capac-ity in this service than is normallyanticipated. For a set open area,when the hole/valve size decreases,the capacity of the tray increases(see Figure 5). The increase incapacity comes from a reduction infroth height. With reduced frothheight, there is more disengagingroom to deal with foam, and thusmore capacity. This phenomenon,arising from the different valve size,
helps to deal with and/or addressfoaming issues in the column andthus further increase capacity in thecolumn.
consonsThe revamped fuel gas absorber hasmet and exceeded the design objec-tives to enable Irving Oil Reningto increase overall renery perform-ance while maintaining strictenvironmental objectives. Theabsorber has been able to operate
consistently above pre-revamprates, and with expected post-revamp rates at the same productquality levels as before the revamp.Collaboration between the operat-ing company and the tower internalcompany enabled a low-cost andeffective tower revamp.6
MINIVALVE, SUPERFRAC and KG-TOWER are
marks of Koch-Glitsch LP.
rfns
1 Nieuwoudt I, Penciak J, Best of both,
Hydrocarbon Engineering, July 2007, 85–89.
2 Nieuwoudt I, et al, Revamp & retune,
Hydrocarbon Engineering, Jul 2009, 14, 7, 56–
60.
3 Remesat D, Improving performance through
low-cost modication of tower internals, PTQ,
Q3 2010, 37–42.
4 VMGSim website, www.virtualmaterials.com
5 Mak R, Tracerco Internal report for Irving Oil
Rening GP, Tru-Scan of the Sulphide Absorber,
May 2010.
6 Remesat D, Inside-out design approach,
Hydrocarbon Processing, August 2006.
Das rsat is a Chemical Engineer
working in process and business development
for Koch-Glitsch LP, Calgary, Canada. He
holds a BS in engineering and management
from McMaster University, Ontario, Canada, an
MBA from Heriot-Watt University, Scotland,
UK, and a MS and PhD in chemical engineering
from the University of Calgary, Canada, where
he is also an Associate Adjunct Professor.
Email: [email protected]
mha Bshaa is an Engineer working in the
development, assessment and execution of
protability improvement projects for IrvingOil Rening, New Brunswick, Canada. He
holds a BS in chemical engineering from the
University of New Brunswick.
Email: [email protected]
www.eptq.com REVAMPS 2010 29PDF courtesy of PTQ. First published in PTQ REVAMPS 2010.