
Low Cost Parachute Guidance, Navigation, and Controlfaculty.nps.edu/oayakime/ADSC/AGAS - Dellicker -...
15
(c)l999 American Institute of Aeronautics & Astronautics A99-30932 ---~----- AIAA-99-1706 LOW COST PARACIXUTE GUIDANCE, NAVIGATION, AND CONTROL Scott H. Dellicker* U.S. Army Yuma Proving Ground STEYl’-MT-EA Yuma,AZ85365 Jim Bybee? Cibola Information Systems, Inc PO Box 6492 Yuma, AZ 85366 ABSTRACT The United StatesArmy and Air Force have teamed with The Boeing Companyand Vertigo, Incorporated in the development and evaluation of Improved Affordable Airdrop Technologies. These efforts included the evaluation of the Affordable Guided Airdrop System (AGAS) which incorporates a low- cost guidance and control system into fielded cargo air delivery systems.The U.S. Army Yuma Proving Ground, the Army’s parachute test center, supported the feasibility evaluation of this system. This effort encompassed the design and executionof a flight test program to assess prototype system performance, as well as modeling efforts to evaluate initial guidance and control techniques. This paper presents the results of the flight test effort and the status of the ongoing modeling and simulation efforts. Flight test data demonstrates the actuator system can provide glide ratios of 0.4 to 0.5 for a flat circular parachute. Initial simulations have demonstrated that this performance can provide airdrop accuraciesof less than 50 meters (excluding navigation system errors). Continuing efforts to evaluate performance of this concept include flight testing of large-scale air delivery systems and improving the dynamic simulations. INTRODUCTION The United StatesAir Force ScienceAdvisory board was tasked to develop a forecast of the requirements of the most advancedair and space ideas to project the Air Force into the next century. The study, encompassing all aspects of Air Force operations, ‘Chief, Aviation and Airdrop Systems, AIAA Member presider& Cibola Information Systems “This paper is declared a work of the U.S. Government and is not subject to copyright protection in the United States.” assessed a variety of technology developments critical to the Air Force mission. This study culminatedin a report titled “New World Vistas, Air and Space Power for the 2 1st Century.“’ The study identified a critical need to improve the Point-of-Use Delivery; that is, getting the materiel where it needs to be, when it needs to be there. Airdrop is an important aspect of Point-of-Use Delivery. The report indicated that immediate improvements are needed with emphasis provided by the statement: “In the future, the problem of airdrop should be treated as seriously as the problem of bomb drop.” To date, significant emphasis has been placed on the developmentof large-scale parafoil systems. These systems provide the accuracyrequired with delivery from high altitude and large offset distances. The drawback is prohibitive cost for each pound of payload delivered. Alternate approaches were required to reduce systemcost. Improved Affordable Airdrop Technologies are being evaluated by the team of the United States Army and Air Force, The Boeing Company, and Vertigo, Incorporated. These efforts include the design and development of the Affordable Guided Airdrop System which incorporates a low-cost guidance, navigation, and control system into field cargo air delivery systems. The feasibility evaluation is being supported by the U.S. Army Yuma Proving Ground, the Army’s parachute test center. This effort encompassed the design and executionof a flight test program to assess prototype system performance,as well as modeling efforts to evaluateinitial guidance and control techniques. This paper presents the current status of these efforts, including flight test results obtained thus far, as well as a description of ongoing work. A systemdescriptionis provided first 51
Transcript of Low Cost Parachute Guidance, Navigation, and Controlfaculty.nps.edu/oayakime/ADSC/AGAS - Dellicker -...

(c)l999 American Institute of Aeronautics & Astronautics
A99-30932 ---~----- AIAA-99-1706
LOW COST PARACIXUTE GUIDANCE, NAVIGATION, AND CONTROL
Scott H. Dellicker* U.S. Army Yuma Proving Ground
STEYl’-MT-EA Yuma,AZ85365
Jim Bybee? Cibola Information Systems, Inc
PO Box 6492 Yuma, AZ 85366
ABSTRACT
The United States Army and Air Force have teamed with The Boeing Company and Vertigo, Incorporated in the development and evaluation of Improved Affordable Airdrop Technologies. These efforts included the evaluation of the Affordable Guided Airdrop System (AGAS) which incorporates a low- cost guidance and control system into fielded cargo air delivery systems. The U.S. Army Yuma Proving Ground, the Army’s parachute test center, supported the feasibility evaluation of this system. This effort encompassed the design and execution of a flight test program to assess prototype system performance, as well as modeling efforts to evaluate initial guidance and control techniques. This paper presents the results of the flight test effort and the status of the ongoing modeling and simulation efforts. Flight test data demonstrates the actuator system can provide glide ratios of 0.4 to 0.5 for a flat circular parachute. Initial simulations have demonstrated that this performance can provide airdrop accuracies of less than 50 meters (excluding navigation system errors). Continuing efforts to evaluate performance of this concept include flight testing of large-scale air delivery systems and improving the dynamic simulations.
INTRODUCTION
The United States Air Force Science Advisory board was tasked to develop a forecast of the requirements of the most advanced air and space ideas to project the Air Force into the next century. The study, encompassing all aspects of Air Force operations,
‘Chief, Aviation and Airdrop Systems, AIAA Member presider& Cibola Information Systems “This paper is declared a work of the U.S. Government and is not subject to copyright protection in the United States.”
assessed a variety of technology developments critical to the Air Force mission. This study culminated in a report titled “New World Vistas, Air and Space Power for the 2 1st Century.“’
The study identified a critical need to improve the Point-of-Use Delivery; that is, getting the materiel where it needs to be, when it needs to be there. Airdrop is an important aspect of Point-of-Use Delivery. The report indicated that immediate improvements are needed with emphasis provided by the statement: “In the future, the problem of airdrop should be treated as seriously as the problem of bomb drop.”
To date, significant emphasis has been placed on the development of large-scale parafoil systems. These systems provide the accuracy required with delivery from high altitude and large offset distances. The drawback is prohibitive cost for each pound of payload delivered. Alternate approaches were required to reduce system cost.
Improved Affordable Airdrop Technologies are being evaluated by the team of the United States Army and Air Force, The Boeing Company, and Vertigo, Incorporated. These efforts include the design and development of the Affordable Guided Airdrop System which incorporates a low-cost guidance, navigation, and control system into field cargo air delivery systems. The feasibility evaluation is being supported by the U.S. Army Yuma Proving Ground, the Army’s parachute test center. This effort encompassed the design and execution of a flight test program to assess prototype system performance, as well as modeling efforts to evaluate initial guidance and control techniques. This paper presents the current status of these efforts, including flight test results obtained thus far, as well as a description of ongoing work. A system description is provided first
51

(c)l999 American Institute of Aeronautics & Astronautics
followed by’ a flight test outline, instrumentation description including wind estimation techniques, flight test results, parameter estimation efforts, and preliminary control system design.
SYSTEM DESCRIPTION
The AGAS concept will be first applied to air delivery of payloads in the range of 1000-2200 pounds. The concept for the AGAS is to replace the four parachute risers with four pneumatic actuators3 and install a guidance, navigation, and control (GNC) system on the payload. The GNC system will determine the system’s offset from a preplanned trajectory and provide “steering” commands to drive (or “slip”) the system back to the planned trajectory. This concept is expected to provide sufficient performance to overcome errors in both wind estimation and getting the aircraft to the correct release point.
simultaneously, eight different control inputs (one every 45 degrees) can be affected. For this demonstration, a riser release of approximately 3 feet was selected [measured to be 3.25 feet during ground testing]. When depressurized, the PMAs are completely flexible allowing for efficient packing of the actuators with the parachute. Control activation was performed by remote control for the test effort.
Parachute
The C-9 parachute was selected for this feasibility demonstration, due to its availability and representation of the larger cargo-type air delivery systems on which this concept will ultimately be used. Although the C-9 was initially designed as an ejection seat parachute, it is a standard flat circular parachute as are the larger G-l 1 and G-12 cargo parachutes.
The reference area of the C-9 parachute is the total surface area of the canopy (a circle of 2%foot diameter) and is 615.8 square feet. The C-9 is static- line deployed and utilizes ‘ 28 suspension lines connecting to four risers replaced with 10 foot PMAs. A cargo box was suspended ‘from the system and housed the remote control system, control actuators, and instrumentation system. :
Upon deployment of the system, all actuators are pressurized. To affect control of the system, one or two actuators are depressurized. This action “deforms” the parachute creating drive in the opposite direction of the control action. Figure 1 illustrates the parachute deformation upon control actuation.
FLIGHT TEST OVERVIEW
Figure 1. Control Activation
Actuators
Vertigo, Incorporated, developed Pneumatic Muscle Actuators (PMAs) to, affect the control for this system. The PMAs are braided fiber tubes with neoprene inner sleeves that can be pressurized. Upon pressurization, the PMAs expand in diameter thus shortening the length of the actuator. The actuators are put “in-line” with the payload and risers of the parachute. With four independently controlled actuators, two of which can be activated
The objective of the flight test was to characterize the performance of the actuators and dynamic response of the system. A UH-1, equipped for airdrop, was used for this effort. A standard 15-foot static line deployed the parachute. Upon release of the payload and deployment of the parachute, the system was allowed to stabilize as observed in ground-to-air video. Next, control inputs were commanded via a radio link and held “on” for 15 to 30 seconds at which time the input was ,removed. This was repeated at approximately 15- ‘to 30-second intervals. The payload was instrumented to capture the system’s dynamic state. Additionally, the winds experienced throughout the airdrop were characterized.
INSTRUMENTATION
The AGAS instrumentation package was required to measure and record the state of the AGAS payload to include: position, velocity, acceleration, and three- axis attitude and attitude rates. In addition, the state (extended or retracted) of each of the four actuators was recorded. The position and velocity of the AGAS payload was provided by a differential carrier-phase GPS system known as the Improved Vehicle
52

(c)l999 American Institute of Aeronautics & Astronautics
Tracking System (IVTS). Acceleration data were derived from a triad of accelerometers, and the attitude of the package was measured by an Attitude Heading Reference System (AHRS). Pressure transducers attached to the PMAs provided the state of the actuators. Since time correlation of the data from multiple sources was critical, a timing source was included in the package. All measured data were recorded on removable flash memory devices.
The AGAS instrumentation package contained two PC/104 computer systems. The sensor computer system managed the data acquisition and recording for the AIRS, acceleration and actuator states collected at a 15-Hertz (Hz) rate. The Global Positioning System (GPS) computer system controlled the GPS receiver and acquired and recorded the receiver measurements. The GPS trajectory solution was recorded at a ~-HZ rate. Details of the instrumentation system design are presented in the appendix. The system design is illustrated in Figure 2.
q P
cl’ X
z r
Figure 2. Instnmrentation Overview
NOTATION
The following illustrates the reference system used for this effort:
.
Figure 3. Coordinate System
The following defmes the notation used in the development of the equations of motion.
- Capital letters/symbols denote vectors or matrices
- Small letters/symbols denote scalars - {B): name of the coordinate system, B
denotes body-axis, W denotes wind-axis, and U denotes inertial axis.
- ,” R : rotation matrix from coordinate system $4) to coordinate system {C)
- =P D : position of point D, measured in {C) and expressed in {C,r
- A (“P,) : position of point D, measured in (C) and expressed in {A] where “(‘P,) =; R(CPD)#CPD
- Pe: position error - L: distance vector from payload to CG - CG: center of gravity - “vD : velocity of point D, measured in {C)
and expressed in {C). - VT: total system velocity - U,V,W: body axis velocity components - cc2 D : angular velocity of point D, measured
in {C) and expressed in {C) - p,q,r: body axis rates
- $ : time derivatives in the body-axis {B)
- (‘): time derivatives in the inertial-axis {U) -a xx : apparent mass coefficients - Wz system weight - y: flightpathangle - y : yaw angle - L/D: Lift to drag ratio (approximates glide
ratio)
NOTE: if the symbol for the coordinate axis is omitted, the inertial-axis {U) is assumed.
WIND ESTIMATION
Two methods of wind estimation were utilized. The first includes the accepted standard of the Radiosonde Wind Measuring System (RAWlN) used throughout the test community. A RAWIN balloon was launched at approximately l-hour intervals near the release time in the vicinity of the Drop Zone. This system provides a direct measurement of the winds as a function of altitude. Although an accepted standard, the RAWIN system has limitations in airdrop operations. The balloon must be launched
53

(c)l999 American Institute of Aer .onautics & Astronautics
and data processed resulting in approximately a l- hour delay.
A second method of de:ploying a “calibration system” just prior to release: of the test payload was implemented. A Vertigo, Incorporated t&lobe parachute was used with a reference drag area (CDS) of 90.9. Oscillations of this parachute were observed to be very small. The system was weighted at 58 pounds to provide approximately the same descent rate as the C-9 system. The calibration system was instrumented with diffeaential GPS on the payload.
Initially, the wind estunate was simply taken as the ground velocity as measured by the GPS. Note that this approach does not account for changes in momentum of the system. To validate the ability to simply use the measured ground track velocity as the wind estimate, a model of the calibration parachute system was developed. A point-mass system was assumed with the only forces on the system being drag and weight. The applicable equations of motion are:
X=(m+a,,)ti = -Dcosycosy Y=(m+a,)it=-Dcosysiny Z=(m+a,,)ti=-Dsiny+W’
Substituting, rearranging terms, and putting in state space form:
, t31 Equation (3) can be solved numerically to estimate the system response to the! estimated winds and compared to the measured velocity of the system. Using the measured ground. track velocity as the initial wind estimate, the modeled ground track was determined. The difference between this modeled ground track and the actual measured grotmd track reflects the errors in the wind estimate. The magnitude of these errors indicates the significance of accounting for momentum changes caused by the accelerating wind.
Figure 4 presents the results of this validation. Use of the measured ground track velocity as the wind estimate, resulted in errors less than 0.3 feet per second.
Wind Estimation Results
The results of these tests indicate the momentum effects can be ignored for wind estimation using the selected parachute system. It is recognized that significant wind shear was not present during these tests. Results in presence of higher wind shear may vary. Figure 5 illustrates the comparison of the wind estimate to the winds measured by the RAWlN. Recall that the RAWJN balloon was launched only every hour. The closest RAWIN dam was used for this comparison.
0
B g B -0.5 0 50 100 150 200 250 300 350 400 i 0.5'
iii Y E.
E O W Y
jj 4-5o 50 100 150 200 250 300 350 -2 4ooi 0.5
z (I) z 0) -
-0.5 0 50 100 150 200 250 300 350
Time (seconds) 400‘
Figure 4. Wind Estimation Errors
I
54

(c)l999 American Institute of Aeronautics & Astronautics
NOTE: Vertical winds are not measured by the RAWIN
50 100 150 200 250 300 350 Time (seconds)
Figure 5. Wind Estimation Results
These results demonstrate the calibration system will provide significantly better estimates of winds than using the RAWIN system. By weighting the calibration system to match the descent rate of the test item, the two parachutes will be subjected to the same (as close as practical) atmospheric conditions. Using the measured GPS ground track velocities will give an adequate approximation for wind estimation. An interesting by-product of this technique appears to be the availability of vertical wind estimates. With the use of differential GPS and removing the density
corrected steady state descent rate, the vertical velocity accuracy of the measurement is expected to be better than 0.1 meters per second and therefore should present sufficient accuracies for measurement of vertical winds. Figure 6 presents a sample estimate of vertical winds. Unfortunately, no comparison system is available. Note, as expected, the more dramatic estimates were near the conclusion of the drop where thermals are prevalent.
10
-5 0 50 100 150 200 250 300 350 400
50 100 150 200 250 300 350 400 lime (seconds)
Figure 6. Vertical Wind Estimate
55

(c)l999 American Institute of Aeronautics & Astronautics
FLIGHT TEST RESULTS
The control system is intended to affect a change in horizontal velocity. This is best demonstrated by assessing the glide ratio, with the winds removed, of the system (horizontal velocity (Vd divided by vertical velocity (V&J. Figure 7 presents the glide ratio with the measured control inputs.
of the response due to control input as we are interested in the change of glide ratio at the time of control activation. A change in glide ratio is apparent at approximately 20 seconds ‘with no change in the state of the controls. At time zero, all PMAs were pressurized. The system was then allowed to stabilize to a ‘trim’ condition: The change in glide ratio can be attributed to this process. The remaining
r 400 l I I I I I 350
300
250
200
Figure 7. System Response - Glide Ratio
The results show that a nominal glide ratio of 0.4 to data clearly shows a correlatioh of glide ratio changes 0.5 exists with no control inputs. Potential causes of to the activation of the controls. this induced glide are motion induced by the oscillations, imperfections in length of the Figure 8 presents heading, measured by AHRS, and pressurized actuators, Ior errors in the wind estimate. the control activation. With &ireful examination of This nominal glide ratio does not limit the assessment these data, one can correlate changes in heading with
L -1ool 0 50 100 150 200 250 300 350 400
Time (seconds)
Figure 8. System Response - Heading
56

(c)l999 American Institute of Aeronautics & Astronautics
control inputs as indicated with the arrows on the graph. However, the response appears somewhat variable. The magnitude and direction of heading changes vary with the activation of the same control. The cause of this variation in heading response has not yet been identified. Factors such as the coning angle at the time of control input must be evaluated.
One interesting response is that of reduced oscillations with activation of a control. Figure 9 illustrates the pitch rate data collected from the AHRS.
Whenever a control was activated, the attitude rates were significantly reduced.
SinPle Control Input
Figure 10 isolates the response of a single control input. An increase in glide ratio from approximately 0.5 to approximately 1.0 with a time constant of about 4 to 5 seconds is observed. The system returns to its oscillatory trim state after about 5 seconds following removal of the control input. The reduced magnitude of oscillation or coning angle contributes to a reduced rate of descent and increased glide ratio.
I 1 0 50 100 150 200 250 300 350 400
Time (seconds)
Figure 9. System Response - Pitch Rate
1.5
40 50 60 70 Time (seconds)
Figure 10. Single Control Response
57

(c)l999 American Institute of Aeronautics & Astronautics
Two Simultaneous Control Inputs The position and velocity corrections are
Recall that the two control inputs can be activated simultaneously. The intent is to provide additional resolution (every 45 degrees) in controlling the system. Figure 11 presents the response with two simultaneous inputs.
pcG = pL +;m ; vcG = ~j,, = r’,+;k
$L=O assumed zero: for rigid bodies [41
115 120 125 130 135 Time (seconds)
Figure 11. Double Control Response
As exemplified by this. figure, there is no increase in performance with two control inputs over that achieved with one. In fact, the data indicates reduced response results from the simultaneous activation of two PMAs. This reduced performance is likely due to leading edge collapse (as observed in the ground- to-air video) of the parachute with two control inputs. The magnitude of the oscillations is not reduced as dramatically as with a single control input.
Note that the GPS instrumentation was installed in the payload, thus sensing the oscillatory motion of the system, as shown in the data. For control system design, understanding the heading and yaw rate responses of the system is critical. The heading and attitude rates, as measured by the AHRS, were correlated to the control1 inputs for analysis.
Representing Motion at the Center of Gravitv
The instrumentation was housed in the payload for these tests. However, presentation of the system’s motion about the center of gravity (cg) is desired for development of the rigid body model. To do this, the system’s state data must be translated to the cg.
58
Noting that: B”kL=g?As(w)L=~R(cLncL) [51
Substituting (5) into (4): V,, E & +;~(culc~) [61
This translation did not yield adequate results, as the oscillations were still apparent in the velocity data. It is presumed that in an oscillating parachute, the effects of apparent mass are changing due to the changes in acceleration of the parachute and associated air mass. With these changing forces in the parachute and no significant changes in the forces at the payload, an effective, change in center of gravity of the system results. To illustrate this situation, the lever-arm correction is determined:
Rearranging (4): L=:R(PcG - PL) [71
PL is measured. Pco is estimated using the measured velocity at the payload (VL). A low-pass filter is applied to VL to remove the effect of the oscillations. Using this filtered velocity (VW) and removing the wind velocity (VW), an estimate of the velocity at the center of gravity is obtained (v,). This velocity is then integrated from the parachute release point. The estimated location of the center of gravity was then determined using Equation 7. Figure 12 presents

(c)l999 American Institute of Aeronautics & Astronautics
these results. The mean lever arm corrections are: l,=O.O, I,=0.1, and 1,=3.94 feet. Yavus and Cockrell” demonstrated that acceleration of the air mass and angle of attack of the parachute significantly affects the apparent mass coefficients. Attempts were made to correlate these data to linear and angular acceleration of the payload. However, no direct correlation could be found. Should the oscillatory components of the data result in difficulties in parameter estimation, the flight test data must be filtered to remove the effects of oscillations.
- Rigid-body system - Only the motion after complete parachute
deployment is considered - Non-rotating earth, i.e. Earth-Centered, Earth
Fixed coordinate equals inertial coordinate - Wind axis equals inertial axis.
A detailed derivation of the equations of motion can be found in reference 7. Starting with Newton’s Law [ F = ma ; ‘F =m ’ t’B ] and Euler’s Law
150 200 250 lime (seconds)
Figure 12. Estimated Center of gravity Position
MODELING AND SIMULATION
Equations Of Motion
The kinematic equations of motion are determined assuming the parachute and payload system are a rigid body. A six-degree of freedom model is considered with the motion about the center of gravity. The notation and derivation follow the convention presented by Isaac Kamine~ as well as by Antonio Pascoal and Carlos Silvestre6. The derivation first considers an origin displaced from the system’s center of gravity by a distance P,,. In the implementation of these equations, the origin is moved to the center of gravity of the system.
Assumptions
Throughout this effort, the following assumptions were considered:
[ “.& =‘NB - M,Po x” vB (MT = mIs ; 13 is a 3x3 identity matrix and m is the system’s mass] the six- degree of freedom equations of motion can be shown’ to be
59

(c)l999 American Institute of Aeronautics & Astronautics
The apparent mass terms, as defined by Doherr and Saliaris*, are
a33 = {$PZ(+j3); a,, =: az E &,
aI5 =-ax = 0.2a,,/,; CZ, =I& =0.048Dp2~,, 1101
Expansion of the equations of motion is necessary for parameter estimation. This expansion also serves to validate the derivation of these equations against existing works in the field. First, the coordinate system axis is selected aligned with the parachute body axis but displaced from the center of gravity by a distance z. Expanding the equations of motion:
X=(m+a,,>2i+(mz+a,&+(ni-a&r-(m+a,)rJqw
Y =(m+a&-(m-a~)~+(m+a,,)m+(m+a,,)qr-(m+a,,)pw
Z=(m+a~,)iu-(nr+a,,)q~-.(~+~*,)q~-(m-a,)p~+(m+a~)pv
L= (Z,+au)p-(mz-a~)~i-(Z= -Zy-a55)qr-(mz+a,5)ru-.....
. . ..-(m-a.)pw+(a., -a&m
M=(Z, +a5&+(m+a,)ir+(Zx -ZL+a.+Jpr-....
. . . . -(m-+a,,)(qw-rv)-(a,,-a~,)uw
N=l,i u 11
These equations are validated by the work of Cockrell and Doher?.
Parameter Estimation
Parameter estimation is the process of determining aerodynamic stability and control derivatives from flight test data. A large number of techniques have been employed for parameter estimation in aircraft research. This study investigates the application of Maximum Likelihood Estimation methods described by Richard Maine and Kenneth Iliff of NASA”.
Wind tunnel data on the stability and control derivatives for this system are not available. This effort will encompass an initial start at tackling this problem. Parachute aerodynamics are truly non- linear and significantly coupled across axes. The maximum likelihood techniques that will be used implement linear models with no cross-coupling and therefore will not provide the optimum model. However, it appears a logical place to start.
Maine and Iliff defined the algorithm MMLE3 which was utilized for years as the accepted standard for aircraft parameter estimation. Once the system is modeled, the system’s equations of motion, expressed in state space form, are utilized to model the dynamic response due to a simulated input with an initial “guess” of the aerodynamic parameters. The modeled output is compared to the flight test results,
the unknown parameters are adjusted as to minimize the output error. A block diagram of this concept is provided in figure 13. Detailed descriptions of the MMLE3 algorithm as implemented in the MATLAB@ are provided in the user’s guide”.
Test Results
Input Mathematical Model
Figure 13. Parameter Estimation
To implement the equations of motion in these algorithms, two independent sets of equations are derived for the longitudinal and lateral-directional motions. The equations of motion [l l] were linearized and reduced following small perturbation theory. Note that these equations are left in the u,v,w form instead of the angles a and p as these terms were not measured during these flight tests.
Preliminary results indicate that these equations are over parameterized. Further investigations are needed to establish the proper model and complete the parameter estimation effort. An additional concern in successfully completing this effort is to properly describe the coning motion of a flat circular parachute. This motion will likely not be identified during the estimation process due to the averaging techniques implemented. Karl Doherr suggests the addition of noise to the average normal force or pitching moment coefficients to compensate for this problem. l2 This process will be attempted with future testing of the G-12 system.
60

(c)l999 American Institute of Aeronautics & Astronautics
CONTROL SYSTEM CONCEPT
During mission planning, a flight trajectory will be determined based on the best wind estimate at that time. The aircrew will determine the Computed Air Release Point (CARP) and will fly the aircraft to that point for air delivery of the system. The guidance, navigation, and control system will continuously determine its position error relative to the preplanned trajectory and determine the control inputs required to “slip” the system back to the preplanned trajectory. An outline of this concept is provided in Figure 14.
error will identify which control input must be activated to reduce the error as found by
u(input ) = sign & ( 1
As the complete aerodynamic model is not yet complete, a point mass model, with a constant user defined rotation in yaw, was utilized to evaluate the initial control system design in the interim until the parameter estimation effort is complete. This model included drag forces, weight, and changes in forces due to control activation. It is recognized that this is
Trajectory Generator
Body Axis Rotation (Heading Only)
System Trajectory
Figure 14. Control System Concept
The current configuration for the navigation system is not the best model for control development and it will a commercial GPS system for position and velocity and a magnetic compass for a heading reference2. In
likely not lead to an optimized control system. The control studies shown to date demonstrate the
the system, the GPS position (or the system’s feasibility of this concept and identify areas of simulated position) will be differenced with the significant concern. Figure 15 presents the position on the planned trajectory at the current preplanned trajectory, trajectory that the system altitude. This position error (PJ will then be rotated would fly with current winds and no control inputs to the body axis using heading only. The body-axis (labeled as current wind), and the system trajectory
.
Figure 15. Control Simulation Results
61

(c)l999 American Institute of Aeronautics & Astronautics
with control inputs. A wind profile, obtained during flight testing, was utilized to develop the preplanned trajectory. The system’s trajectory was simulated using a wind profile obtained 4 hours after the original profile. Figure 16 illustrates the same simulated trajectories but from a “look down” (x, y) view. Offset errors in the release point of up to 500 feet were introduced with similar results.
release point? Will the full-scale system have the same yaw characteristics of the smaller C-9 system? There remain these and many other challenges in completing the evaluation of this methodology.
Efforts are continuing to complete the parameter estimation to provide a comprehensive system model, evaluate the performance obtainable from the full-
-1400 I I -7000 -6000 -SO00 4000 -3000 -2000 -1000 0
North (feet)
Figure 16. Horizontal Trajectory (feet)
To achieve these results, a significant number of scale system using a G-12 parachute and 2200 pound payload, and optimize the control system design. control inputs were required as a function of altitude.
The control system has not yet optimized to minimize the number of control activations required.
With a yaw rotation of up to 1 degree per second, the concept worked well achieving errors less than 80 feet. Note that no navigation measurement errors were introduced at this stage
Yaw rotations greater than 1 degree per second were then introduced. The system could not be controlled to the desired flight path. The flight test showed yaw rotation rates typicahy greater than 2 degrees per second. The yaw rotation of the G-12 parachute system is a critical factor to this design.
With small yaw rotations, a control system can drive the system to the preplanned trajectory thereby demonstrating the feasibility of the concept.
CONTINUING WORK
CONCLUSIONS
The results to date indicate that glide ratios of 0.4 to 0.5 are achievable with the incorporation of PMAs with a flat circular parachute. Several challenges must be addressed in the design and optimization of the control system, specifically that of the parachute rotations.
Optimization of the control system may lead to the incorporation of a more robust control design potentially including proportional control instead of the “bang-bang” control design considered here. Vertigo, Incorporated and Boeing have a design concept to include proportional control.
The AGAS concept provides significant potential in providing a low-cost approach to getting materiel where it needs to be when it needs to be there.
Will the full-scale system provide sufficient control authority to overcome uncertainties in wind estimation and positiaa of the aircraft to the proper
62
(c)l999 American Institute of Aeronautics & Astronautics
APPENDIX - INSTRUMENTATION DESCRIPTION
System Architecture
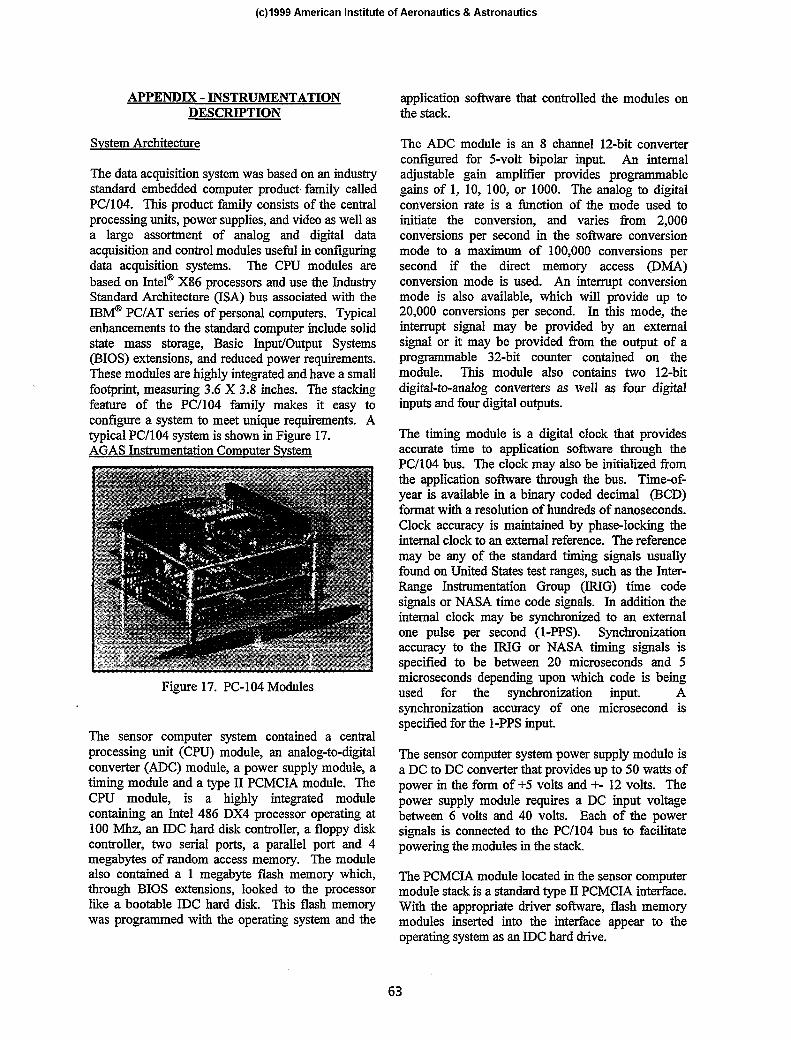
The data acquisition system was based on an industry standard embedded computer product, family called PC/104. This product family consists of the central processing units, power supplies, and video as well as a large assortment of analog and digital data acquisition and control modules useful in configuriug data acquisition systems. The CPU modules are based on Intel@ X86 processors and use the Industry Standard Architecture (ISA) bus associated with the IBM@ PC/AT series of personal computers. Typical enhancements to the standard computer include solid state mass storage, Basic Input/Output Systems (BIOS) extensions, and reduced power requirements. These modules are highly integrated and have a small footprint, measuring 3.6 X 3.8 inches. The stacking feature of the PC/104 family makes it easy to configure a system to meet unique requirements. A typical PC/104 system is shown in Figure 17. AGAS Instrumentation Computer Svstem
Figure 17. PC-104 Modules
The sensor computer system contained a central processing unit (CPU) module, an analog-to-digital converter (ADC) module, a power supply module, a timing module and a type II PCMCIA module. The CPU module, is a highly integrated module containing an Intel 486 DX4 processor operating at 100 Mhz, an IDC hard disk controller, a floppy disk controller, two serial ports, a parallel port and 4 megabytes of random access memory. The module also contained a 1 megabyte flash memory which, through BIOS extensions, looked to the processor like a bootable IDC hard disk. This flash memory was programmed with the operating system and the
application software that controlled the modules on the stack.
The ADC module is an 8 channel 1Zbit converter configured for 5-volt bipolar input. An internal adjustable gain amplifier provides programmable gains of 1, 10, 100, or 1000. The analog to digital conversion rate is a function of the mode used to initiate the conversion, and varies from 2,000 conversions per second in the software conversion mode to a maximum of 100,000 conversions per second if the direct memory access @MA) conversion mode is used. An interrupt conversion mode is also available, which will provide up to 20,000 conversions per second. In this mode, the interrupt signal may be provided by an external signal or it may be provided from the output of a programmable 32-bit counter contained on the module. This module also contains two 12-bit digital-to-analog converters as well as four digital inputs and four digital outputs.
The timing module is a digital clock that provides accurate time to application software through the PC/104 bus. The clock may also be initialized from the application software through the bus. Time-of- year is available in a binary coded decimal (BCD) format with a resolution of hundreds of nanoseconds. Clock accuracy is maintained by phase-locking the internal clock to an external reference. The reference may be any of the standard timing signals usually found on United States test ranges, such as the Inter- Range Instrumentation Group (IRIG) time code signals or NASA time code signals. In addition the internal clock may be synchronized to an external one pulse per second (I-PPS). Synchronization accuracy to the IRIG or NASA timing signals is specified to be between 20 microseconds and 5 microseconds depending upon which code is being used for the synchronization input. A synchronization accuracy of one microsecond is specified for the I-PPS input.
The sensor computer system power supply module is a DC to DC converter that provides up to 50 watts of power in the form of +5 volts and +- 12 volts. The power supply module requires a DC input voltage between 6 volts and 40 volts. Each of the power signals is connected to the PC/104 bus to facilitate powering the modules in the stack.
The PCMCIA module located in the sensor computer module stack is a standard type II PCMCIA interface. With the appropriate driver software, flash memory modules inserted into the interface appear to the operating system as an IDC hard drive.
63

Three modules comprised the GPS system computer: a CPU module, a power supply module, and a PCMCIA module. The hardware on these three modules is identical to the hardware in the sensor system computer modules. The CPU was programmed with the software required to interface with the GPS receiver sensor. A photograph of the packaged instrumentation system is included in Figure 18.
Figure 18. AGAS Instrumentation
AGAS Sensors Package
As mentioned, the AGAS instrumentation package contained four types of sensors: a GPS receiver, an AHRS unit, an accelerometer triad, and muscle state sensors. The GPS sensor consists of an Ll C/A code receiver and antenna. The receiver contains 12 independent channels, which track the GPS satellite signal in parallel. The receiver is capable of making measurements at a 20 1% rate and providing position and velocity output up to a 10 Hz rate (a 5 Hz rate was used for the AGAS implementation). Two RS- 232C I/O ports are available on the receiver to provide for control inputs and data outputs. Either of the I/O ports may be used to input commands and output data, or both may be used at the same time. An auxiliary I/O port provides a 1PPS.
The AHRS used in the AGAS instnmrentation system is a solid state device that measures three-axis attitude rate and integrates it to form attitude and heading. The attitude and heading is compared with two reference vertical :pendulums and a &i-axial flux- gate magnetometer. The resulting error is filtered and used to adjust the output of the system causing it to converge to the attitude of the vertical pendulums and to magnetic heading. The attitude and attitude rates are available on ;an RS-232C interface at a rate
(c)l999 American Institute of Aeronautics & Astronautics
of just less than 15 Hz. The specified accuracy of the AHRS data is shown in Table Al.
~~
Table Al. AIRS AIcuracies
The accelerometers in the AGAS instrumentation system are miniature devices With a full-scale output of 2 log. The acceleration experienced by these devices is converted to an electrical signal via strain gauges wired as a Wheatstone: bridge and attached to the acceleration-sensing element. The frequency response of these devices is nominally 0 to 300 Hz, with a minimum response of 140 Hz. The sensitivity of each element is approximately 8 milli-volts/g. Three accelerometers were mounted in a steel mounting block with their input axis orthogonal. One axis was defined to be the X-axis with the + input of the accelerometer in the direction of +X. This axis was designated as the axis pointing forward. The other two devices were mounted such that the +Y axis was pointing to the right and the +Z axis was pointing down. The mounting block was attached to the mounting structure with the +X axis of the accelerometer triad parallel to the AHRS +X axis.
The last group of sensors in the AGAS sensor system is the riser muscle state sensors. These were simply four pressure transducers, one, for each muscle. The four muscles in the control system have two states, extended and contracted. When the muscle is contracted, the pressure in the lines supplying air to the muscles is about 50 psi. When the muscle is extended, the pressure drops to nearly zero. Therefore, the pressure in the lines represents the state of the muscles (zero indicating the control is activated).
AGAS Instrumentation Software
The software residing in the processors shown in the diagram controlled the : hardware in the instrumentation package. Both processors ran the MSDOS@ operating system; and the application software was written in the C language.
The application software in the GPS processor was the same as that used in the Yuma Proving Ground’s Improved Vehicle Tracking System, and in conjunction with the receiver used, will produce sub- meter positioning when the data is post-processed to remove errors. This software initialized the GPS
64
(c)l999 American Institute of Aeronautics & Astronautics
receiver at power on and began to acquire the GPS satellite signal. While the AGAS package was in the aircraft, the GPS receiver tracked the signal via a retransmission system that received the signal external to the aircraft and retransmitted it inside the aircraft. Once the GPS receiver was tracking satellites, the processor collected the navigation data and recorded it on the recorder.
The sensor instrumentation processor also began initializing at power up. Early in this process, it started requesting a time message from the GPS receiver. Once this message was received with status indicating the GPS receiver had solved for GPS time, the sensor instrumentation processor initialized the timing module to the current UTC time. The accuracy of the time in the timing module was subsequently maintained by phase locking its clock to a 1 PPS signal from the GPS receiver. Once accurate time had been established in the timing module, the sensor processor enabled the AHRS output and began acquiring data.
The attitude and attitude rate data from the AHRS was transferred to the processor through an RS-232C interface. Each transfer contained a string of ASCII characters that included a unique header, the current AHRS attitude and attitude rate. The transfer was terminated with the ASCII character representing a carriage return. A period of inactivity on the interface separated the transfers. At the point the software detected the unique character designating the start of a transfer, the current time was sampled and stored. This time became the time of the attitude sample.
As soon as the attitude time sample was stored, the software acquired the accelerometer and pressure data from the ADC. This activity started with another sample of current time, which became the sample times of the data from the A/D converter. After the accelerometer and pressure data were sampled, the software converted the data to ASCII and recorded it in a file designated for A/D converter data.
At this point the software continued with the acquisition of the attitude record. Since the serial port driver operates under interrupt control, the attitude data that arrived at the port during the A/D sample interval was placed in a buffer. These data were retrieved, formatted, and recorded in the file designated for attitude data. This finished one loop of the data acquisition process and the software began to monitor the serial port for the beginning of a new attitude sample. The message rate from the
AHRS was approximately 15 Hz, so the sample rate for all data was also at approximately 15 Hz.
’ “Summary Report: New World Vistas, Air and Space Power for the 2 1st Century,” United States Air Force Science Advisory Board, 1997.
2 G. Brown, R. Haggard, R. Ahnassy, R Benney, S. Dellicker, “The Affordable Guided Airdrop System,” AIAA 99-1742, 15” CAESfAIAA Aerodynamic Decelerator Systems Technology Conference, June 1999.
3 R. Benney, G. Brown, K. Stein, “A New Pneumatic Actuator: Its Use in Airdrop Applications”, AIAA 99-1719, 15* CAES/AIAA Aerodynamic Decelerator Systems Technology Conference, June 1999.
4 T. Yavus and D.J. Cockrell, “Experimental Determination of Parachute Apparent Mass and Its Significance in Predicting Dynamic Stability,” AIAA, No. 81-1920.
’ I. Kaminer, “Lecture Notes, AA4276: Avionics Systems Design,” Naval Postgraduate School, 1998.
6 Carlos J. Silvestre and Antonio M. Pascoal, “Modeling of an Autonomous Underwater Vehicle,” University of Lisbon, January 22, 1992.
’ Dellicker, S.H., Low Cost Parachute Guidance, Navigation, and Control, Draft Master’s Thesis, Scott H. Dellicker, Naval Postgraduate School, Monerey, California, anticipated to be published June 1999.
* K.F. Doherr and C. Sal&is, “On the Influence of Stochastic and Acceleration Dependent Aerodynamic Forces on the Dynamic Stability of Parachutes,” AIAA Paper 81-1941.
’ D.J. Cockrell and K.F. Doherr, “Preliiinary Considerations of Parameter Identification Analysis From Parachute Aerodynamic Flight Test Data,” AIAA PaperNo. 81-1940.
lo Richard E. Maine and Kenneth W. Illif, “Application of Parameter Estimation to Aircraft Stability and Control,” NASA Reference Publication 1169, June 1986.
I1 State-Space IdentiJication Tool: User’s Guide, Mathworks, Inc., Natick, MA.
I2 E-mail correspondence between Karl Doherr and the authors, “Information on the Identification of Stability Derivatives,“, February 1999.
65