
Low-Cost Carriers and Low-Cost Terminals: Myth or Reality ...
22
IAJFTH Volume 4 , No, 1 2018 ـــــــــــــــــــــــــــــــــــــــــــــــــــــــــــــــــــــــــــــــــــــــــــــــــــــــــــــــــــــــــــــ ــــــــــــ ــــــــــــــــــــ28 Low-Cost Carriers and Low-Cost Terminals: Myth or Reality in Egypt Farouk Abdelnabi Hassanein Attaalla Mohamed Ramadan Ragab Faculty of Tourism and Hotels Fayoum University Abstract There is rareness of information about lowcost airlines and lowcost Terminals in Egypt and the Middle East. Most of the international publications are limited to information about Europe and North America, and few are from Asia and Australia. The current study aims to provide comprehensive information about lowcost airlines and lowcost airports, presentation of some international models of lowcost airlines and airports, and assessment of the Egyptian situation in the light of these two new phenomena. The methodology includes statistical analytical approach, purposive sample, and SPSS program to analyze data. The outstanding findings are that the traffic share of LCCs in Egypt is still modest and the absence of concept of LCTs in real practice. The current study recommends for estimating costs and benefits of lowcost carriers and building standard lowcost airports in Egypt. Keywords LowCost Carriers LowCost Terminals Legacy Airlines Major Airports Secondary Airports Introduction Airport patrons contain passengers, airlines, employees, concessionaires, tenants and others (Murray and Fodness, 2007).One of the most apparent influence of aviation deregulation has been the rise of the low cost carrier (LCC) sector which has rampaged the airline industry and placed challenges on airports (Graham, 2013). Whereas Barrett (2004) pointed out the lowcost carrier segment of the industry has grown fast and this growth has been accompanied with the reform of the airport business. Regionally, RoyoVela and MartinezGarcia (2010) stated that lowcost carrier services are important for many tourist destinations and lowcost scheduled flights, as opposed to charter services, are a relatively new phenomenon in Europe. Another view, Richard (2008) mentioned lowcost carriers catalyze the development of low cost airports (LCAs). Literature said that the gains to the passenger from the airline and airport competition are as follows (Barrett, 2004):
Transcript of Low-Cost Carriers and Low-Cost Terminals: Myth or Reality ...

IAJFTH Volume 4 , No, 1 2018 ـــــــــــــــــــــــــــــــــــــــــــــــــــــــــــــــــــــــــــــــــــــــــــــــــــــــــــــــــــــــــــــــــــــــــــــــــــــــــــــ
28
Low-Cost Carriers and Low-Cost Terminals: Myth or Reality in Egypt
Farouk Abdelnabi Hassanein Attaalla Mohamed Ramadan Ragab
Faculty of Tourism and Hotels Fayoum University
Abstract There is rareness of information about lowcost airlines and lowcost Terminals in Egypt and the Middle East. Most of the international publications are limited to information about Europe and North America, and few are from Asia and Australia. The current study aims to provide comprehensive information about lowcost airlines and lowcost airports, presentation of some international models of lowcost airlines and airports, and assessment of the Egyptian situation in the light of these two new phenomena. The methodology includes statistical analytical approach, purposive sample, and SPSS program to analyze data. The outstanding findings are that the traffic share of LCCs in Egypt is still modest and the absence of concept of LCTs in real practice. The current study recommends for estimating costs and benefits of lowcost carriers and building standard lowcost airports in Egypt.
Keywords LowCost Carriers LowCost Terminals Legacy Airlines Major Airports Secondary Airports
Introduction
Airport patrons contain passengers, airlines, employees, concessionaires, tenants and others (Murray and Fodness, 2007).One of the most apparent influence of aviation deregulation has been the rise of the low cost carrier (LCC) sector which has rampaged the airline industry and placed challenges on airports (Graham, 2013). Whereas Barrett (2004) pointed out the lowcost carrier segment of the industry has grown fast and this growth has been accompanied with the reform of the airport business. Regionally, RoyoVela and MartinezGarcia (2010) stated that lowcost carrier services are important for many tourist destinations and lowcost scheduled flights, as opposed to charter services, are a relatively new phenomenon in Europe. Another view, Richard (2008) mentioned lowcost carriers catalyze the development of lowcost airports (LCAs). Literature said that the gains to the passenger from the airline and airport competition are as follows (Barrett, 2004):

Attaalla. F Ragab. M ـــــــــــــــــــــــــــــــــــــــــــــــــــــــــــــــــــــــــــــــــــــــــــــــــــــــــــــــــــــــــــــــــــــــــــــــــــــــــــــــــــــــــــ
29
• Lower air fares. • Using smaller airports with shorter waiting times for baggage, shorter
walking times and less confusion at airports. The problem of study is that the majority of literature articles have focused on the Low cost carriers and low cost terminals in Europe and a few researches on the Asia and Pacific regions. Moreover the academic literature is far less clear and conclusive about the overall impacts of LCC operations at airports (Graham, 2013). Furthermore, the increase in direct competition between local cost carriers and traditional airlines at small airports is not clear and need more research (Givoni et al., 2016). Moreover, the suggestion that the growth of lowcost airlines leads to the development of lowcost airports facilities has basic coincidences for airport planning and investment (Richard, 2008). The main objectives of the current are: • To provide a holistic explanation about the different aspects of LCCs and
the LCTs. • To overview some of the eminent international experiences of LCCs and
LCTs. • To evaluate the Egyptian aviation industry status in view of both of
requirements and impacts of LCCs and LCTs.
Literature Review Lccs Literature Review The air transportation deregulation has undoubtedly had the impact on increasing the number of LCCs (Wang, Bonilla, & Banister, 2016), which have become prevalent emulator in the air transport sector (JIA, 2012; Gittell & Koch an, 2006). Moreover liberalizing the air aviation industry is salutary in order to attract more rivals to the airline sector, which leads to lower airfares (Hsu, Yen, Chang, & Woon, 2016; Lin, 2011; Smyth & Pearce, 2006). According to Abd elhady et al. (2019) the product is considered the most important element of the marketing mix elements for FSCs. In Contrast, the price was considered the most important criterion for LCCs. The LCC sector is a major player in the airline and airport sector Especially lowcost carriers offer the prospect of commercial viability to somewhat smaller airports because they frequently seek locations away from major, crammed hubs (Francis et al., 2003). In the year 2011 there was 21% increase in revenues and 12% increase in passengers due to the operations of LCCs (Airline Business, 2012). However, modicum is known about the profiles of those LCC travellers and their choices among various flight attributes (RoyoVela and MartinezGarcia, 2010). They, in the same time, give a display about the most common LCC travellers' categories include pricesensitive, destination and flight conscious, nonsensitive, business, educational and second residence travelers. The

Low-Cost Carriers and Low-Cost Terminals: Myth or Reality in Egypt ـــــــــــــــــــــــــــــــــــــــــــــــــــــــــــــــــــــــــــــــــــــــــــــــــــــــــــــــــــــــــــــــــــــــــــــــــــــــــــــ
30
savors and characteristics of their trip are: flight properties (flight fares, waiting times, flight duration, and flight quality); trip and destination variables (package tour, nearness of the airport to trip destination, valuation of the destination, satisfaction with stay at destination); the number of times that individual had previously flown with lowcost flights (RoyoVela and MartinezGarcia, 2010). Operational competence is not strategy but actually follows from it. Airlines that have selected a lowcost tactic have achieved these low aliments out of rusticity of product design, rusticity of processes and rusticity of organization. Other airlines seek lower costs through lower prices (Gillen and Lall, 2004). In this context, Graham (2013), reviews the attributes of the LCC model which include low fares, increased aircraft and crew exploitation, single aircraft type, lower salaries, elevated seating density and single class of service, no free inflight food/drink or other frills, direct internet selling, pointtopoint services, short/mediumhaul route structures, and the use of secondary airports. And update information on services provided by lowcost carriers, Murray and Fodness (2007) pointed out that Passengers' expectations of an airport service quality are a multidimensional, hierarchical construct that includes three key dimensions: function, interaction and diversion Figure 1 shows the market share of low costcarriers and full service carriers worldwide in 2013. It is clear that low cost carriers (LCCs) have taken over 23% of the total air traffic, and 22% of market share by available seat kilometers (ASKs) then.
Fig.1: The market share of low costcarriers and full service carriers worldwide 2013 Source: (Airline Profiler, 2015)
According to (IATA’s statistics, 2017) there were estimated 3.8 billion air passenger departures globally in 2016, a strong increase over the 3.5 billion

Attaalla. F Ragab. M ـــــــــــــــــــــــــــــــــــــــــــــــــــــــــــــــــــــــــــــــــــــــــــــــــــــــــــــــــــــــــــــــــــــــــــــــــــــــــــــــــــــــــــ
31
departures in 2015. Of these, almost 50% (some 1.9 billion) were domestic departures, 35% (1.3 billion) were international departures and the remaining 16% (604 million) were connecting departures, furthermore LCCs accounted for 27% of overall seats flown globally in 2016, up from 19% a decade ago. the top three markets were unchanged in 2016, with the US clearly ahead of the pack, accounting for Around 815 million of the total number of global passengers, China and Japan are ranked 2 and 3, with 490 million and 141 million departures, respectively. As well as low cost carriers operated 11% of total international traffic in the Middle East compared to 5% in the EU, 20% of total intraregional traffic in the Middle East compared with 49% in the EU, and 6% of total domestic traffic in the Middle East compared with 32% in the EU over the five years average 20102014 . The figure 2 provides more details.
Fig.2: The LCC market share in 2014 Source: (Amadeus, 2014)
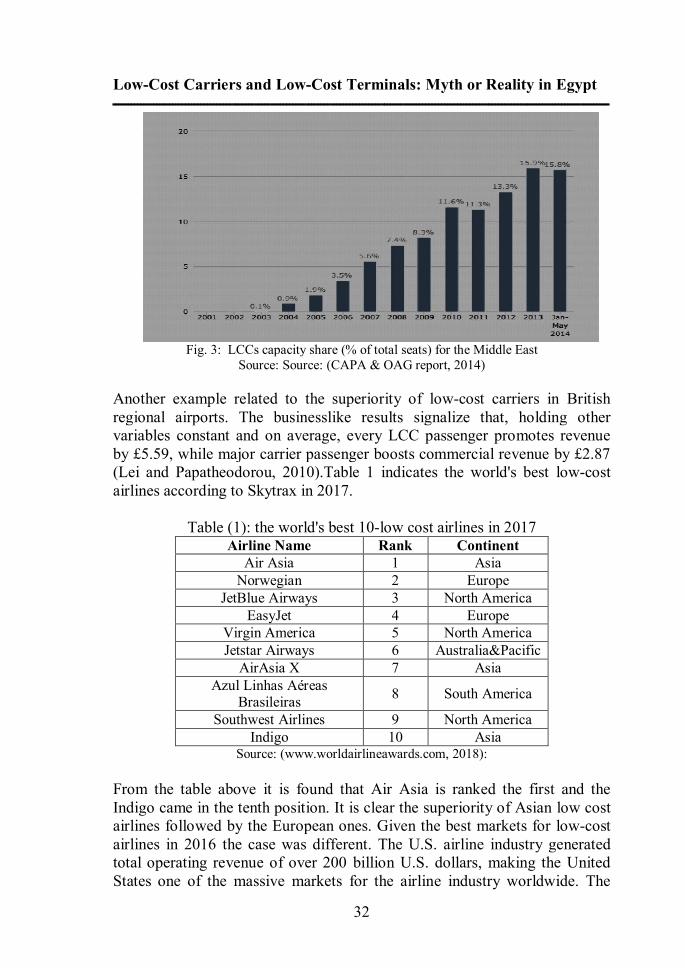
Furthermore LCCs capacity share for available seatkilometers within the Middle East, increased by (15.9%) in 2013, compared to (0.1%) in 2003. More information is illustrated in figure 3. In additions, LCCs are the major players since almost 50% of intraEuropean air flights are serviced by low fares airlines (Smith and Dziedzic, 2016).
Low-Cost Carriers and Low-Cost Terminals: Myth or Reality in Egypt ـــــــــــــــــــــــــــــــــــــــــــــــــــــــــــــــــــــــــــــــــــــــــــــــــــــــــــــــــــــــــــــــــــــــــــــــــــــــــــــ
32
Fig. 3: LCCs capacity share (% of total seats) for the Middle East
Source: Source: (CAPA & OAG report, 2014)
Another example related to the superiority of lowcost carriers in British regional airports. The businesslike results signalize that, holding other variables constant and on average, every LCC passenger promotes revenue by £5.59, while major carrier passenger boosts commercial revenue by £2.87 (Lei and Papatheodorou, 2010).Table 1 indicates the world's best lowcost airlines according to Skytrax in 2017.
Table (1): the world's best 10low cost airlines in 2017 Airline Name Rank Continent
Air Asia 1 Asia Norwegian 2 Europe
JetBlue Airways 3 North America EasyJet 4 Europe
Virgin America 5 North America Jetstar Airways 6 Australia&Pacific
AirAsia X 7 Asia Azul Linhas Aéreas
Brasileiras 8 South America
Southwest Airlines 9 North America Indigo 10 Asia
Source: (www.worldairlineawards.com, 2018):
From the table above it is found that Air Asia is ranked the first and the Indigo came in the tenth position. It is clear the superiority of Asian low cost airlines followed by the European ones. Given the best markets for lowcost airlines in 2016 the case was different. The U.S. airline industry generated total operating revenue of over 200 billion U.S. dollars, making the United States one of the massive markets for the airline industry worldwide. The

Attaalla. F Ragab. M ـــــــــــــــــــــــــــــــــــــــــــــــــــــــــــــــــــــــــــــــــــــــــــــــــــــــــــــــــــــــــــــــــــــــــــــــــــــــــــــــــــــــــــ
33
country also has about a third of all airports in the world more than any other country: around 15,000 airports of all sizes, out of which more than 5,000 have paved runways. As an example, HartsfieldJackson Atlanta International in Georgia was the busiest airport in the country, having handled a slight over 101 million passengers in 2016 alone (Statisa, 2018).
Low-Cost Terminals (LCTs) In today's airport business, two fundamental terminal types can be discrete; traditional terminals and lowcost terminals. A traditional terminal is designed to handle the flights and passengers of national carriers (NCs) with full service facilities. While a lowcost terminal is developed by low capital investment cost with the purpose of reducing costs and increasing efficiency (Njoya and Niemeier, 2011). Lowcost airports contend traditional airports in three basic elements (Richard, 2008; William, 2012): • In a metropolitan multiairport system, secondary airports provide
alternatives to the major hubs and perhaps are more convenient to some passengers. However, there is a challenge with defining secondary airports.
• Secondary airports offer opportunities to turnoff major airports. • Lowcost airlines and airports together form parallel networks of routes
which compete with those of the legacy airlines and the major airports. In general, most of all the LCTs are in Europe with a few in the US and
Asia. Examples are Marseille, Bordeaux, Lyon, Tampere Pirkkala, Turku, Budapest, Amsterdam, JFK New York, Singapore, Kuala Lumpur and Zhengzhou (Graham, 2013). The need of a secondary airport is trenchant to decongest the skies when the major airports become saturated, giving an option to aircraft operators that are segmented as fullservice airlines, lowcost carriers, regional airlines and general aviation. However, the high cost of operations at these airports has been a bugbear for all airline operators (Chandrakanth, 2015). Moreover, some airports have developed LCTs to be appropriate for needs of lowcost carriers. The main purpose of the LCTs is to provide minimalistic and reliable terminal facility at a reasonable price (Njoya and Niemeier, 2011). Furthermore, the transformation from secondary airport to lowcost airport is a result of the growth in the LCC industry (Hanaoka and Saraswati, 2011). Development of a LCT may be either a fully new building or a refurbishment one converted from previous use as a cargo, charter terminal, or maintenance facility. The refurbishment option is popular in Europe and has the advantage of minimizing investment costs (Graham, 2013). According to the general manager of Ryanair, the LCCs need three requirements of any LCT which are: low airport charges, fast turnaround times, and onestorey airport terminals (Richard, 2008). Another opinion sees that location and configuration are deemed to be two of the main factors

Low-Cost Carriers and Low-Cost Terminals: Myth or Reality in Egypt ـــــــــــــــــــــــــــــــــــــــــــــــــــــــــــــــــــــــــــــــــــــــــــــــــــــــــــــــــــــــــــــــــــــــــــــــــــــــــــــ
34
which influence the operational competence of a LCT and its ability to process quickly aircraft turnarounds (Hanaoka and Saraswati, 2011). Outstanding example is the distant site of the LCT from the main terminal at Kuala Lumpur has been one of the master reasons why the LCC Jetstar did not use it and as a consequence it is being replaced with a building close to the main terminal. Other support case is in Singapore, Air Asia and Jetstar together did not use the purpose built LCC facilities because transfer passengers have to go through immigration and pick up their luggage (Graham, 2013). In this context, Hanaoka and Saraswati (2011) explain the best model development of a LCT that achieves two objects: the first to minimize the rate of passenger walking range from the waiting point to aircraft gates, and the second to minify the average aircraft taxiing space required from the runways to the apron area and the obverse is right. Distinctions between LCTs and conventional terminals may be visible in three semblances: checkin lounges, departure area, and arrival lounges. In checkin hall there are selfservice checkin kiosks and finite deluxe lounges. In the departure area there is a limited seat configuration accompanied with standing space for most travellers. In the arrival area there is one or two conveyor belts for baggage handling (Hanaoka and Saraswati, 2011). Table 2 indicates the world's best lowcost terminals according to Skytrax in 2017.
Table (2): the world's best 10lowcost terminals in 2017 Airport Name Rank Continent
Tokyo Narita T3 1 Asia Kansai T2 2 Asia
Kuala Lumpur LCCT 3 Asia Melbourne T4 4 Australia London Stansted 5 Europe
Brussels Charleroi 6 Europe East Midlands 7 Europe
Milan Bergamo 8 Europe Luton 9 Europe
Berlin Schönefeld 10 Europe Source: (www.worldairlineawards.com, 2018)
Table 2 shows that Europe has the highest number of lowcost airports, while Tokyo Narita T3 in Japan is ranked first in the world.
Cases From Usa Delta Airlines was the largest airline in the world based on sales, reaching more than 40 billion U.S. dollars in sales revenue in 2015. Passenger airlines can face much scanning for their passenger contentment and repose. A 2016 North American Airline Satisfaction Study by J.D. Power & Associates

Attaalla. F Ragab. M ـــــــــــــــــــــــــــــــــــــــــــــــــــــــــــــــــــــــــــــــــــــــــــــــــــــــــــــــــــــــــــــــــــــــــــــــــــــــــــــــــــــــــــ
35
registered Alaska Airlines and Delta Airlines as the best traditional carriers for satisfaction, while lowcost airline JetBlue Airways gained the top position of lowcost carriers tested in the study. United Airlines, Delta Airlines, American Airlines and Southwest Airlines are the top ranked airlines based on 2016 domestic market share. Delta operates out of Atlanta, and HartsfieldJackson Atlanta International Airport, Delta’s hub, sees the most passenger traffic in the United States. At 358 billion, American Airlines boasted the most passenger kilometers flown in 2015. Chicagoheadquartered United Airlines is a subsidiary of United Continental Holdings. United has flights to 238 domestic destinations and 60 different countries, the George Bush Intercontinental Airport in Houston being its largest passenger hub with over 40 million passengers every year. The statistic represents the U.S. domestic market share of leading airlines in 2016. During this time period, Southwest Airlines was the leading airline in the U.S., with a domestic market share of just over 19 percent, followed closely by Delta Airlines. Figure 4 shows further clarification (Statista, 2018).
Fig. 4: Domestic market share of leading U.S. airlines in 2016 Source: (Statista, 2018)
Fig.5 portrays Southwest Airlines Company's revenue passenger miles (RPMs) from the fiscal year of 2010 to the fiscal year of 2016. In the fiscal year of 2016, the superior lowcost carrier transported passengers just under 125 billion miles. In that selfsame year, the airline had amplitude of over 184 billion available seat miles (Statista, 2018).
Low-Cost Carriers and Low-Cost Terminals: Myth or Reality in Egypt ـــــــــــــــــــــــــــــــــــــــــــــــــــــــــــــــــــــــــــــــــــــــــــــــــــــــــــــــــــــــــــــــــــــــــــــــــــــــــــــ
36
Fig. 5: Southwest Airlines Co.'s revenue passenger miles (RPMs) from FY 2010 to FY 2016
(in billions) Source: (Statista, 2018)
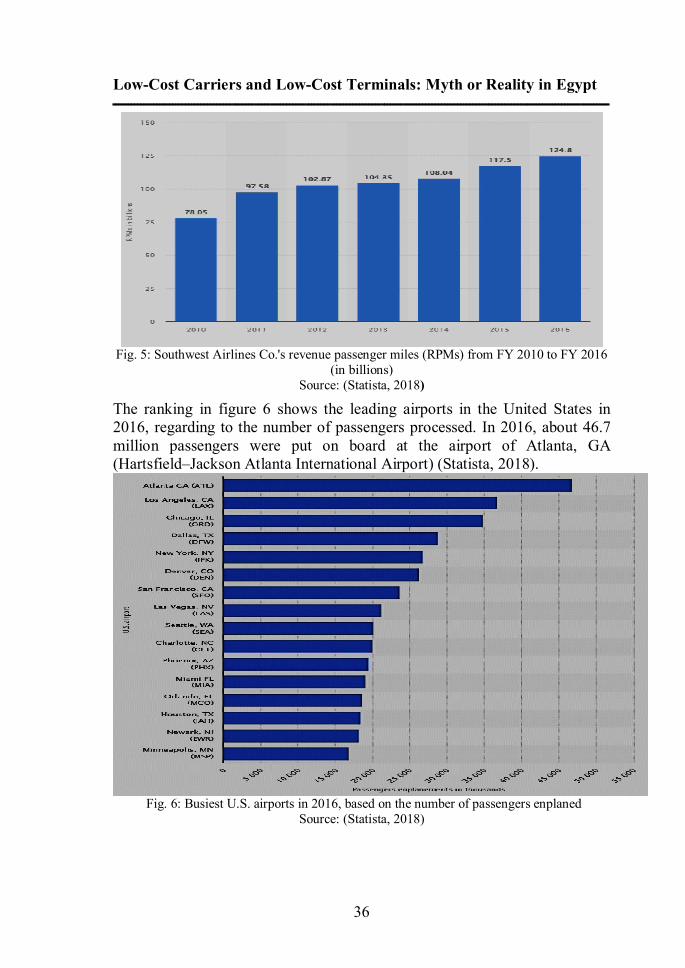
The ranking in figure 6 shows the leading airports in the United States in 2016, regarding to the number of passengers processed. In 2016, about 46.7 million passengers were put on board at the airport of Atlanta, GA (Hartsfield–Jackson Atlanta International Airport) (Statista, 2018).
Fig. 6: Busiest U.S. airports in 2016, based on the number of passengers enplaned Source: (Statista, 2018)

Attaalla. F Ragab. M ـــــــــــــــــــــــــــــــــــــــــــــــــــــــــــــــــــــــــــــــــــــــــــــــــــــــــــــــــــــــــــــــــــــــــــــــــــــــــــــــــــــــــــ
37
Cases From Europe Through Europe, traditional airlines are confronting with everincreasing rivalry from lowcost carriers (LCCs), accounting for roughly 50% of total European flights. The Europe’s major LCCs are filling their cabins and their coffers. The most prosperous, Ireland’s Ryanair, was on track for a net profit of $1.4 billion in 2017. Ryanair was running at load factors of 95% and has a stunning ability to go on stripping out costs; its recent Q3 results saw costs exfuel drop by 6% compared to a year before. In additions, The UK’s massive market share of passengers, for instance, was held not by British Airways, but EasyJet. Moreover, most passengers in Spain, Italy and Poland travel with Ryanair than with Iberia, Alitalia or LOT Polish Airlines. Furthermore, the most widespread operator visible in much of Eastern Europe was Hungarybased LCC Wizz Air (Dron, 2017).
• The Charleroi–Ryanair case. The use of secondary airports and especially their financial arrangements with LCCs has outraged some legal argument. In November 2001, the Walloon region, owner of Charleroi airport, signed a covenant with Ryanair, offering particular stipulations for the use of the airport. These terms involved a lowering in landing fees, a constant price of one hour per passenger for ground handling services, and financial support for the opening of Ryanair’s outpost and for advertisement and other forms of promotion of the airline’s flights. Compared to published rates for regional airports, Ryanair enjoyed a 50% recoup in landing fees and paid 10% of the published handling charges (Barbot, 2006).
• Costbenefit Analysis (CBA) of Low Cost Carriers for Portuguese Airports. To estimate the outcomes of low cost routes on the local economy, there was an assessment of the serene economic impact of LCCs. There was an adoption for a CBA methodology in order to assess the overall economic wellbeing generated by LCC routes in the areas economically influenced by four Portuguese airports, namely the airports of Faro, Lisbon, Funchal and Oporto. Easyjet and Ryanair airlines had the major lot of the low cost market in Portugal. In 2012, they together accounted for about 78% of the whole traffic on LCC (7.6 million passengers). Easyjet carried approximately 3.8 million passengers (39.2% of LCC traffic) and Ryanair around 3.7 million passengers (38.8% of LCC traffic). The gross revenue created by low cost airlines can be calculated as the sum of income from employment created plus growth in tourism income, which is considered equivalent to tourist spending. To quantify these benefits, there was consideration of only passengers disembarking from LCCs, from which responsible recorded an increased induced income through job creation and an increased turnover in the tourism sector. Particularisms split the effect on employment into three types of effects: direct, indirect and induced. With regard for the direct impact, they deemed the employment generated by the

Low-Cost Carriers and Low-Cost Terminals: Myth or Reality in Egypt ـــــــــــــــــــــــــــــــــــــــــــــــــــــــــــــــــــــــــــــــــــــــــــــــــــــــــــــــــــــــــــــــــــــــــــــــــــــــــــــ
38
induced increase of passengers, given the employment average per 1,000 travelers carried by Ryanair and Easyjet: 0.11 workers in 2005 and 0.13 in 2012. Concerning the indirect effect, particularists presumed a multiplier effect on direct employment, whereas induced employment arise from the multiplier effect of the direct and indirect employment generated (Costa, 2014). As regards (EURlex, 2015) the market portion of fullservice carriers (FSCs) in Europe diminished, due to liberalization of air transport sector in 1990s. In contrary, lowcost airlines (LCAs) made more use of the liberalization of 5th /7th freedom and "Cabotage" rights within the EU (EURlex, 2015). Hence, the deregulation of the aviation sector has certainly had the great influence of growing the number of LCCs, which have become a dominant competitor in the air transport market. Furthermore, liberalizing the air aviation sector is advantageous so as to attract more competitors to this industry, which leads to lower airfares (Abdelhady et al., 2018).The figure 7 presents the effect of liberalization on market access to EU by LCCs.
Fig. 7: market access by LCCs to EU market Source: (EURlex, 2015)

Attaalla. F Ragab. M ـــــــــــــــــــــــــــــــــــــــــــــــــــــــــــــــــــــــــــــــــــــــــــــــــــــــــــــــــــــــــــــــــــــــــــــــــــــــــــــــــــــــــــ
39
• Again, according to (Ryanair, 2016), the air traffic of Ryanair increased by 18% to 106.4 m travelers in 2016, compared to 90.6 m in 2015. As well as load factors boosted from 88% to 93% in the year 2015. Figure 8 clarifies the considerable increment in traveler numbers out of Ryanair in 2007, in comparison with the year 1996. More details are obvious in figure 8.
Fig. 8: Ryanair Passenger Growth 19962007
Source: (Ryanair, 2016)
Here is a display for the three Cheapest Airports to fly to in Europe; they offer the main facilities for passengers to embark their flight (Hopper.com, 2017): • A round trip to Europe for $755 (or much less)? This budgetminded
traveler's dream is well within reach if you make Stockholm your next destination. Arlanda Airport has seen an amazing 30% passenger growth over the past five years, becoming a major gateway for international travel to destinations all over the world. New Yorkers can fly there with Scandinavian Airlines, United, Delta or Norwegian Air Shuttle, the last of which also offers service to Oakland and Los Angeles.
• Who could resist the appeal of Iceland's unique volcanic landscape and surprisingly trendy capital? Keflavik International Airport, which serves as a hub for both Icelandair and WOW Air, makes it easy to cross this awesome destination off your bucket list by offering scheduled flights to and from a whopping 10 locations in the United States: Anchorage, Baltimore, Boston, Denver, Minneapolis, Newark, New York City, Orlando, Portland, Seattle, and Washington. And with an average flight price of just $775!
• Malpensa Airport is the largest airport serving the Milan Metropolitan area. It handled 18 million passengers in 2012 (twice as much as Linate) and is a

Low-Cost Carriers and Low-Cost Terminals: Myth or Reality in Egypt ـــــــــــــــــــــــــــــــــــــــــــــــــــــــــــــــــــــــــــــــــــــــــــــــــــــــــــــــــــــــــــــــــــــــــــــــــــــــــــــ
40
focus city for a handful of airlines, including EasyJet and Alitalia. Flights to and from the US, at an average roundtrip cost of $781, include direct service to New York and Miami as well as seasonal service to HartsfieldJackson Atlanta International Airport. All in all, Milan Malpensa is a better option than Linate for fliers eager to reach Milan without layovers.
Table 3: Low Cost Terminals in Europe 2017
Airport Name Airport
Code City
Country
Arlanda Airport ARN Stockholm Sweden Keflavik International Airport
KEF Sandgerdi Iceland
Milan Malpensa Airport MXP MILAN Italy Copenhagen Airport CPH Copenhagen Denmark Dublin Airport DUB Dublin Ireland Linate Airport LIN Milano Italy Chopin Airport WAW Warsaw Poland Tegel Airport TXL BERLIN Germany Vienna International Airport VIE Vienna Austria Gatwick Airport LGW London England
Source: (Hopper.com, 2017)
It is clear that the top ten airports of low cost airports are distributed and are present in most European countries. This is consistent with what was mentioned earlier in this study in terms of Europe's acquisition of the largest proportion of the world's lowcost airports.
Cases From Asia • Singapore's Civil Aviation Authority opened the lowcost airline terminal in
March 2006. The new terminal includes two adjacent singlestory buildings for departure and arrival. The Civil Aviation Authority of Singapore (CAAS) put a $13 traveler fee for passengers departing from the new terminal (Lott, 2005).
• The Narita Airport Terminal 3 Experience with Jetstar Japan The new Terminal 3 at Narita Airport was opened on April 8, 2015 and was consecrated foremost to Japanese lowcost airlines, starting with Jetstar Japan, Jetstar Airways, Vanilla Air, Spring Japan and Jeju Air. These lowcost carriers have made it potential to take domestic flights for unbeatable fares, particularly if one is planning to travel to Hokkaido or Okinawa. The Terminal 3 is optimized ergonomics in its design according to the concept of naivety; functionality and userfriendliness; and a subtle Japanese touch to the decoration of the terminal. At the terminal, welldesigned directional signage greet arriving passengers and a few minutes’ walk to get to the

Attaalla. F Ragab. M ـــــــــــــــــــــــــــــــــــــــــــــــــــــــــــــــــــــــــــــــــــــــــــــــــــــــــــــــــــــــــــــــــــــــــــــــــــــــــــــــــــــــــــ
41
immigration queues. The luggage handling is distinctly effective. The pathway connecting Terminal 3 and 2 has colored running tracks to guide passengers and it takes 10 minute walk. The Jetstar Group’s existence at the terminal is very evident through checkin counters which are easily found close to the departures entrance and the selfcheckin pods with large touchscreens. Security and immigration checks are smooth and hasslefree with straightforward process. There are facilities for international transfers, allowing visafree connections to the other airlines that have a codeshare or interline agreement with Jetstar Japan or Jetstar Airways (www.japanexperience.com, 2018).
Cases From Middle East and Egypt
• Flynas Wins Skytrax Award for Best Low Cost Airline in the Middle East for 2017
The Saudi national carrier, Flynas, received a Skytrax award for Best Low Cost Airline in the Middle East for 2017. The award ceremony was held in the French capital, Paris, during the International Paris Air Show. The Skytrax award symbolizes over and above recognition for Flynas which also won the World Travel Awards Best Low Cost Airline of the Middle East in 2015 and 2016, and lately was awarded the Best Airline Supporting Arab Tourism. Flynas is the leading lowcost carrier of Saudi Arabia and has a fleet of 29 aircraft, operating over 1000 scheduled flights every week to 17 destinations within Saudi Arabia and 15 international destinations. Since its launch in 2007, Flynas had successfully carried more than 32 million passengers from its bases of Riyadh, Jeddah, Dammam and Abha (www.Flynas.com, 2018).
• There are several airports in Egypt serving good transportation facilities to the tourists across the globe as it is clear in the table 4 below. Cairo International Airport is considered to be the main airport of Egypt that is situated around 15 miles away from the northern Egyptian city towards the northeast region. Beside this, there are outstanding airports in Egypt especially: Borg El Arab Airport, Luxor International Airport, Hurghada International Airport, Sharm elSheikh International Airport, Aswan International Airport, Abu Simbel Airport, Assiut Airport, Taba International Airport, Marsa Alam International Airport, El Nouzha Airport, Mersa Matruh Airport, and El Arish International Airport.

Low-Cost Carriers and Low-Cost Terminals: Myth or Reality in Egypt ـــــــــــــــــــــــــــــــــــــــــــــــــــــــــــــــــــــــــــــــــــــــــــــــــــــــــــــــــــــــــــــــــــــــــــــــــــــــــــــ
42
Table (4): Egyptian Airports
Airport Name Airport
Code City Airport Name
Airport Code
City
Aswan Airport ASW Aswan Cairo
International Airport
CAI Cairo
Mersa Matruh Airport
MUH Mersa Matruh
Luxor Airport LXR Luxor
El Nozha Airport
ALY Alexandria Sidi Barani
Airport SQK Sidi Barani
Abu Simbel Airport
ABS Abu simbel Abu Rudeis
Airport AUE Abu Rudeis
Mount Sinai Airport
SKV Santa
Katarina Kharga Airport UVL Kharga
Ramadan Airport
TFR Ramadan Al Alamain International
Airport DBB Dabaa
Tour Sinai Airport
ELT Tour Sinai Dakhla Airport DAK Dakhla
Hurghada Airport
HRG Hurghada Sharm El Sheikh
International Airport
SSH Sharm El Sheikh
Shark Elowainat
Airport GSQ
Shark Elowainat
Port Said Airport PSD Port Said
Taba International
Airport TCP Taba Siwa Airport SEW Siwa
Marsa Alam Internatiomal
Airport RMF Marsa Alam
Al Arish International
Airport AAC Al Arish
Borg El Arab Airport
HBE Alexandria El Minya Airport EMY El Minya
Asuit Airport ATZ Asuit Sohag Airport HMB Sohag Source: (www.wikipedia.com, 2018)
However, all these airports do not take into consideration the standards and requirements of lowcost airports, according to the officials of lowcost airlines in Egypt during interviews with them.
Egypt Field Results and Discussions This part includes field visits to the headquarters of six outstanding and standard lowcost airlines operating their flights in Egypt. These companies are Air Cairo, Air Arabia, Flynas, Nile Air, Air Italy, and Agean Air. These airlines depend mainly on Cairo International Airport and Borg El Arab Airport for several reasons as follows (Abdelhady et al., 2018):
1. Expanding market share in the aviation industry.

Attaalla. F Ragab. M ـــــــــــــــــــــــــــــــــــــــــــــــــــــــــــــــــــــــــــــــــــــــــــــــــــــــــــــــــــــــــــــــــــــــــــــــــــــــــــــــــــــــــــ
43
2. Reducing the aircraft operating costs. 3. Reducing the risk of lost revenue potential from empty seats.
The choice of the companies is based on the lowcost business plan model excluding any other airline, whether full service, regional or helicopter, flying ambulance, or aviation training. The current research focuses on LCCs' business in Egypt as OriginDestination Market for their flights. The collection of primary data has required designing a short questionnaire divided into two main parts based on the literature data about LCCs and LCTs mentioned in the previous studies. The filed visits were conducted during May 2018. The primary data are analyzed by the Statistical Package for Social Sciences SPSS and the table 5 provides more details herein.
Table (5): Results of SPSS
Item Yes No Mean Std. Deviation
Hearing about the concept of low cost carriers.
4 (66.7) 2 (33.3) 1.3 0.52
Average 120 % of the air flights achieved by low cost carriers in Egypt.
6 (100) 1.0 0.00
Type of the airports do low cost carriers prefer for their flights.
Secondary 1 (16.7)
Major 5 (83.3)
1.8 0.41
A low-cost approach of your low cost carrier is based on: Simplicity of product design 4 (66.7) 2 (33.3) 1.3 0.52 Simplicity of processes 5 (83.3) 1 (16.7) 1.2 0.41 Simplicity of organization 5 (83.3) 1 (16.7) 1.2 0.41 low prices 4 (66.7) 2 (33.3) 1.3 0.52
A low-cost airline operates flights to and from Egypt towards: North America 3 (50.0) 3 (50.0) 1.5 0.55 South America 6 (100) 2.0 0.00 Europe 5 (83.3) 1 (16.7) 1.2 0.41 Australia 6 (100) 2.0 0.00 Asia 6 (100) 1.0 0.00 Africa 4 (66.7) 2 (33.3) 1.3 0.52 Hearing about the low cost terminals.
2 (33.3) 4 (66.7) 1.7 0.52
Design of the low cost terminals minimizes the average passenger walking the average aircraft taxiing.
4 (66.7) 2 (33.3) 1.3 0.52
Merits that the low cost terminals provide to low cost carriers: Reduction in landing charges 3 (50.0) 3 (50.0) 1.5 0.55 Fixed price per passenger for ground handling services
6 (100) 1.0 0.00

Low-Cost Carriers and Low-Cost Terminals: Myth or Reality in Egypt ـــــــــــــــــــــــــــــــــــــــــــــــــــــــــــــــــــــــــــــــــــــــــــــــــــــــــــــــــــــــــــــــــــــــــــــــــــــــــــــ
44
Financial support for the LCCs' advertisement & promotion of flights
4 (66.7) 2 (33.3) 1.3 0.52
Egyptian airports that provides services for your low-cost airline Aswan Airport 4 (66.7) 2 (33.3) 1.3 0.52 Mersa Matruh Airport 6 (100) 2.0 0.00 El Nozha Airport 6 (100) 2.0 0.00 Abu Simbel Airport 6 (100) 2.0 0.00 Ramadan Airport 6 (100) 2.0 0.00 Tour Sinai Airport 6 (100) 2.0 0.00 Hurghada International Airport 3 (50.0) 3 (50.0) 1.5 0.58 Shark Elowainat Airport 6 (100) 2.0 0.00 Taba International Airport 6 (100) 2.0 0.00 Marsa Alam International Airport 1 (16.7) 5 (83.3) 1.8 0.41 Borg El Arab Airport 4 (66.7) 2 (33.3) 1.3 0.52 Cairo International Airport 5 (83.3) 1 (16.7) 1.2 0.41 Luxor International Airport 3 (50.0) 3 (50.0) 1.5 0.55 Sidi Barani Airport 6 (100) 2.0 0.00 Abu Rudeis 6 (100) 2.0 0.00 Kharga Airport 6 (100) 2.0 0.00 Al Alamain International Airport 6 (100) 2.0 0.00 Dakhla Airport 6 (100) 2.0 0.00 Sharm El Sheikh International Airport
4 (66.7) 2 (33.3) 1.3 0.52
Port Said Airport 6 (100) 2.0 0.00 Siwa Airport 6 (100) 2.0 0.00 Al Arish International 6 (100) 2.0 0.00 El Minya Airport 6 (100) 2.0 0.00 Asuit Airport 1 (16.7) 5 (83.3) 1.8 0.41 Sohag Airport 1 (16.7) 5 (83.3) 1.8 0.41
Source: SPSS Version 20
• All respondents are aware of the concept of LCCs except the respondent of
Air Italy. • All respondents are agreeing on the average 120 % of the air flights
achieved by low cost carriers in Egypt. This outcome is fit with what stated
about the LCCs traffic share in the Middle East meantime the five years average 20102014 as stated by Amadeus (2014). However, the total traffic share of LCCs in Egypt is still lower than the percentages of pioneer destinations in LCC business like Europe since 50 % total flights by LCCs according to Dron (2017, P:1). At the level of the individual company share, there is also a decrease in this ratio when comparing between international lowcost airlines and their Egyptian counterparts. Obvious example said by Costa (2014, PP: 141142) that Easyjet and Ryanair airlines had the major

Attaalla. F Ragab. M ـــــــــــــــــــــــــــــــــــــــــــــــــــــــــــــــــــــــــــــــــــــــــــــــــــــــــــــــــــــــــــــــــــــــــــــــــــــــــــــــــــــــــــ
45
lot of the low cost market in Portugal. In 2012, they together accounted for about 78% of the whole traffic on LCC (7.6 million passengers). While a progenitor Egyptian example is Air Cairo Airline with nearly 5 % of total flight through Egypt. Moreover mean of flights and traffic share varies at the some Egyptian airports from which its flights start as it is obvious in the table 6 below.
Table (6): Air Cairo International Traffic Share from Egypt Airports 2016
Airport Air Cairo Traffi Percentage
Sohag Airport (HMB) 39.7 Asuit Airport (ATZ) 43.5 Borg El Arab Airport (HBE) 12.4 Marsa Alam Airport (RMF) 6.1 Hurghada Airport (HRG) 6.9 Sharm El Sheikh Airport (SSH) 2.5 Cairo Airport (CAI) 0.8
Source: (ECAA, 2017)
• Although LCCs depend mainly on the use of secondary airports, they have moved into primary airports in direct competition with FSCs.
• Simplicity of product design and simplicity of organization come in the first priority as a lowcost approach of a lowcost carrier to be based on. While simplicity of product design and low prices come in the second priority. This result is matching with the opinion says that LCCs airlines have selected a lowcost tactic have achieved these low aliments out of rusticity of product design, rusticity of processes and rusticity of organization. Other airlines seek lower costs through lower prices (Gillen and Lall, 2004, P: 50).
• Asia is the first destination lowcost airlines operate flights to and from Egypt. Europe, Africa, North America are in the rest ranks respectively. Australia and South America are not considered as destinations for LCCs flights.
• Preponderance of respondents see that design of the low cost terminals minimizes the average passenger walking distance from the waiting point to aircraft gates, and the average aircraft taxiing from the runways to the apron area and vice versa.
• Merits that the low cost terminals provide to low cost carriers were fixed price per passenger for ground handling services, financial support for the LCCs' advertisement & promotion of flights, and reduction in landing charges in order.

Low-Cost Carriers and Low-Cost Terminals: Myth or Reality in Egypt ـــــــــــــــــــــــــــــــــــــــــــــــــــــــــــــــــــــــــــــــــــــــــــــــــــــــــــــــــــــــــــــــــــــــــــــــــــــــــــــ
46
• Cairo International Airport is in the first center for the Egyptian airports that provide services for lowcost airlines. Sharm El Sheikh, Luxor, Hurghada, Aswan, Borg El Arab, Sohag and Asuit come in the rest situations. Other Egyptian airports are not selected by LCCs. However, according to Air Cairo officials, there is neither an airport in Egypt that has been established to be a lowcost airport nor a building in a large airport has been allocated for this purpose.
• Conclusion The current study gives through investigation about the Egyptian case in light of the panoramic view about the international business of LCCs and LCTs. The research provides a comprehensive explanation about LCCs and LCTs including the outstanding characteristics and the best international LCCs and LCTs in 2017. It is obvious through the current study that best international market for the business of LCCs and LCTs are the United States of America, Europe and Asia in changeable way with little superiority of the United States of America in revenues of LCCs. Pertaining to the Egyptian Experience, there is no complete agreement and disagreement on some of the criteria of lowcost carriers and lowcost airports in Egypt compared to international experiences. The study shows that the number of LCCs airlines operating in the Egyptian market is small compared to the world markets. Moreover, the large airports are the main destination for these companies without secondary airports and this is contrary to the global trend. As to our limit of knowledge there is no calculation for the LCCs revenues in Egypt and the Middle East region as a whole while this is achieved in many places like Singapore and Portugal. Future studies should pay more attention to the average revenue created by every LCC passenger compared to major carrier passenger commercial revenue. Also more studies about the impacts of LCCs on the tourism sector should be done. Finally, there is necessity for developing standard LCTs in Egypt as regional and secondary airports such as the new Terminal 3 at Narita Airport in Japan and was consecrated foremost to Japanese lowcost airlines or as separated buildings inside major airports by a refurbishment one converted from previous use as a cargo, charter terminal, or maintenance facility which is a popular option in Europe for its advantage of minimizing investment costs.
Recommendations Over the last years, airports have changed significantly the way they operate, based on a series of factors, such as the rapid advancement of technology, the security issues, air travel affordability making travel accessible to more people, the emergence of lowcost companies and the changes of the typology of the modern traveller. The results of the study

Attaalla. F Ragab. M ـــــــــــــــــــــــــــــــــــــــــــــــــــــــــــــــــــــــــــــــــــــــــــــــــــــــــــــــــــــــــــــــــــــــــــــــــــــــــــــــــــــــــــ
47
have a number of practical implications for Egyptian civil aviation authorities. According to the current results, recommendations can be given to the ministry of civil aviation in Egypt. These recommendations are derived from the findings of the study as well as previous literatures to improve the performance of LCTs and LCCs in Egyptian aviation market by improving their appeal to passengers:
1. The need to establish terminals in Egyptian airports to be lowcost terminal (LCTs) to serve lowcost carriers (LCCs), because one of the core characteristics of LowCost Carrier (LCCs) is their use of secondary and regional airports.
2. The need to set up specific criteria for the concept of low cost carriers (LCCs) and low cost terminal (LCTs) in Egypt compared to international experiences.
3. The need to provide all the necessary supports to encourage lowcost carriers to work in Egyptian aviation market. LCCs continuously look for financial and demandrelated opportunities and expect airports to facilitate quick and efficient operations.
4. The need to improve the service provided at airports, whereas service quality within airport terminals is a crucial factor in the travel experience and cost, demand and efficiency are the most important criteria for lowcost carriers when choosing airports to operate from.
References • Abdelhady, M., Fayed, H., & Fawzy, N. (2019). The influence of airlines’
marketing mix on passengers' purchasing decisionmaking: The Case of FSCs and LCCs. International Journal of Hospitality & Tourism Systems, 12(2).
• Abdelhady, M., Fayed, H., & Fawzy, N. (2018). The Influence of the 4Ps on Passengers' Purchasing DecisionMaking: the Case of LCCs. International Journal of Heritage, Tourism, and Hospitality, 12(1/2).
• Airline Business (2012). LowCost League. Airline Business. May, PP: 3435.
• Airline profiler (2015). International LowCost Airline Market Research. Retrieved February 2017 from http://www.ailineprofier.eu.
• Amadeus (2014). Shaping the Future of Travel Macro Trends Driving Industry Growth over the Next Decade. Retrieved March 2017 from http://www.amadeus.com.
• Barrett Sean D. (2004). How do the Demands for Airport Services Differ between FullService Carriers and LowCost Carriers?. Journal of Air Transport Management 10 (2004) PP: 3339.
• CAPA World Aviation and OAG report (2014). Yearbook 2014. CAPA Center for Aviation.
• Chandrakanth R. (2015). Is it Time for Secondary Airports?. SP's Aviation. Issue 2. India.

Low-Cost Carriers and Low-Cost Terminals: Myth or Reality in Egypt ـــــــــــــــــــــــــــــــــــــــــــــــــــــــــــــــــــــــــــــــــــــــــــــــــــــــــــــــــــــــــــــــــــــــــــــــــــــــــــــ
48
• Dron Alan (2017). Legacy Versus LowCost Carriers: The Game is on. Aviation Week Network. August.
• Egyptian Civil Aviation Authority ECAA (2017). Air Cairo Business Plan. Prepared InHouse October, PP: 2430
• EURlex. (2015). An Aviation Strategy for Europe. Retrieved march 4, 2017, from EURlex Access to European Union law : http://eurlex.europa.eu.
• Flynas. (2018). Flynas Wins Skytrax Award for Best LowCost Airline. Reprieved January28, 2018, from https://www.flynas.com.
• Francis Graham, Fidato Alessandro, Humphreys Ian (2003). Airport–airline interaction: the impact of lowcost carriers on two European airports. Journal of Air Transport Management 9 (2003) 267–273.
• Gillen David and Lall Ashish (2004). Competitive Advantage of LowCost Carriers: Some Implications for Airports. Journal of Air Transport Management. 10 (2004) PP: 4150.
• Gittell, J. H., & Kochan, h. A. (2006). LowCost Competition in the Global Airline Industry. Perspectives on Work, 9(2), 5556.
• Givoni Moshe, Dobruszkes Frédéric, and Vowles Timothy (2017). Hello major airports, goodbye regional airports? Recent changes in European and US lowcost airline airport choice. Journal of Air Transport Management. 59 (2017) PP: 5062.
• Graham Anne (2013). Understanding the Low Cost Carrier and Airport Relationship: A Critical Analysis of the Salient Issues. Tourism Management. 36 (2013) PP: 6676.
• Hanaoka Shinya and Saraswati Batari (2011). Low Cost Airport Terminal Locations and Configurations. Journal of Air Transport Management. 17 (2011). PP: 314319
• Hopper.com. (2017). 10 Cheapest Airports to Fly to in Europe. Retrieved February 11, 2018, from huffingtonpost:https://www.huffingtonpost.com.
• Hsu, C.J., Yen, J.R., Chang, Y.C., & Woon, H. K. (2016). How do the services of low cost carriers affect passengers' behavioral intentions to revisit a destination? Journal of Air Transport Management, 52, 111116.
• JapanExperience.(2018).NARITA AIRPORT TERMINAL3.Retrieved February28, 2018, from https://www.japanexperience.com.
• JIA, E. A. (2012). A Study of Customer Satisfaction Towards Service Quality in Airasia malysia.Master Thesis,universiti tunku abdul rahman.
• Lei Zheng and Papatheodorou Andreas (2010). Measuring the Effect of Locost Carriers on Regional Airports' commercial Revenue. Research in Transportation Economics 26 (2010) PP: 3743.
• Lin, S. (2011). The phenomenon of airline deregulation: The influence of airline deregulation on the number of passengers. Master Thesis, Erasmus University.

Attaalla. F Ragab. M ـــــــــــــــــــــــــــــــــــــــــــــــــــــــــــــــــــــــــــــــــــــــــــــــــــــــــــــــــــــــــــــــــــــــــــــــــــــــــــــــــــــــــــ
49
• Lott Steven (2005). Singapore’s LowCost Terminal Set to Open March 26. Aviation Week Network. December.
• Murray Brian and Fodness Dale (2007). Passengers' Expectations of Airport Service Quality. Journal of Services Marketing. Vol.21 issue 7. PP: 492506.
• Njoya Eric Tchouamou and Niemeier HansMartin (2011). Do Dedicated LowCost Passenger Terminals Create Competitive Advantages for Airports?. Research in Transportation Business & Management 1 (2011) PP: 5561.
• Richard de Neufville (2008). LowCost Airports for LowCost Airlines: Flexible Design to Manage the Risks. Transportation Planning and Technology, Vol. 31, No. 1, PP:3568.
• RoyoVela Marcelo and MartinezGarcia Ester (2010). Segmentation of LowCost Flights Users at Secondary Airports. Journal of Air Transport Management. 16 (2010) PP: 234237.
• Ryanair. (2016). RyanairAnnualReportFY16. Retrieved February 28, 2018, from Ryanair:https://investor.ryanair.com.
• Sky Trax. (2018). World’s Best LowCost Airlines 2018. Retrieved January 20, 2018, from https://www.worldairlineawards.com.
• Smith D. Warnock and Dziedzic M. (2016). The Role of Secondary Airports for Today’s LowCost Carrier Business Models: The European Case. Research in Transportation Business & Management. July, PP:114.
• Smyth, M., & Pearce, B. (2006). Airline Cost Performance. IATA. • Statisa. (2018). Net profit of commercial airlines worldwide from 2005 to
2018 (in billion U.S. dollars). Retrieved february 5, 2018, from https://www.statista.com/statistics.
• Statista. (2018). Busiest U.S. airports in 2016, based on the number of passengers enplaned. Retrieved february 2, 2018, from https://www.statista.com/statistics.
• Statista. (2018). Domestic market share of leading U.S. airlines in 2016. Retrieved February 8, 2018, from https://www.statista.com/statistics.
• Statista. (2018). Southwest Airlines Co.'s revenue passenger miles (RPMs) from FY 2010 to FY 2016 (in billions). Retrieved february 10, 2018, from https://www.statista.com.
• Wang, J., Bonilla, D., & Banister, D. (2016). Air deregulation in China and its impact on airline competition 1994–2012. Journal of Transport Geography, 50, 12–23.
• Wikipedia.(2018).List of airports in Egypt, from https://www.wikipedia.com, accessed in January 2018.
• William Jeremy (2012). Why Defining Secondary Airports Is So Difficult. Carryon independent blog, Australia.


