LOW COST AUTOMATED BLOOD CULTURE SYSTEM by … · · 2017-07-0310.1.5 VersaTREK® ..... 62 10.2...
90
LOW COST AUTOMATED BLOOD CULTURE SYSTEM by Tal Gottesman A thesis submitted to Johns Hopkins University in conformity with the requirements for the degree of Master of Science in Electrical and Computer Engineering Baltimore, Maryland May, 2014
Transcript of LOW COST AUTOMATED BLOOD CULTURE SYSTEM by … · · 2017-07-0310.1.5 VersaTREK® ..... 62 10.2...

LOW COST AUTOMATED BLOOD CULTURE SYSTEM
by
Tal Gottesman
A thesis submitted to Johns Hopkins University in conformity with the requirements for the degree of Master of Science in Electrical and Computer Engineering
Baltimore, Maryland
May, 2014

ii
Intended to be blank

iii
ABSTRACT
Sepsis is a systemic medical condition causing serious risk to health and life.
This condition is most often diagnosed by culturing a specimen of patient blood
or body fluid for bacteria. The health of patient populations in emerging
economies would be aided by better diagnosis and treatment of sepsis.
Unfortunately factors such as cost, ease of use, unreliable power and
environmental control in laboratory facilities make automated blood culture
untenable in these locations thereby limiting diagnostic options for clinicians. A
comprehensive system design is proposed which addresses an unfulfilled need
for an inexpensive method and apparatus which would facilitate automated blood
culture. The design describes a disposable culture tube comprising a chemical
sensor and bacterial growth medium. It also describes an automated instrument
which will incubate, agitate, and optically interrogate culture tubes for evidence of
bacterial growth. Culture tubes which demonstrate evidence of bacterial growth
are reported as positive, facilitating the diagnosis of sepsis.
Directed By: Jeff Houser
Johns Hopkins University
Engineering for Professionals

iv

v
Table of Contents
1 Background: ............................................................................................................................. 1
2 System: ..................................................................................................................................... 2
2.1 Overview: ..................................................................................................................... 2
2.2 Growth Indicator: .......................................................................................................... 3
2.2.1 Theory of Operation ................................................................................................. 3
2.2.2 Design ..................................................................................................................... 4
2.2.3 Optimization ........................................................................................................... 6
2.3 Optical Detection System: ............................................................................................ 8
2.4 Signal Generation and Processing System ................................................................. 12
2.4.1 LED Control .......................................................................................................... 12
2.4.2 Amplifier and Filter Circuit .................................................................................. 14
2.4.3 Microcontroller ..................................................................................................... 16
2.5 Incubation System Design .......................................................................................... 24
2.5.1 Heater Design ...................................................................................................... 25
2.5.2 Airflow.................................................................................................................... 27
2.5.3 PID Controller ...................................................................................................... 28
2.6 Agitation System ........................................................................................................ 29
2.6.1 Head-space to Broth Ratio................................................................................. 29
2.7 Agitation System Design ............................................................................................ 30
2.8 Motor Control ............................................................................................................. 31
3 Detection Algorithm ............................................................................................................. 32
3.1 Processing Window .................................................................................................... 32
3.2 Features of Interest for Discrimination ........................................................................ 33
3.2.1 Algorithm Design: ................................................................................................ 35
4 TSB Broth Preparation ....................................................................................................... 37
4.1 Sterilization of Media .................................................................................................. 37
4.2 Sterility Testing ........................................................................................................... 38
5 Performance Evaluation Protocols ................................................................................... 40

vi
5.1 Seeded Blood Culture Evaluation Protocol ................................................................. 40
5.2 Simplified Bacterial Detection Protocol ....................................................................... 41
6 Results .................................................................................................................................. 43
6.1.1 Detection Analysis .................................................................................................. 45
6.2 Analysis of Time to Detection VS Concentration ........................................................ 49
7 Conclusion .............................................................................................................................. 50
7.1 Performance ............................................................................................................... 50
7.2 Cost ............................................................................................................................ 51
7.2.1 Machine Cost ......................................................................................................... 51
7.2.2 Disposable Cost ...................................................................................................... 53
8 Further Development .......................................................................................................... 55
9 References: ............................................................................................................................ 56
10 Appendices ......................................................................................................................... 57
10.1 Appendix A: Predicate Systems ................................................................................ 57
10.1.1 Manual Systems: .................................................................................................... 57
10.1.2 Automated Methods .............................................................................................. 58
10.1.3 BACTEC® F Series ............................................................................................ 59
10.1.4 BacT/ALERT® .......................................................................................................... 61
10.1.5 VersaTREK® ............................................................................................................ 62
10.2 Appendix B: Wiring Diagrams .................................................................................... 64
10.3 Appendix C: Schematics ............................................................................................ 66
10.4 Appendix D: SEEDED BLOOD CULTURE EVALUATION ......................................... 71
10.4.1 PRINCIPLE .......................................................................................................... 71
10.4.2 SPECIMEN ............................................................................................................... 71
10.4.3 MATERIALS ............................................................................................................. 71
10.4.4 PROCEDURE ........................................................................................................... 72
10.4.5 RECOMMENDATIONS: ........................................................................................... 75
10.4.6 LIMITATIONS .......................................................................................................... 75
10.4.7 REFERENCES ........................................................................................................... 76
10.5 Appendix E: Simplified Bacterial Detection Protocol to Evaluate Efficacy of a
Low Cost Blood Culture Machine .......................................................................................... 77

vii
10.5.1 Purpose .................................................................................................................. 77
10.5.2 Overview ................................................................................................................ 78
10.5.3 Materials ................................................................................................................ 78
10.5.4 Procedure ............................................................................................................... 79
10.5.5 Expected Results .................................................................................................... 81
10.6 Appendix F: Costed Bill of Materials .......................................................................... 82
10.6.1 Electrical BOM ........................................................................................................ 82
10.6.2 Mechanical BOM .................................................................................................... 83
10.7 Biographical Statement .............................................................................................. 83

1
1 Background:
Sepsis, (blood poisoning) is a serious medical condition caused by an immune
response to infection. It is also referred to as Systemic Inflammatory Response
Syndrome (SIRS) and in severe cases it leads to septic shock (sepsis –induced
hypotension), organ failure and eventually death. Sepsis occurs in 1%-2% of all
hospitalizations in the U.S. and some studies report that it affects 750,000
Americans per year (1, 4). It is estimated that between 28 and 50 percent of
those infections result in death (2). Sepsis results in more deaths in the United
States than prostate cancer, breast cancer and AIDS combined (3). The
economic cost of sepsis has been estimated at $17 billion per year. Bacterial
infections (bacteremia) are the most common cause of sepsis (4) and are
diagnosed by culturing the blood or other bodily fluid for bacteria.
Bacterial culture involves the collection, inoculation, incubation, growth, and
detection of viable organisms inside a sealed vessel. It has several market
applications including blood culture, urine culture, product sterility and food safety
testing. Manual bacterial culturing methods have been used in the medical field
since the early 20th century to diagnose patients presenting with a fever of
unknown origin. In the 20th century, semi-automated and then automated
methods and equipment have been developed. These commercially available
culture systems provide good performance, but are prohibitively expensive for

2
use in developing nations or by smaller clinics like those commonly found in rural
areas.
Commercially available systems tend to incorporate intricate agitation systems
and complex measurement systems which include optical filters and highly
sensitive sensors. In some cases these systems also require the use a
disposable culture vial which necessitates a multi-step manufacturing process
and a complex sensor design which increases the cost of operation. Some
examples of commercially available systems are listed in Appendix A along with a
brief description of how they work and an assessment of various tradeoffs.
For the purposes of this project I designed and developed an inexpensive
automated culture system which could rival or surpass the performance of
predicate systems at only a fraction of the cost. The design criteria are low cost,
detection accuracy and time to detection of bacterial cultures.
The specific designs of the automated instrumentation and disposable culture
vial which can achieve these cost and performance targets are detailed within
this document.
2 System:
2.1 Overview:
This low cost automated culture system comprises five functional parts; a
specimen vial containing a growth indicator and growth medium, an incubation

3
system, an agitation system to enhance growth, an optical detection and signal
processing system, and a computerized system of logging data and interpreting
results.
2.2 Growth Indicator:
2.2.1 Theory of Operation
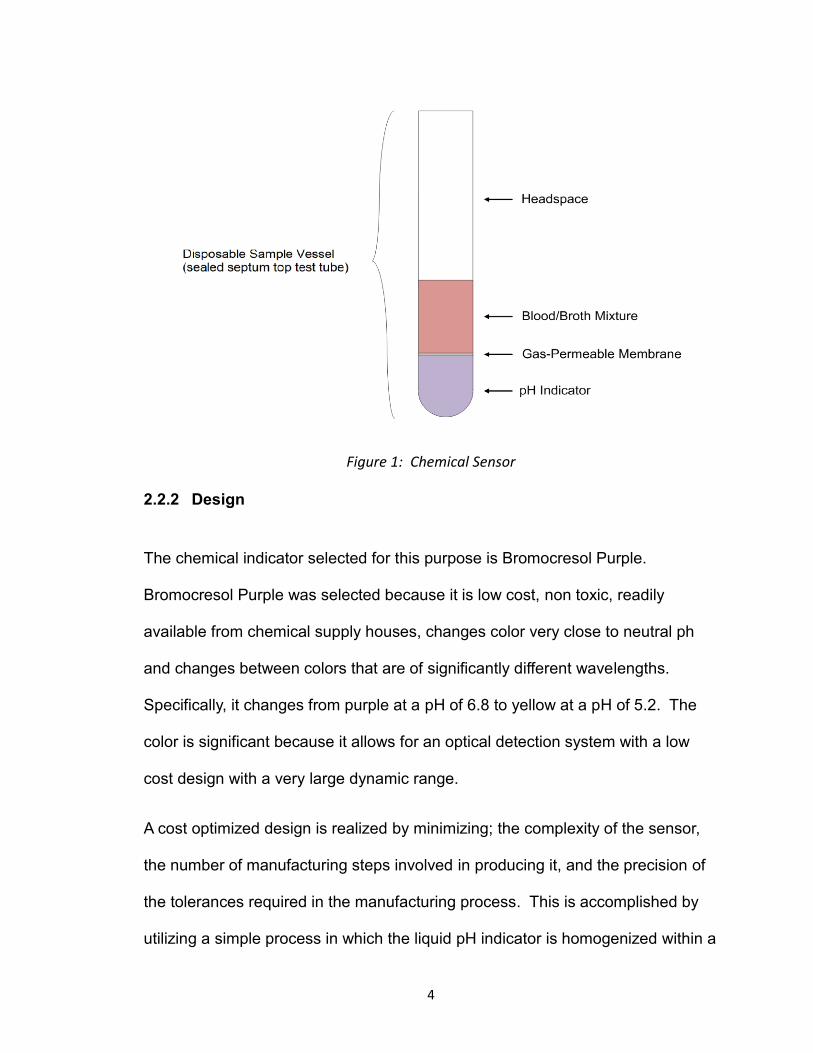
The growth indicator is a chemical sensor which consists of a liquid pH indicator
that is separated from the growth medium by a gas permeable membrane.
Figure 1 shows one possible embodiment of such a sensor. As bacteria grow,
they produce carbon dioxide through respiration which migrates across the
membrane and causes a change the pH of the liquid indicator. This in turn
results in a color change of the indicator, which is interrogated optically and
recorded. Blood also creates carbon dioxide by respiration, but is produced only
in bone marrow and cannot reproduce on its own. Because the bacteria are
reproducing and the blood cells are dying, the rate of change of the pH indicator
will differ between a sample containing blood and a sample containing blood
contaminated with bacteria.
4
Figure 1: Chemical Sensor
2.2.2 Design
The chemical indicator selected for this purpose is Bromocresol Purple.
Bromocresol Purple was selected because it is low cost, non toxic, readily
available from chemical supply houses, changes color very close to neutral ph
and changes between colors that are of significantly different wavelengths.
Specifically, it changes from purple at a pH of 6.8 to yellow at a pH of 5.2. The
color is significant because it allows for an optical detection system with a low
cost design with a very large dynamic range.
A cost optimized design is realized by minimizing; the complexity of the sensor,
the number of manufacturing steps involved in producing it, and the precision of
the tolerances required in the manufacturing process. This is accomplished by
utilizing a simple process in which the liquid pH indicator is homogenized within a
5
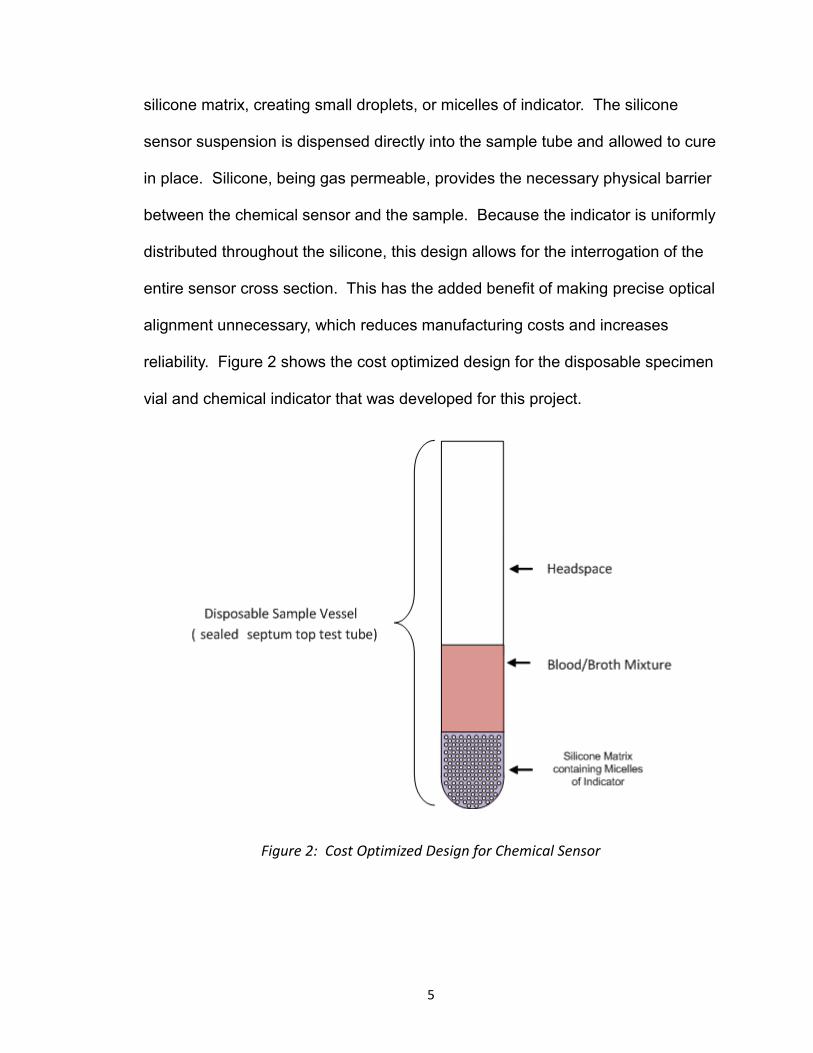
silicone matrix, creating small droplets, or micelles of indicator. The silicone
sensor suspension is dispensed directly into the sample tube and allowed to cure
in place. Silicone, being gas permeable, provides the necessary physical barrier
between the chemical sensor and the sample. Because the indicator is uniformly
distributed throughout the silicone, this design allows for the interrogation of the
entire sensor cross section. This has the added benefit of making precise optical
alignment unnecessary, which reduces manufacturing costs and increases
reliability. Figure 2 shows the cost optimized design for the disposable specimen
vial and chemical indicator that was developed for this project.
Figure 2: Cost Optimized Design for Chemical Sensor

6
2.2.3 Optimization
The silicone selected for the chemical sensor is Platsil 73-15. Platsil 73-15 is a 2
part platinum cure silicone commonly used in the mold making industry for
theater props. Prior to curing, the liquid silicone is slightly acidic which would
cause the indicator to become prematurely exposed during the curing process.
This issue is overcome by pre-biasing the pH indicator solution with a base
(sodium bicarbonate) to a higher pH so that the resulting mixture is pH neutral.
The final pH of the sensor will therefore depend on the titrated pH of the indicator
solution and on the ratio of indicator solution to silicone. The indicator solution to
silicon ratio dictates the concentration of micelles and therefore affects the color
density and gas permeability of the cured sensor. For these reasons it was
necessary to empirically determine the optimal ratio and titration levels. Table 1
and Figure 3 show the data of the relative intensity of light transmitted through
sensors created with various titration levels and sensor concentrations. The
sensors were sampled using the ADC (analog to digital converter) within the
microcontroller used in this design and the units are counts. The titration level
and sensor concentration used in the formulation of batch number 2 provided the
highest dynamic range and was therefore selected for use in this design.
Batch Number 1 2 3 4
Indicator Solution (mL) 1 2 3 4
Titration Solution (drops) 2 3 4 5
Unexposed ADC Reading 761 212 463 146
Exposed ADC Reading 1023 790 819 200

7
Table 1: Empirically tested Concentration Ratios
Figure 3: Dynamic Range of Sensors with Various Concentrations of Indicator
For the development of a working model of the sensor, Bromcresol Purple was
dissolved in water until the water was saturated. The solution was decanted into
part A of a two-part platinum-cure silicone. The mixture was vigorously whipped
using a vortex mixer until the solution was broken down into small droplets
(micelles) suspended in the silicone. Part B of the platinum silicone was added,
and then thoroughly mixed. The entire mixture was then dispensed into test
tubes and allowed to cure. Once cured, a column of sterile water was added over
the top of the silicone sensor in both tubes.One sensor tube was maintained as a
0
200
400
600
800
1000
1200
1 2 3 4
Exposed vs. Unexposed Samples
Unexposed Samples
Exposed SAmples
8
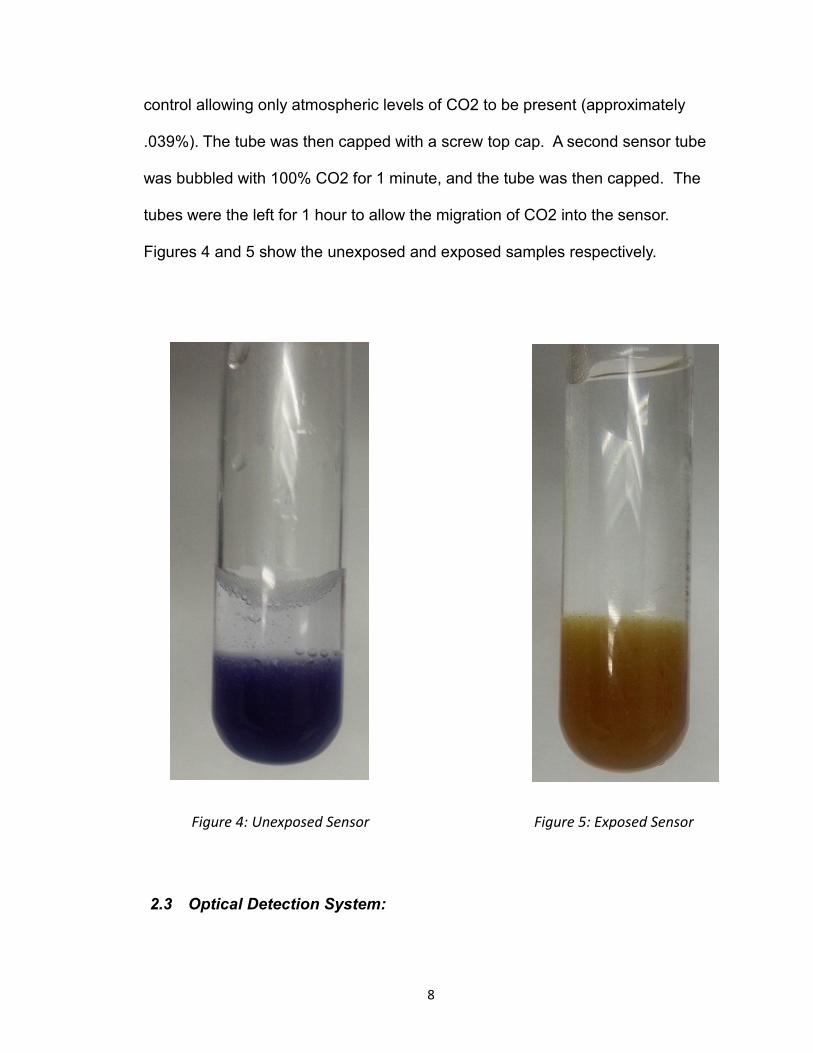
control allowing only atmospheric levels of CO2 to be present (approximately
.039%). The tube was then capped with a screw top cap. A second sensor tube
was bubbled with 100% CO2 for 1 minute, and the tube was then capped. The
tubes were the left for 1 hour to allow the migration of CO2 into the sensor.
Figures 4 and 5 show the unexposed and exposed samples respectively.
Figure 4: Unexposed Sensor Figure 5: Exposed Sensor
2.3 Optical Detection System:
9
The optical detection system consists of a narrow spectrum light source and a
detector. For the light source, a 5mm amber LED was selected (part number
C503B-AAS-CY0B0251 manufactured by Cree Inc.). This LED was designed
and mass produced for outdoor sign and signal applications and therefore offers
high temperature and high moisture resistance performance at a very low cost. It
emits light at a peak wavelength of 591nm with a typical luminous intensity of
13000mcd at 20mA. The proposed chemical indicator is designed to provide
maximum optical absorption of the source wavelength in the purple (unexposed)
state, and maximum optical transmission in the yellow (exposed) state. As such,
the choice of this amber LED in conjunction with the proposed chemical sensor
provides a positive-going signal with increasing CO2 production. This optical
system achieves excellent dynamic range without the need for expensive optical
filters or sensor calibration which would add cost to the system.
An avalanche photodiode would be an ideal sensor to measure the amplitude of
the transmitted light, but would cost anywhere from several hundred to several
thousand dollars in single quantities, depending on the specific part. The lowest
cost avalanche photodiode listed by the electronics distributor Digikey, for
example, is the SD197-70-74-591 made by Advanced Photonix and has a
manufacturer suggested retail price (MSRP) of $942.50 in single quantities as of
November 04, 2013. This system is designed to test 12 samples at a time and
therefore would require 12 avalanche photodiodes which would increase the cost
significantly. Because of the prevalence of fiber optic communication networks,
PIN photodiodes on the other hand, have become ubiquitous and extremely cost
10
effective. The PIN photodiode selected for this sensor is the PD333-SC/H0/L2
and costs $0.50 in single quantities at retail. This photodiode has a spectral
bandwidth between 400nm and 1100nm with peak sensitivity at 940nm.
Ideally, the wavelength of peak sensitivity for the photodiode would match the
LED dominant wavelength of 591nm, but he PD333-SC/H0/L2 has a sufficiently
broad spectral response to provide good sensitivity in the area of interest
(591nm). Because the system design can tolerate the slightly reduced sensitivity
of the detector at this wavelength, the low cost justifies the performance tradeoff.
Modulating the light source and band pass filtering the received signal would
provide good immunity from ambient light. This would however add complexity
and therefore cost to the system, so instead this system is designed to prevent
stray ambient light from entering the optical path and reducing the signal to noise
ratio. This is accomplished by operating the detection system inside of a light-
tight enclosure and protecting the sensor from ambient light with the geometry of
the detector design. The LED and the detector must be aligned co-axially, and
recessed into wells in the sample holding block. This will effectively collimate the
source light and block light from other sources (see Figure 6).

11
LED PDOptical Path
Antistatic Opaque Delrin
Block
Sample Tube
Figure 6: Optical Sensor Block Diagram
Design consideration was given to the inclusion of an optical diffuser in the
measurement path. Optical diffusers scatter light across the intended optical
path providing some degree of “averaging” of the path in total. This would
desensitize the system to minor variations in optical alignment of the
measurement system components, and would be necessary if the chemical
sensor was not uniform. It was determined that a more cost effective means of
providing optical diffusing without the need for an optical filter, would be to design
the chemical sensor such that it acts as a diffuser as well as a sensor. The
sensor design includes color-neutral optical scattering centers to eliminate the
need for a diffuser. This was achieved by careful selection of a diffuse rather
than clear 2 part silicone compound.
12
All of these design features acting in concert eliminate the need for any optical
filters in the measurement system, which reduce the part count and thereby
provide a significant cost benefit to the measurement system.
2.4 Signal Generation and Processing System
The signal processing path consists of an LED source and controller, an amplifier
and filter circuit and an Analog to Digital Converter (ADC). All three sections are
actively controlled by a single low cost microcontroller.
2.4.1 LED Control
Each of the 12 sampling stations is illuminated by a single amber LED. The
LEDs are driven with a programmable constant current source under firmware
control. This allows for the intensities to be varied with 128 steps of resolution in
order to compensate for variations between sampling stations in optical
alignment, LED forward voltage drop and amplifier stage gain. A single low cost
LED driver chip (Texas Instruments TLC5929) is used drive all 12 LEDs which
can be switched individually under microcontroller control to prevent light
contamination between adjacent stations. The block diagram in Figure 7 shows
an overview of the LED driver circuit.

13
LED Power
Supply
LED Driver
LED1 LED2 LED12
…….
.
.
.
.
.
.
Digital Circuit
Power Supply
DC-DC converter12V Input
Microcontroller Serial
Figure 7: LED Driver Circuit
The LED driver regulates the current by means of an internal switching power
supply driven at approximately 20 MHz. The power supply used to drive the
LEDs is separate from the supply used to drive the amplifier and ADC to reduce
the effect that the switching noise may have on the analog measurements. Both
supplies are based on low cost LDOs (low dropout regulators) and are heavily
filtered to minimize noise.
14
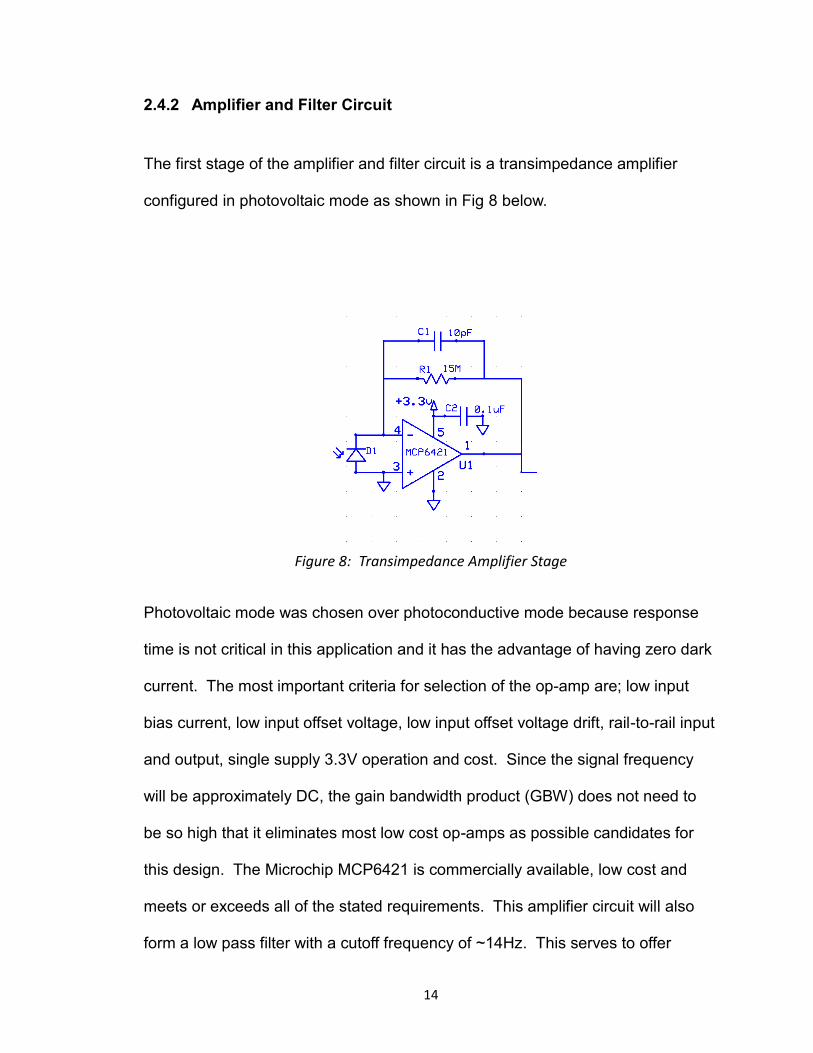
2.4.2 Amplifier and Filter Circuit
The first stage of the amplifier and filter circuit is a transimpedance amplifier
configured in photovoltaic mode as shown in Fig 8 below.
Figure 8: Transimpedance Amplifier Stage
Photovoltaic mode was chosen over photoconductive mode because response
time is not critical in this application and it has the advantage of having zero dark
current. The most important criteria for selection of the op-amp are; low input
bias current, low input offset voltage, low input offset voltage drift, rail-to-rail input
and output, single supply 3.3V operation and cost. Since the signal frequency
will be approximately DC, the gain bandwidth product (GBW) does not need to
be so high that it eliminates most low cost op-amps as possible candidates for
this design. The Microchip MCP6421 is commercially available, low cost and
meets or exceeds all of the stated requirements. This amplifier circuit will also
form a low pass filter with a cutoff frequency of ~14Hz. This serves to offer
15
protection from the 50Hz or 60Hz noise associated with the electric grid,
depending on the location.
The total gain required is a function of the mechanical alignment as well as the
specific makeup of the sensor material, and has been determined empirically. To
obtain the highest possible signal to noise ratio all the gain would ideally be
achieved in this stage, but this is not be possible due practical limitations.
Specifically, a gain limit is imposed by surface leakage currents on the printed
circuit board (PCB), which reduces the effective impedance in the feedback path
of the circuit. This has been minimized by the use of guard rings in the layout to
shunt stray currents to ground and with a conformal coating on the amplifier
stage to keep moisture out of the components and PCB. Minimal additional gain
is achieved in the second (filter) stage.
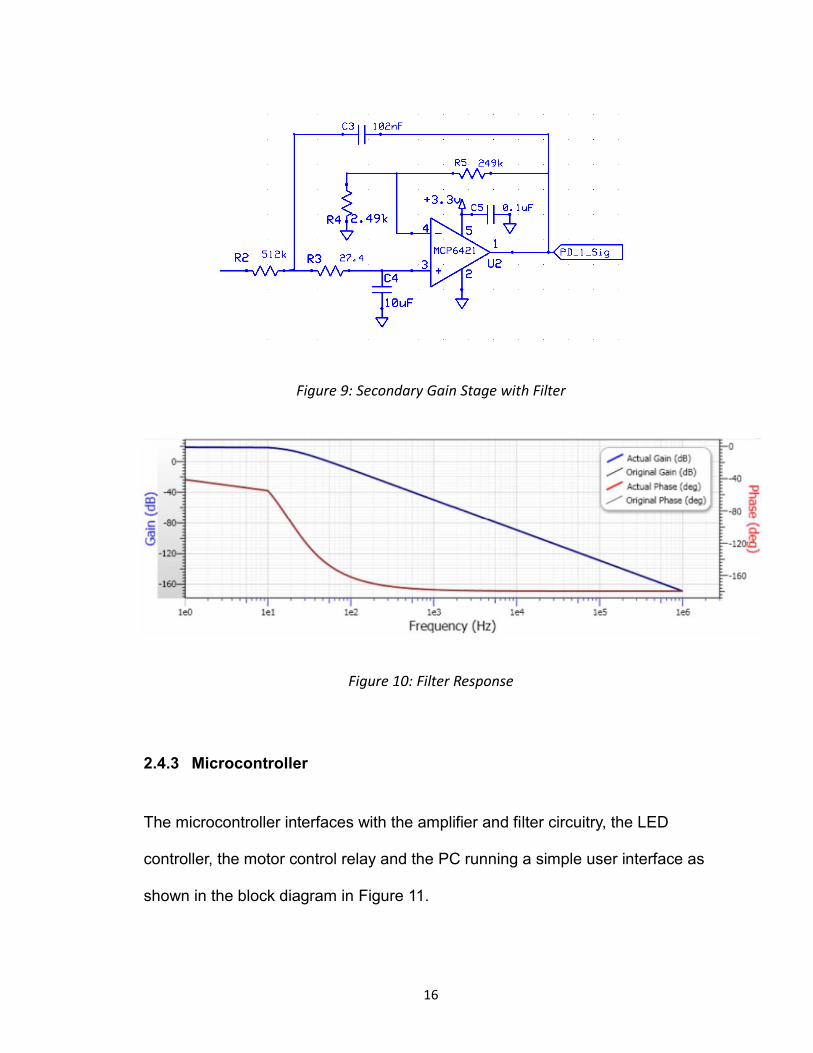
The second stage is a second order active low pass filter in a Sallen-Key
topology. This topology was selected because of its simplicity and low part
count. The second stage filter also has a cutoff frequency of ~14Hz to match the
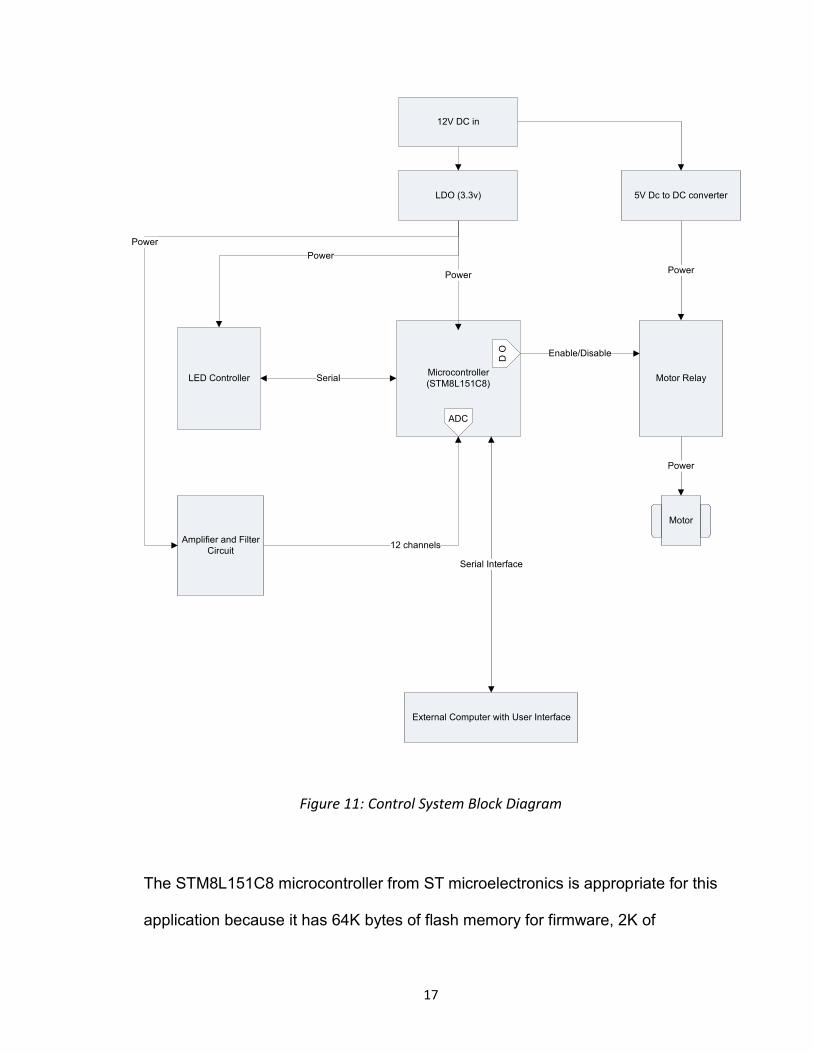
first amplifier stage and a gain of 10. Figures 9 and 10 show the schematic
diagram for the active filter and the simulated frequency response respectively.
16
Figure 9: Secondary Gain Stage with Filter
Figure 10: Filter Response
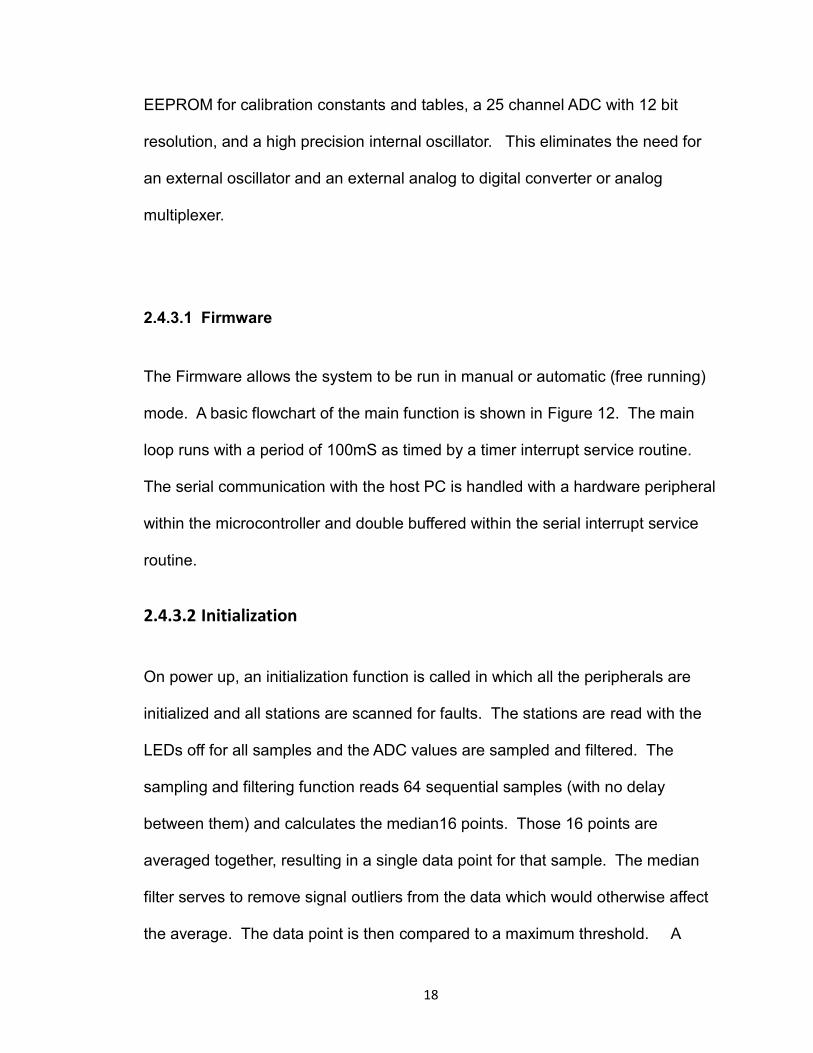
2.4.3 Microcontroller
The microcontroller interfaces with the amplifier and filter circuitry, the LED
controller, the motor control relay and the PC running a simple user interface as
shown in the block diagram in Figure 11.
17
Figure 11: Control System Block Diagram
The STM8L151C8 microcontroller from ST microelectronics is appropriate for this
application because it has 64K bytes of flash memory for firmware, 2K of
Microcontroller
(STM8L151C8)
LDO (3.3v)
LED Controller
Amplifier and Filter
Circuit
Motor Relay
Enable/Disable
12 channels
ADC
D O
Serial
PowerPower
Power
Power
5V Dc to DC converter
12V DC in
Motor
Power
External Computer with User Interface
Serial Interface
18
EEPROM for calibration constants and tables, a 25 channel ADC with 12 bit
resolution, and a high precision internal oscillator. This eliminates the need for
an external oscillator and an external analog to digital converter or analog
multiplexer.
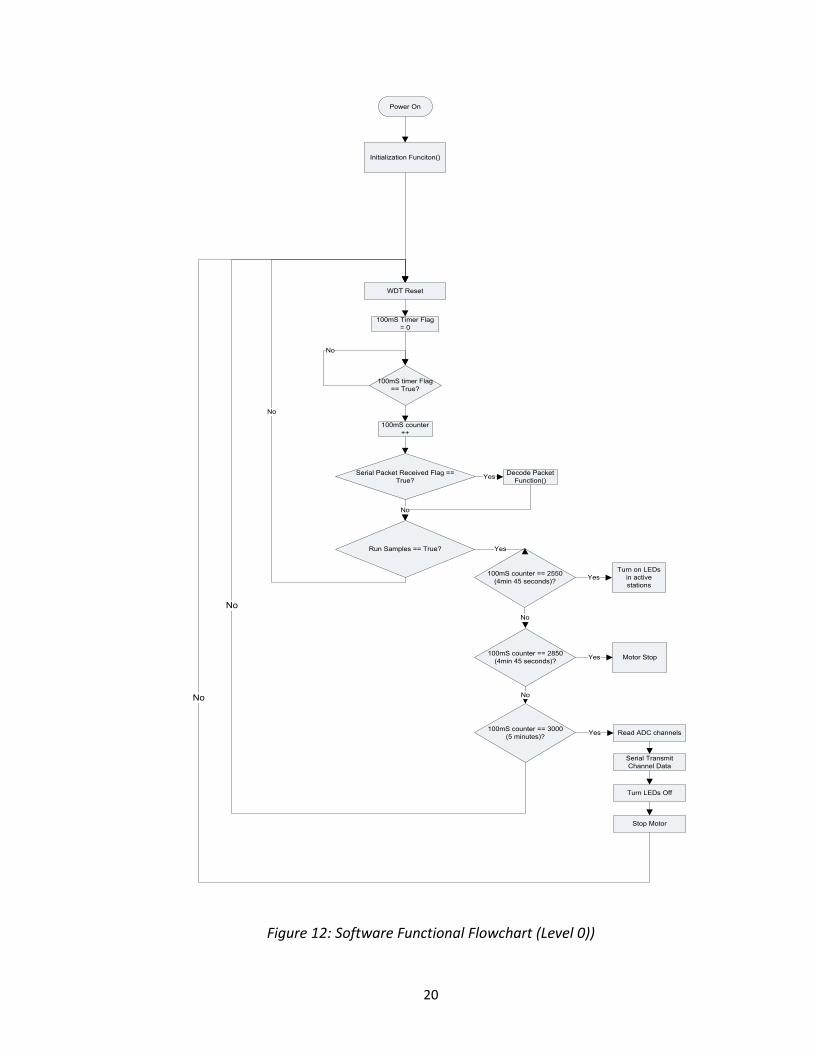
2.4.3.1 Firmware
The Firmware allows the system to be run in manual or automatic (free running)
mode. A basic flowchart of the main function is shown in Figure 12. The main
loop runs with a period of 100mS as timed by a timer interrupt service routine.
The serial communication with the host PC is handled with a hardware peripheral
within the microcontroller and double buffered within the serial interrupt service
routine.
2.4.3.2 Initialization
On power up, an initialization function is called in which all the peripherals are
initialized and all stations are scanned for faults. The stations are read with the
LEDs off for all samples and the ADC values are sampled and filtered. The
sampling and filtering function reads 64 sequential samples (with no delay
between them) and calculates the median16 points. Those 16 points are
averaged together, resulting in a single data point for that sample. The median
filter serves to remove signal outliers from the data which would otherwise affect
the average. The data point is then compared to a maximum threshold. A
19
value exceeding the threshold indicates a light leak, an open door or a faulty
analog signal path. The stations are also scanned with their respective LEDs on
and the ADC values are compared to a minimum threshold. A value that is too
low indicates either a blocked optical path or a fault in the analog signal path. A
value between two intermediate thresholds indicates that a sample is present in
the station. Error conditions are transmitted to the host PC via the serial
interface and the locations associated with errors or samples installed are
recorded in a global array.
20
Power On
Initialization Funciton()
Serial Packet Received Flag ==
True?
100mS timer Flag
== True?
100mS Timer Flag
= 0
100mS counter
++
Run Samples == True?
Decode Packet
Function()
100mS counter == 2550
(4min 45 seconds)?
No
Yes
No
Yes
Turn on LEDs
in active
stations
Yes
No
100mS counter == 2850
(4min 45 seconds)?Motor StopYes
100mS counter == 3000
(5 minutes)?Read ADC channelsYes
Serial Transmit
Channel Data
No
Turn LEDs Off
Stop Motor
No
No
No
WDT Reset
Figure 12: Software Functional Flowchart (Level 0))
21
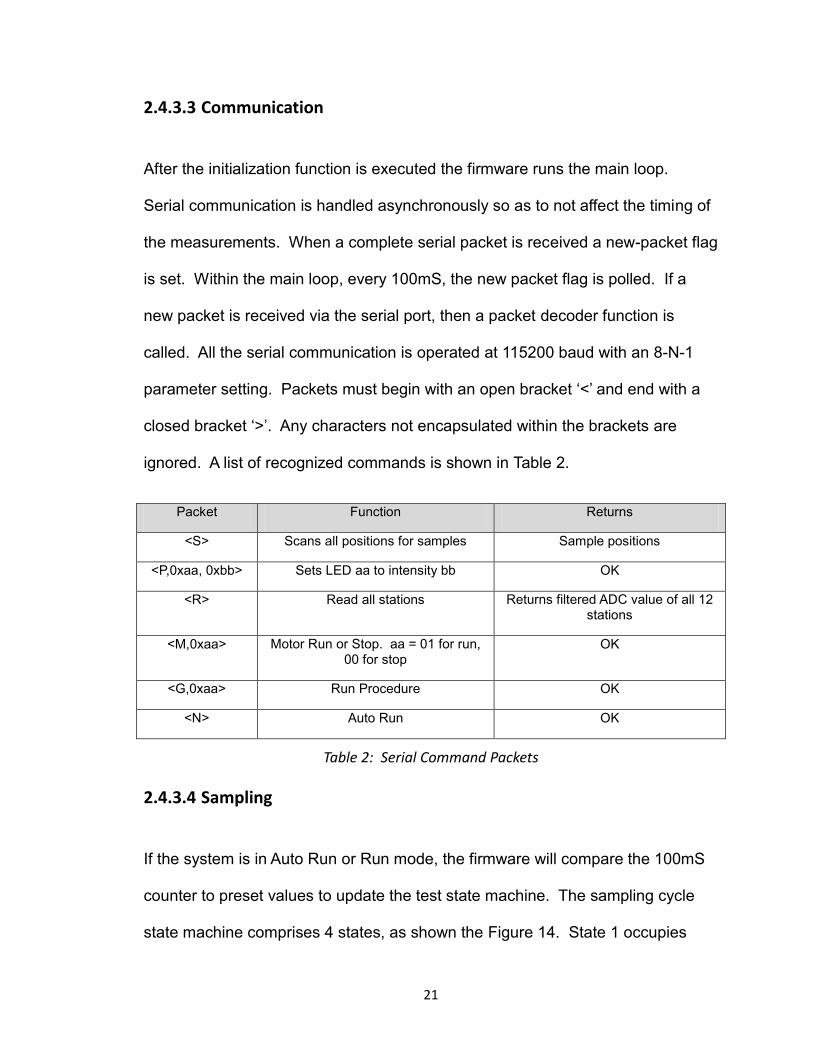
2.4.3.3 Communication
After the initialization function is executed the firmware runs the main loop.
Serial communication is handled asynchronously so as to not affect the timing of
the measurements. When a complete serial packet is received a new-packet flag
is set. Within the main loop, every 100mS, the new packet flag is polled. If a
new packet is received via the serial port, then a packet decoder function is
called. All the serial communication is operated at 115200 baud with an 8-N-1
parameter setting. Packets must begin with an open bracket „<‟ and end with a
closed bracket „>‟. Any characters not encapsulated within the brackets are
ignored. A list of recognized commands is shown in Table 2.
Packet Function Returns
<S> Scans all positions for samples Sample positions
<P,0xaa, 0xbb> Sets LED aa to intensity bb OK
<R> Read all stations Returns filtered ADC value of all 12 stations
<M,0xaa> Motor Run or Stop. aa = 01 for run, 00 for stop
OK
<G,0xaa> Run Procedure OK
<N> Auto Run OK
Table 2: Serial Command Packets
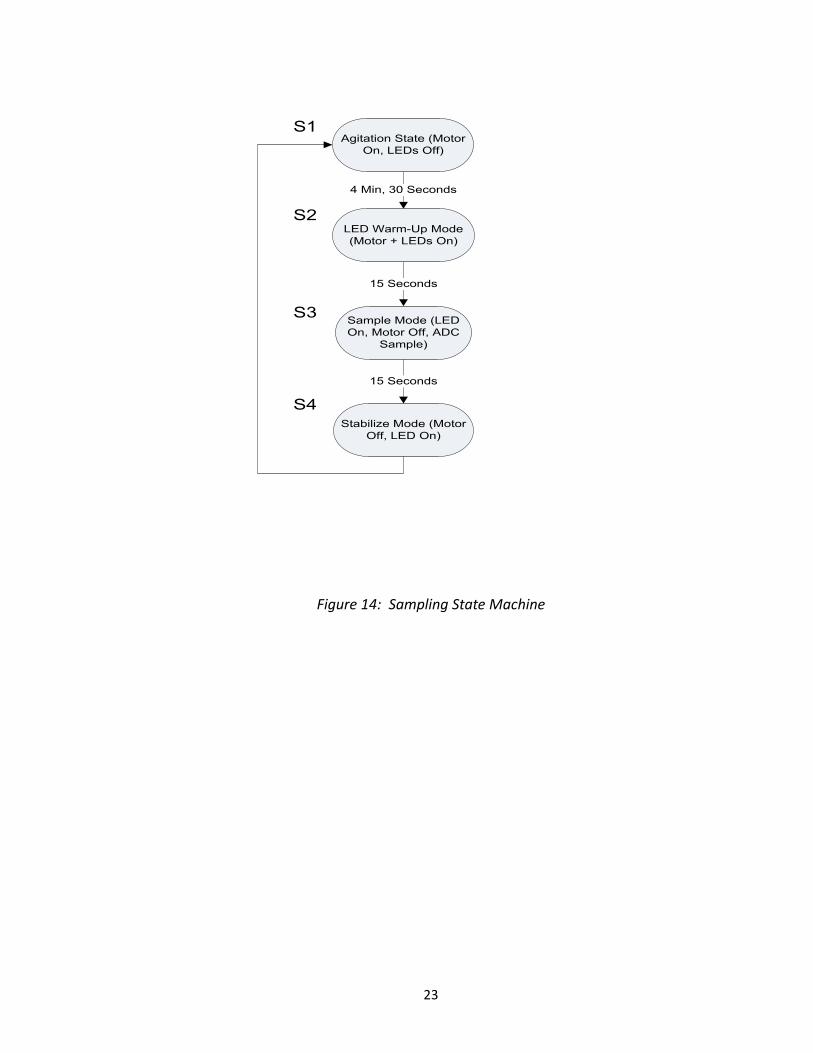
2.4.3.4 Sampling
If the system is in Auto Run or Run mode, the firmware will compare the 100mS
counter to preset values to update the test state machine. The sampling cycle
state machine comprises 4 states, as shown the Figure 14. State 1 occupies
22
most of the cycle time and serves to agitate the samples to encourage bacterial
growth. The LEDs are turned on in state 2 in order to allow sufficient time for
them to warm up before the samples are read. This is necessary to eliminate the
effect of chromatic variation due to LED die temperature and the duration was
determined empirically. Because moving liquid within the sample vessel will
refract light in unpredictable ways during the sampling window, the motor must
be stopped for 15 seconds in state 3. State 4 is the final state in which the
samples are read by the ADC and processed with the digital filter described in
section 2.4.3.2 before the results are transmitted to the host PC where they are
logged.
23
Stabilize Mode (Motor
Off, LED On)
4 Min, 30 Seconds
15 Seconds
15 Seconds
Agitation State (Motor
On, LEDs Off)
S1
S2
S3
S4
LED Warm-Up Mode
(Motor + LEDs On)
Sample Mode (LED
On, Motor Off, ADC
Sample)
Figure 14: Sampling State Machine

24
2.5 Incubation System Design
In order to maximize growth of microbial cultures which may be pathogenic to
humans, it is necessary to maintain culture specimens in an environment which
is held at or near human body temperature. The incubation system under design
therefore, will have an incubation target temperature of 35.0 degrees C. The two
most common methods of incubation are contact incubation (maintaining the
specimen tube in a directly heated block) and conditioned incubation
(maintaining the air inside an incubator cavity at the target temperature, and
using air as the heat transfer mechanism). To implement a contact incubation
heater in this design, the heating element would need to be in contact with the
sample holding block, which must be allowed to move during agitation. That
would require high current conductors within the flex cable which would increase
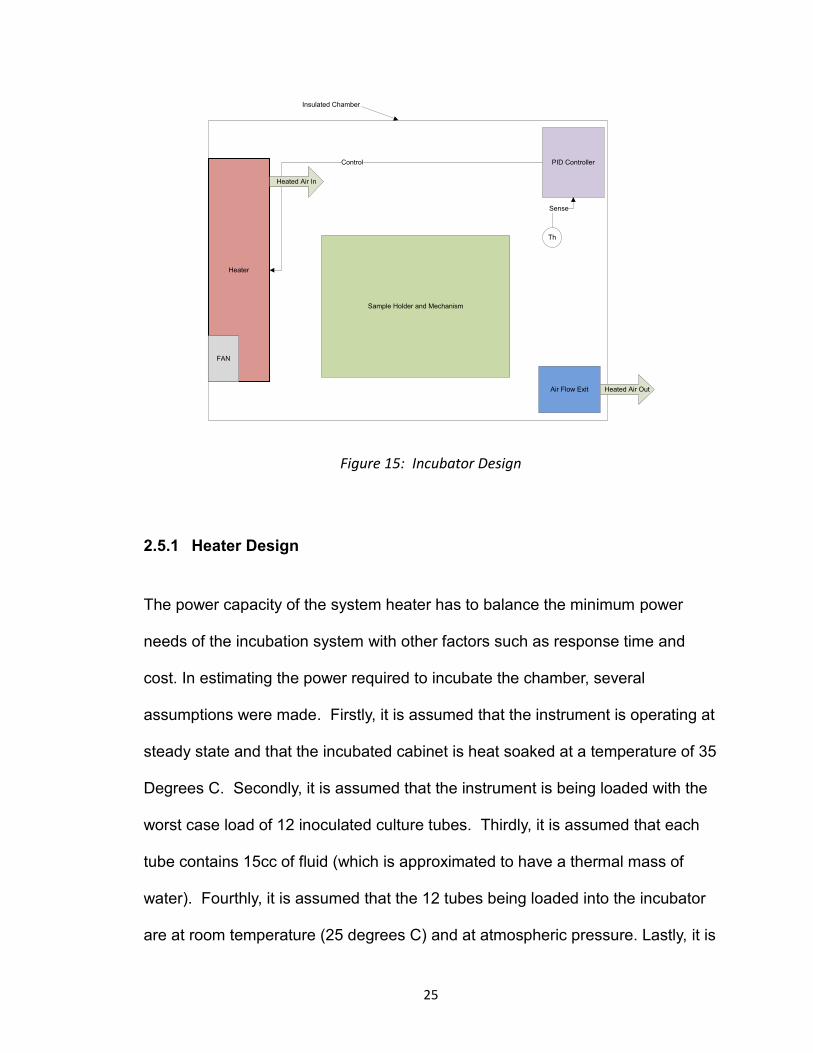
the system cost. Instead, this design utilizes a conditioned incubation system
because it results in a system with the lowest cost and highest reliability while still
achieving adequate temperature control for bacterial growth. In this system, a
fan-driven air column will be forced over the comparatively large surface area of
an aluminum heat sink at a continuous rate. The heat sink is warmed by a
resistive load at a controlled rate, based on feedback from an air temperature
sensing device located downstream of the heated air inside the incubated cavity.
A simplified block diagram of the incubation system is shown in Figure 15 below.
25
Heater
FAN
Air Flow Exit
Sample Holder and Mechanism
Th
PID Controller
Heated Air Out
Sense
Control
Heated Air In
Insulated Chamber
Figure 15: Incubator Design
2.5.1 Heater Design
The power capacity of the system heater has to balance the minimum power
needs of the incubation system with other factors such as response time and
cost. In estimating the power required to incubate the chamber, several
assumptions were made. Firstly, it is assumed that the instrument is operating at
steady state and that the incubated cabinet is heat soaked at a temperature of 35
Degrees C. Secondly, it is assumed that the instrument is being loaded with the
worst case load of 12 inoculated culture tubes. Thirdly, it is assumed that each
tube contains 15cc of fluid (which is approximated to have a thermal mass of
water). Fourthly, it is assumed that the 12 tubes being loaded into the incubator
are at room temperature (25 degrees C) and at atmospheric pressure. Lastly, it is
26
assumed that in order to provide the required performance the incubator must be
capable of raising the 180cc of water (the combined sample volume of the 12
tubes), 10 degrees C (from 25C to 35C) in less than 5 minutes (1 sample period).
The energy required to raise 1cc of water 1 degree C, is 4.18 Joules. This
system requires 180CC of water to be raised by 10 degrees C. This yields a
product of 7,524 watt seconds. Given that we have allowed 5 minutes for the
tubes to come to temperature (7524 watt seconds / 300 seconds), the system
heater must be capable of delivering a continuous 25.08 Watts at an absolute
minimum
The system heater nominal power requirement was derived using a presumed
room temperature of 25 degrees C. It is possible and perhaps even expected,
that the instrument will operate in temperatures as low as 10 degrees C in
locations with sub-optimal indoor temperature control. Given the system need for
responsive proportional control under these conditions, the likelihood of
occasional user door openings, and the recognition that the insulation of the
incubated cavity is imperfect, the system was designed to deliver 3X the nominal
power requirement.
The heater consists of TO-220 power resistors affixed to a finned aluminum heat
sink using a thermally conductive compound to facilitate good heat transfer. The
heater is powered by a 12VDC source and has a total resistance of 2 ohms, for a
calculated heater capacity of 72 watts.

27
A more common heater construction would utilize a ni-chrome wire, but that
design has been ruled out because it would radiate at wavelengths which would
pollute the optical measurement system. When deployed in areas where the
ambient temperature is expected to be above the incubation target temperature
of 98C, the system would require the use of a Peltier Thermo-electric Cooler
(TEC) in place of the resistive heater. The TEC would allow the blood culture
machine to operate in both lower ambient temperature environments where the
TEC would be operated as a heater, and in higher ambient temperature
environments, where the TEC would operate to cool the chamber. The PID
controller has additional control signals which would allow it to provide seamless
control across the transition point between heating and cooling in future design
iterations. Because the prototype was developed and tested in an area not
subject to such a high temperature extreme and a resistive heater was already
on hand, the TEC was not implemented in this prototype.
2.5.2 Airflow
Given that the incubation system heater will be controlled proportionally, the
incubation system fan has been designed to be held at constant duty to minimize
design and control complexity. A simple 12VDC electronic cooling has been
selected to provide the incubation airflow. This type of fan is routinely used in
electronic cabinet cooling applications, and is available from most major
electronic parts distributors. The selected fan is brushless to maximize lifetime in
a constant duty environment, and provides 14.5 Cubic Feet per Minute of flow.

28
With the estimated unoccupied cabinet volume of 1.1 cubic feet, the fan will
facilitate 13.2 cabinet air exchanges per minute.
2.5.3 PID Controller
For the original system design, simple on-off temperature control functionality
was included on the system main board. After considerable research on the
temperature requirements of human pathogen physiology however, doubts arose
as to the ability of such a system to maintain an adequately tight control band
with such a design. As such, a low cost off the shelf industrial proportional
integral derivative (PID) temperature controller was added to the system. The
controller uses a type “J” thermocouple input to sense the cabinet temperature,
and a pulse-width modulated logic output which is used to control the gate of the
power FET that provides 12VDC to the system heater. The system target
temperature may be set or changed from the front panel, and the actual cabinet
temperature is displayed in real-time.
The P, I, and D characteristics of the controller may be manually tuned, or may
be auto-tuned with a learning algorithm resident on the controller. The manual
setting would allow a user to specify the proportional, integral and derivative
terms used in the control algorithm. This could enable the system to reach the
target temperature more quickly but it would also result in an increased
temperature overshoot. The terms could also be changed to minimize overshoot,
but the PID algorithm would then respond more slowly and take longer to reach
the target temperature. I found that the automatic mode was able to control the

29
chamber temperature to within +/- 1 degree C within a short period of time, which
is sufficient for bacterial growth. For this reason, automatic mode was used for
the test procedure.
2.6 Agitation System
Bacterial culture requires readily available nutrients, appropriate gas-phase
head-space, and favorable environmental factors. A stationary bacterial culture
will allow growing organisms to quickly exhaust available nutrients, consume
required gas-phase constituents, and render their local environment toxic with
their own metabolic waste products. To redistribute nutrients and dilute local
toxins, bacterial cultures are subjected to physical agitation during culturing.
Agitation in this system is provided by reciprocal displacement of the specimen
tube over a stroke of approximately 1 inch, and at a rate of approximately 2
cycles per second. The result will be a wave inside the specimen tube which
mixes the tube's contents efficiently for a minimal input energy cost.
2.6.1 Head-space to Broth Ratio
Given that exposure to the gas phase components are important to promoting
growth, the fluid-air exchange surface is maximized by holding the tube in a near
horizontal position during agitation. This maintains the highest effective head-
space to broth ratio. It conveys the additional benefit of periodically exposing the
gas-permeable sensor in the bottom of each tube to the head-space gas. This

30
improves the permeation rate of the sensor, and shortens the sensor's response
time.
2.7 Agitation System Design
The agitation mechanism design consists of a tube rack, mounted on a pair of
stainless steel rails, by a set of four oil-impregnated bronze bushings. The
bushings are captive on the rails, and allow the entire tube rack to slide back and
forth on the rails. During powered agitations the tube rack is driven by a 12VDC
gear motor, with a cam and connecting rod. As the motor rotates, the connecting
rod drives the agitator in a reciprocal fashion, providing the agitation of the tubes.
A photograph of the side view of the agitation system is provided as Figure 16.
The tubes load into the rack from the left, and the subassembly can slide in a
reciprocal motion horizontally along the steel rods visible at the bottom.

31
2.8 Motor Control
While it is preferred to have agitation of the specimens be nearly continuous,
agitation during data acquisition has the potential to induce optical and electrical
noise, lowering signal to noise ratio. It will also be necessary for user to introduce
new specimens, or remove specimens from time to time. In order to facilitate
machine loading and to ensure that the tubes are stationary during
measurement, agitation must be under machine control. A stop command will be
issued to the agitation system prior to the start of data acquisition. The system
will issue a start command to the agitation system after acquisition is complete.
Figure 16: Sample Holder and Mechanism

32
3 Detection Algorithm
Given the clinical importance of sepsis, rapid detection of positive cultures is
critical to the prognosis of a patient with a blood borne bacterial infection. The
faster a culture can be detected, the higher the probability of patient survival.
Prevention of false positive detection is also important, as it prevents the clinical
laboratory from investing time, effort, and money that could be better utilized
elsewhere.
Developing an algorithm to discriminate between positive and negative cultures
would be a relatively simple undertaking if the entirety of the culture data were
available for interpretation. But in order to provide rapid detection of positive
cultures, interpretation of data must be made in real-time. With each incoming
data point, the data must be scrutinized for features which indicate growth.
3.1 Processing Window
To minimize the impact to system resources, the data is stored in an array and
interpreted with a sliding function. Each incoming data point is appended to the
front of the array and the processing window slides across the data as new data
becomes available. The result is a moving processing window. The processing
window is defined by the most recent 60 data points in the array (which will
subsequently be referred to as A1 through A60). As previously described, the
sampling period is 5 minutes, so the processing window operates on 5 hours of

33
data. This window width was chosen empirically. It is possible that the blood
culture instrument could process multiple arrays of multiple lengths in parallel.
3.2 Features of Interest for Discrimination
Given that the system under development is sensitive to CO2 production, the
signal features of both positive and negative blood cultures (and their impact on
CO2 production) have been considered. Although blood cells and bacterial cells
both produce CO2 as a function of respiration, there is a fundamental difference
between the two in a sealed culture vessel. Blood cells are manufactured by the
human body within the bone marrow and cannot reproduce on their own.
Therefore when a specimen is taken from a patient and inoculated into a culture
tube, the total number of viable blood cells present at the time of inoculation is at
its maximum. Whereas if bacteria are present, they will replicate by binary
fission, and as a result their number will increase exponentially. This difference
has a significant impact on signal expectations.
Because the number of blood cells in a culture is already at its maximum at
inoculation, the CO2 levels from blood metabolism are expected to be increasing
as measured by the system, but the rate of increase will be static or declining.
More simply, blood is expected to produce a positive first derivative in the signal
train (as a result of accumulated CO2 from metabolism), but is not expected to
produce a positive second derivative in the signal train (as the numbers of blood
cells available to produce CO2 do not increase).

34
Conversely, the number of bacteria (if present) in a culture is at its minimum at
the time of inoculation. And as the number of bacteria in the specimen increase
as a result of binary fission, so too does the rate of their production of CO2.
Therefore, bacteria will produce a positive first derivative in the signal train (as a
result of accumulated CO2 from metabolism), but should also be expected to
produce a positive second derivative in the signal train (as the numbers of
bacterial cells available to produce CO2 increase). Detection algorithms have
been designed to discriminate this signal‟s increasing first derivative from its
increasing second derivative. A theoretical example dataset representing a
positive and a negative curve can be seen in Figure 17.
Figure 17: Typical Signal Traces
0.1
0.15
0.2
0.25
0.3
0.35
0.4
0.45
0.5
1 2 3 4 5 6 7 8 9 10 11 12 13
Theoretical Positive vs Negative
negative positive

35
3.2.1 Algorithm Design:
More sophisticated methods of calculating 2nd derivative could be employed to
detect growth in positive cultures, but such methods would provide greater tax on
system resources, and are ultimately unwarranted. Simple calculations are
employed here to accomplish the same ends. This algorithm calculates metrics
on an array of 60 data points. For the purposes of this description the data points
will be labeled from A1 to A60, with A60 being the most recent.
To provide some level of filtering, an average of the three most recent, three
center, and three oldest data points in the array are calculated, and defined as
NEWEST, and OLDEST.
NEWEST = (A58+A59+A60)/3
TRUE CENTER = (A29+A30+A31)/3
OLDEST = (A1+A2+A3)/3
The equivalent of the center of a linear approximation between the endpoints
defined by NEWEST and OLDEST is then calculated.
LINEAR CENTER = (NEWEST +OLDEST)/2
The algorithm then tests these calculated metrics to determine if positive second
derivative is present in the data, and whether that positive second derivative is
accompanied by a positive first derivative in the overall processing array. A
36
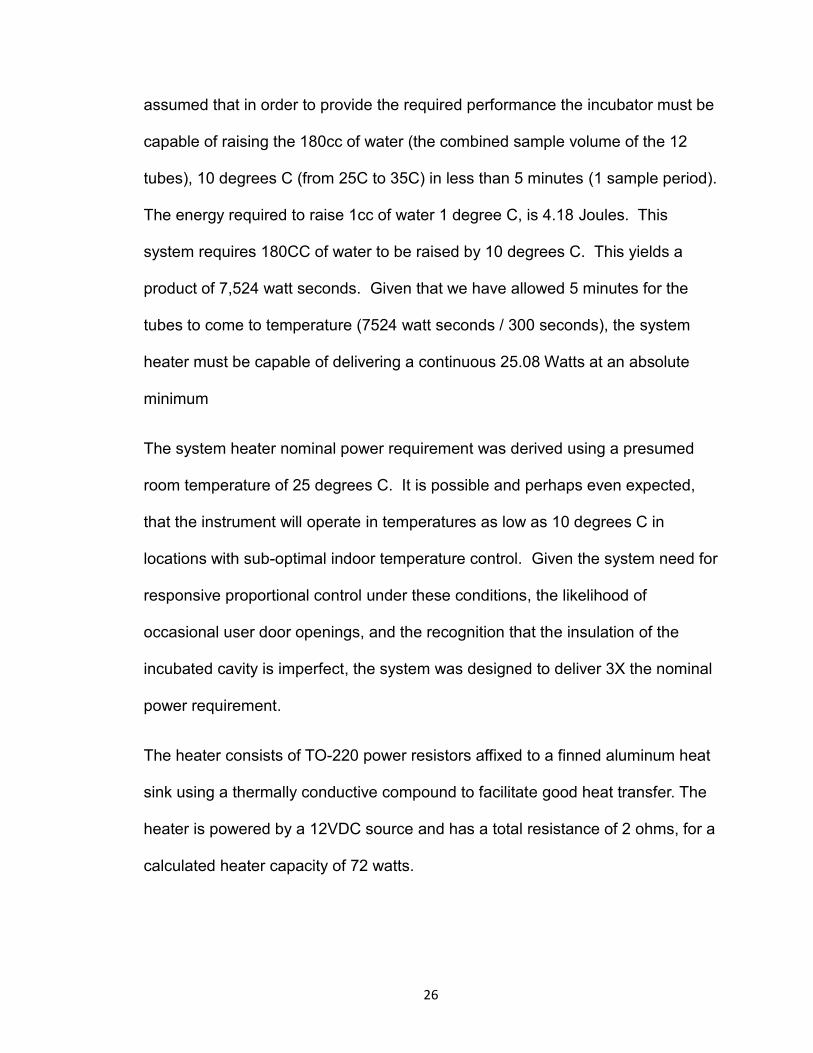
positive culture is declared if both tests are true. The following psuedocode
demonstrates how a simple function can employ the discrimination algorithm.
IF LINEAR CENTER > TRUE CENTER
AND
IF NEWEST > OLDEST
THEN Culture = Positive
A graphical representation of the intended function of the algorithm is included as
Figure 18. It is only possible to satisfy the requirements of algorithm with data
sets that have both a positive first derivative and a positive second derivative.
Figure 18: Detection Algorithm
37
4 TSB Broth Preparation
Medium was prepared using a traditional manual microbiology growth medium
called Tryptic Soy Broth or TSB. This product is available commercially as a TSB
Dehydrated Culture Medium (DCM) and was purchased from Sigma Aldrich as
cat # 22092-500G. The medium was prepared by weighing out powdered TSB,
and reconstituting in distilled water according to the instructions provided on the
medium package insert. Once the TSB was fully dissolved in the distilled water, a
syringe was used to dispense 10 ml of liquid TSB growth medium into each tube.
A screw cap was loosely affixed to each tube after dispensing, and the tubes
were placed in a metal test tube rack.
4.1 Sterilization of Media
If a steam autoclave were available to execute the sterilization of these tubes, it
would have been utilized as the preferred method. In the absence of a steam
autoclave, a pressure cooker was used. The rack of tubes (with the caps still
loosely affixed) was placed inside the pressure cooker, and 2 cups of water was
added to cover the bottom of the pressure cooker. The lid was affixed, heat was
applied, and the tubes were held at 120 degrees C and 15psi for 15 minutes, as
recommended in the TSB product insert. The pressure cooker was then removed
from the heat, and allowed to stand until pressure dissipation. The lid was then
removed, and the tube caps were tightened. This sealed the tubes at an elevated
38
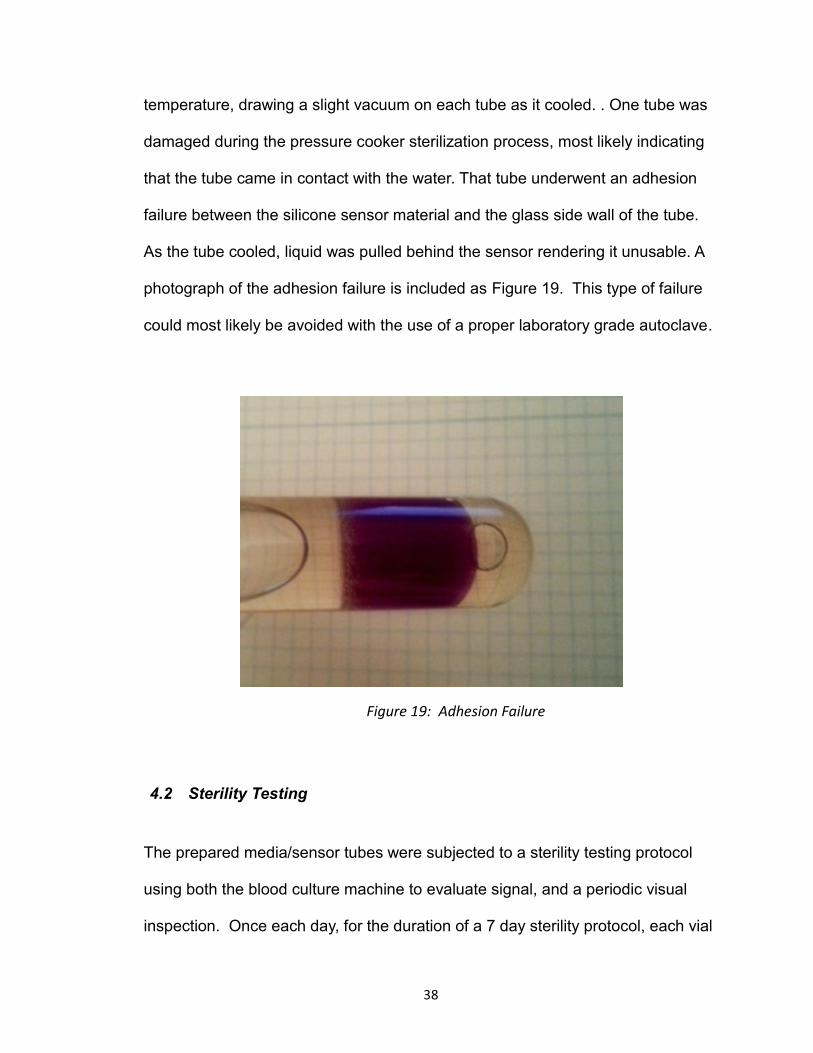
temperature, drawing a slight vacuum on each tube as it cooled. . One tube was
damaged during the pressure cooker sterilization process, most likely indicating
that the tube came in contact with the water. That tube underwent an adhesion
failure between the silicone sensor material and the glass side wall of the tube.
As the tube cooled, liquid was pulled behind the sensor rendering it unusable. A
photograph of the adhesion failure is included as Figure 19. This type of failure
could most likely be avoided with the use of a proper laboratory grade autoclave.
4.2 Sterility Testing
The prepared media/sensor tubes were subjected to a sterility testing protocol
using both the blood culture machine to evaluate signal, and a periodic visual
inspection. Once each day, for the duration of a 7 day sterility protocol, each vial
Figure 19: Adhesion Failure
39
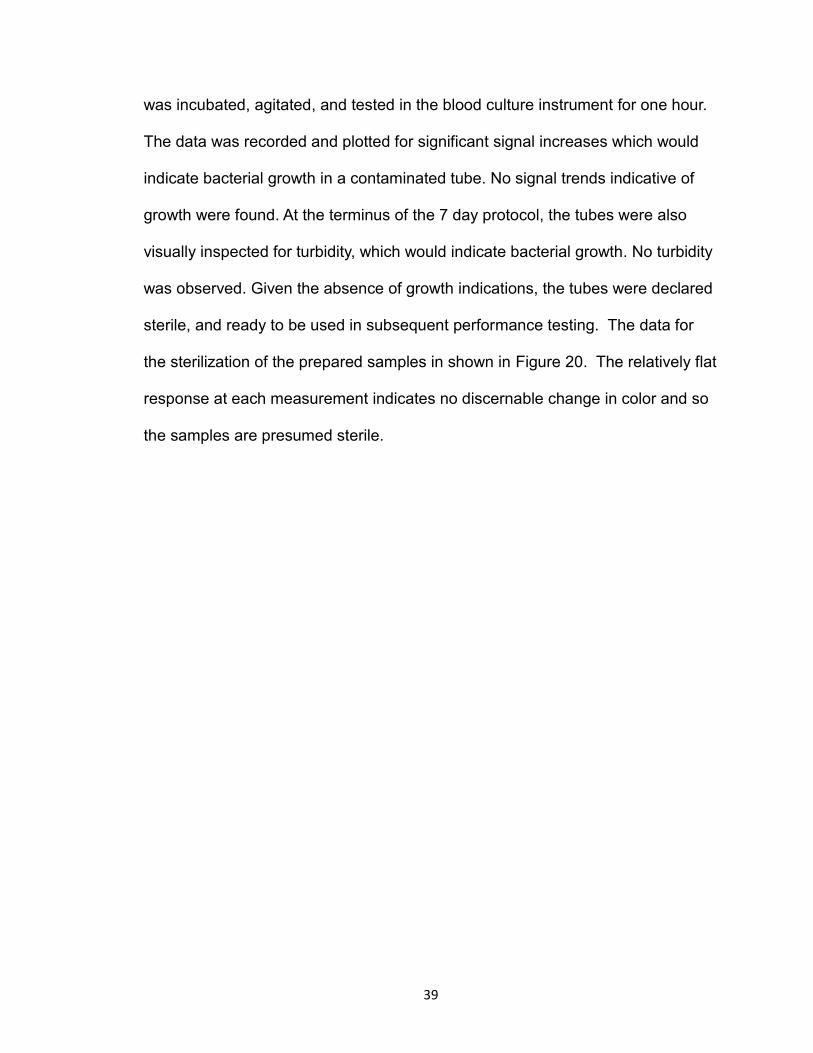
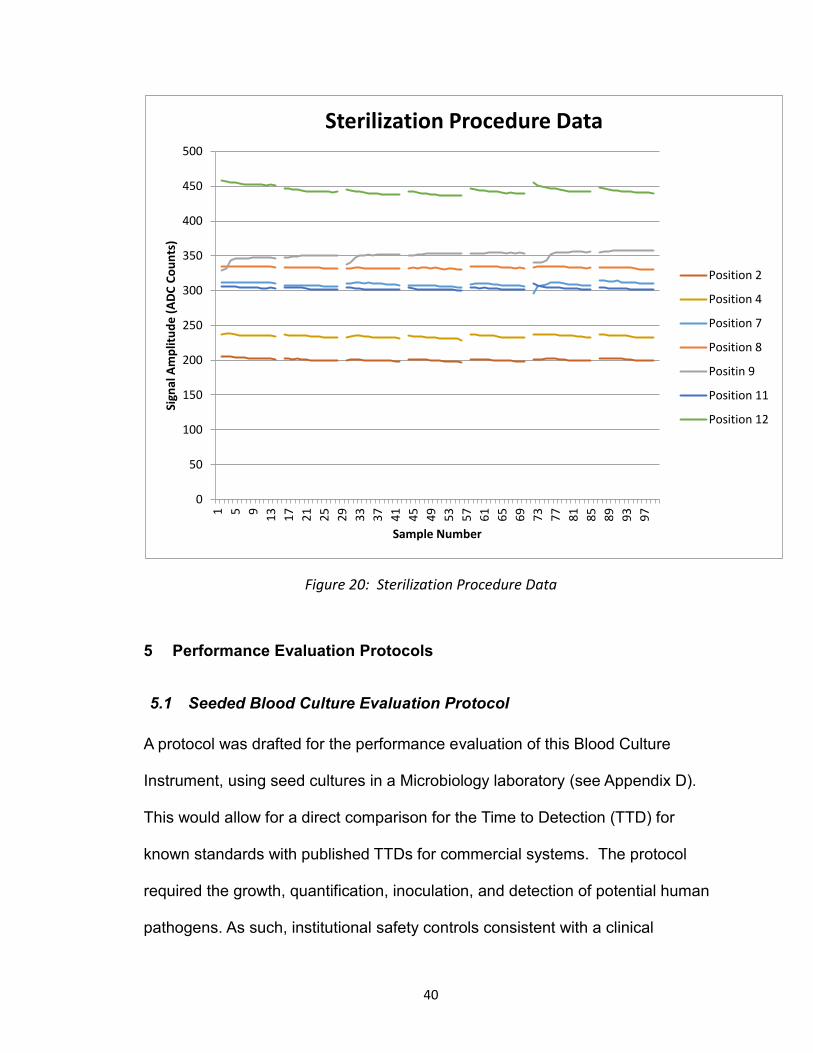
was incubated, agitated, and tested in the blood culture instrument for one hour.
The data was recorded and plotted for significant signal increases which would
indicate bacterial growth in a contaminated tube. No signal trends indicative of
growth were found. At the terminus of the 7 day protocol, the tubes were also
visually inspected for turbidity, which would indicate bacterial growth. No turbidity
was observed. Given the absence of growth indications, the tubes were declared
sterile, and ready to be used in subsequent performance testing. The data for
the sterilization of the prepared samples in shown in Figure 20. The relatively flat
response at each measurement indicates no discernable change in color and so
the samples are presumed sterile.
40
Figure 20: Sterilization Procedure Data
5 Performance Evaluation Protocols
5.1 Seeded Blood Culture Evaluation Protocol
A protocol was drafted for the performance evaluation of this Blood Culture
Instrument, using seed cultures in a Microbiology laboratory (see Appendix D).
This would allow for a direct comparison for the Time to Detection (TTD) for
known standards with published TTDs for commercial systems. The protocol
required the growth, quantification, inoculation, and detection of potential human
pathogens. As such, institutional safety controls consistent with a clinical
0
50
100
150
200
250
300
350
400
450
500
1
5
9
13
17
21
25
29
33
37
41
45
49
53
57
61
65
69
73
77
81
85
89
93
97
Sign
al A
mp
litu
de
(A
DC
Co
un
ts)
Sample Number
Sterilization Procedure Data
Position 2
Position 4
Position 7
Position 8
Positin 9
Position 11
Position 12
41
microbiology lab (including personal protective equipment, fume hoods,
sterilizers, etc. would be required. The original plan was to draw upon the
facilities and experience of the University. Unfortunately, this path was not
available, and an alternate simplified protocol was used.
5.2 Simplified Bacterial Detection Protocol
A simplified bacterial detection protocol was created, which affords the
opportunity to evaluate the growth and detection characteristics of this system,
without the use of a clinical microbiology laboratory. This protocol is included as
Appendix E.
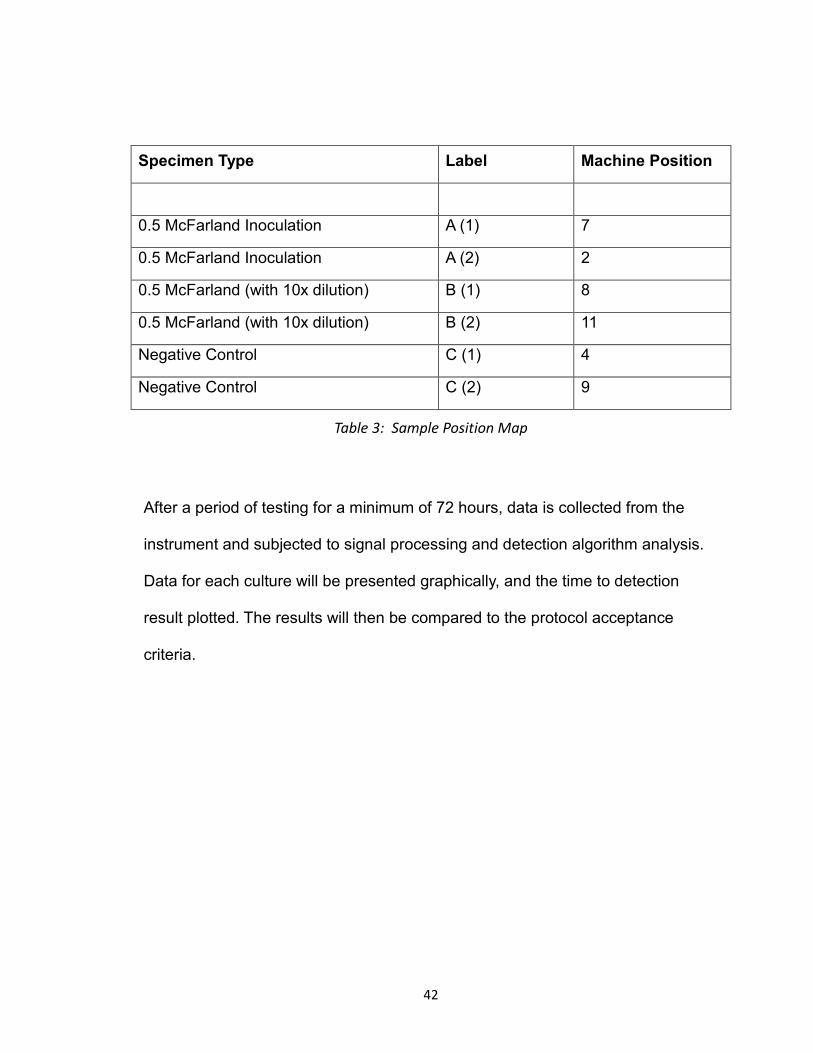
To summarize the intent of the protocol, bacteria are isolated from a cheek swab,
and allowed to grow in broth medium. The bacteria are then standardized to a
known quantity, using turbidity reference standards (McFarland Standards).
Once standardized, tubes in duplicate are created for evaluation, and entered
into the instrument in the configuration specified below in Table 3:
42
Specimen Type Label Machine Position
0.5 McFarland Inoculation A (1) 7
0.5 McFarland Inoculation A (2) 2
0.5 McFarland (with 10x dilution) B (1) 8
0.5 McFarland (with 10x dilution) B (2) 11
Negative Control C (1) 4
Negative Control C (2) 9
Table 3: Sample Position Map
After a period of testing for a minimum of 72 hours, data is collected from the
instrument and subjected to signal processing and detection algorithm analysis.
Data for each culture will be presented graphically, and the time to detection
result plotted. The results will then be compared to the protocol acceptance
criteria.
43
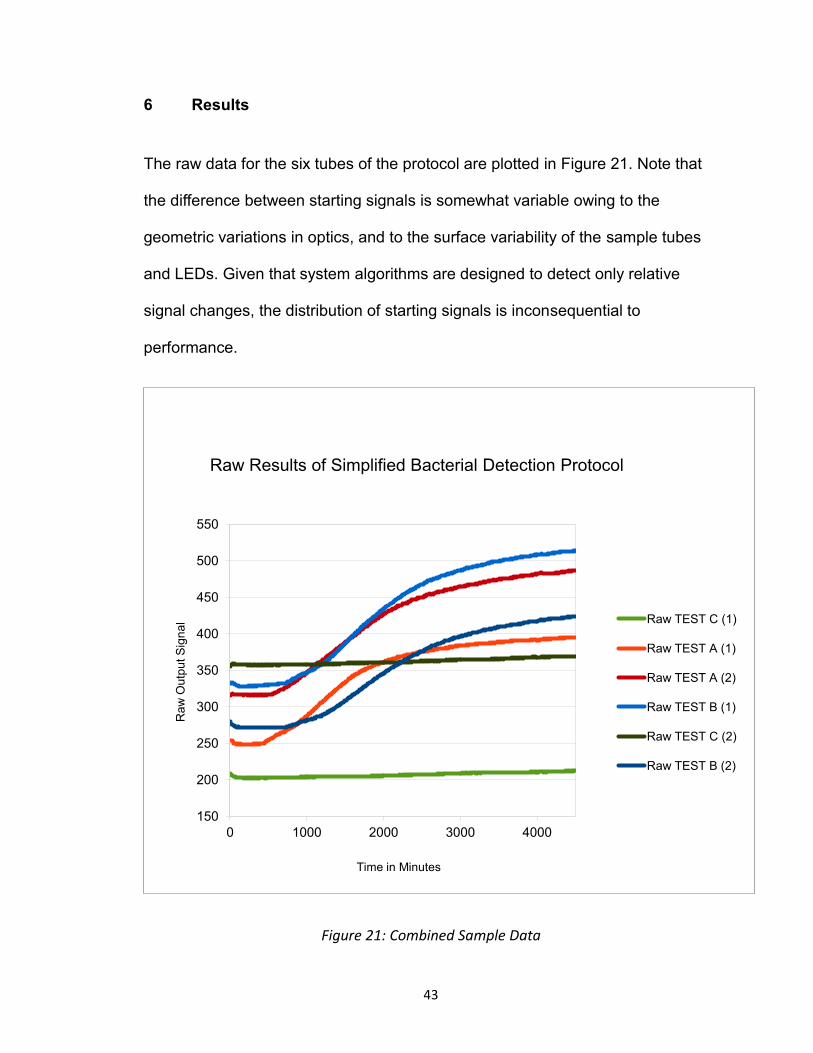
6 Results
The raw data for the six tubes of the protocol are plotted in Figure 21. Note that
the difference between starting signals is somewhat variable owing to the
geometric variations in optics, and to the surface variability of the sample tubes
and LEDs. Given that system algorithms are designed to detect only relative
signal changes, the distribution of starting signals is inconsequential to
performance.
Figure 21: Combined Sample Data
150
200
250
300
350
400
450
500
550
0 1000 2000 3000 4000
Raw
Outp
ut S
ign
al
Time in Minutes
Raw Results of Simplified Bacterial Detection Protocol
Raw TEST C (1)
Raw TEST A (1)
Raw TEST A (2)
Raw TEST B (1)
Raw TEST C (2)
Raw TEST B (2)

44
For the purposes of understanding and explaining the relationship between the
signals more easily, the data has been normalized to a common initial amplitude.
Figure 10: Normalized Data for all Samples
Normalization was accomplished by calculating a simple scalar for each culture
based on the first data point of protocol, and adding that scalar to all subsequent
points. In this case, a starting signal target of 0.5 was chosen, although this value
45
is arbitrary and has no impact on signal analysis or bacteria detection. As shown
in Figure 22 above, the 6 protocol tube signal sets are more uniformly distributed
and can be displayed on the same scale.
6.1.1 Detection Analysis
The 6 tubes of the protocol were subjected to detection analysis by the
previously defined algorithm, in order to assure that the machine accurately
differentiates positives from negative samples. The algorithm also provides a
time-to-detection for each positive culture. The time-to-detection calculated by
the algorithm has been compared to a graphical representation of each growth
curve, to assure that detection occurs at a rational location on the curve. The
time-to-detection has also been scrutinized to determine whether it satisfies the
requirements.

46
Figure 23: Algorithm Detection of Test A (1)
Figure 23, shows the growth curve data for TEST A, replicate 1of the protocol.
The normalized instrument data is represented in blue, and the point of positive
detection is represented as a red vertical line. A positive signal is determined at
the point of intersection. This culture demonstrated robust growth, and was
detected as positive at 7 hrs and 25 min. of elapsed protocol time. Note that the
algorithm displays good sensitivity (detecting the culture relatively early in its
expression of a positive second derivative).

47
Figure24: Algorithm Detection of Test A (2)
Figure 24 represents TEST A replicate 2 of the protocol. Again the culture
represents robust growth characteristics, and a time to detection of 9 hrs 25 min
of elapsed protocol time.
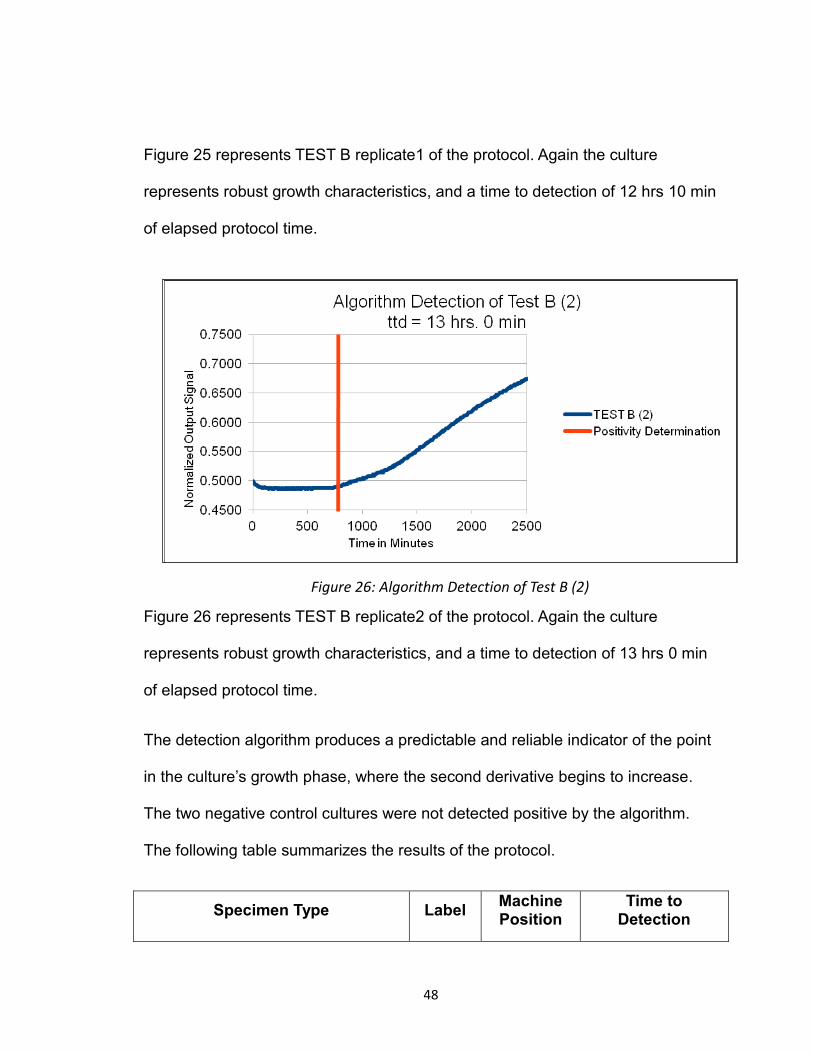
Figure 25: Algorithm Detection of Test B (1)
48
Figure 25 represents TEST B replicate1 of the protocol. Again the culture
represents robust growth characteristics, and a time to detection of 12 hrs 10 min
of elapsed protocol time.
Figure 26 represents TEST B replicate2 of the protocol. Again the culture
represents robust growth characteristics, and a time to detection of 13 hrs 0 min
of elapsed protocol time.
The detection algorithm produces a predictable and reliable indicator of the point
in the culture‟s growth phase, where the second derivative begins to increase.
The two negative control cultures were not detected positive by the algorithm.
The following table summarizes the results of the protocol.
Specimen Type Label Machine Position
Time to Detection
Figure 26: Algorithm Detection of Test B (2)
49
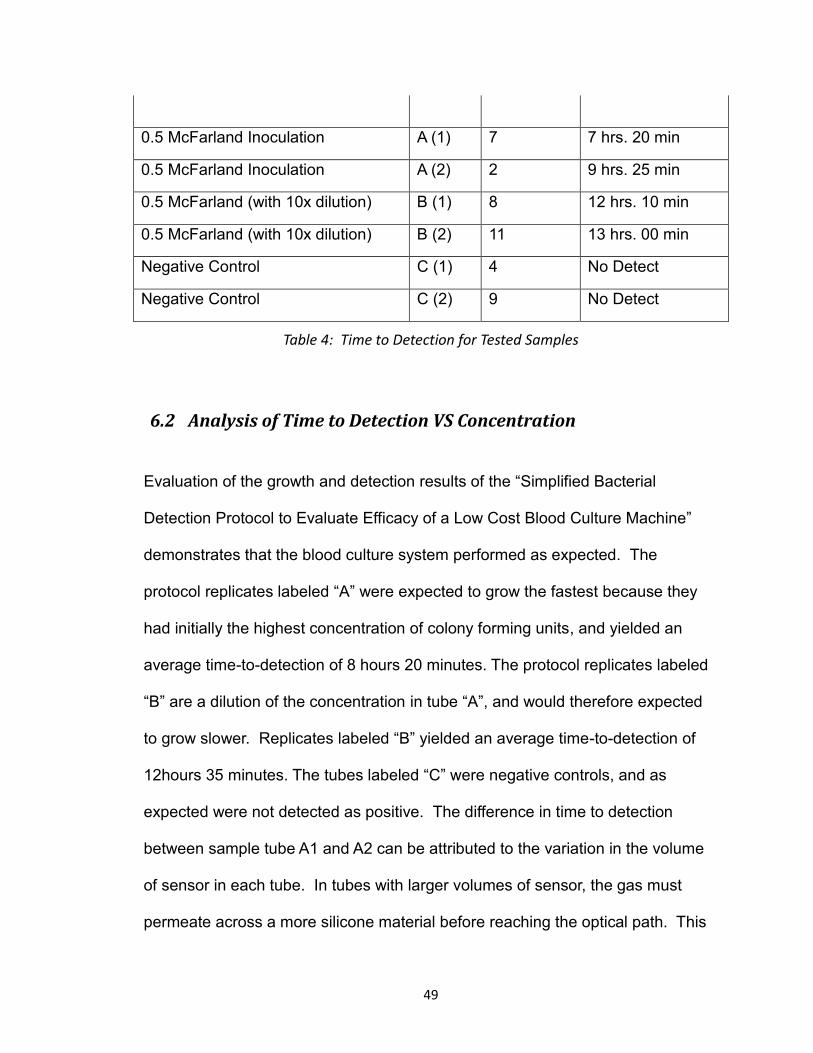
0.5 McFarland Inoculation A (1) 7 7 hrs. 20 min
0.5 McFarland Inoculation A (2) 2 9 hrs. 25 min
0.5 McFarland (with 10x dilution) B (1) 8 12 hrs. 10 min
0.5 McFarland (with 10x dilution) B (2) 11 13 hrs. 00 min
Negative Control C (1) 4 No Detect
Negative Control C (2) 9 No Detect
Table 4: Time to Detection for Tested Samples
6.2 Analysis of Time to Detection VS Concentration
Evaluation of the growth and detection results of the “Simplified Bacterial
Detection Protocol to Evaluate Efficacy of a Low Cost Blood Culture Machine”
demonstrates that the blood culture system performed as expected. The
protocol replicates labeled “A” were expected to grow the fastest because they
had initially the highest concentration of colony forming units, and yielded an
average time-to-detection of 8 hours 20 minutes. The protocol replicates labeled
“B” are a dilution of the concentration in tube “A”, and would therefore expected
to grow slower. Replicates labeled “B” yielded an average time-to-detection of
12hours 35 minutes. The tubes labeled “C” were negative controls, and as
expected were not detected as positive. The difference in time to detection
between sample tube A1 and A2 can be attributed to the variation in the volume
of sensor in each tube. In tubes with larger volumes of sensor, the gas must
permeate across a more silicone material before reaching the optical path. This

50
volume was not well controlled in the development of the prototype sensors, but
with proper equipment in a manufacturing environment would be more
consistent. The same can be said about the difference in time to detection
between samples B1 and B2.
7 Conclusion
7.1 Performance
The stated design objective of this project was to produce a blood culture
machine which would match or exceed the performance of existing devices, but
at a cost low enough to make this technology available to markets which were
previously not able to benefit from them.
The performance evaluation of this blood culture technology was not
comprehensive. It was however, sufficient to demonstrate that the system
faithfully detects the real-time production of CO2 by bacteria during the log phase
of growth. Given that no existing technology can detect evidence of growth any
faster than the CO2 is produced, it is reasonable to conclude that the
performance of this instrument would be at least equivalent to commercially
available devices.
There is the possibility (although this would have to be demonstrated clinically)
that the performance of this system would actually exceed that of predicate
devices. The agitation system design offers considerable advantage over
existing devices, in that it provides more complete mixing and greater head-
51
space to medium exposure. The simplicity of the chemical sensor system should
also allow for higher dynamic range and faster CO2 permeation rates than
commercialized technologies. This should result in higher amplitude signals, with
less delay, leading to faster detection.
7.2 Cost
7.2.1 Machine Cost
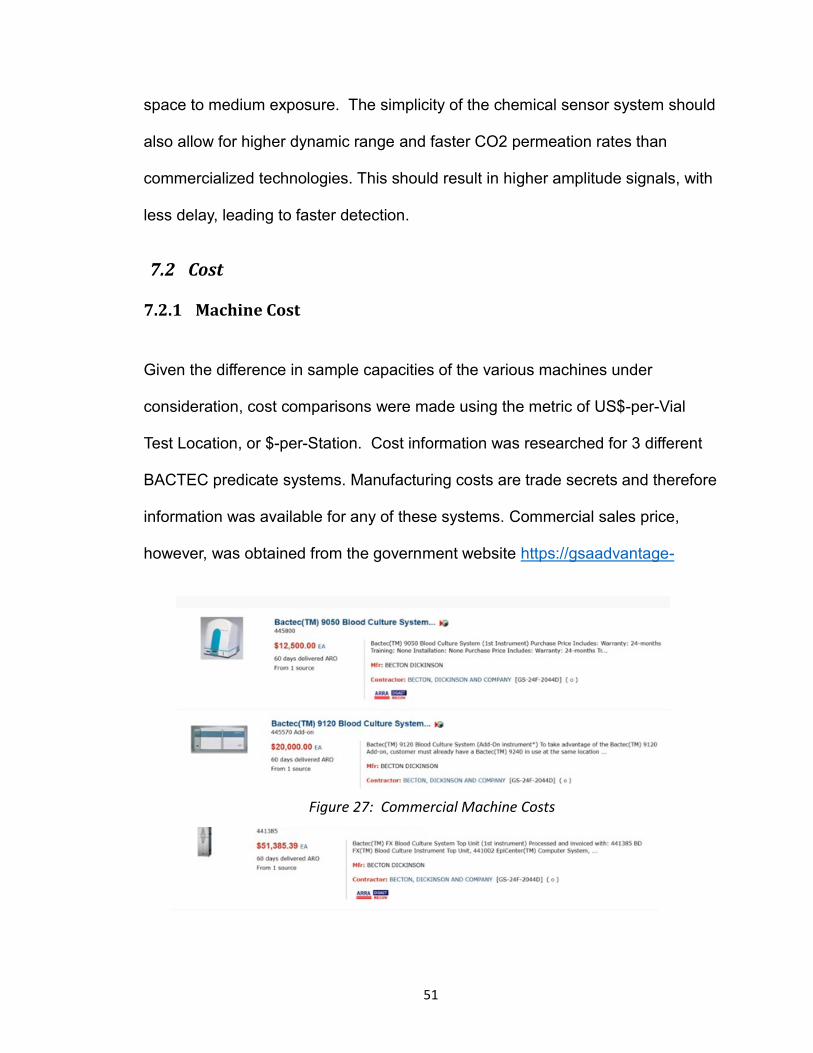
Given the difference in sample capacities of the various machines under
consideration, cost comparisons were made using the metric of US$-per-Vial
Test Location, or $-per-Station. Cost information was researched for 3 different
BACTEC predicate systems. Manufacturing costs are trade secrets and therefore
information was available for any of these systems. Commercial sales price,
however, was obtained from the government website https://gsaadvantage-
Figure 27: Commercial Machine Costs
52
test.fas.gsa.gov, a screenshot of which is in Figure 26.
To allow for direct comparison of systems, bill of material (BOM) costs, plus a
labor, overhead and profit (LOP) estimate can be used to calculate a
manufactured item‟s suggested sales price, based on a cost-plus markup
approach.
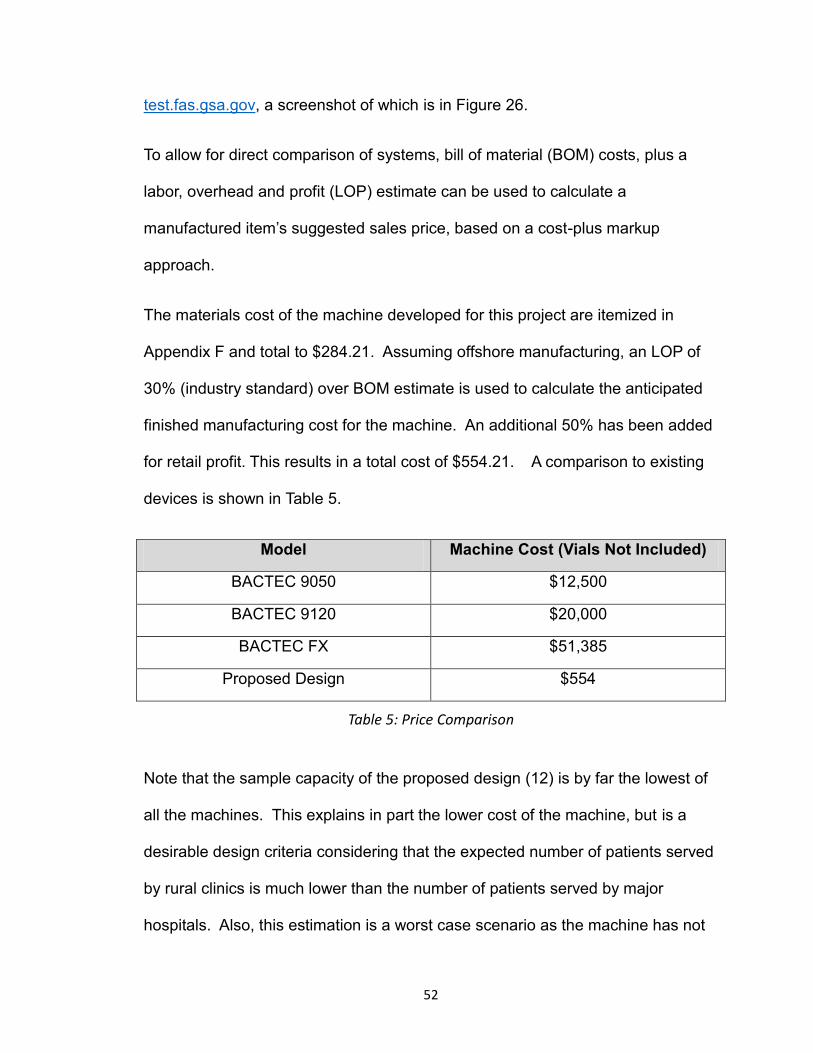
The materials cost of the machine developed for this project are itemized in
Appendix F and total to $284.21. Assuming offshore manufacturing, an LOP of
30% (industry standard) over BOM estimate is used to calculate the anticipated
finished manufacturing cost for the machine. An additional 50% has been added
for retail profit. This results in a total cost of $554.21. A comparison to existing
devices is shown in Table 5.
Model Machine Cost (Vials Not Included)
BACTEC 9050 $12,500
BACTEC 9120 $20,000
BACTEC FX $51,385
Proposed Design $554
Table 5: Price Comparison
Note that the sample capacity of the proposed design (12) is by far the lowest of
all the machines. This explains in part the lower cost of the machine, but is a
desirable design criteria considering that the expected number of patients served
by rural clinics is much lower than the number of patients served by major
hospitals. Also, this estimation is a worst case scenario as the machine has not

53
yet been optimized for design for manufacture and the prices listed do not
include the disposable culture vials.
Although only in the prototype stage, the blood culture instrument as designed
clearly satisfies the original requirement of equivalent or better performance, with
a cost low enough to extend the reach of this technology into emerging markets
traditionally beyond the reach of automated blood culture.
7.2.2 Disposable Cost
Assuming reasonable production volumes, disposable costs in a blood culture
system are driven primarily by complexity and materials. This disposable was
designed with low cost in mind. The culture vial is actually a standard test tube
which is used in countless other platforms, and for general laboratory use. This
allows the disposable to take advantage of volume pricing benefits which would
not be available to an exclusive disposable design. Most commercial systems,
on the other hand, require the use flat bottomed optical grade vials specifically
made for the intended machine.
Also, the chemical sensor developed for this system benefits from a minimalist
design, comprising only two parts; a silicone matrix, and a colorimetric pH
indicator. This provides benefit in terms of material cost and reduced
manufacturing complexity as compared to the commercially available systems.
The fact that the sensor is interrogated in an axis perpendicular to the tube
prevents the optical signal from being affected by the change in material
properties of the liquid contents of the tube. This allows the sensor to be

54
fractionally transparent, resulting in high dynamic range, without the addition of
optical barrier components in the sensor which are used by competitive systems.

55
8 Further Development
To develop this product beyond the prototype stage, the machine would have to
be given sufficient industrial design attention to provide a commercially appealing
product. This would be unlikely to add significant cost, as it would only include
injected molded skins and bezels over a sheet metal incubation cabinet.
Detailed mechanical design attention would have to be spent on agitation and the
vial rack. Automated manufacturing methods would have to be developed for the
specimen vial to facilitate sensor fill and cure, in addition to media fill and
capping.

56
9 References:
1. Martin GS, Mannino DM, Eaton S, Moss M. The epidemiology of sepsis in the United States from 1979 through 2000. N Engl J Med 2003; 348:1546–1554.
2. (November 2012) National Institutes of Health Sepsis Fact Sheet. Retrieved from http://www.nigms.nih.gov/Education/Pages/factsheet_sepsis.aspx
3. Czura, Christopher J., PhD and Distlerath, Linda, PhD. (November 2010). Sepsis poses life-threatening response to infection. Retrieved from http://www.mlo-online.com/articles/201011/sepsis-poses-life-threatening-response-to-infection.php
4. Babay, Emily. (2013, May 23). Mid-Atlantic a hotspot for sepsis deaths, Penn study finds. Retrieved from http://www.philly.com/philly/news/Mid-Atlantic_a_hotspot_for_sepsis_deaths_Penn_study_finds.html

57
10 Appendices
10.1 Appendix A: Predicate Systems
10.1.1 Manual Systems:
10.1.1.1 Septi-Check ®
10.1.1.2 Theory of operation
Septic-Check is a manual blood culture system comprised of a vial
containing liquid growth medium, and a screw on top containing a solid
culture plate inside a sealed chamber. Sample blood is collected directly
into the liquid sealed culture vessel by venipuncture. The specimen is then
incubated, and agitated to promote bacterial growth inside the liquid
culture. Periodically (typically once every 8 hours, or once every 24 hours)
the culture vial is inverted, washing the solid culture medium with
whatever bacteria (if any) have accumulated or grown in the liquid culture
medium. Bacteria deposited on the plate during a wash will grow visible
colonies on the plate. The plate is read manually just prior to inverting the
vial. Presence of visible colonies on the solid medium indicates a positive
culture.
10.1.1.3 Utility
Septi-Check holds a significant market presence among laboratories
which perform blood cultures, but which do not have sufficient blood
58
culture volume to justify the expense of an automated blood culture
system.
10.1.1.4 Pros
High blood to medium dilution ratio provides good biological performance.
The inclusion of a solid growth medium provides both a means of
detection, and a ready source of pure isolated bacterial colonies for
subsequent identification tests.
10.1.1.5 Cons
Disposables used in this method comprise many parts and are relatively
complex, and are therefore relatively expensive (get price). The need for
user interaction to read and plate-wash the cultures burdens the labs with
labor costs.
10.1.2 Automated Methods
10.1.2.1 BACTEC® NR Series
10.1.2.2 Theory of operation
BACTEC® NR Series is a automated blood culture system comprised of an
incubating cabinet, an orbital agitation system, and a gas phase IR measurement
system. Sample blood is collected directly into a sealed culture vessel containing
growth medium by venipuncture. The specimen is subsequently introduced into
the incubator/agitator. Periodic monitoring (once every 8 hrs.) is accomplished

59
by transferring trays of cultures into a robotic machine which pierces the vial seal
(septum) with a needle set, extracting a sample of the head space gas for
analysis. The gas is pulled into an optical sample cell, and measured by IR fixed
wavelength analysis to quantify the CO2 in the vial. Changes in CO2 or
sufficiently high absolute quantities of CO2 are indicative of bacterial growth.
10.1.2.3 Utility
Once the only automated method commercially available, BACTEC NR
technology has been supplanted by in-vial chemical sensor technologies owing
to performance. This is likely attributable to cost and performance pressures.
10.1.2.4 Pros
BACTEC NR technology offered good biological performance (growth, but not
necessarily detection). Published studies show good recovery of organisms, but
not competitive times to detection for most organisms.
10.1.2.5 Cons
The inability to read specimens at a rate higher than once per eight hours
provides a significant liability in time-to-detection of positive blood cultures.
Continuous puncture of vial septum by the instrument carries a significant risk of
vial cross-contamination, and operator pathogen exposure.
10.1.3 BACTEC® F Series

60
10.1.3.1 Theory of operation
BACTEC® F Series is a continuous-monitoring blood culture system comprised
of an incubating cabinet, a rocking agitation system, and an optical measurement
system. BACTEC employs a fluorescent chemical sensor technology capable of
measuring O2 or CO2 with distinct chemical sensors for each gas. Sample blood
is collected directly into a sealed culture vessel by venipuncture, and the
specimen is introduced into the machine. Periodic optical monitoring is
employed to detect changes in fluorescence of a sensor inside the vessel. The
sensor is composed of a fluorescent indicator inside a silicone matrix. The
silicone matrix allows the migration of CO2 or O2 into the sensor, while keeping
the liquid phase components of the culture from interfering. Measurements are
accumulated and interpreted for evidence of bacterial metabolism.
10.1.3.2 Utility
Originally the dominant market actor in automated blood culture, BACTEC has
fallen to second. This is likely attributable to cost and performance pressures.
10.1.3.3 Pros
Performance of the BACTEC system is sound. Published studies show
competitive times to detection for most organisms. User interface characteristics
are generally sound. Media additives (particularly resin) provide a significant
performance advantage in the presence of antibiotics.
10.1.3.4 Cons
Complex sensor formulation creates a relatively expensive disposable.
Fluorescent measurement system requires optical filters for excitation and

61
emission for each measurement station. These factors in conjunction make it
difficult for the BACTEC system to withstand the pressures of a cost competitive
market. Rocking agitation system allows entrapment of blood biomass in the
lower corner of the culture vessel, making it difficult to recover organisms
encapsulated in that biomass.
10.1.4 BacT/ALERT®
10.1.4.1 Theory of operation
BacT/ALERT (Bio-Merieux) is a continuous-monitoring blood culture system
comprised of an incubating cabinet, a rocking agitation system, and an optical
measurement system. BacT/ALERT employs a pH-sensitive colorimetric
chemical sensor technology. Sample blood is collected directly into a sealed
culture vessel by venipuncture, and the specimen is introduced into the machine.
Periodic optical monitoring is employed to detect changes in color, of a sensor
inside the vessel. The sensor is composed of a pH indicator disc target inside a
silicone matrix. The silicone matrix allows the migration of CO2 into the sensor,
while keeping the liquid phase components of the culture from interfering.
Measurements are accumulated and interpreted for evidence of bacterial
metabolism.
10.1.4.2 Utility
Owing to a good balance of price and performance, the BacT/ALERT® system
has emerged as the international blood culture market leader.

62
10.1.4.3 Pros
Relatively simple sensor design allows for a less expensive disposable than
primary market competitor. Likewise, colorimetric as opposed to fluorimetric
measurement system provides for a less expensive instrument design (no optical
filters necessary). Smaller disposable provides higher sample density per unit
machine volume. Biological performance satisfies market expectations.
10.1.4.4 Cons
Reflective measurement system geometry provides a significant passive
background signal component minimizing system dynamic range. Smaller
disposable compromises dilution ratio for sample density. Rocking agitation
system allows entrapment of blood biomass in the lower corner of the culture
vessel, making it difficult to recover organisms encapsulated in that biomass.
10.1.5 VersaTREK®
10.1.5.1 Theory of operation
VersaTREK (Thermo-Scientific) is a continuous-monitoring blood culture system
comprised of an incubating cabinet, a stirring agitation system, and measurement
system. VersaTREK employs a manometric technology. Sample blood is
collected directly into a sealed culture vessel by venipuncture, and the specimen
is introduced into the machine. Periodic pressure transducer monitoring is
employed to detect pressure changes inside the vessel. Measurements are
accumulated and interpreted for evidence of bacterial metabolism.
63
10.1.5.2 Utility
A relative late-comer to the blood culture market, VersaTREK has enjoyed steady
market penetration owing largely to its biological performance advantage (see
section 110.1.5.3).
10.1.5.3 Pros
VersaTREK employs a comparatively large culture vessel, large media volume,
and the highest blood-to-medium dilution ratio (1 to 9) of any continuous
monitoring blood culture system commercially available. This high dilution ratio
(coupled with vigorous stirring agitation) provides some of the best biological
performance in the market.
10.1.5.4 Cons
The VersaTREK measurement system is based on a pressure measurement
technology with significant limitations. While bacterial metabolism produces
significant gas phase byproducts which may increase the pressure inside a
sealed vessel, those same bacteria also consume gas phase metabolites.
Depending on the organism, consumption and production rates may achieve a
near balance making detection difficult.
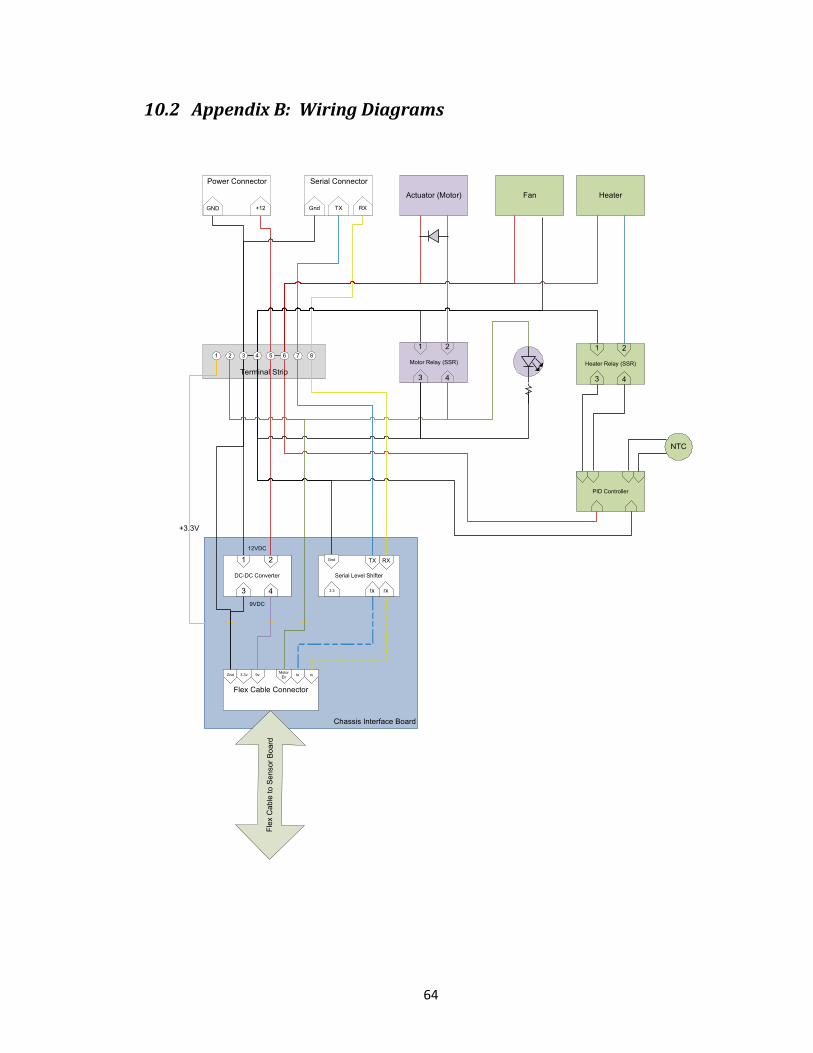
64
10.2 Appendix B: Wiring Diagrams
Chassis Interface Board
Terminal Strip
1 2 3 4 5 6 7 8
HeaterActuator (Motor)
NTC
Fan
Serial Connector
Gnd TX RX
Power Connector
GND +12
Motor Relay (SSR)
1 2
3 4
Heater Relay (SSR)
1 2
3 4
PID Controller
+3.3V
Serial Level Shifter
Flex Cable Connector
9VDC
DC-DC Converter
1 2
3 4
12VDC
RXTXGnd
rxtx3.3
9vGnd 3.3v tx rxMotor
En
Fl e
x C
able
to S
en
sor
Bo
ard

65
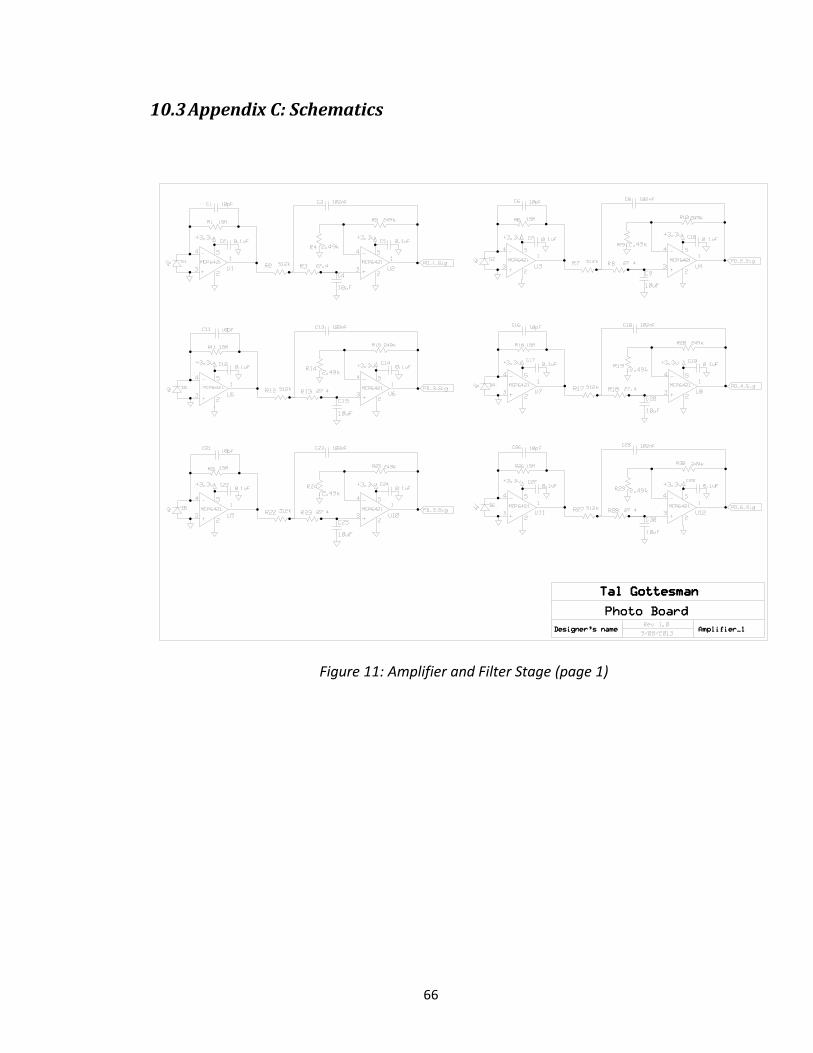
66
10.3 Appendix C: Schematics
Figure 11: Amplifier and Filter Stage (page 1)
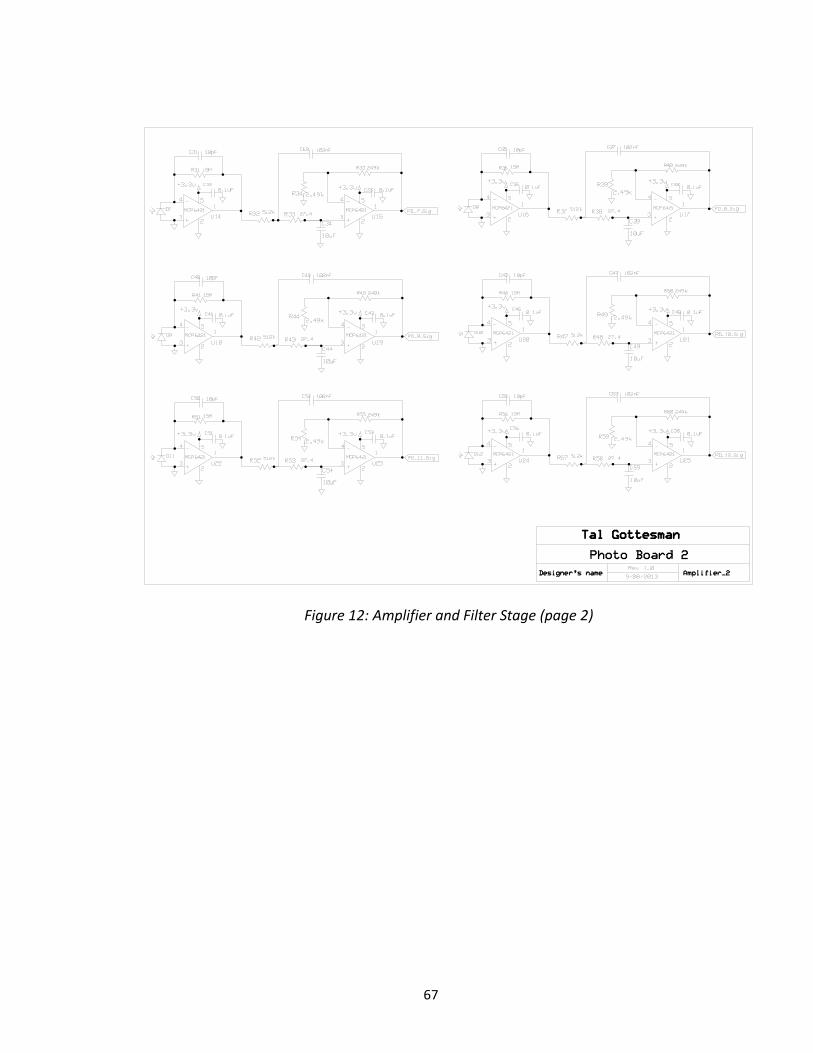
67
Figure 12: Amplifier and Filter Stage (page 2)
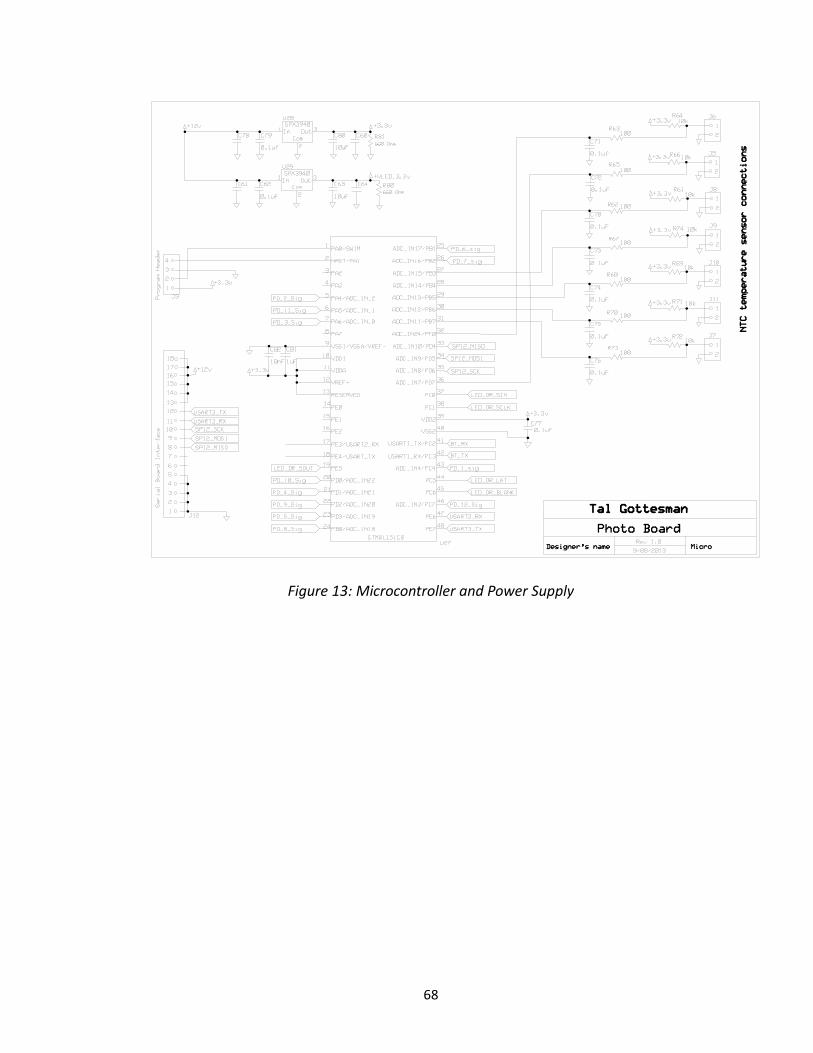
68
Figure 13: Microcontroller and Power Supply

69
Figure 14: LED Driver
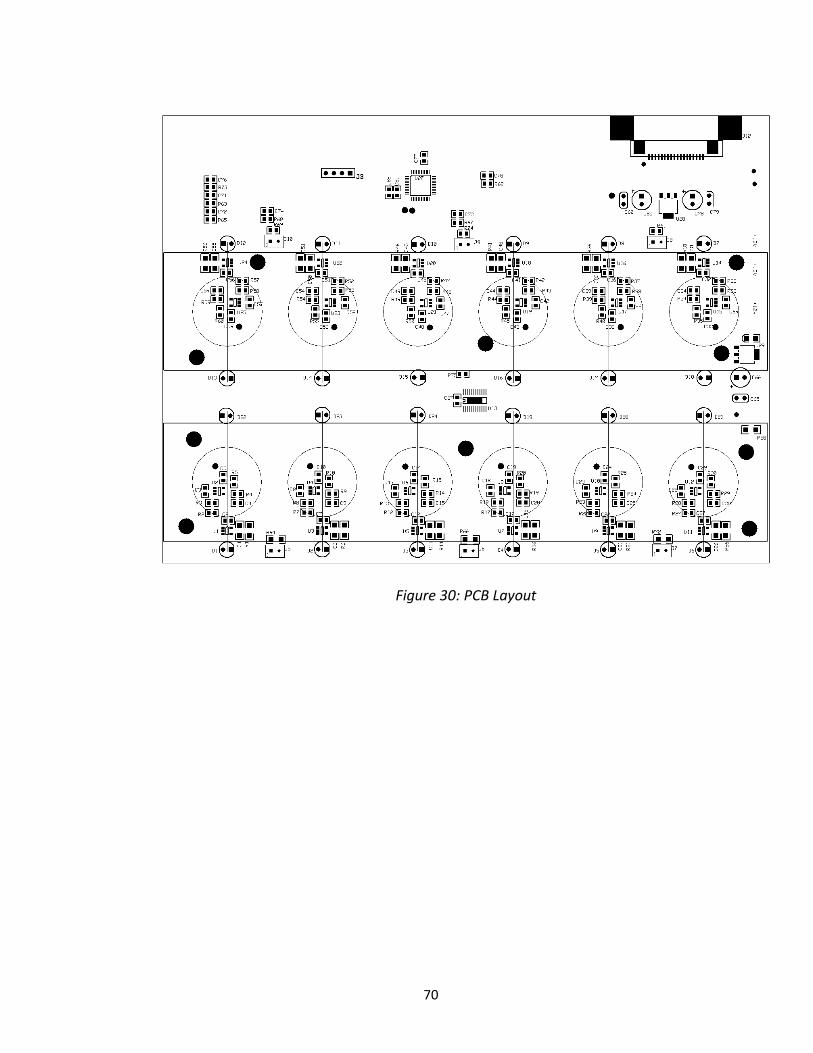
70
Figure 30: PCB Layout

71
10.4 Appendix D: SEEDED BLOOD CULTURE EVALUATION
10.4.1 PRINCIPLE
Currently many inspection/accreditation agencies require that prior to the routine
use of a new culture method, the new test procedure should be evaluated
against results from a reference method. This document outlines a simple
procedure for evaluating the performance of a new method, allowing the
evaluation to be performed with seeded suspensions versus patient specimens.
10.4.2 SPECIMEN
Normal, sterile saline containing an organism suspension of 10-100 CFU.
10.4.3 MATERIALS
1. Prepared vials of Experimental Aerobic Culture Medium with Sensor
2. Experimental Blood Culture Instrument
3. Reference blood culture medium expected Times to Detection
4. Test tubes of Normal, sterile saline - of sufficient size (to fit turbidity meter)
5. Test tubes of Normal, sterile saline - 10 mL
6. Plated Media Products appropriate for the organism: TSA with 5% sheep
blood, Chocolate Agar, Sabouraud Dextrose Agar
7. 70% isopropyl alcohol pads
8. Sterile 1 mL pipettes for tube dilutions
9. Sterile 1 mL syringes for vial inoculation
10. Subculturing, staining, and identification supplies

72
11. Turbidity Meter to measure a 1.0 McFarland Standard
12. Sterile swabs
13. Organisms for testing. Examples of ATCC strains of common clinical
isoisolates
Recommended Strains Are:
E. coli ATCC 25922
S. aureus ATCC 25923
K. pneumoniae ATCC 33495
10.4.4 PROCEDURE
IMPORTANT NOTE: Please be sure to follow Good Laboratory Practices
and Universal Precautions at all times during the test procedure. All
materials should be disposed of properly as required by your institution.
For most bacterial strains*, a McFarland 1.0 Turbibity Standard is equivalent to
~3 x 10⁸
CFU(colony forming unit)/mL. Therefore, for most bacteria, a dilution of 106 (or
three 1:100 dilutions) should result in a CFU of ~ 3 x 10² or ~3 x 10 CFU/0.1 mL
inoculum (30 CFU).

73
1. Grow each organism to be tested overnight on the appropriate plated
medium. Carefully examine and check each organism for purity. If there is
a contaminant or the colonies have an unusual appearance, perform a
Gram stain and/or identification to confirm the identity. If questions remain,
do not use that organism at that time. Re-culture and repeat culture.
*NOTE: These dilutions are a guide and may need to be changed depending
on the organism used to obtain the 10 to 100 CFU inoculum range. In the
event that the colony count is below 10 or above 100, the experiment
should be repeated with an appropriately adjusted dilution.
2. Add 10 mL of Normal saline to 4 test tubes labeled “A”, #1, #2 and #3.
Note the organism name to be tested on each tube. Additional tubes
should be labeled for each organism to be tested as indicated above.
3. Begin with the test tube labeled “A”. Take a sterile swab and touch a few
well isolated colonies. Place the swab into the tube of saline and swirl.
With the colonies added, the turbidity meter should measure
approximately 1.0 McFarland units. If the meter does not read in this area,
either: a) add more colonies if the reading is < 1.0; or b) dilute with sterile
saline if the reading is > 1.0 to achieve the target 1.0 McFarland reading.

74
4. For a 106 dilution, add 0.1 mL of the standardized McFarland 1 organism
suspension to the test tube labeled #1. Mix well.
5. For a 104 dilution, add 0.1 mL of the test tube #1 organism suspension to
the test tube labeled #2. Mix well.
6. For a 102 dilution, add 0.1 mL of the test tube #2 organism suspension to
the test labeled #3. Mix well. Tube #3 will be the inoculum used for the test
and reference blood culture vials.
7. Plate Count - Prepare an agar plate of the final inoculum using the agar
medium appropriate for each organism. Take 0.1 mL inoculum of tube #3
and inoculate the plate. Use the “spread plate” or similar sterile technique
to evenly distribute the inoculum.
8. Wipe the tops of the vials with a 70% isopropyl alcohol pad. Label the test
and reference blood culture vials with the organism‟s name. Inoculate
each test and reference blood culture vial (duplicate or triplicate if desired)
with 0.1 mL of tube #3 of that organism.
9. Incubate the inoculated test in the instrument under test, and initiate a test
protocol, facilitating the gathering of data, and the application of detection
algorithms. Independently incubate the plate count media at 35oC.
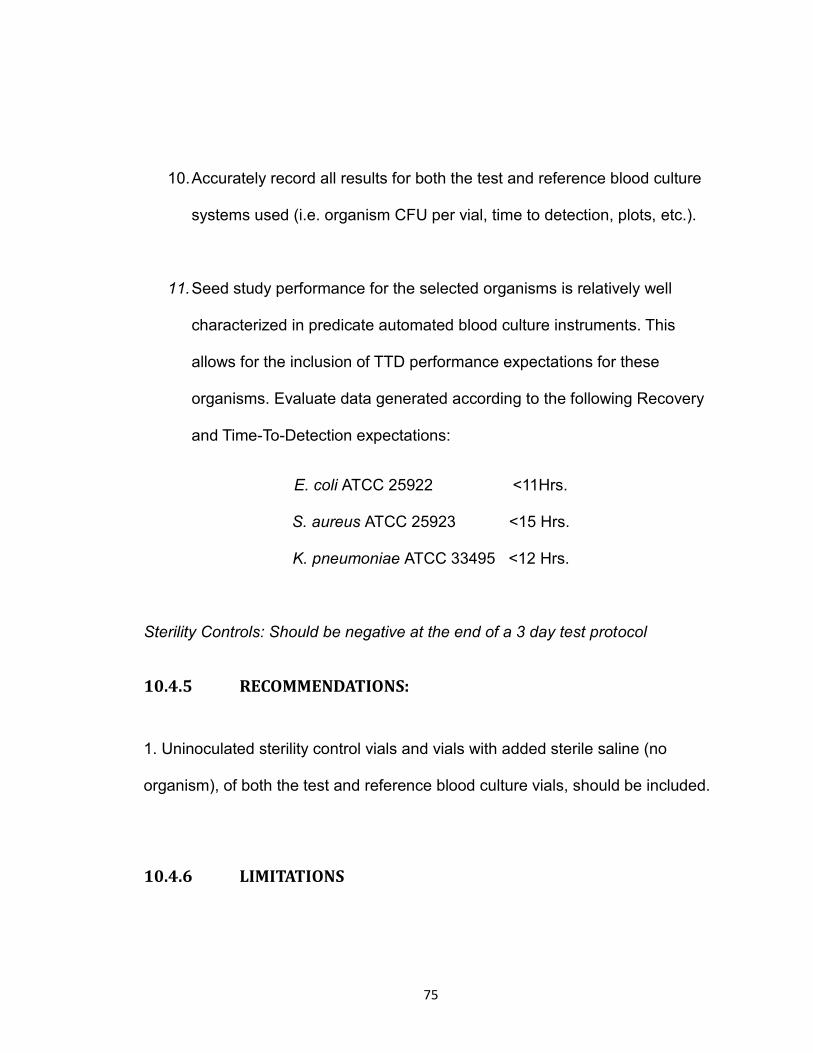
75
10. Accurately record all results for both the test and reference blood culture
systems used (i.e. organism CFU per vial, time to detection, plots, etc.).
11. Seed study performance for the selected organisms is relatively well
characterized in predicate automated blood culture instruments. This
allows for the inclusion of TTD performance expectations for these
organisms. Evaluate data generated according to the following Recovery
and Time-To-Detection expectations:
E. coli ATCC 25922 <11Hrs.
S. aureus ATCC 25923 <15 Hrs.
K. pneumoniae ATCC 33495 <12 Hrs.
Sterility Controls: Should be negative at the end of a 3 day test protocol
10.4.5 RECOMMENDATIONS:
1. Uninoculated sterility control vials and vials with added sterile saline (no
organism), of both the test and reference blood culture vials, should be included.
10.4.6 LIMITATIONS

76
Care must be taken to prevent contamination of the vials during inoculation with
the organism suspension. In the event that the colony count is below 10 or above
100, the experiment should be repeated with an appropriately adjusted dilution.
10.4.7 REFERENCES
Seeded Blood Culture Evaluation. Document MA-0100. Becton Dickinson
Microbiology Systems

77
10.5 Appendix E: Simplified Bacterial Detection Protocol to Evaluate
Efficacy of a Low Cost Blood Culture Machine
10.5.1 Purpose
As described in the original thesis project proposal, a low cost automated blood
culture system would be developed and evaluated in a clinical microbiology
laboratory. Seed cultures of known organisms (from the American Type Culture
Collection) would be inoculated into sample tubes, with standardized
concentrations. Time to Detection (TTD) for the seed cultures would be
compared against the published TTD for commercially available units. This is the
preferred scenario for the evaluation phase of the project because it allows for
the direct comparison of the efficacy of the newly developed machine to the
industry standard.
In the absence of access to a suitable clinical microbiology laboratory however, I
propose using a traditional expedient bacterial culture method to evaluate the
performance of the low cost blood culture machine instead. This document
describes a simple protocol to establish the ability to incubate, grow, and detect
viable bacteria from a cheek swab. Both methods are suitable for the evaluation
of the low cost blood culture machine, but while the expedient method
demonstrates the capabilities of the machine it does not allow for the quantitative
comparison to commercial unit‟s TTD for a standardized seed culture.
78
10.5.2 Overview
Of the most common bacteria found in the mouth, Streptococcus mutans is the
most numerous, and is a robust grower. The organism is facultatively anaerobic
(meaning it will produce ATP by aerobic respiration if oxygen is present). It will
therefore grow equally well in aerobic and anaerobic growth medium.
Given the robust growth characteristics of the organism and it's abundance in the
human mouth, an aerobic culture from a cheek swab can be assumed to be
dominated by Streptococcus mutans. This can be confirmed by identification
later if necessary. This procedure will collect, standardize, and inoculate
organisms into test specimens, to evaluate recovery and TTD for the automated
blood culture system.
10.5.3 Materials
1 Set of 4 Prepared Barium Sulfate McFarland Standard tubes 0.5,1,2,4 (Fisher
Scientific)
1 Wickerham Reference Card
1 Tube of prepared bacterial broth growth medium (TSB)
3 Tubes of 10ml sterile saline solution
1 Sterile swab suitable for specimen collection
1 Sterile transfer pipette
6 test target Automated Blood Culture Sensor tubes (with medium)

79
10.5.4 Procedure
1. Introduce the sterile swab into the mouth of the donor between the
cheek and gum, spinning several times to facilitate saturation of the
swab.
2. Remove the swab, and introduce the swab into a tube of prepared
bacterial broth growth medium (TSB). Carefully agitate the swab
several times, to ensure transfer of the swab contents into the broth
medium.
3. Cap, and incubate the bacterial growth medium at a temperature
between 35 and 37 degrees C for a minimum of 24 hours.
4. Observe the broth medium for indications of bacterial growth. (The
tube should be cloudy and heavily laden with bacteria.)
5. Transfer 50ul of the bacteria laden broth suspension into a sterile
saline tube.
6. Compare the turbidity of the saline tube to the turbidity of the 0.5
McFarland Barium Sulfate reference tube by observing the lines on
the Wickerham Card for both tubes through the liquid column.
7. Continue to add bacteria laden broth in 50ul increments to the
saline tube, until the turbidity of the saline tube matches the
turbidity of the 0.5 McFarland reference tube when observed with
the Wickerham Card.
80
8. When a turbidity level of 0.5 McFarland is achieved, the saline
bacterial suspension will contain approximately 1.5X10^8 CFU/mL.
CFU (colony forming unit) is a standard measure of bacterial
density. For the purposes of this protocol, 1 CFU can be considered
equivalent to a single organism. Label as tube A.
9. Transfer 1ml of the contents of tube A into a second sterile saline
tube. Label this as Tube B.
10. Label the final unopened sterile saline tube as tube C.
11. Inoculate 50 uL of the contents of Tube A, into two Automated
Blood Culture sample tubes. Label these tubes Test A.
12. Inoculated 50 uL of the contents of Tube B, into two Automated
Blood Culture sample tubes. Label these tubes Test B.
13. Inoculate 50 uL of the contents of Tube C, into two Automated
Blood Culture sample tubes. Label these tubes Test C.
14. Enter the 6 Automated Blood Culture sample tubes labeled A, B,
and C into the blood culture machine, and initiate the automated
testing sequence.
15. Collect data at the predefined interval for a period of 72 hours.
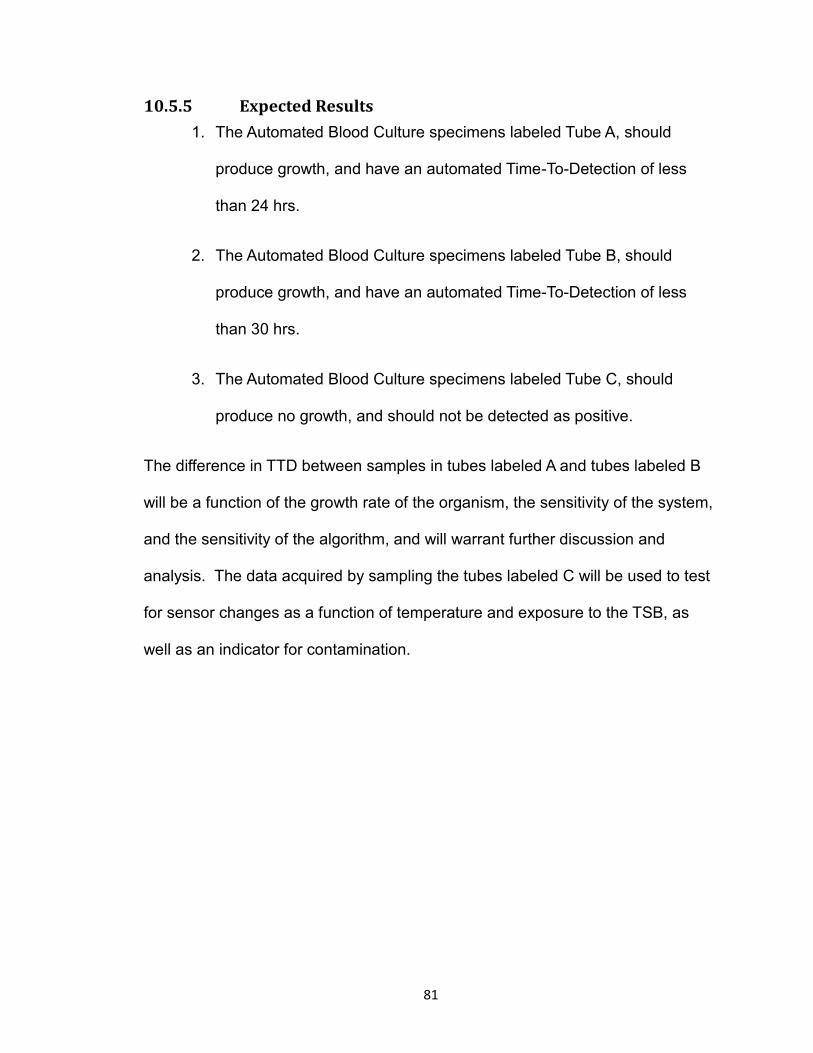
81
10.5.5 Expected Results
1. The Automated Blood Culture specimens labeled Tube A, should
produce growth, and have an automated Time-To-Detection of less
than 24 hrs.
2. The Automated Blood Culture specimens labeled Tube B, should
produce growth, and have an automated Time-To-Detection of less
than 30 hrs.
3. The Automated Blood Culture specimens labeled Tube C, should
produce no growth, and should not be detected as positive.
The difference in TTD between samples in tubes labeled A and tubes labeled B
will be a function of the growth rate of the organism, the sensitivity of the system,
and the sensitivity of the algorithm, and will warrant further discussion and
analysis. The data acquired by sampling the tubes labeled C will be used to test
for sensor changes as a function of temperature and exposure to the TSB, as
well as an indicator for contamination.

82
10.6 Appendix F: Costed Bill of Materials
10.6.1 Electrical BOM
Component Value Designator QuantityPrice Totals Part Number Manufacturer Distributor
Capicator 10pF
C1, C6, C11, C16, C21, C26, C31, C35, C40,
C45, C50, C55 12 0.05 0.58 CL21C100JBANNNC Samsng Digikey
Capicator 0.1uF
C2, C5, C7, C10, C12, C14, C17, C19, C22, C24,
C27, C29, C32, C33, C36, C41, C43, C46, C48,
C51, C53, C56, C58, C62, C67, C70, C71, C72,
C73, C74, C75, C76, C77, C79 34 0.05 1.67 C0805C104K5RACTU KEMET Digikey
Capicator 110nF C3 1 0.47 0.47 C0402C112J5GAC7867 KEMET Digikey
Capicator 10uF
C4, C9, C15, C20, C25, C30, C34, C39, C44,
C49, C54, C59, C63, C80 14 0.11 1.57 CC0805ZKY5V6BB106 Yageo Digikey
Capicator 100nF
C8, C13, C18, C23, C28, C37, C42, C47, C52,
C57, C69 11 0.05 0.54 C0805C104K5RACTU KEMET Digikey
Capicator DNP C60 1 0.00 0.00
Capicator DNP C61 1 0.00 0.00
Capicator DNP C64 1 0.00 0.00
Capicator DNP C65 1 0.00 0.00
Capicator DNP C66 1 0.00 0.00
Capicator DNP C78 1 0.00 0.00
Capicator 1uF C81 1 0.00
Capicator 10nF C82 1 0.00
Photodiode
D1, D2, D3, D4, D5, D6, D7, D8, D9, D10, D11,
D12 12 0.39 4.68 PD3333-3C Everlight ElectronicsDigikey
LED
D13, D14, D15, D16, D17, D18, D19, D20, D21,
D22, D23, D24 12 0.15 1.80 C503B-AAS-CY0B0251 Cree Inc Digikey
Footprint J3 1 0.00 0.00
Footprint J5 1 0.00 0.00
Footprint J6 1 0.00 0.00
Footprint J7 1 0.00 0.00
Footprint J8 1 0.00 0.00
Footprint J9 1 0.00 0.00
Footprint J10 1 0.00 0.00
Footprint J11 1 0.00 0.00
Ribbon Cable Connector18 PositionJ12, J13 2 1.16 2.32 A100253CT-ND TE ConnectivityDigikey
Resistor 15M
R1, R6, R11, R16, R21, R26, R31, R36, R41,
R46, R51, R56, 12 2.03 24.41 CRHV1206AF20M0FKE5 Vishay Dale Digikey
Resistor 100k R2 1 0.04 0.04 RMCF0805FT100K Stackpole ElectronicsDigikey
Resistor 7.68k R3 1 0.10 0.10 RC0805FR-077K68L Yageo Digikey
Resistor 2.49k
R4, R9, R14, R19, R24, R29, R34, R39, R44,
R49, R54, R59 12 0.02 0.24 RC0805FR-072K49L Yageo Digikey
Resistor 22.6k R5 1 0.10 0.10 RC0805FR-0722K6L Yageo Digikey
Resistor 512k R7, R12 2 0.10 0.20 RC0805FR-07511KL Yageo Digikey
Resistor 249k
R10, R15, R20, R25, R30, R35, R40, R45, R50,
R55, R60 11 0.02 0.23 RC0805FR-07249KL Yageo Digikey
Resistor 27.4
R8, R13, R18, R23, R28, R33, R38, R43, R48,
R53 9 0.10 0.90 ERJ-3EKF274RV Panasonic Digikey
Resistor 512k R17, R22, R27, R32, R37, R42, R47, R52, R57 9 0.02 0.19 RC0805FR-07512KL Yageo Digikey
Resistor 10k R61, R64, R66, R69, R71, R72, R98 7 0.10 0.70 RC0805FR-0710KL Yageo Digikey
Resistor 100 R62, R63, R65, R67, R68, R70, R73 7 0.00 RC0805FR-07100RL Yageo Digikey
Resistor 2.20k R75 1 0.10 0.10 RC0805FR-072K2L Yageo Digikey
Resistor 660 R80, R81 2 0.00 RC0805FR-07660RL Yageo Digikey
Op-Amp MCP6421
U1, U2, U3, U4, U5, U6, U7, U8, U9, U10, U11,
U12, U14, U15, U16, U17, U18, U19, U20, U21,
U22, U23, U24, U25 24 0.40 9.60 MCP6421 Microchip Microchip
LED Driver TLC5929U13 1 1.69 1.69 TLC5929 Texas InstrumentsDigikey
Microcontroller U27 1 3.42 3.42 STM8L151C8 ST Micro Digikey
LDO U28, U29 2 1.77 3.54 SPX3940 Exar Digikey
Sensor PCB Sensor PCBSensor Board 1 15.35 15.35 PCB Express PCB Express
Breakout PCB Breakout PCBBreakout Board 1 8.51 8.51 PCB Express PCB Express
Flex Cable 18 position 1 4.58 4.58 WM10058-ND Molex Digikey
Serial Level Shifter Max 233 1 6.80 6.80 MAX233EPP+G36 Maxim IntegratedDigikey
Electronics Total 94.32
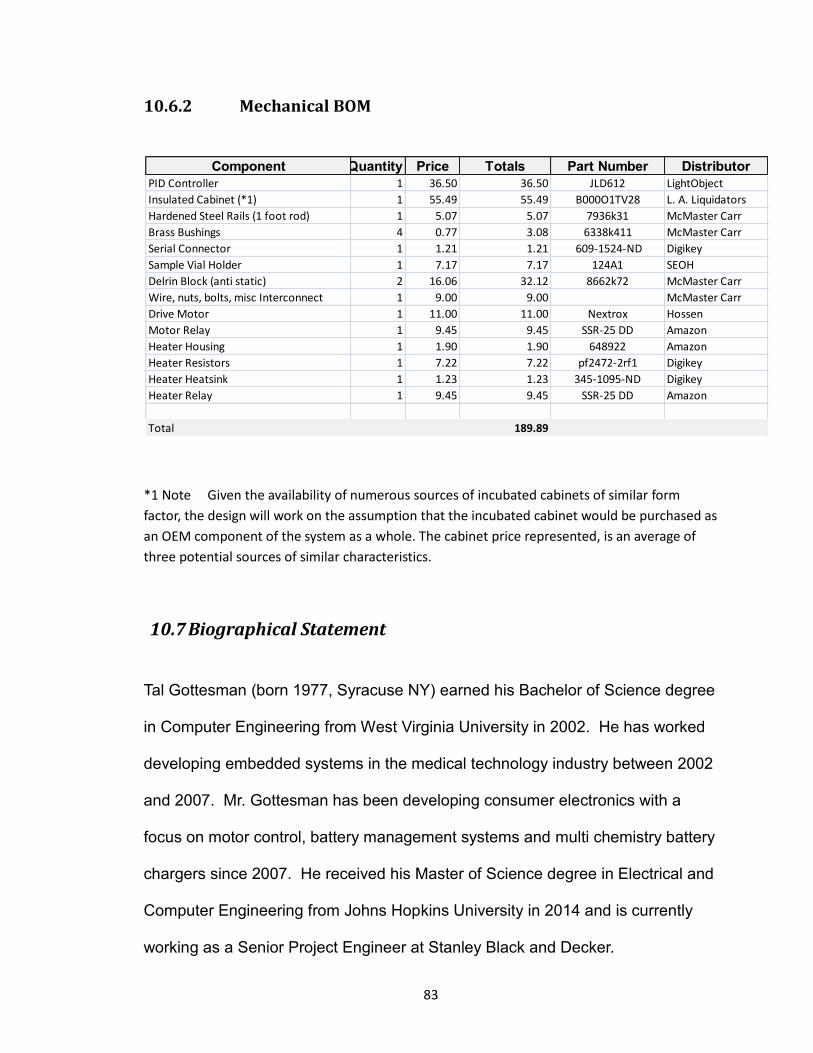
83
10.6.2 Mechanical BOM
*1 Note Given the availability of numerous sources of incubated cabinets of similar form
factor, the design will work on the assumption that the incubated cabinet would be purchased as
an OEM component of the system as a whole. The cabinet price represented, is an average of
three potential sources of similar characteristics.
10.7 Biographical Statement
Tal Gottesman (born 1977, Syracuse NY) earned his Bachelor of Science degree
in Computer Engineering from West Virginia University in 2002. He has worked
developing embedded systems in the medical technology industry between 2002
and 2007. Mr. Gottesman has been developing consumer electronics with a
focus on motor control, battery management systems and multi chemistry battery
chargers since 2007. He received his Master of Science degree in Electrical and
Computer Engineering from Johns Hopkins University in 2014 and is currently
working as a Senior Project Engineer at Stanley Black and Decker.
Component Quantity Price Totals Part Number Distributor
PID Controller 1 36.50 36.50 JLD612 LightObject
Insulated Cabinet (*1) 1 55.49 55.49 B000O1TV28 L. A. Liquidators
Hardened Steel Rails (1 foot rod) 1 5.07 5.07 7936k31 McMaster Carr
Brass Bushings 4 0.77 3.08 6338k411 McMaster Carr
Serial Connector 1 1.21 1.21 609-1524-ND Digikey
Sample Vial Holder 1 7.17 7.17 124A1 SEOH
Delrin Block (anti static) 2 16.06 32.12 8662k72 McMaster Carr
Wire, nuts, bolts, misc Interconnect 1 9.00 9.00 McMaster Carr
Drive Motor 1 11.00 11.00 Nextrox Hossen
Motor Relay 1 9.45 9.45 SSR-25 DD Amazon
Heater Housing 1 1.90 1.90 648922 Amazon
Heater Resistors 1 7.22 7.22 pf2472-2rf1 Digikey
Heater Heatsink 1 1.23 1.23 345-1095-ND Digikey
Heater Relay 1 9.45 9.45 SSR-25 DD Amazon
Total 189.89