
Low carbon economy
24
I N S T I T U T O P A R A L A D I V E RS I F I C A C I ÓN Y A H O R R O D E L A E N E R G ÍA 1 TOWARDS A LOW CARBON ECONOMY: RENEWABLES AND ENERGY EFFICIENCY IN SPAIN Sofía Martínez Institute for Diversification and Saving of Energy, IDAE (Ministry of Industry, Tourism and Trade) Beyond Copenhagen: Climate Beyond Copenhagen: Climate Change and Renewable Energies in Change and Renewable Energies in Asia and Europe Asia and Europe China Europe International Business School China Europe International Business School Shanghai, 28 Shanghai, 28 th th July 2010 July 2010
-
Upload
eoi-escuela-de-organizacion-industrial -
Category
Documents
-
view
829 -
download
0
Transcript of Low carbon economy

I N S T I T U T O P A R A L A D I V E R S I F I C A C I Ó N Y A H O R R O D E L A E N E R G Í A
1
TOWARDS A LOW CARBON ECONOMY: RENEWABLES AND ENERGY EFFICIENCY IN SPAIN
Sofía MartínezInstitute for Diversification and Saving of Energy, IDAE(Ministry of Industry, Tourism and Trade)
Beyond Copenhagen: Climate Beyond Copenhagen: Climate
Change and Renewable Energies in Change and Renewable Energies in
Asia and EuropeAsia and Europe
China Europe International Business School China Europe International Business School
Shanghai, 28Shanghai, 28thth July 2010July 2010

I N S T I T U T O P A R A L A D I V E R S I F I C A C I Ó N Y A H O R R O D E L A E N E R G Í A
2
WHAT IS IDAE? MISSION
� Promote energy efficiency and
Rational Use of Energy in Spain
� Promote diversification of
energy sources and increasing
use of renewable energy
sources (RES)
� Foster these activities through
technical consultancy and
implementation of innovative
projects
� The Institute for Diversification and Saving of Energy is a public
business entity, reporting to the
Ministry of Industry, Tourism &
Trade through the Secretary of
State for Energy
I N S T I T U T O P A R A L A D I V E R S I F I C A C I Ó N Y A H O R R O D E L A E N E R G Í A
3
ENERGY AND RENEWABLE ENERGY IN SPAINENERGY AND RENEWABLE ENERGY IN SPAIN
I N S T I T U T O P A R A L A D I V E R S I F I C A C I Ó N Y A H O R R O D E L A E N E R G Í A
4
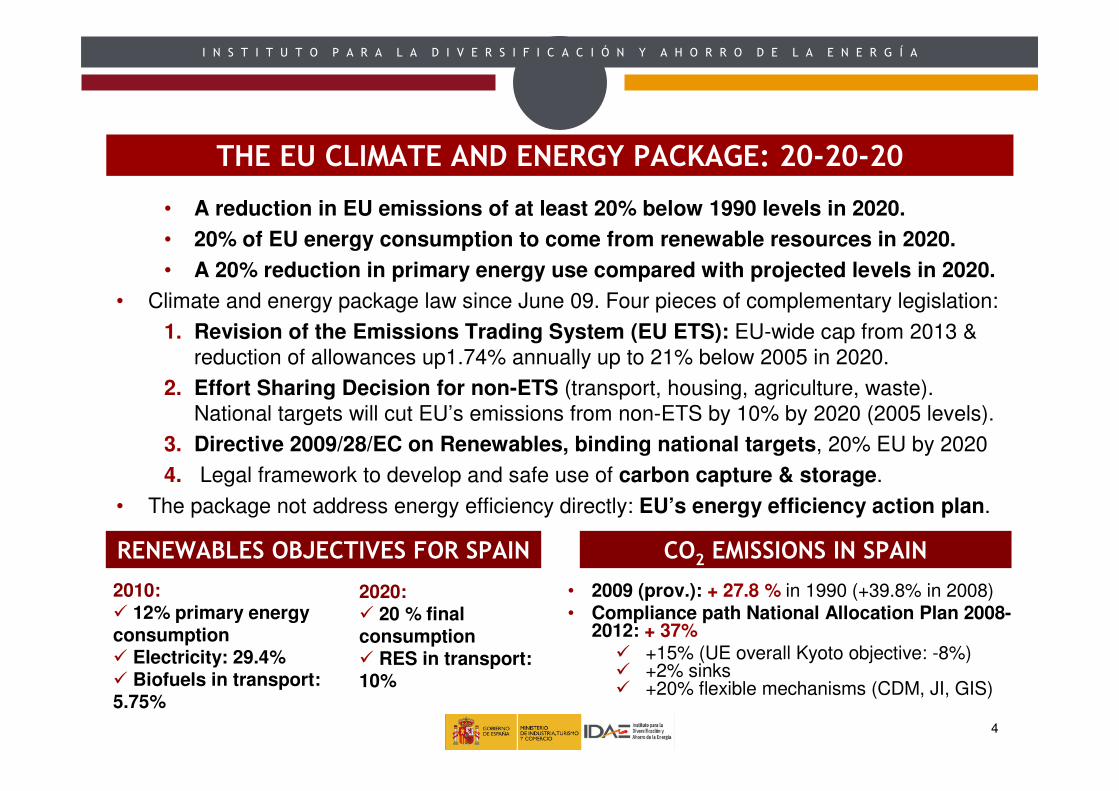
THE EU CLIMATE AND ENERGY PACKAGE: 20-20-20
• A reduction in EU emissions of at least 20% below 1990 levels in 2020.
• 20% of EU energy consumption to come from renewable resources in 2020.
• A 20% reduction in primary energy use compared with projected levels in 2020.
• Climate and energy package law since June 09. Four pieces of complementary legislation:
1. Revision of the Emissions Trading System (EU ETS): EU-wide cap from 2013 &
reduction of allowances up1.74% annually up to 21% below 2005 in 2020.
2. Effort Sharing Decision for non-ETS (transport, housing, agriculture, waste).
National targets will cut EU’s emissions from non-ETS by 10% by 2020 (2005 levels).
3. Directive 2009/28/EC on Renewables, binding national targets, 20% EU by 2020
4. Legal framework to develop and safe use of carbon capture & storage.
• The package not address energy efficiency directly: EU’s energy efficiency action plan.
CO2 EMISSIONS IN SPAIN
• 2009 (prov.): + 27.8 % in 1990 (+39.8% in 2008)• Compliance path National Allocation Plan 2008-
2012: + 37%� +15% (UE overall Kyoto objective: -8%)� +2% sinks� +20% flexible mechanisms (CDM, JI, GIS)
2020:� 20 % final consumption� RES in transport: 10%
2010:� 12% primary energy consumption� Electricity: 29.4%� Biofuels in transport: 5.75%
RENEWABLES OBJECTIVES FOR SPAIN

I N S T I T U T O P A R A L A D I V E R S I F I C A C I Ó N Y A H O R R O D E L A E N E R G Í A
5
Total Consumption 2009: 130.6 Mtoe (-8.2 %)(In 2008: 142.2 Mtoe)
Renewables Consumption: 12.2 Mtoe (+12.4 %)(In 2008: 10.9 Mtoe)
RES contribution: 9.3 %(In 2008: 7.6 %)
Hydro1.7 %
Wind2.4 %
Biomass & waste3.8 %
Other1.4 %
Electric Power Exports-0.5 %
Nuclear10.5 %
Coal 8.1 %
Oil48.8 %
RENEWABLES9.3 %
Natural gas23.8 %
Hydro1.7 %
Wind2.4 %
Biomass & waste3.8 %
Other1.4 %
Electric Power Exports-0.5 %
Nuclear10.5 %
Coal 8.1 %
Oil48.8 %
RENEWABLES9.3 %
Natural gas23.8 %
Energy intensity reduction (09/08): 4.8 %
2.6 % annual(14.6 % accumulated)
2004-2009
PRIMARY ENERGY CONSUMPTION IN 2009
• High external energy dependency (80% primary energy)• Consolidated tendency & decoupling economy-energy:
• Energy consumption reduction: - 8,2%•GDP: - 3,6%
• Technological changes
PRIMARY ENERGY INTENSITY IN 2009

I N S T I T U T O P A R A L A D I V E R S I F I C A C I Ó N Y A H O R R O D E L A E N E R G Í A
6
RES CONTRIBUTION TO ELECTRICITY PRODUCTION in 2009
Coal 12.61%Nuclear 17.78%
PV 2.04%
Natural Gas 37.23%
Biomass 1.28%
Pumping 0.95%Oil 6.87%
CSP 0.03%
RENEWABLES24.6%
Hydro 8.85%
Wind 12.35%
RES production: 72.8 TWh(Total: 296.5 TWh)

I N S T I T U T O P A R A L A D I V E R S I F I C A C I Ó N Y A H O R R O D E L A E N E R G Í A
7
RENEWABLES PROMOTION IN SPAIN
• Law 82/1980 on energy conservation was the start of developing renewables in Spain.
Comprehensive legislation has achieved a regulatory framework that has promoted
development through stability.
• Electricity Sector Law 54/1997: 12% primary energy using renewables by 2010.
• Spain has become world leader in renewables (production, promotion and industry)
over the last decade, especially since 2005 with the New Renewable Energies Plan
2005- 2010 and an Action Plan to improve energy efficiency.
• Feed-in tariff system has been chosen to support renewable electricity: either a fixed
tariff (which differs from technologies) or a premium paid on top of the market price for
installations that opt to sell their electricity on the market.
� Appropriate planning, including infrastructures
� Stability of support systems
� Innovative and mature technology & industry
� Integration of renewables in the grid:
Renewable Energy Control Centre
In agreement In agreement
with EU with EU
policypolicy
Sustainability & environmental
targets
Security of supply &
internal market
Competitiveness
In agreement In agreement
with EU with EU
policypolicy
Sustainability & environmental
targets
Security of supply &
internal market
Competitiveness
I N S T I T U T O P A R A L A D I V E R S I F I C A C I Ó N Y A H O R R O D E L A E N E R G Í A
8
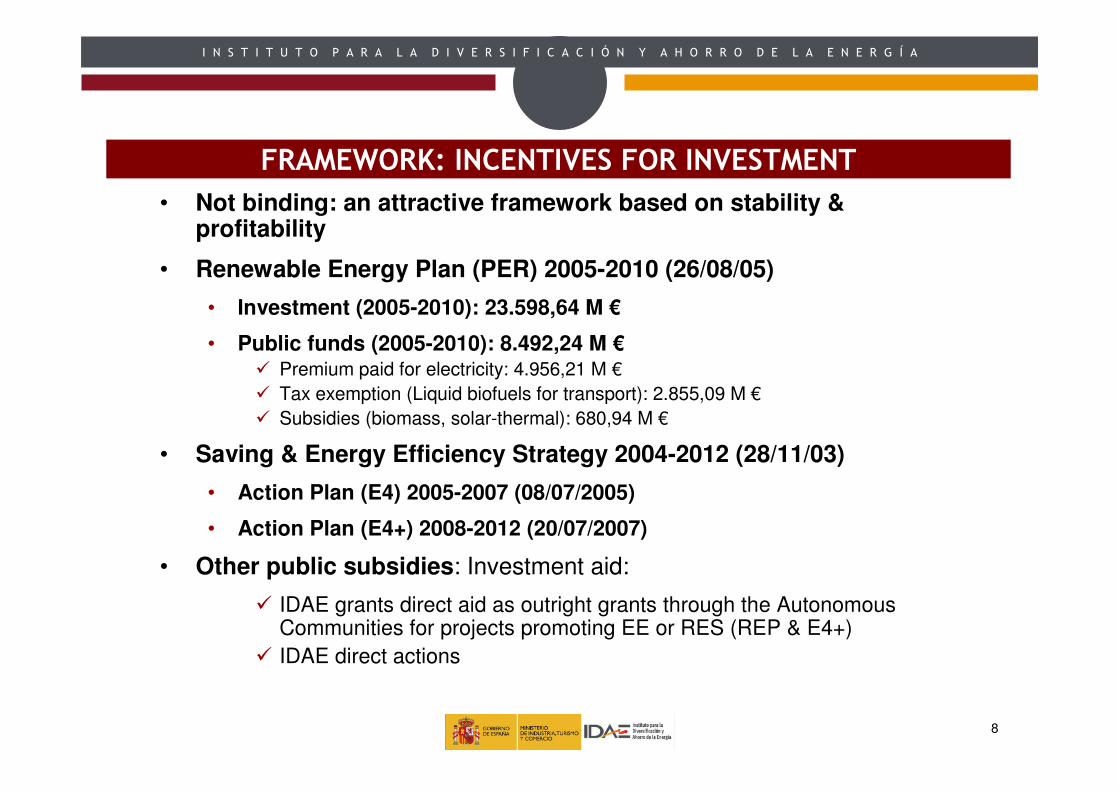
FRAMEWORK: INCENTIVES FOR INVESTMENT
• Not binding: an attractive framework based on stability & profitability
• Renewable Energy Plan (PER) 2005-2010 (26/08/05)
• Investment (2005-2010): 23.598,64 M €
• Public funds (2005-2010): 8.492,24 M €� Premium paid for electricity: 4.956,21 M €
� Tax exemption (Liquid biofuels for transport): 2.855,09 M €
� Subsidies (biomass, solar-thermal): 680,94 M €
• Saving & Energy Efficiency Strategy 2004-2012 (28/11/03)
• Action Plan (E4) 2005-2007 (08/07/2005)
• Action Plan (E4+) 2008-2012 (20/07/2007)
• Other public subsidies: Investment aid:
� IDAE grants direct aid as outright grants through the AutonomousCommunities for projects promoting EE or RES (REP & E4+)
� IDAE direct actions

I N S T I T U T O P A R A L A D I V E R S I F I C A C I Ó N Y A H O R R O D E L A E N E R G Í A
9
RES ELECTRICITYAccumulated power (MW)
Installed annual Power (MW)
41.981 MW
0
5.000
10.000
15.000
20.000
25.000
30.000
35.000
40.000
45.000
19901991199219931994199519961997199819992000200120022003200420052006200720082009
0
890
1.780
2.670
3.560
4.450
5.340
6.230
7.120
8.010
REP23.420 MW
Installed annual power (MWth)
Accumulated power (MWth)
20.000
20.500
21.000
21.500
22.000
22.500
23.000
23.500
24.000
1996 1997 1998 1999 2000 2001 2002 2003 2004 2005 2006 2007 2008 20090
150
300
450
600
750
900
1.050
1.200
REP
RES THERMAL
• Spain in UE (installed capacity)
• 1st in thermoelectric; 2nd in wind and PV; 3rd in mini-hydro
• Employment: 109.368
• RES grid integration: overcoming planning
hurdles, sharing costs, accessing equipment…
• Renewable Energy Source Control Centre (CECRE), worldwide pioneering initiative to monitor and control RES
• In 2009: 2.700 MWe & 400 MWt
• Significant increases: wind, CSP and
biofuels
• Constant increase: achieving 2010
targets.
• New REP in 2011

I N S T I T U T O P A R A L A D I V E R S I F I C A C I Ó N Y A H O R R O D E L A E N E R G Í A
10
WIND POWER
• Accumulated power: 19.080 MWIncrease (2009/2008): 2.504 MWIncrease 2005-2009: 2.150 MW/year
• Total demand coverage: 15,3%• Challenges: offshore & repowering
Annual power installed (MW)
0
3.000
6.000
9.000
12.000
15.000
18.000
2002 2004 2006 2008
Accumulated
Power (MW)
0
2.000
4.000
6.000
8.000
Annual power installed (MW)
0
3.000
6.000
9.000
12.000
15.000
18.000
2002 2004 2006 2008
Accumulated
Power (MW)
0
2.000
4.000
6.000
8.000
Annual installed power (MW)
Accumulated power (MW)
0
1.000
2.000
3.000
4.000
5.000
6.000
7.000
19981999200020012002200320042005200620072008200920102011201220132014
0
1.000
2.000
3.000
4.000
5.000
6.000
7.000
8.000
9.000
3.500 MW
Annual installed power (MW)
Accumulated power (MW)
0
1.000
2.000
3.000
4.000
5.000
6.000
7.000
19981999200020012002200320042005200620072008200920102011201220132014
0
1.000
2.000
3.000
4.000
5.000
6.000
7.000
8.000
9.000
3.500 MW
SOLAR PV
• World leadership in solar trackers and R&D• Demand coverage: 3 % • Challenges: cost reduction, architectural integration, distributed generation, quality
11 1161
1050
131
350
500
340
632
0
100
200
300
400
500
600
700
2006 2007 2008 2009 2010
MW
Achieved
REP
Forecast
11 1161
1050
131
350
500
340
632
0
100
200
300
400
500
600
700
2006 2007 2008 2009 2010
MW
Achieved
REP
Forecast
CONCENTRATED SOLAR POWER (CSP)
• 11 operating plants (432 MW), 20 in advance construction • 30 national businesses in the sector • Challenges: reduction of technology costs, sustainable trend, operation & integration•April 2011: operation of Gemasolar (Sevilla): first worldwide plant with central tower & molten salt storage (up to 15h).

I N S T I T U T O P A R A L A D I V E R S I F I C A C I Ó N Y A H O R R O D E L A E N E R G Í A
11
1.953.963 m2
Annual surfaceinstalled (m2)
Accumulatedsurface (m2)
0
500.000
1.000.000
1.500.000
2.000.000
2.500.000
1990 1991 1992 1993 1994 1995 1996 1997 1998 1999 2000 2001 2002 2003 2004 2005 2006 2007 2008 2009
)
0
100.000
200.000
300.000
400.000
500.000
600.000
700.000
800.000
900.000
1.000.000
SOLAR THERMAL
• In 2009: +350.000 m2 (construction crisis) • To include house refurbishing and new applications (services, industry)• Employment: > 13.000, 35 manufacturers• Challenge: Specific support schemes
Accumulatedcapacity (ktoe)
Installed annualcapacity (ktoe)
0
500
1.000
1.500
2.000
2.500
3.000
3.500
4.000
2000 2001 2002 2003 2004 2005 2006 2007 2008 2009
0
625
1.250
1.875
2.500
3.125
3.750
4.375
5.000
Accumulatedcapacity (ktoe)
Installed annualcapacity (ktoe)
0
500
1.000
1.500
2.000
2.500
3.000
3.500
4.000
2000 2001 2002 2003 2004 2005 2006 2007 2008 2009
0
625
1.250
1.875
2.500
3.125
3.750
4.375
5.000
• Constant increased production (1.875 ktoe), 50 production plants• Biofuels consumption: 3,5% of petrol & diesel A demand (82% more than in 2008)•Challenges: EU Directives, sustainability/verification, specification/mix
BIOFUELS
OTHER RENEWABLESBIOMASS
•“Pellets”: production x 10 in 3 years (600.000t)
• Growth of ESCOs: domestic installations
• Gasification and cogeneration
• Co-firing: Positives prospects.
MINI-HYDRO
•150 companies: High national technology development
• Future interest in energy storage
GEOTHERMAL; WAVE POWER

I N S T I T U T O P A R A L A D I V E R S I F I C A C I Ó N Y A H O R R O D E L A E N E R G Í A
12
THE NATIONAL RENEWABLE ENERGY PLAN 2011-2020
Evaluation of potential
Analysis of the barriers
Definition of strategy to
overcome barriers
Evaluation of energy objectives
Evaluation of socio-economic
impact
Commits with the goals?
NO
Collaboration with regional governments and stakeholders
Draft version of the RENAP 2020
Negotiation / Social agreement
Is there an agreement?
NO
Approval of the RENAP 2020
Final version of the RENAP 2020YES
YES
Stakeholders
Administrations
I N S T I T U T O P A R A L A D I V E R S I F I C A C I Ó N Y A H O R R O D E L A E N E R G Í A
13
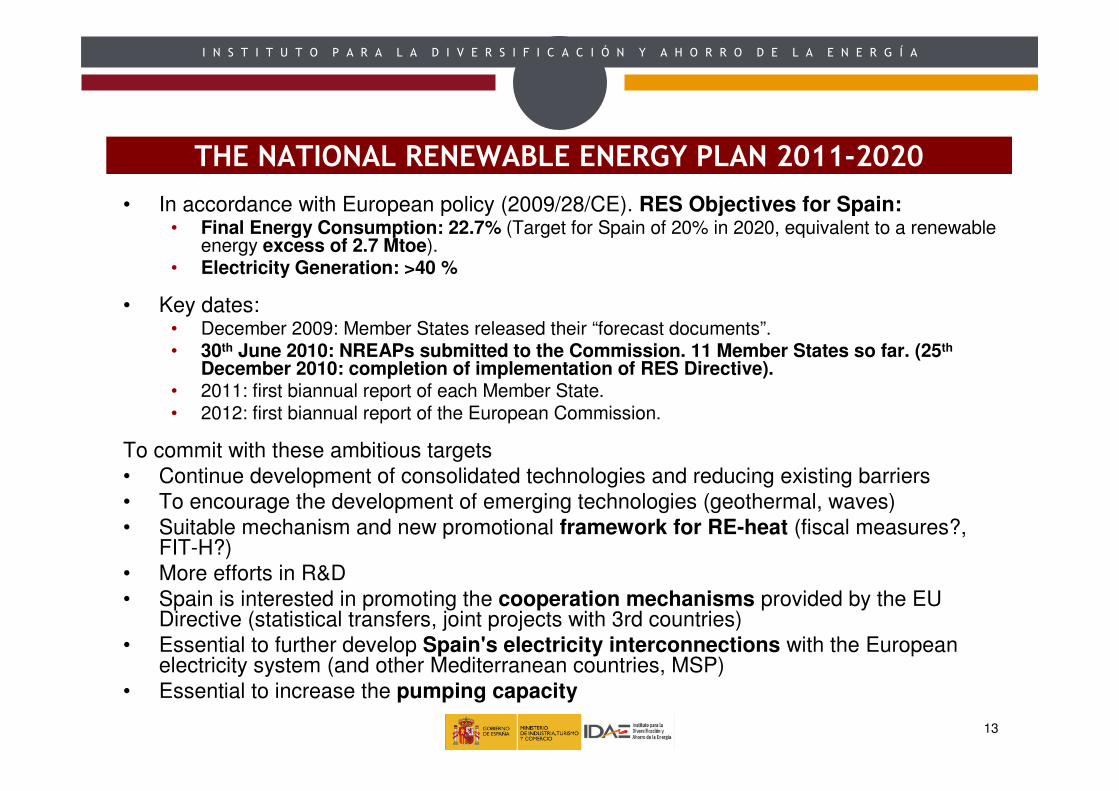
THE NATIONAL RENEWABLE ENERGY PLAN 2011-2020
• In accordance with European policy (2009/28/CE). RES Objectives for Spain: • Final Energy Consumption: 22.7% (Target for Spain of 20% in 2020, equivalent to a renewable
energy excess of 2.7 Mtoe).• Electricity Generation: >40 %
• Key dates:• December 2009: Member States released their “forecast documents”.• 30th June 2010: NREAPs submitted to the Commission. 11 Member States so far. (25th
December 2010: completion of implementation of RES Directive).• 2011: first biannual report of each Member State.• 2012: first biannual report of the European Commission.
To commit with these ambitious targets
• Continue development of consolidated technologies and reducing existing barriers
• To encourage the development of emerging technologies (geothermal, waves)
• Suitable mechanism and new promotional framework for RE-heat (fiscal measures?, FIT-H?)
• More efforts in R&D
• Spain is interested in promoting the cooperation mechanisms provided by the EU Directive (statistical transfers, joint projects with 3rd countries)
• Essential to further develop Spain's electricity interconnections with the European electricity system (and other Mediterranean countries, MSP)
• Essential to increase the pumping capacity

I N S T I T U T O P A R A L A D I V E R S I F I C A C I Ó N Y A H O R R O D E L A E N E R G Í A
14
SPANISH LEGISLATION
• Encourage the use of renewables in construction and urban development
• Regulation on Indoor Heating/Air-conditioning Systems (RITE, RD 1027/2007)
• Basic procedure for the energy certification of newly constructed buildings.
RD 47/2007 (energy efficiency label from the most efficient (A) to the least
efficient (G))
• Technical Building Code (CTE, Royal Decree 314/2006) establishes the
requirements that must be fulfilled by buildings in relation with basic
requirements of safety and habitability established in the Law of Buildings.
• Limit energy demand
• Increase efficiency of heating equipment
• Increase efficiency of lighting equipment
• Introduce solar thermal
• Introduce photovoltaic
• Zone 1: H < 3,8
• Zone 2: 3,8 ≤H<4,2
• Zone 3: 4,2 ≤H< 4,6
• Zone 4: 4,6 ≤H<5,0
• Zone 5: H ≥ 5,0 H in kWh/m2
For each climatic zone and annual consumption a contribution or annual minimum solar contribution is set between 30 % and 70 %.
I N S T I T U T O P A R A L A D I V E R S I F I C A C I Ó N Y A H O R R O D E L A E N E R G Í A
15
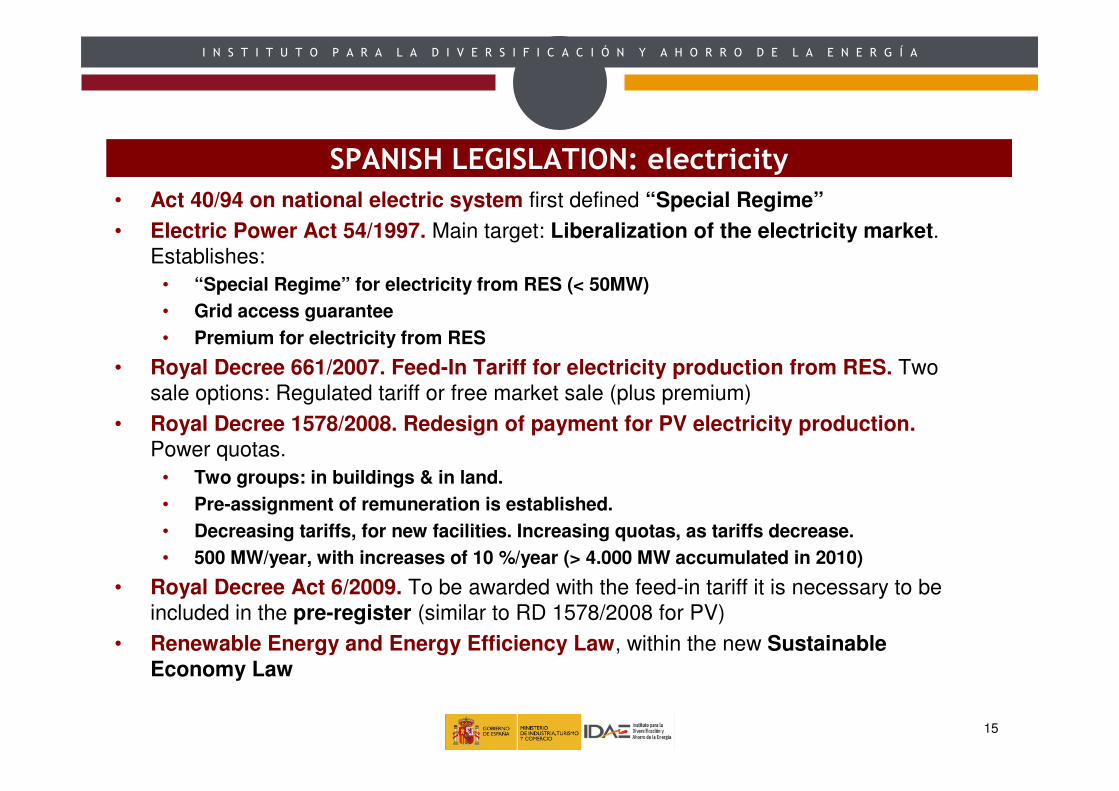
SPANISH LEGISLATION: electricity
• Act 40/94 on national electric system first defined “Special Regime”
• Electric Power Act 54/1997. Main target: Liberalization of the electricity market.
Establishes:
• “Special Regime” for electricity from RES (< 50MW)
• Grid access guarantee
• Premium for electricity from RES
• Royal Decree 661/2007. Feed-In Tariff for electricity production from RES. Two
sale options: Regulated tariff or free market sale (plus premium)
• Royal Decree 1578/2008. Redesign of payment for PV electricity production.
Power quotas.
• Two groups: in buildings & in land.
• Pre-assignment of remuneration is established.
• Decreasing tariffs, for new facilities. Increasing quotas, as tariffs decrease.
• 500 MW/year, with increases of 10 %/year (> 4.000 MW accumulated in 2010)
• Royal Decree Act 6/2009. To be awarded with the feed-in tariff it is necessary to be
included in the pre-register (similar to RD 1578/2008 for PV)
• Renewable Energy and Energy Efficiency Law, within the new Sustainable
Economy Law

I N S T I T U T O P A R A L A D I V E R S I F I C A C I Ó N Y A H O R R O D E L A E N E R G Í A
16
http://www.renovablesmadeinspain.es/
RENEWABLES MADE IN SPAIN
I N S T I T U T O P A R A L A D I V E R S I F I C A C I Ó N Y A H O R R O D E L A E N E R G Í A
17
ENERGY EFFICIENCY IN SPAINENERGY EFFICIENCY IN SPAIN

I N S T I T U T O P A R A L A D I V E R S I F I C A C I Ó N Y A H O R R O D E L A E N E R G Í A
18
SAVING AND ENERGY EFFICIENCY STRATEGY IN SPAIN 2004-2012
• Action Plan 2005-2007 (E4)
• Action Plan 2008-2012 (E4+): aim of saving 24.776 ktoe in 2012 (13.7%) and of
improving the year-on-year energy intensity by 1.8%
43NUMBER OF MEASURES TO BE IMPLEMENTED
238.1 MtCO2AVOIDED EMISSIONS (period)
16LEGISLATIVE ACTIONS TO BE DEVELOPED
2.367 M€PUBLIC AIDS
22.185 M€INVESTMENTS TO PROMOTE
24.776 ktoe (13.7%)PRIMARY ENERGY SAVINGS (2012)
(60.7%)(% on primary energy consumption for the year 2006)
87.933 ktoePRIMARY ENERGY SAVINGS (period)
16.883 ktoe (12.4%)END-USE ENERGY SAVINGS (2012)
(56.2 %)(% on end-use energy for the year 2006)
59.454 ktoeEND-USE ENERGY SAVINGS (period)
ACTION PLAN 2008-2012: GENERAL OBJECTIVES (approved in Council of Ministers on 20.7.2007)

I N S T I T U T O P A R A L A D I V E R S I F I C A C I Ó N Y A H O R R O D E L A E N E R G Í A
19
2008-2011 ACTIVATION PLAN FOR ENERGY EFFICIENCY
• Spain must reduce its GHG emissions in the year 2020 by 10% with respect to the
2005 emissions (non-ETS sectors) Commission Decision 406/2009, April 2009
• The activation plan contains 31 urgent measures to boost saving and energy
efficiency:
• Cutting the country's oil consumption by 10% in 2011 (245 M€)
• Four priority areas: transversal, mobility, buildings, electricity saving
• 17 measures have been completed, 10 have been partially completed or are
under completion (2009). With these 27 measures completed/carried out
savings will be up to 4.632 ktoe (75% of package’s objectives). Some of them:
• Establishing a stable legal and financial framework for ESCOs
• Electric vehicle promotion. Pilot plan for electric cars (MOVELE): 2,000 electric vehicles & 500 recharging points by 2010
• 10% of energy reduction in Government buildings
• 20% of bio-fuels consumption in Government vehicles
• Free low-consumption bulb to all households in 2009
• Efficient driving promotion
• Efficient public lighting promotion
I N S T I T U T O P A R A L A D I V E R S I F I C A C I Ó N Y A H O R R O D E L A E N E R G Í A
20
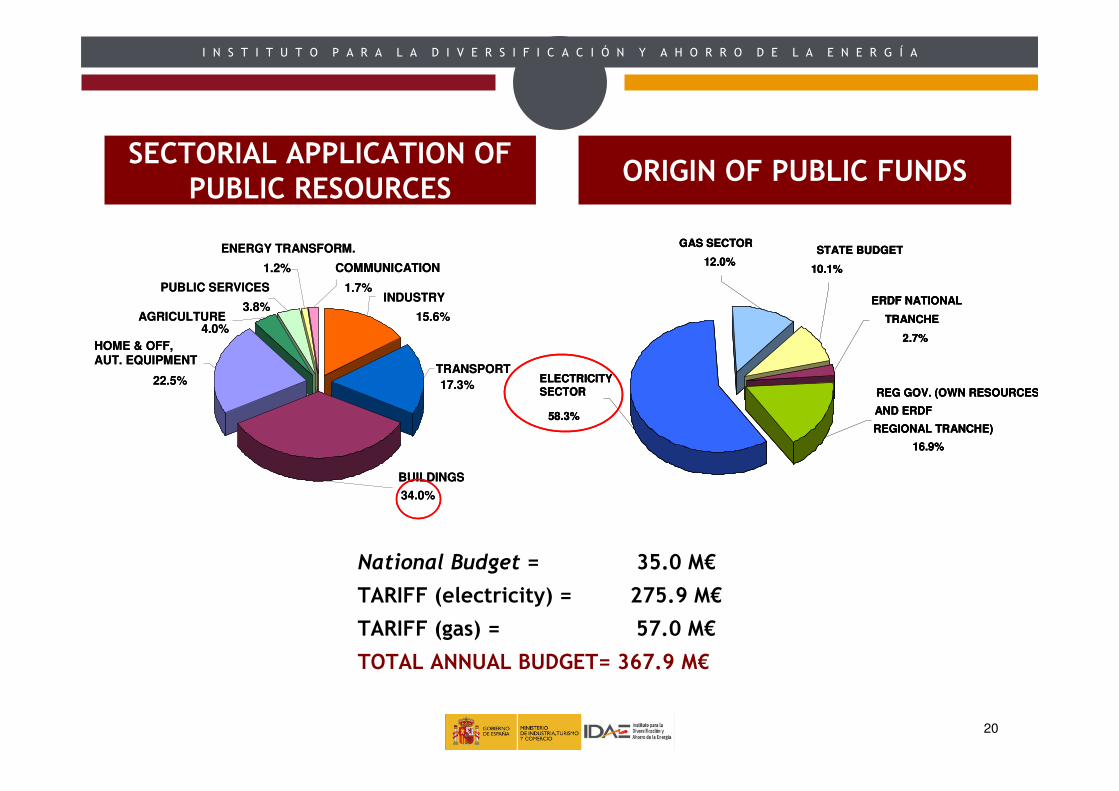
SECTORIAL APPLICATION OF PUBLIC RESOURCES
PUBLIC SERVICES
3.8%
ENERGY TRANSFORM.
1.2% COMMUNICATION
1.7%
AGRICULTURE4.0%
TRANSPORT
17.3%
INDUSTRY
15.6%
BUILDINGS
34.0%
HOME & OFF, AUT. EQUIPMENT
22.5%
PUBLIC SERVICES
3.8%
ENERGY TRANSFORM.
1.2% COMMUNICATION
1.7%
AGRICULTURE4.0%
TRANSPORT
17.3%
INDUSTRY
15.6%
BUILDINGS
34.0%
HOME & OFF, AUT. EQUIPMENT
22.5%
ORIGIN OF PUBLIC FUNDS
ELECTRICITYSECTOR
58.3%
GAS SECTOR
12.0%STATE BUDGET
10.1%
ERDF NATIONAL
TRANCHE
2.7%
REG GOV. (OWN RESOURCES
AND ERDF
REGIONAL TRANCHE)
16.9%
ELECTRICITYSECTOR
58.3%
GAS SECTOR
12.0%STATE BUDGET
10.1%
ERDF NATIONAL
TRANCHE
2.7%
REG GOV. (OWN RESOURCES
AND ERDF
REGIONAL TRANCHE)
16.9%
ELECTRICITYSECTOR
58.3%
GAS SECTOR
12.0%STATE BUDGET
10.1%
ERDF NATIONAL
TRANCHE
2.7%
REG GOV. (OWN RESOURCES
AND ERDF
REGIONAL TRANCHE)
16.9%
National Budget = 35.0 M€
TARIFF (electricity) = 275.9 M€
TARIFF (gas) = 57.0 M€
TOTAL ANNUAL BUDGET= 367.9 M€
I N S T I T U T O P A R A L A D I V E R S I F I C A C I Ó N Y A H O R R O D E L A E N E R G Í A
21
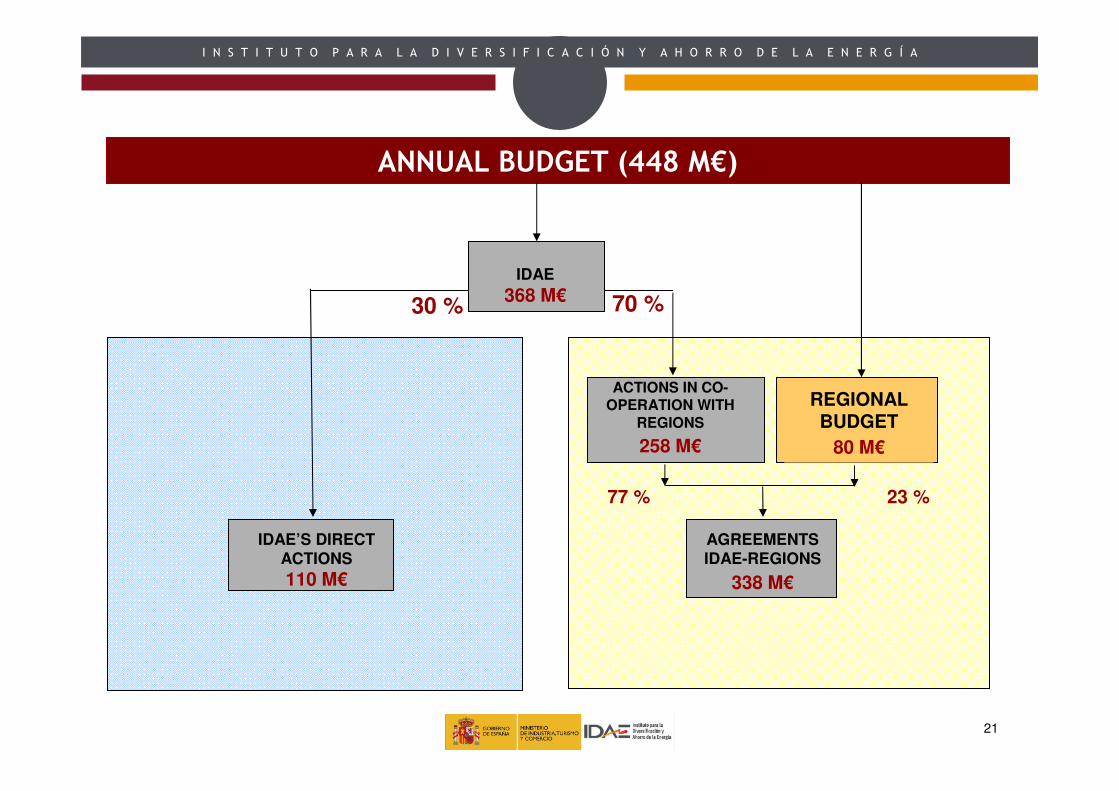
IDAE’S DIRECT ACTIONS
110 M€
ACTIONS IN CO-OPERATION WITH
REGIONS
258 M€
ANNUAL BUDGET (448 M€)
REGIONAL BUDGET
80 M€
IDAE
368 M€30 % 70 %
77 % 23 %
AGREEMENTS IDAE-REGIONS
338 M€

I N S T I T U T O P A R A L A D I V E R S I F I C A C I Ó N Y A H O R R O D E L A E N E R G Í A
22
2010 PERSPECTIVES IN ENERGY EFFICIENCY
• Improving energy efficiency ≈ 1.5%
• Strategy to promote electric vehicle: 250.000 electric vehicles in 2014.
• Public support: 590 M€
• Development of the Activation plan for energy Saving and efficiency in public
buildings: IDAE has drawn up a standard contract for integrated energy and
maintenance services for publicly owned buildings (ESCOs)
• Promotion of ESCOs in regions and cities
• Continuity of Saving and Energy Efficiency Strategy in Spain and its Action Plans
• Review of the Technical Building Code: boost for building rehabilitation
• New Directive on energy efficiency in buildings
• Sustainable Economy Act:
• Renewable energy law
• Energy efficiency in buildings: housing rehabilitation versus energy rehabilitation
• Sustainable transport
I N S T I T U T O P A R A L A D I V E R S I F I C A C I Ó N Y A H O R R O D E L A E N E R G Í A
23

I N S T I T U T O P A R A L A D I V E R S I F I C A C I Ó N Y A H O R R O D E L A E N E R G Í A
24
Thanks for your [email protected]
www.idae.es


