![FREE FLEXING EXPANSION JOINTS]–-–](https://static.fdocuments.net/doc/165x107/6216b4cc41f30646a447da85/free-flexing-expansion-joints-.jpg)
Low Carbon Cities: Flexing the Urbanization-Energy-Carbon...
51
Low Carbon Cities: Flexing the Urbanization-Energy-Carbon Nexus Shobhakar Dhakal Executive Director- Global Carbon Project National Institute for Environmental Studies (NIES) Japan Guest Research Scholar, International Institute for Applied Systems Analyses (IIASA) Visiting Associate Professor, Graduate School of Environmental Studies, Nagoya University, Japan UNU-IAS Seminar Series: 2010 February 12 Institute for Advanced Studies (IAS) United Nations University (UNU), Yokohama
-
Upload
hoangnguyet -
Category
Documents
-
view
218 -
download
0
Transcript of Low Carbon Cities: Flexing the Urbanization-Energy-Carbon...
Low Carbon Cities: Flexing the Urbanization-Energy-Carbon Nexus
Shobhakar DhakalExecutive Director- Global Carbon Project
National Institute for Environmental Studies (NIES) Japan
Guest Research Scholar, International Institute for Applied Systems Analyses (IIASA)
Visiting Associate Professor, Graduate School of Environmental Studies, Nagoya University, Japan
UNU-IAS Seminar Series: 2010 February 12Institute for Advanced Studies (IAS)United Nations University (UNU), Yokohama
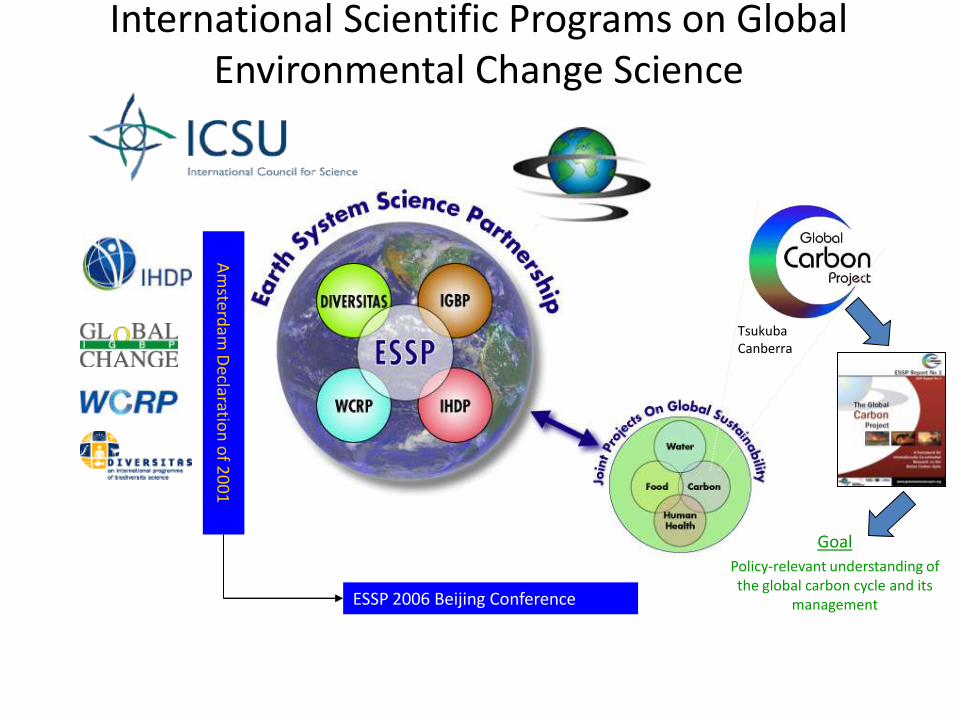
International Scientific Programs on Global Environmental Change Science
Am
sterdam
Declaratio
n o
f 20
01
ESSP 2006 Beijing Conference
Goal
Policy-relevant understanding of the global carbon cycle and its
management
TsukubaCanberra
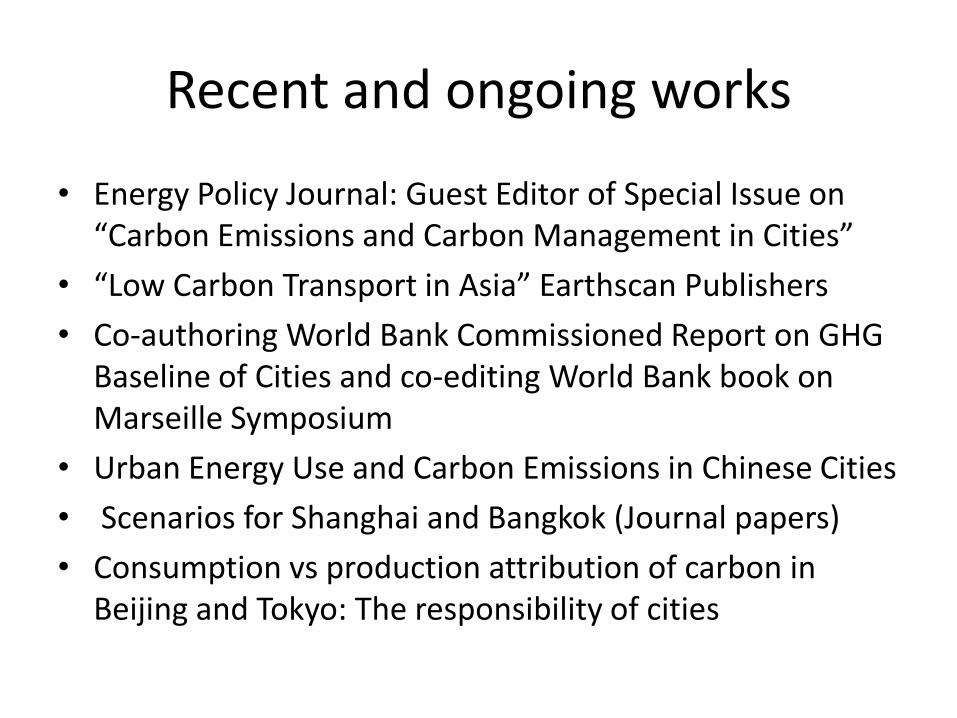
Recent and ongoing works
• Energy Policy Journal: Guest Editor of Special Issue on “Carbon Emissions and Carbon Management in Cities”
• “Low Carbon Transport in Asia” Earthscan Publishers
• Co-authoring World Bank Commissioned Report on GHG Baseline of Cities and co-editing World Bank book on Marseille Symposium
• Urban Energy Use and Carbon Emissions in Chinese Cities
• Scenarios for Shanghai and Bangkok (Journal papers)
• Consumption vs production attribution of carbon in Beijing and Tokyo: The responsibility of cities
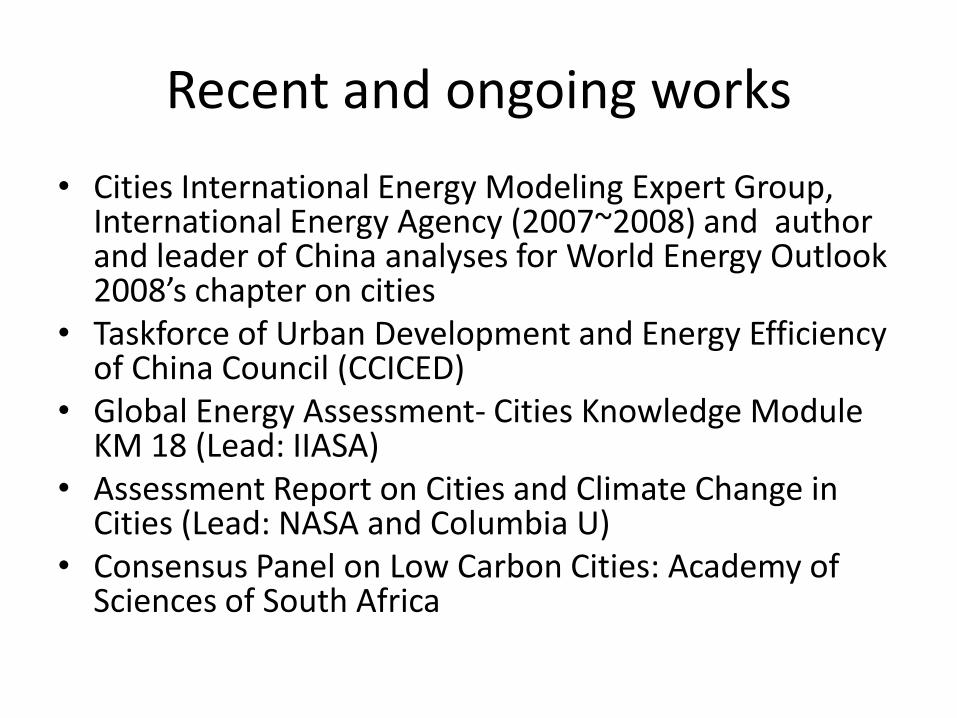
Recent and ongoing works
• Cities International Energy Modeling Expert Group, International Energy Agency (2007~2008) and author and leader of China analyses for World Energy Outlook 2008’s chapter on cities
• Taskforce of Urban Development and Energy Efficiency of China Council (CCICED)
• Global Energy Assessment- Cities Knowledge Module KM 18 (Lead: IIASA)
• Assessment Report on Cities and Climate Change in Cities (Lead: NASA and Columbia U)
• Consensus Panel on Low Carbon Cities: Academy of Sciences of South Africa
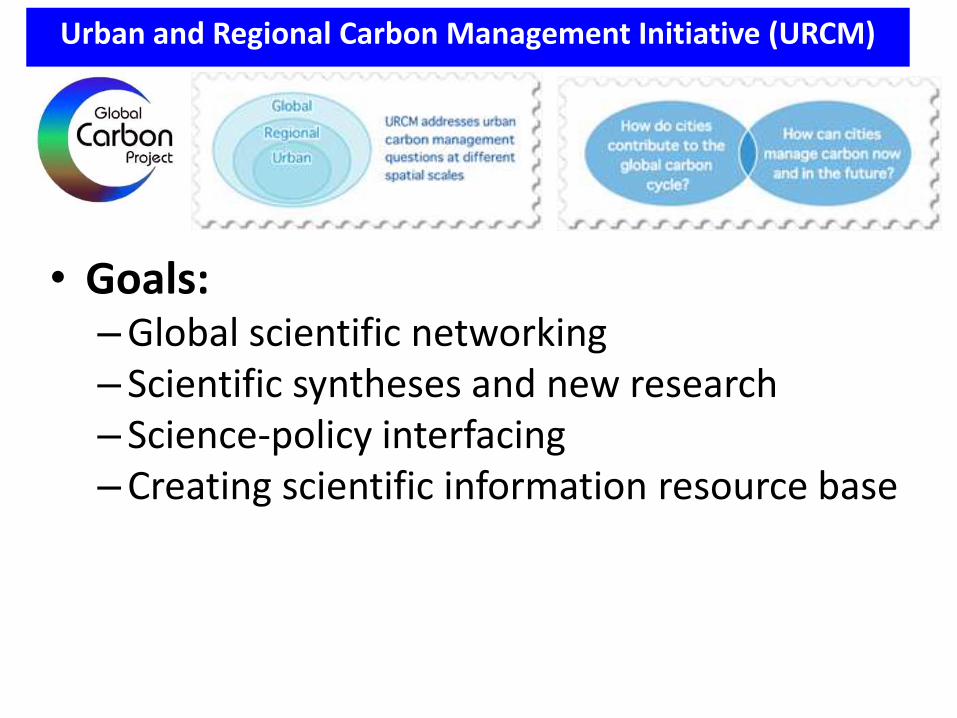
Urban and Regional Carbon Management Initiative (URCM)
• Goals:–Global scientific networking– Scientific syntheses and new research– Science-policy interfacing–Creating scientific information resource base
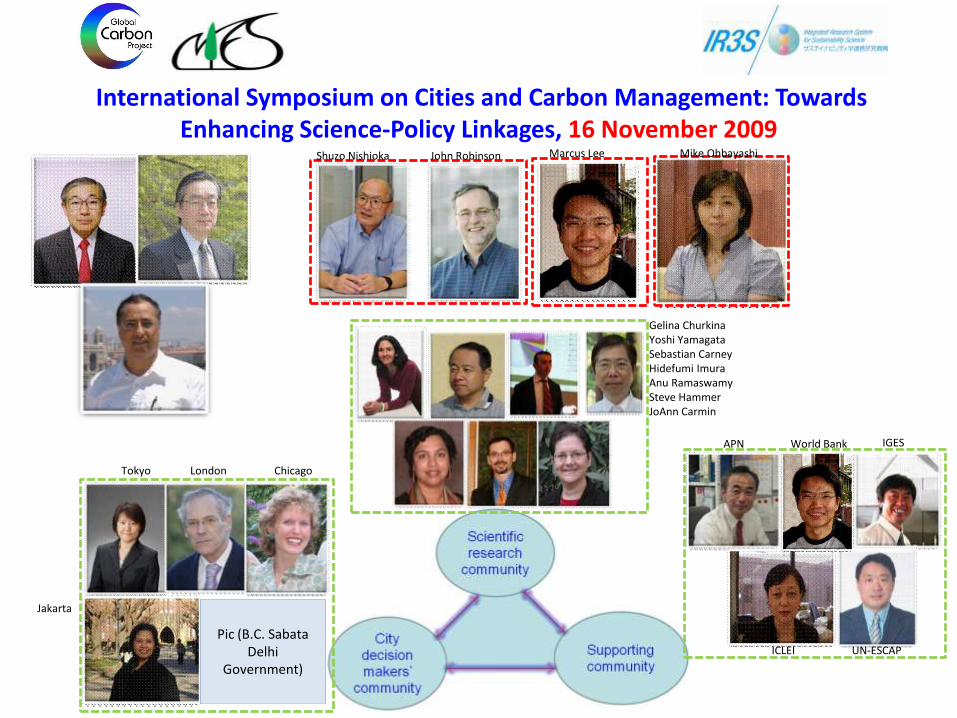
International Symposium on Cities and Carbon Management: Towards Enhancing Science‐Policy Linkages, 16 November 2009
Pic (B.C. SabataDelhi
Government)
APN World Bank IGES
ICLEI UN-ESCAP
Tokyo London Chicago
Jakarta
Shuzo Nishioka John Robinson Marcus Lee Mike Ohbayashi
Gelina ChurkinaYoshi YamagataSebastian CarneyHidefumi ImuraAnu RamaswamySteve HammerJoAnn Carmin
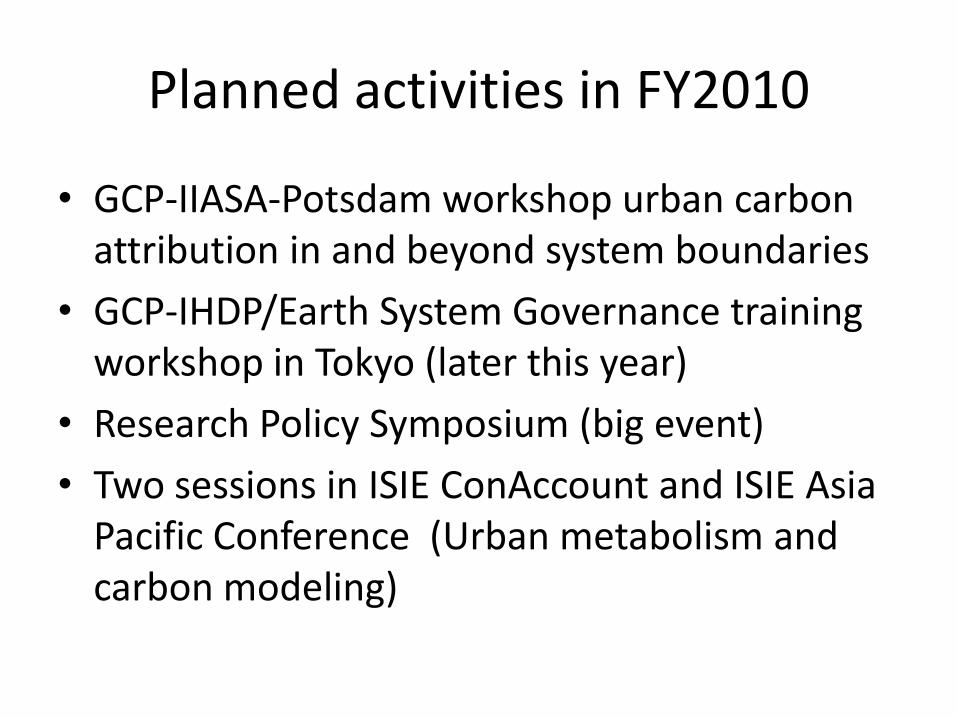
Planned activities in FY2010
• GCP-IIASA-Potsdam workshop urban carbon attribution in and beyond system boundaries
• GCP-IHDP/Earth System Governance training workshop in Tokyo (later this year)
• Research Policy Symposium (big event)
• Two sessions in ISIE ConAccount and ISIE Asia Pacific Conference (Urban metabolism and carbon modeling)
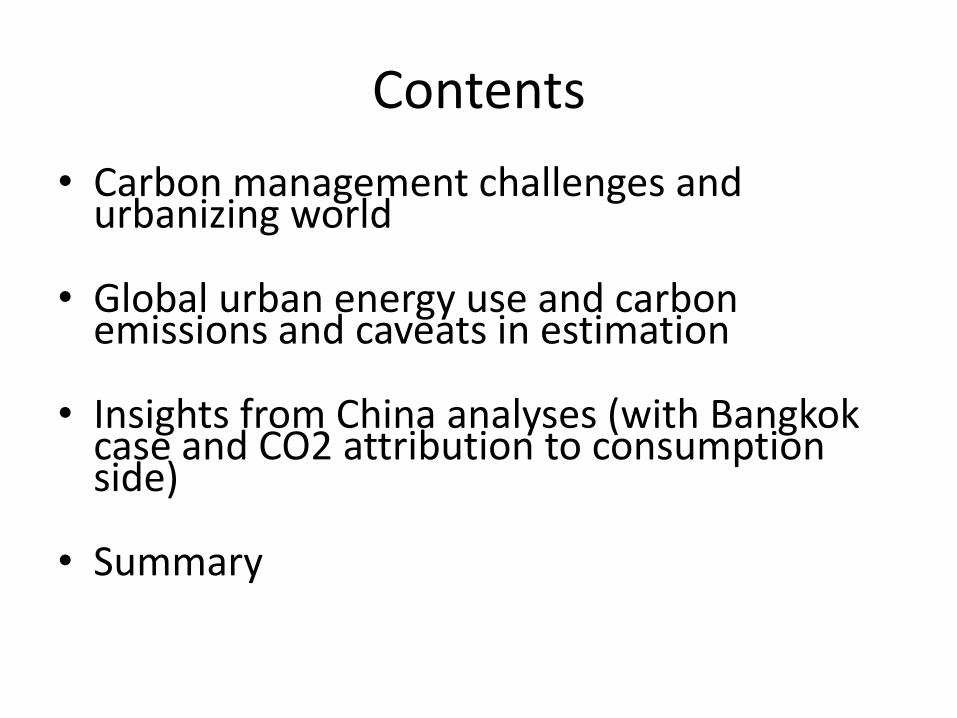
Contents
• Carbon management challenges and urbanizing world
• Global urban energy use and carbon emissions and caveats in estimation
• Insights from China analyses (with Bangkok case and CO2 attribution to consumption side)
• Summary
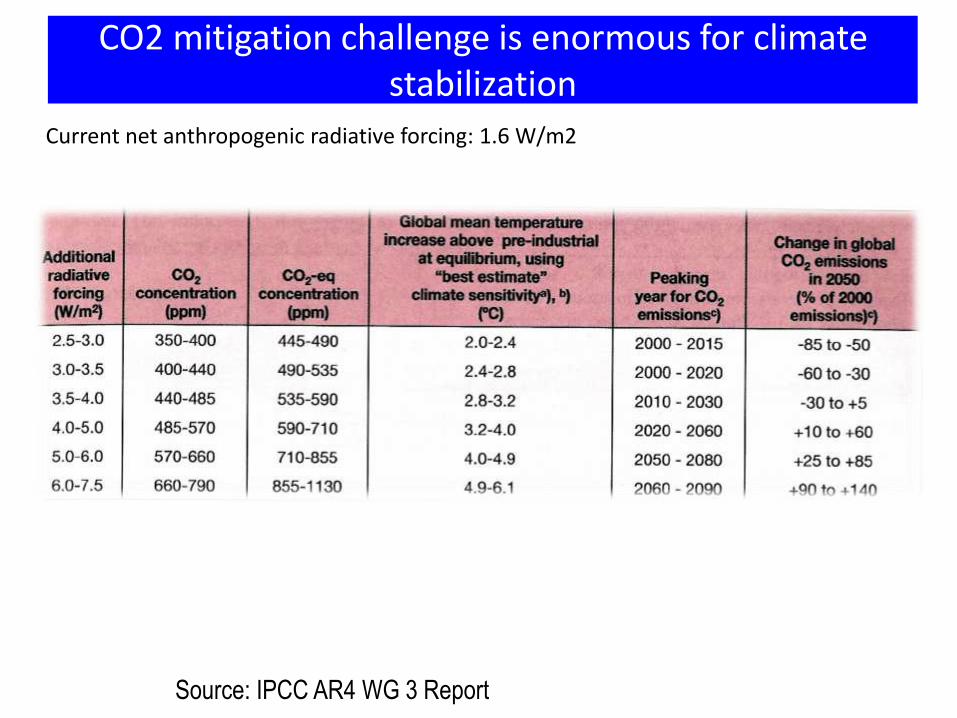
CO2 mitigation challenge is enormous for climate stabilization
Source: IPCC AR4 WG 3 Report
Current net anthropogenic radiative forcing: 1.6 W/m2
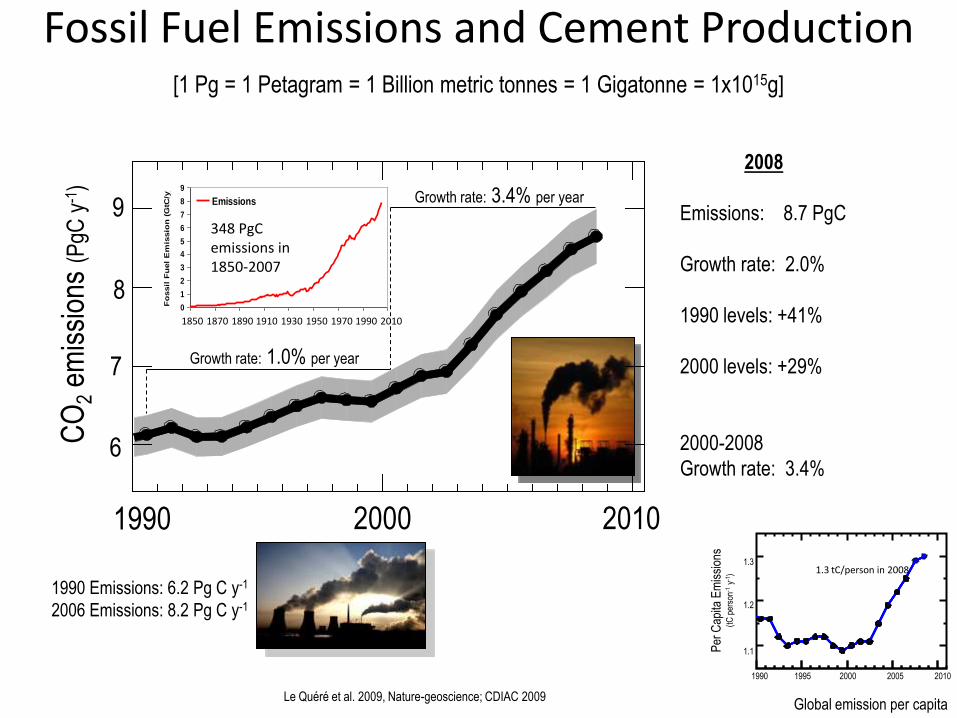
Fossil Fuel Emissions and Cement Production
Le Quéré et al. 2009, Nature-geoscience; CDIAC 2009
[1 Pg = 1 Petagram = 1 Billion metric tonnes = 1 Gigatonne = 1x10¹⁵g]
0
1
2
3
4
5
6
7
8
9
1850 1870 1890 1910 1930 1950 1970 1990 2010
Fo
ssil
Fu
el
Em
issio
n (
GtC
/y)
Emissions
280
300
320
340
360
380
400
1850 1870 1890 1910 1930 1950 1970 1990 2010
Atm
oap
heri
c [
CO
2]
(pp
mv) [CO2]
2 ppm/year
-0.6
-0.4
-0.2
0
0.2
0.4
0.6
0.8
1850 1870 1890 1910 1930 1950 1970 1990 2010
Tem
pera
ture
(d
eg
C)
Temperature 0.2 C/decade
1850 1870 1890 1910 1930 1950 1970 1990 2010
348 PgCemissions in 1850-2007
1990 Emissions: 6.2 Pg C y-1
2006 Emissions: 8.2 Pg C y-1
Per
Cap
ita E
mis
sion
s(t
Cpe
rson
-1y-1
)
1990 1995 2000 2005 2010
1.3
1.2
1.1
1.3 tC/person in 2008
Global emission per capita
CO
2em
issi
ons
(PgC
y-1)
9
8
7
6
1990 2000 2010
Growth rate: 1.0% per year
Growth rate: 3.4% per year
2008
Emissions: 8.7 PgC
Growth rate: 2.0%
1990 levels: +41%
2000 levels: +29%
2000-2008
Growth rate: 3.4%
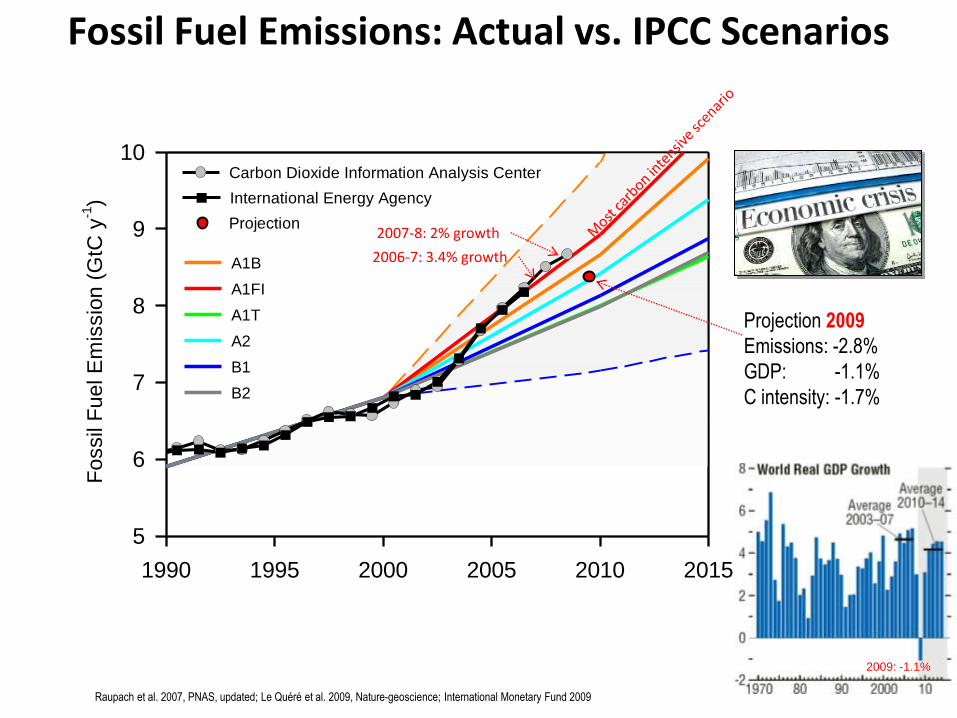
Fossil Fuel Emissions: Actual vs. IPCC Scenarios
Raupach et al. 2007, PNAS, updated; Le Quéré et al. 2009, Nature-geoscience; International Monetary Fund 2009
1990 1995 2000 2005 2010 2015
Fo
ssil
Fu
el E
mis
sio
n (
GtC
y-1)
5
6
7
8
9
10
Projection
A1B
A1FI
A1T
A2
B1
B2
Carbon Dioxide Information Analysis Center
International Energy Agency
Projection 2009
Emissions: -2.8%
GDP: -1.1%
C intensity: -1.7%
2007-8: 2% growth
2006-7: 3.4% growth
2009: -1.1%
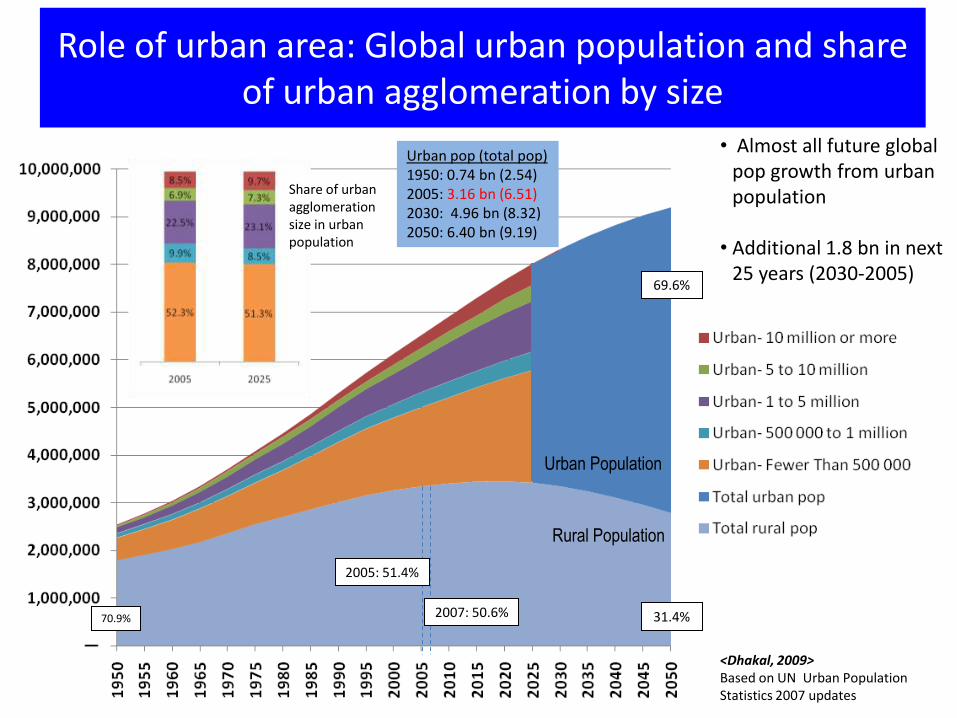
Role of urban area: Global urban population and share of urban agglomeration by size
69.6%
31.4%2007: 50.6%
<Dhakal, 2009>Based on UN Urban PopulationStatistics 2007 updates
Share of urban agglomeration size in urban population
• Almost all future global pop growth from urban population
• Additional 1.8 bn in next 25 years (2030-2005)
Rural Population
Urban Population
2005: 51.4%
70.9%
Urban pop (total pop)1950: 0.74 bn (2.54)2005: 3.16 bn (6.51)2030: 4.96 bn (8.32)2050: 6.40 bn (9.19)
What this means to energy and carbon emissions?
• Fossil energy use in urban areas will rise greatly
• Urban activities will pump enormous additional CO2 emissions
• Urban areas will thus provide greater opportunitiesto manage carbon emissions by influencing at greater degree globally- not to be blamed
• Surge of interest in city government for climate change mitigation globally
• BUT no estimation of Urban's global contribution before - to drive interests in urban carbon mitigation at multiple scales/levels
Estimations of urban energy/CO2 at global and city scale depends on definitions
1. What is urban and a city (physical definition)?
– How urban definition varies in the world?
– Where are their boundaries?
2. How we define cities‘ responsibility?
– Physical (territorial) or functional (non-territorial)
3. How energy use or carbon emission is accounted- GHG accounting rules and methods?
4. Usually, these boundaries donot correspond to the decision making boundaries adding complexities and imposing data and information constraints?
Incomparable definitions of “urban” determine global urban population numbers- UN data
• India classifies under 5,000 inhabitant settlements as rural villages
• 17.5% of Egypt's population lived in settlements with 10,000 to 20,000 inhabitants which were not classified as urban (1996)
• In Sweden, urban (tätort) refers to settlements of more than 200 inhabitants with continuous built-up area that houses are not more than 200 meters apart when discounting rivers, parks, roads, etc
• What would be world’s urban population data if we apply Swedish definition to India and China?
• Lower ends of “urban” definition swings urbanization levels drastically
National definitions of “urban” (UN Urban Population Definition)
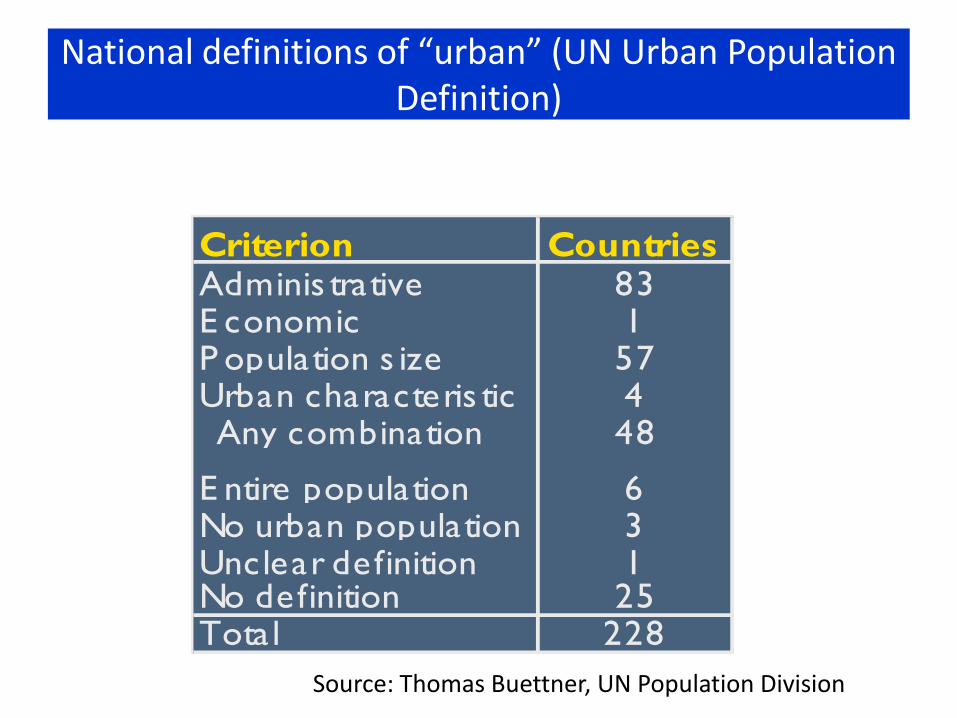
Criterion CountriesAdminis trative 83E conomic 1P opulation s ize 57Urban characteris tic 4Any combination 48
E ntire population 6No urban population 3Unclear definition 1No definition 25Tota l 228
Source: Thomas Buettner, UN Population Division
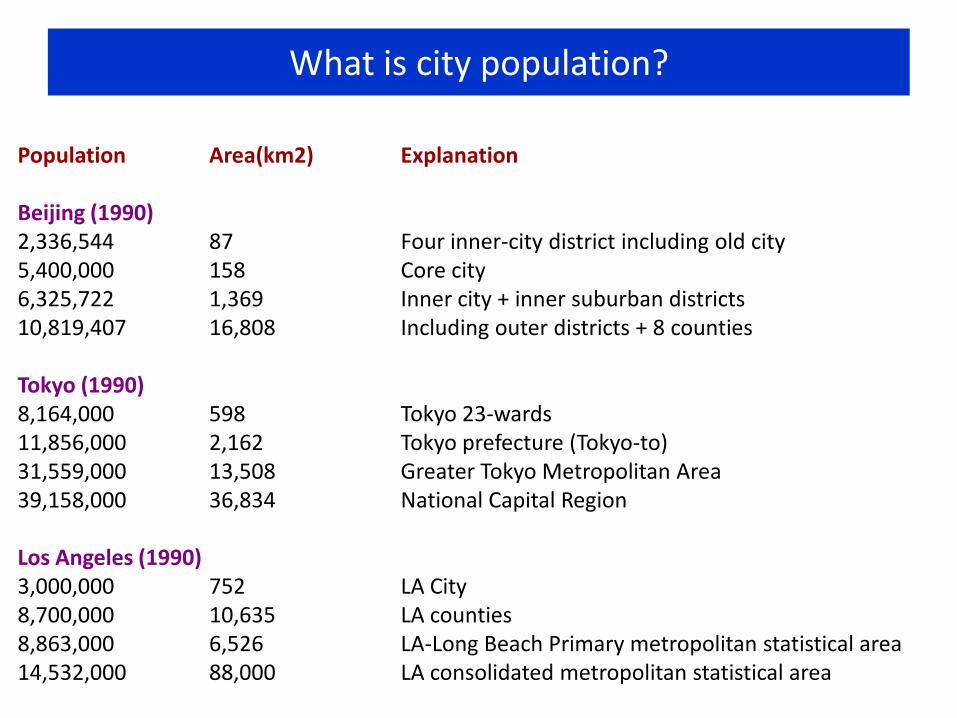
What is city population?
Population Area(km2) Explanation
Beijing (1990)2,336,544 87 Four inner-city district including old city5,400,000 158 Core city6,325,722 1,369 Inner city + inner suburban districts10,819,407 16,808 Including outer districts + 8 counties
Tokyo (1990)8,164,000 598 Tokyo 23-wards11,856,000 2,162 Tokyo prefecture (Tokyo-to)31,559,000 13,508 Greater Tokyo Metropolitan Area39,158,000 36,834 National Capital Region
Los Angeles (1990)3,000,000 752 LA City8,700,000 10,635 LA counties8,863,000 6,526 LA-Long Beach Primary metropolitan statistical area14,532,000 88,000 LA consolidated metropolitan statistical area
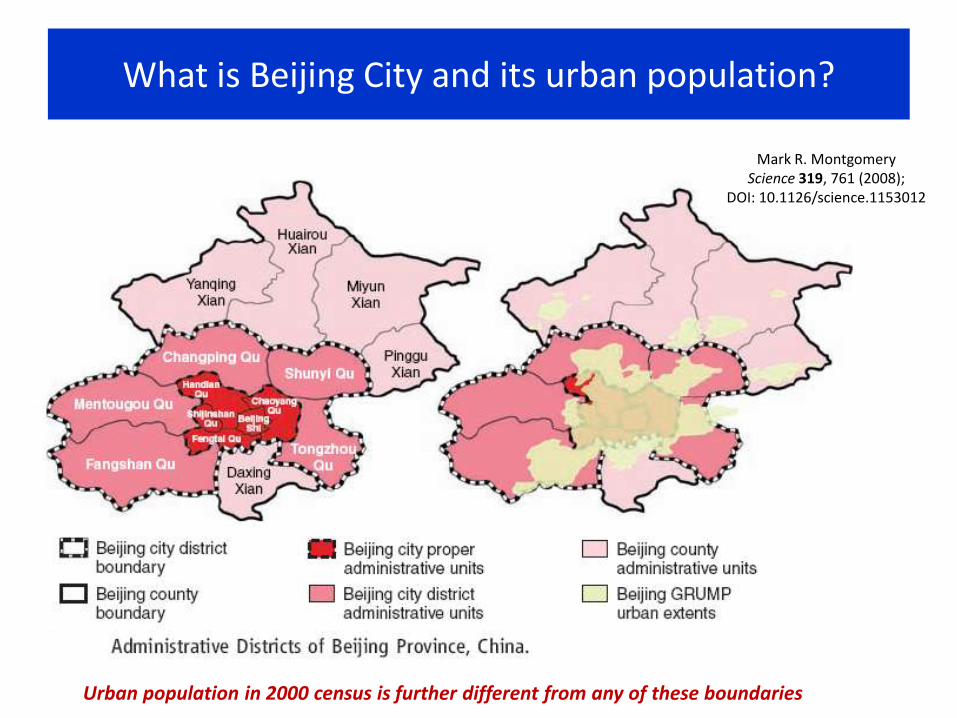
What is Beijing City and its urban population?
Mark R. MontgomeryScience 319, 761 (2008);
DOI: 10.1126/science.1153012
Urban population in 2000 census is further different from any of these boundaries

Attributing urban emissions for responsibility
• Territorial-principles?- Only direct emissions (like IPCC methods)
• Politico-adminstrative basis?- within political/admin boundary but not necessarily on territorial principles alone
• Footprint basis? Impact of consumption- emissions embodied in goods and service
• Functional basis? – Cities are connected to multiple scales/levels?– Functional role of cities– Natural and other conditions
• No agreed basis for responsibility and accounting– Overstated?- Why industry, international aviation and imported heat
and electricity are or are not city’s responsibility?– Understated?- Why consumption sides are not cities’ responsibility?– GHG accounting methods and scopes for open system such as cities
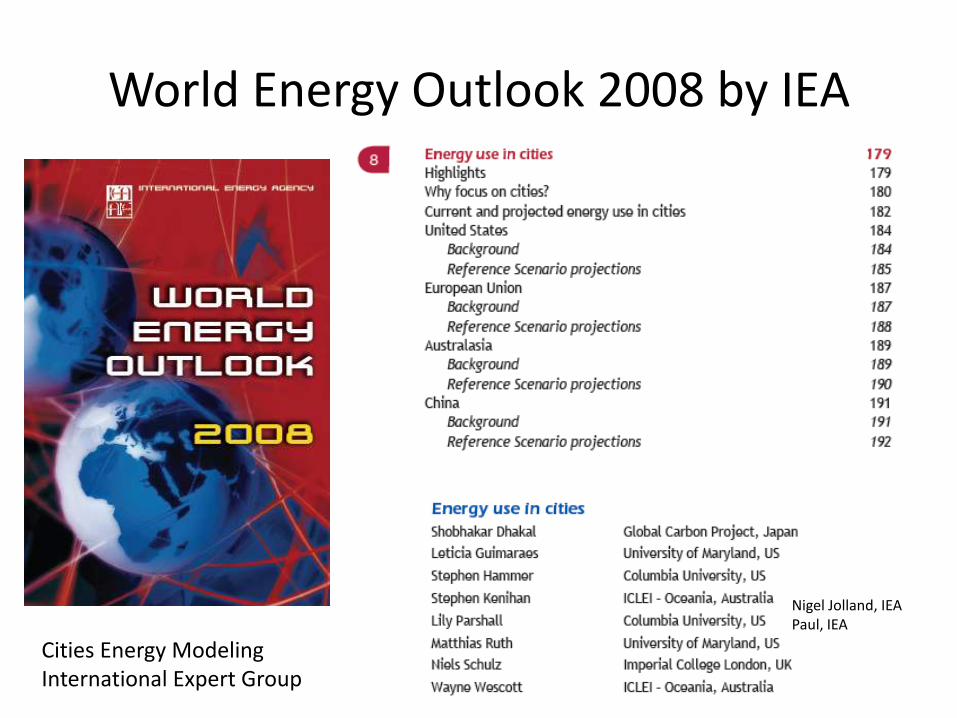
World Energy Outlook 2008 by IEA
Cities Energy Modeling International Expert Group
Nigel Jolland, IEAPaul, IEA
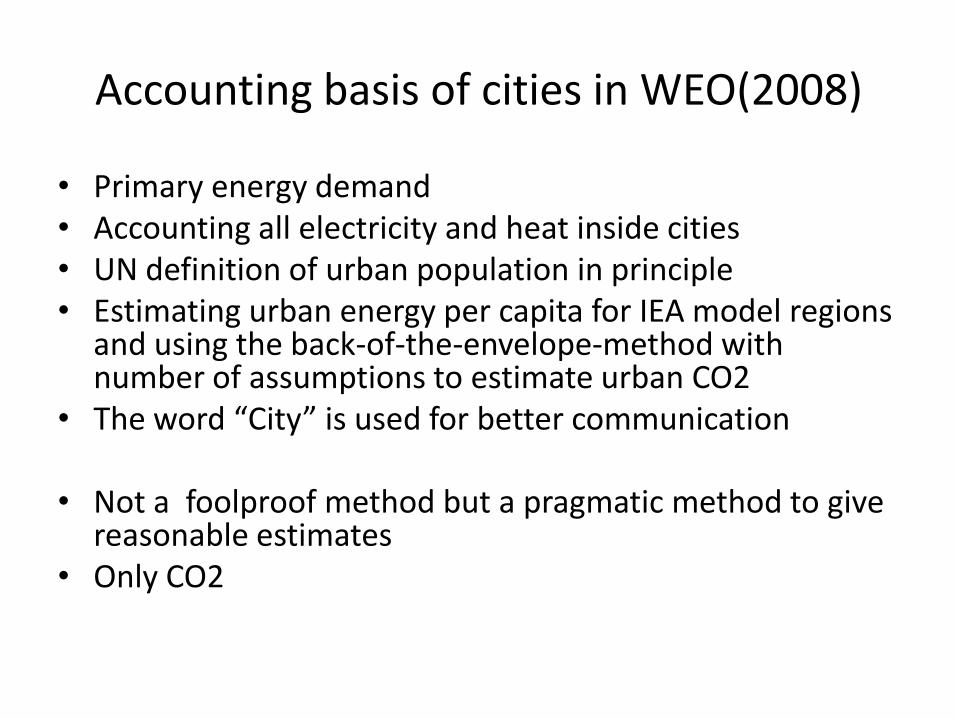
Accounting basis of cities in WEO(2008)
• Primary energy demand• Accounting all electricity and heat inside cities• UN definition of urban population in principle• Estimating urban energy per capita for IEA model regions
and using the back-of-the-envelope-method with number of assumptions to estimate urban CO2
• The word “City” is used for better communication
• Not a foolproof method but a pragmatic method to give reasonable estimates
• Only CO2
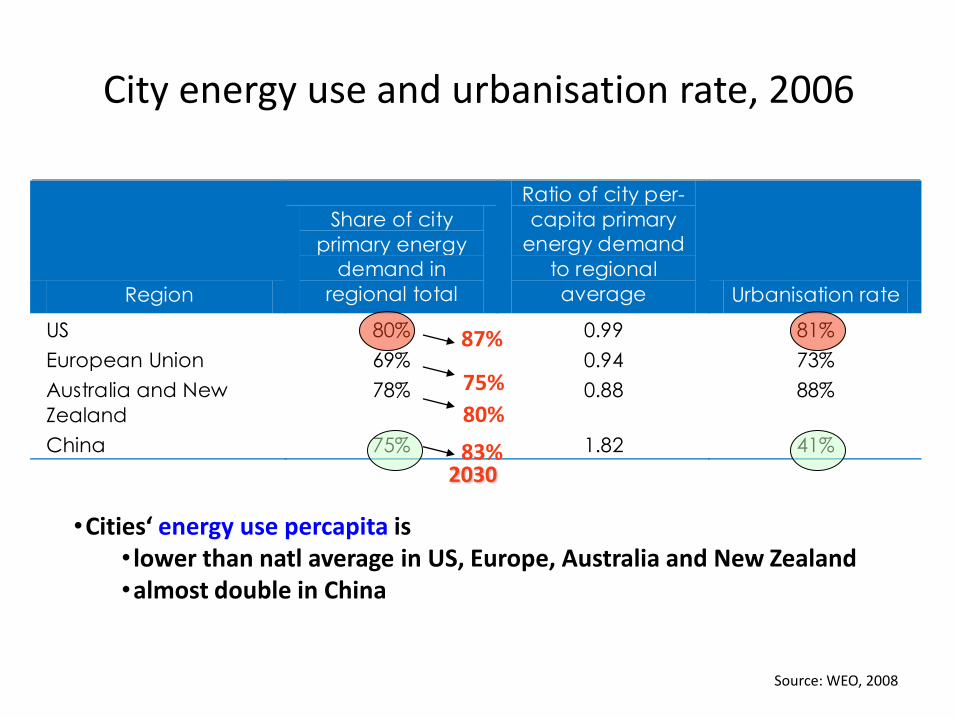
City energy use and urbanisation rate, 2006
Region
Share of city
primary energy
demand in
regional total
Ratio of city per-
capita primary
energy demand
to regional
average Urbanisation rate
US 80% 0.99 81%
European Union 69% 0.94 73%
Australia and New
Zealand
78% 0.88 88%
China 75% 1.82 41%
Source: WEO, 2008
•Cities‘ energy use percapita is • lower than natl average in US, Europe, Australia and New Zealand•almost double in China
87%
75%
80%
83%2030
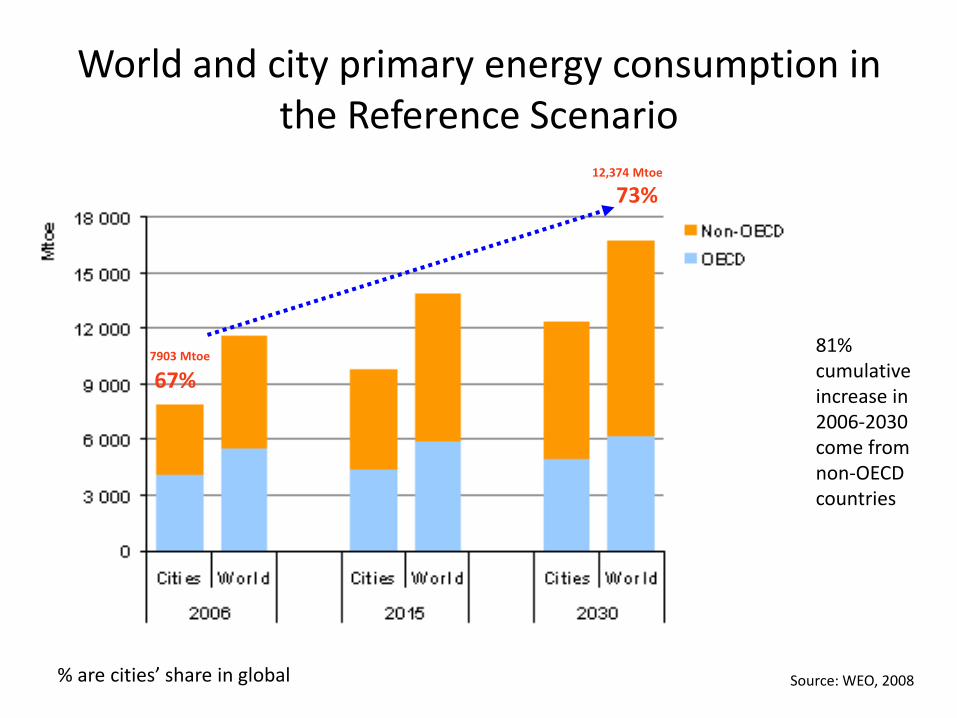
World and city primary energy consumption in the Reference Scenario
Source: WEO, 2008
67%
73%
7903 Mtoe
12,374 Mtoe
% are cities’ share in global
81% cumulative increase in 2006-2030 come from non-OECD countries
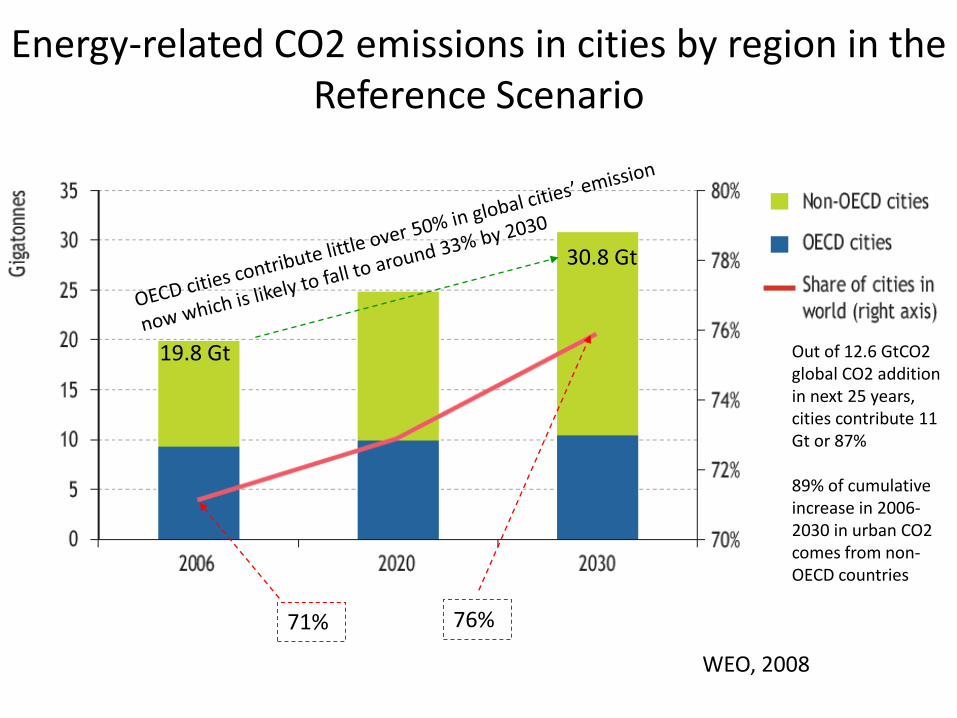
Energy-related CO2 emissions in cities by region in the Reference Scenario
71% 76%
19.8 Gt
30.8 Gt
WEO, 2008
Out of 12.6 GtCO2 global CO2 addition in next 25 years, cities contribute 11 Gt or 87%
89% of cumulative increase in 2006-2030 in urban CO2 comes from non-OECD countries
Urban’s GHG contribution
• It is likely that much less share of anthropogenic greenhouse gas emissions are generated within city boundaries– No estimates yet
– Big share of electricity could come from outside
– Land use’s CO2 share is 12% in 2008 (Corinne et al., 2009 Nature)
– Urban’s global methane contribution 7-14% (??) wunch et al. 2009
• However, consumption attribution is likely to push such contribution much higher
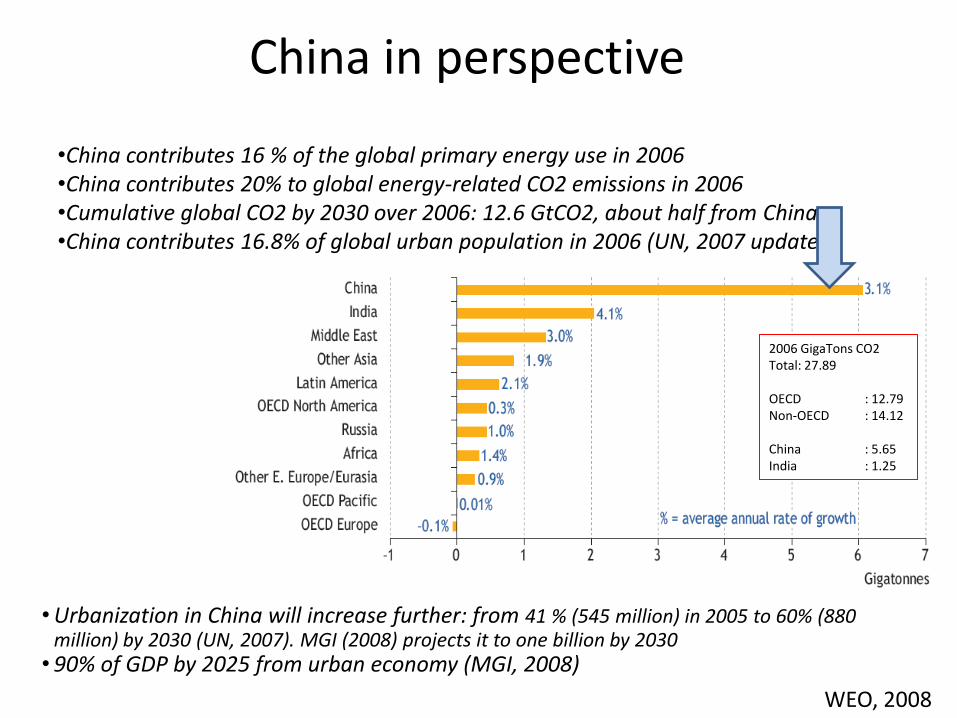
China in perspective
WEO, 2008
•China contributes 16 % of the global primary energy use in 2006•China contributes 20% to global energy-related CO2 emissions in 2006•Cumulative global CO2 by 2030 over 2006: 12.6 GtCO2, about half from China•China contributes 16.8% of global urban population in 2006 (UN, 2007 update)
2006 GigaTons CO2Total: 27.89
OECD : 12.79Non-OECD : 14.12
China : 5.65 India : 1.25
• Urbanization in China will increase further: from 41 % (545 million) in 2005 to 60% (880 million) by 2030 (UN, 2007). MGI (2008) projects it to one billion by 2030
• 90% of GDP by 2025 from urban economy (MGI, 2008)
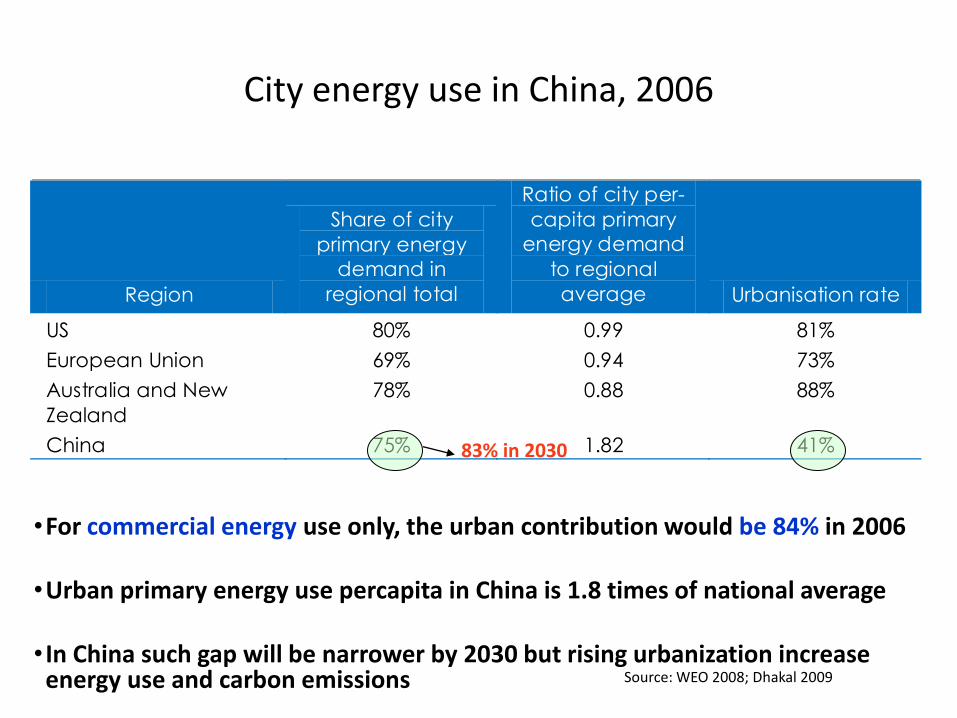
City energy use in China, 2006
Region
Share of city
primary energy
demand in
regional total
Ratio of city per-
capita primary
energy demand
to regional
average Urbanisation rate
US 80% 0.99 81%
European Union 69% 0.94 73%
Australia and New
Zealand
78% 0.88 88%
China 75% 1.82 41%
Source: WEO 2008; Dhakal 2009
•For commercial energy use only, the urban contribution would be 84% in 2006
•Urban primary energy use percapita in China is 1.8 times of national average
• In China such gap will be narrower by 2030 but rising urbanization increase energy use and carbon emissions
83% in 2030
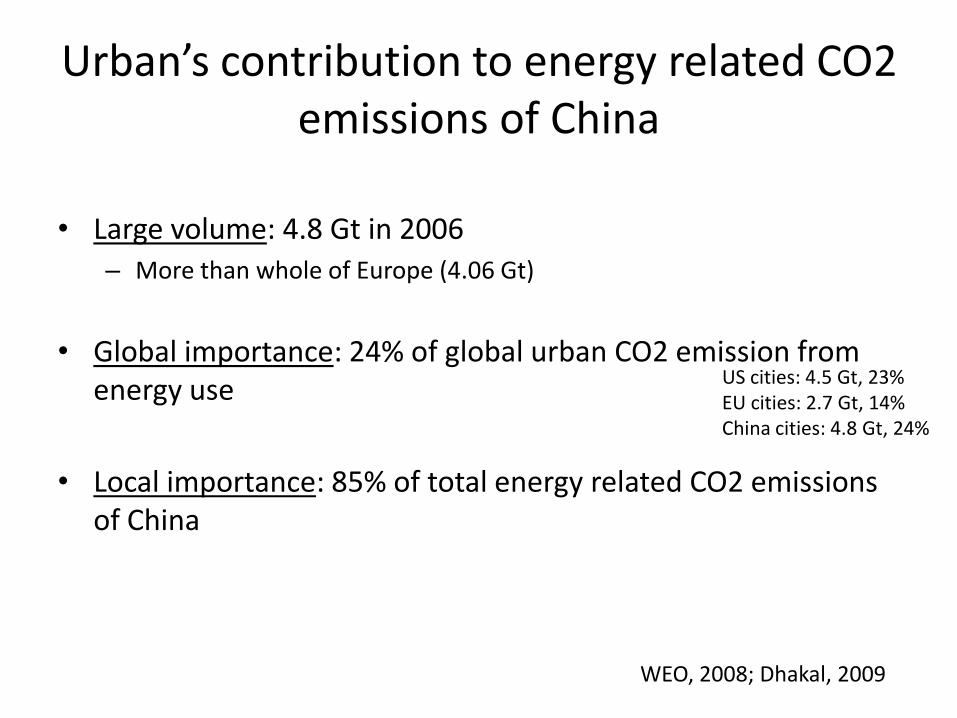
Urban’s contribution to energy related CO2 emissions of China
• Large volume: 4.8 Gt in 2006– More than whole of Europe (4.06 Gt)
• Global importance: 24% of global urban CO2 emission from energy use
• Local importance: 85% of total energy related CO2 emissions of China
WEO, 2008; Dhakal, 2009
US cities: 4.5 Gt, 23%EU cities: 2.7 Gt, 14%China cities: 4.8 Gt, 24%
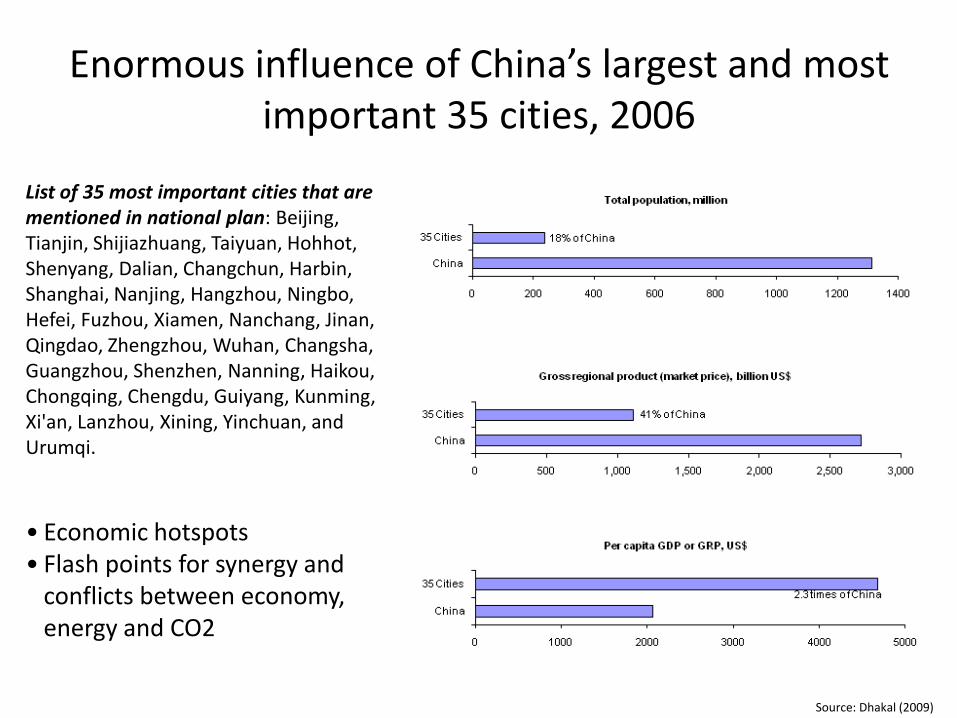
Enormous influence of China’s largest and most important 35 cities, 2006
List of 35 most important cities that are mentioned in national plan: Beijing, Tianjin, Shijiazhuang, Taiyuan, Hohhot, Shenyang, Dalian, Changchun, Harbin, Shanghai, Nanjing, Hangzhou, Ningbo, Hefei, Fuzhou, Xiamen, Nanchang, Jinan, Qingdao, Zhengzhou, Wuhan, Changsha, Guangzhou, Shenzhen, Nanning, Haikou, Chongqing, Chengdu, Guiyang, Kunming, Xi'an, Lanzhou, Xining, Yinchuan, and Urumqi.
Source: Dhakal (2009)
• Economic hotspots• Flash points for synergy and
conflicts between economy, energy and CO2
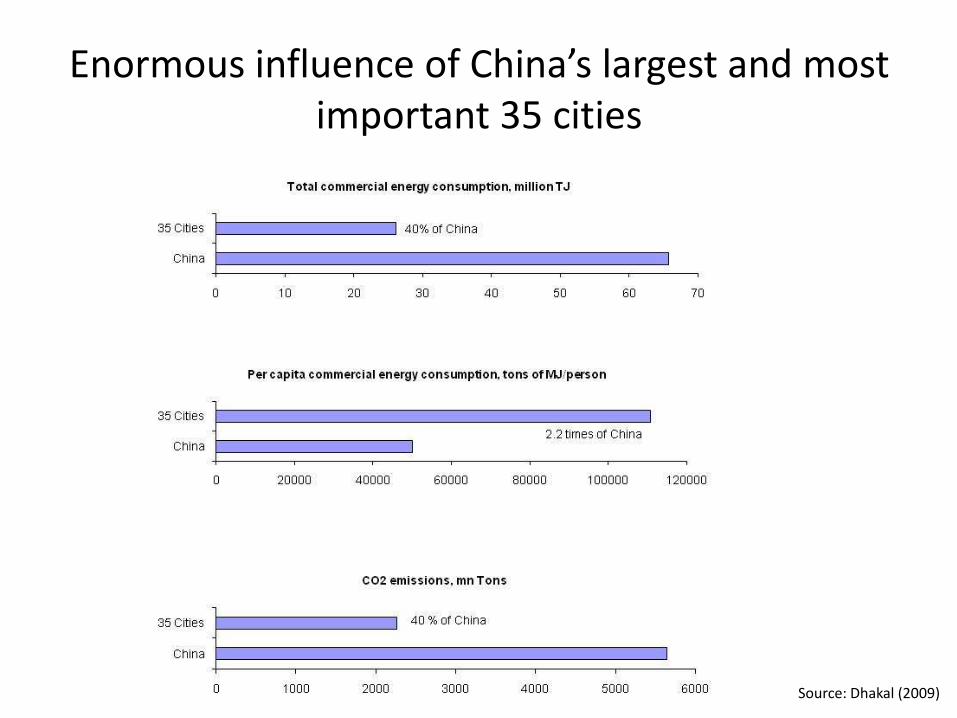
Enormous influence of China’s largest and most important 35 cities
Source: Dhakal (2009)
Xiamen
Urumqi
Nanjing
Guiyang
Chongquin
Fuzhou
Taiyuan
Xining
Ningbo
Shanghai
Hohhot
Xian
Guangzhou
Beijing
Yinchuan
China
0
40,000
80,000
120,000
160,000
200,000
240,000
280,000
0 3,000 6,000 9,000 12,000
Per Capita Gross Regional Product in US$
Per
Cap
ita E
nerg
y C
on
su
mp
tio
n i
n M
J P
er
Pers
on
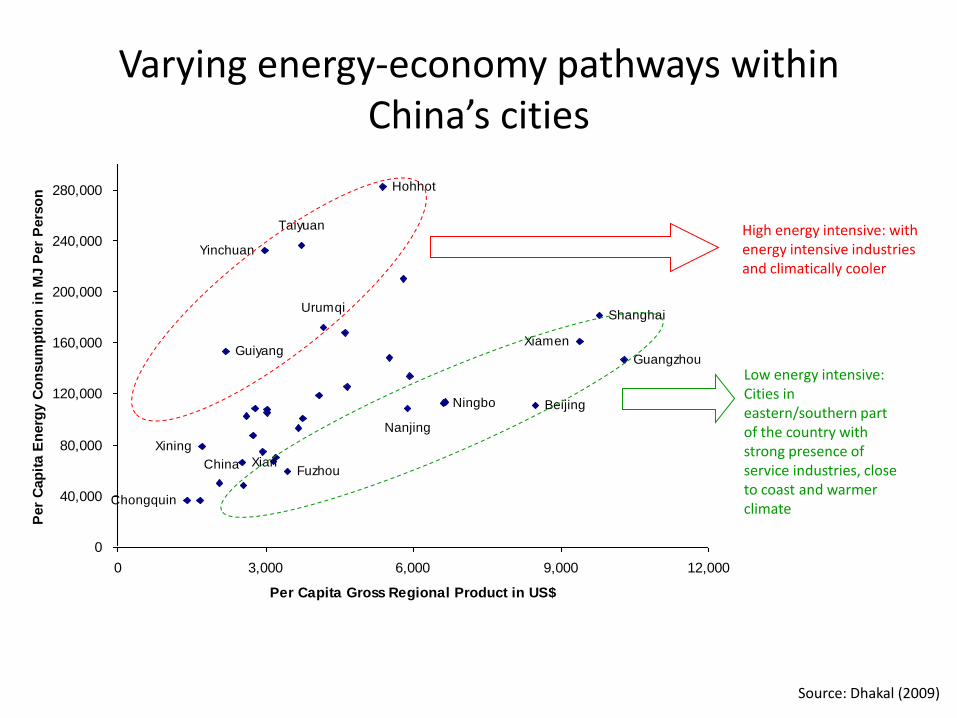
Varying energy-economy pathways within China’s cities
Source: Dhakal (2009)
High energy intensive: with energy intensive industries and climatically cooler
Low energy intensive: Cities in eastern/southern part of the country with strong presence of service industries, close to coast and warmer climate
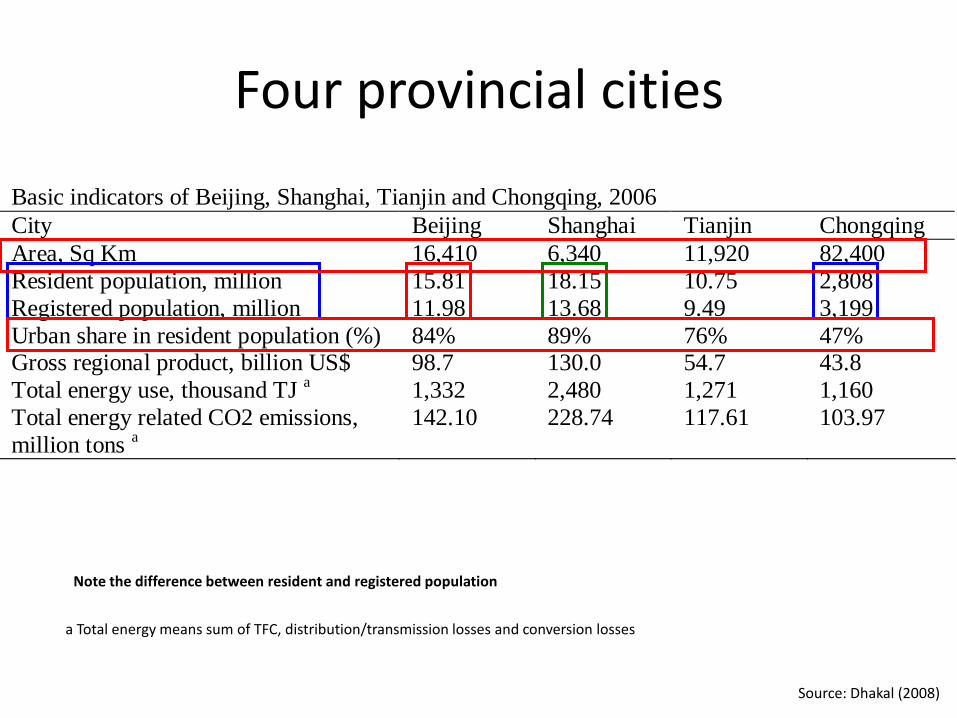
Four provincial cities
Basic indicators of Beijing, Shanghai, Tianjin and Chongqing, 2006
City Beijing Shanghai Tianjin Chongqing
Area, Sq Km 16,410 6,340 11,920 82,400
Resident population, million 15.81 18.15 10.75 2,808
Registered population, million 11.98 13.68 9.49 3,199
Urban share in resident population (%) 84% 89% 76% 47% Gross regional product, billion US$ 98.7 130.0 54.7 43.8
Total energy use, thousand TJ a 1,332 2,480 1,271 1,160
Total energy related CO2 emissions,
million tons a
142.10 228.74 117.61 103.97
a Total energy means sum of TFC, distribution/transmission losses and conversion losses
Source: Dhakal (2008)
Note the difference between resident and registered population
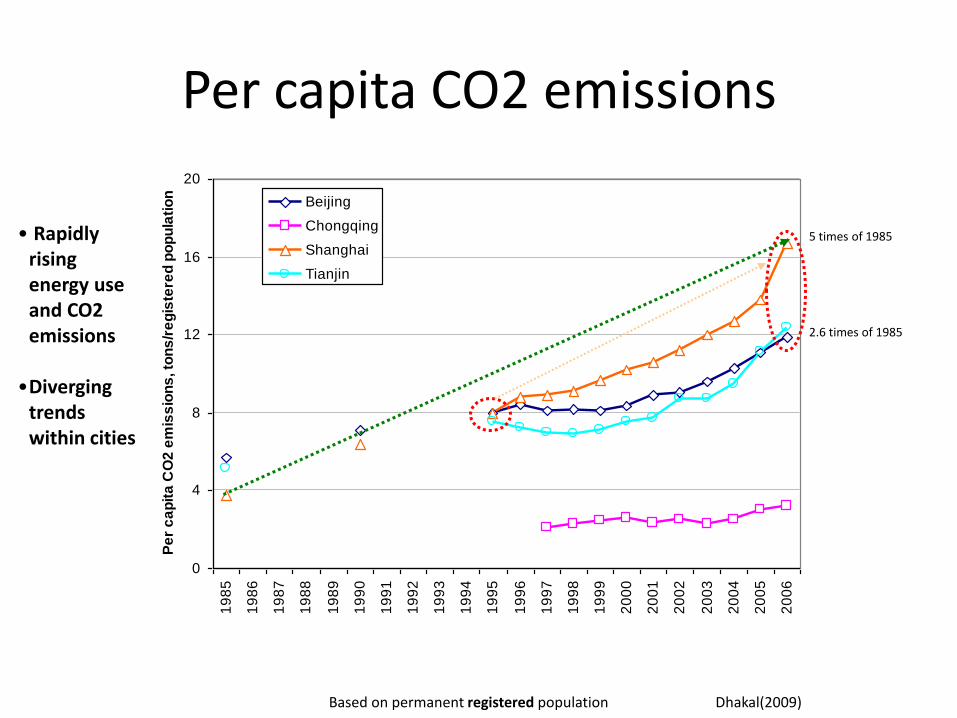
Per capita CO2 emissions
0
4
8
12
16
20
19
85
19
86
19
87
19
88
19
89
19
90
19
91
19
92
19
93
19
94
19
95
19
96
19
97
19
98
19
99
20
00
20
01
20
02
20
03
20
04
20
05
20
06
Pe
r c
ap
ita
CO
2 e
mis
sio
ns
, to
ns
/re
gis
tere
d p
op
ula
tio
n
Beijing
Chongqing
Shanghai
Tianjin
5 times of 1985
2.6 times of 1985
Based on permanent registered population Dhakal(2009)
• Rapidly rising energy use and CO2 emissions
•Diverging trends within cities
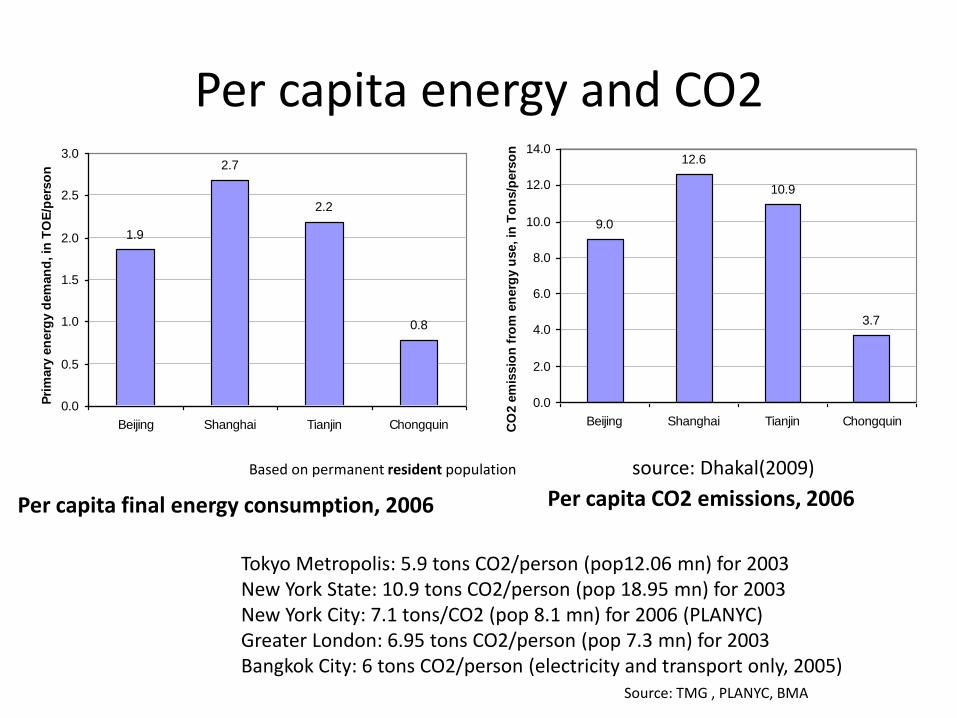
Per capita energy and CO2
Per capita final energy consumption, 2006 Per capita CO2 emissions, 2006
Based on permanent resident population source: Dhakal(2009)
1.9
2.7
2.2
0.8
0.0
0.5
1.0
1.5
2.0
2.5
3.0
Beijing Shanghai Tianjin Chongquin
Pri
mary
en
erg
y d
em
an
d, in
TO
E/p
ers
on
9.0
12.6
10.9
3.7
0.0
2.0
4.0
6.0
8.0
10.0
12.0
14.0
Beijing Shanghai Tianjin Chongquin
CO
2 e
mis
sio
n f
rom
en
erg
y u
se, in
To
ns/p
ers
on
Tokyo Metropolis: 5.9 tons CO2/person (pop12.06 mn) for 2003New York State: 10.9 tons CO2/person (pop 18.95 mn) for 2003New York City: 7.1 tons/CO2 (pop 8.1 mn) for 2006 (PLANYC)Greater London: 6.95 tons CO2/person (pop 7.3 mn) for 2003Bangkok City: 6 tons CO2/person (electricity and transport only, 2005)
Source: TMG , PLANYC, BMA
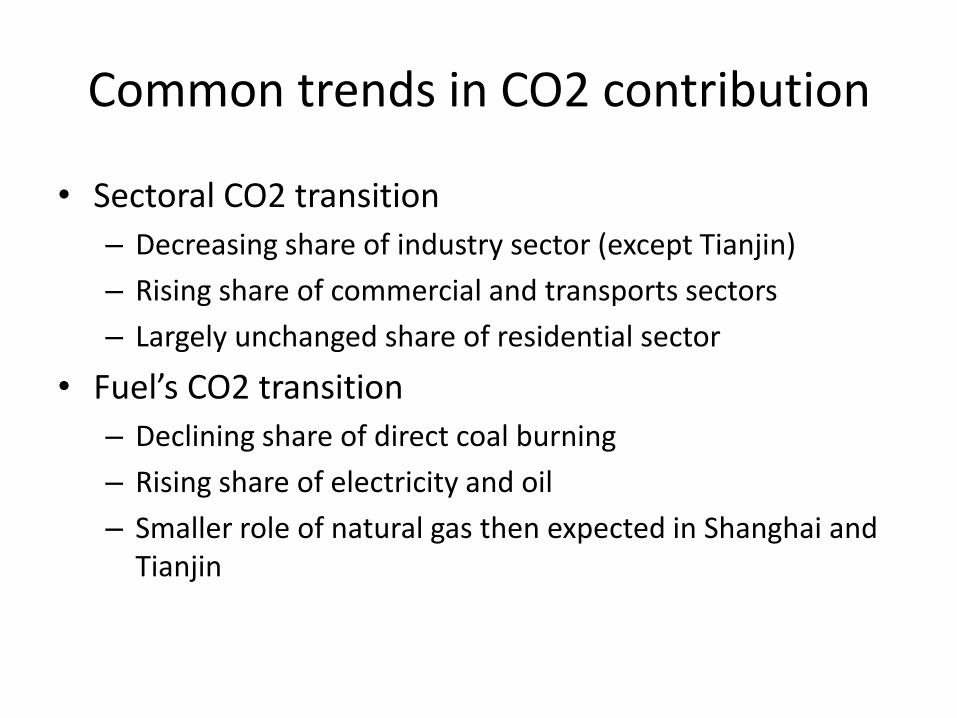
Common trends in CO2 contribution
• Sectoral CO2 transition
– Decreasing share of industry sector (except Tianjin)
– Rising share of commercial and transports sectors
– Largely unchanged share of residential sector
• Fuel’s CO2 transition
– Declining share of direct coal burning
– Rising share of electricity and oil
– Smaller role of natural gas then expected in Shanghai and Tianjin
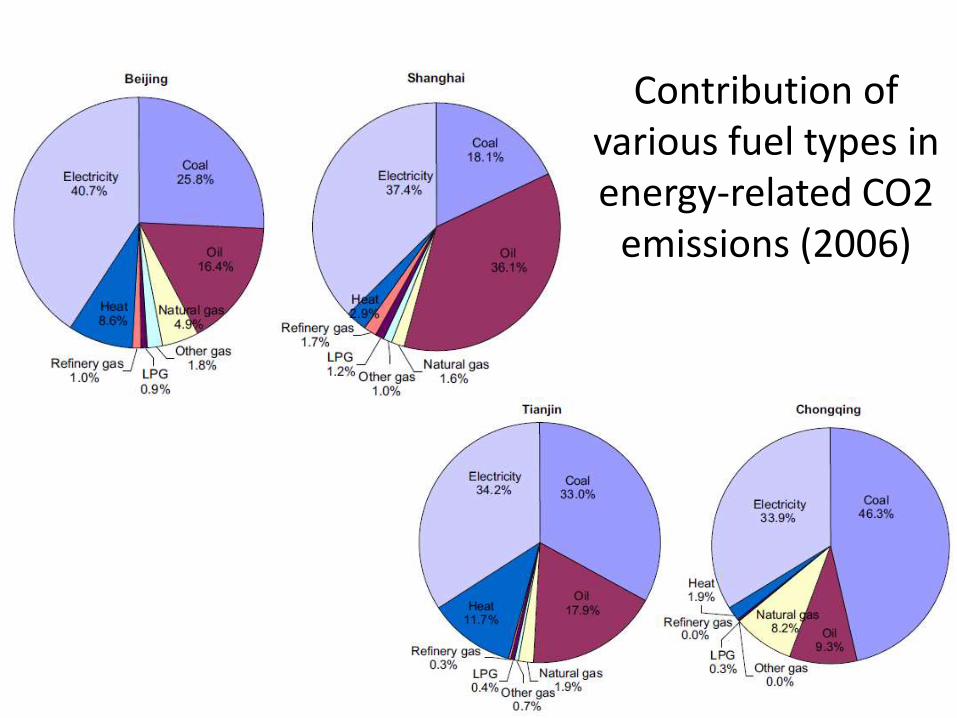
Contribution of various fuel types in energy-related CO2
emissions (2006)
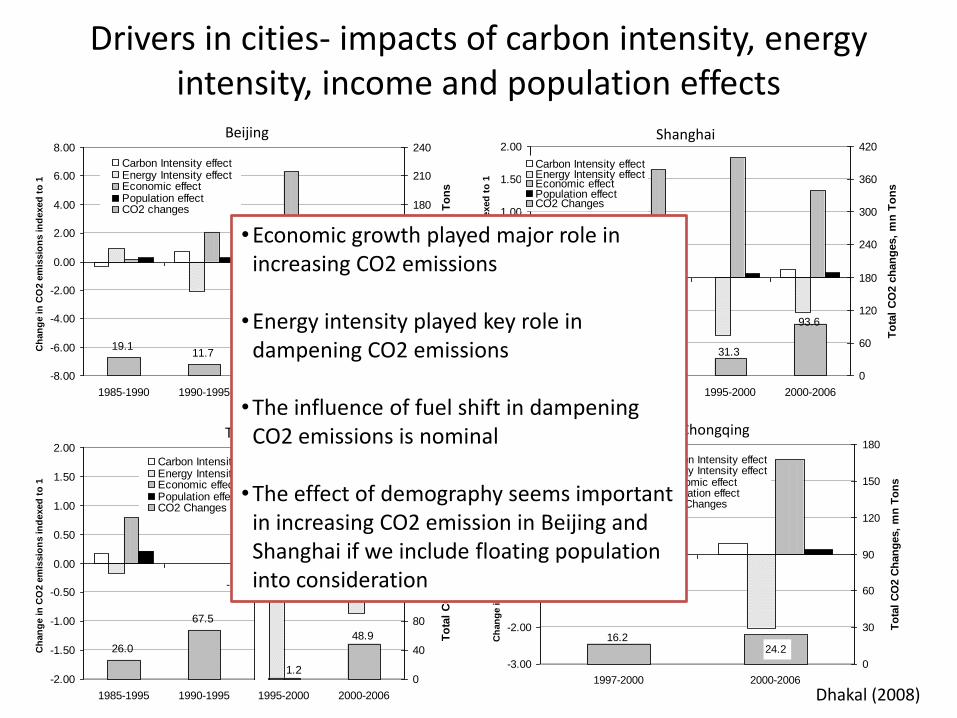
Drivers in cities- impacts of carbon intensity, energy intensity, income and population effects
19.111.7 6.9
49.8
-8.00
-6.00
-4.00
-2.00
0.00
2.00
4.00
6.00
8.00
1985-1990 1990-1995 1995-2000 2000-2006
Ch
an
ge in
CO
2 e
mis
sio
ns in
dexed
to
1
0
30
60
90
120
150
180
210
240
To
tal
CO
2 C
han
ges,
mn
To
ns
Carbon Intensity effectEnergy Intensity effectEconomic effectPopulation effectCO2 changes
Beijing
36.321.8
31.3
93.6
-1.50
-1.00
-0.50
0.00
0.50
1.00
1.50
2.00
1985-1990 1990-1995 1995-2000 2000-2006
Ch
an
ge in
CO
2 e
mis
sio
ns in
dexed
to
1
0
60
120
180
240
300
360
420
To
tal
CO
2 c
han
ges,
mn
To
ns
Carbon Intensity effectEnergy Intensity effectEconomic effectPopulation effectCO2 Changes
Shanghai
-7.23 -20.87
28.00
26.0
67.5
48.9
1.2-2.00
-1.50
-1.00
-0.50
0.00
0.50
1.00
1.50
2.00
1985-1995 1990-1995 1995-2000 2000-2006
Ch
an
ge in
CO
2 e
mis
sio
ns in
dexed
to
1
0
40
80
120
160
200
240
280
320T
ota
l C
O2 C
han
ges,
mn
To
ns
Carbon Intensity effectEnergy Intensity effectEconomic effectPopulation effectCO2 Changes
24.216.2
-3.00
-2.00
-1.00
0.00
1.00
2.00
3.00
1997-2000 2000-2006
Ch
an
ge in
CO
2 e
mis
sio
ns in
dexed
to
1
0
30
60
90
120
150
180
To
tal
CO
2 C
han
ges,
mn
To
ns
Carbon Intensity effectEnergy Intensity effectEconomic effectPopulation effectCO2 Changes
Tianjin Chongqing
•Economic growth played major role in increasing CO2 emissions
•Energy intensity played key role in dampening CO2 emissions
•The influence of fuel shift in dampening CO2 emissions is nominal
•The effect of demography seems important in increasing CO2 emission in Beijing and Shanghai if we include floating population into consideration
Dhakal (2008)
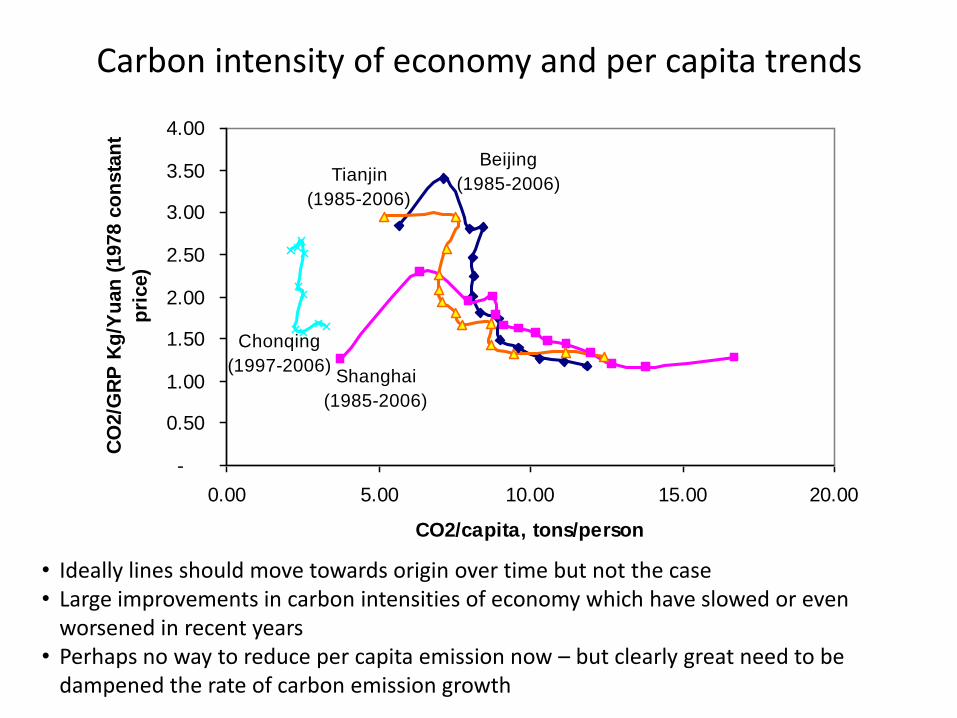
Carbon intensity of economy and per capita trends
Beijing
(1985-2006)
Shanghai
(1985-2006)
Tianjin
(1985-2006)
Chonqing
(1997-2006)
-
0.50
1.00
1.50
2.00
2.50
3.00
3.50
4.00
0.00 5.00 10.00 15.00 20.00
CO2/capita, tons/person
CO
2/G
RP
Kg
/Yu
an
(1978 c
on
sta
nt
pri
ce)
• Ideally lines should move towards origin over time but not the case• Large improvements in carbon intensities of economy which have slowed or even
worsened in recent years • Perhaps no way to reduce per capita emission now – but clearly great need to be
dampened the rate of carbon emission growth
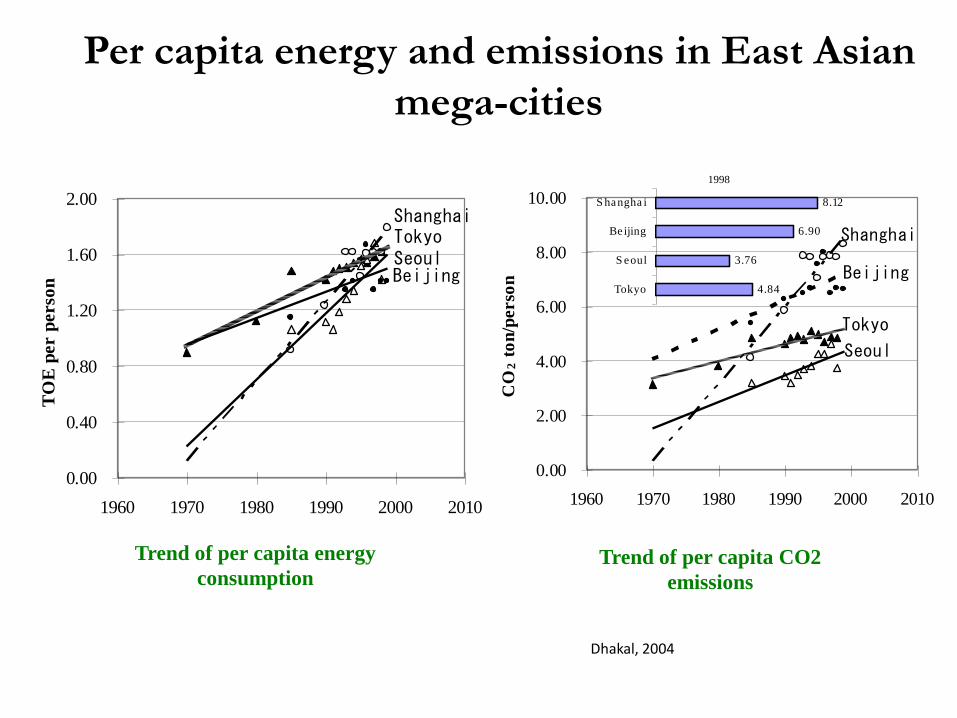
Per capita energy and emissions in East Asian
mega-cities
Trend of per capita energy
consumptionTrend of per capita CO2
emissions
0.00
2.00
4.00
6.00
8.00
10.00
1960 1970 1980 1990 2000 2010C
O2 t
on
/perso
n Beijing
Tokyo
Shanghai
Seoul
0.00
0.40
0.80
1.20
1.60
2.00
1960 1970 1980 1990 2000 2010
TO
E p
er p
erso
n
TokyoShanghai
SeoulBeijing
4.84
3.76
6.90
8.12
Tokyo
S eoul
Be ijing
S hangha i
1998
Dhakal, 2004
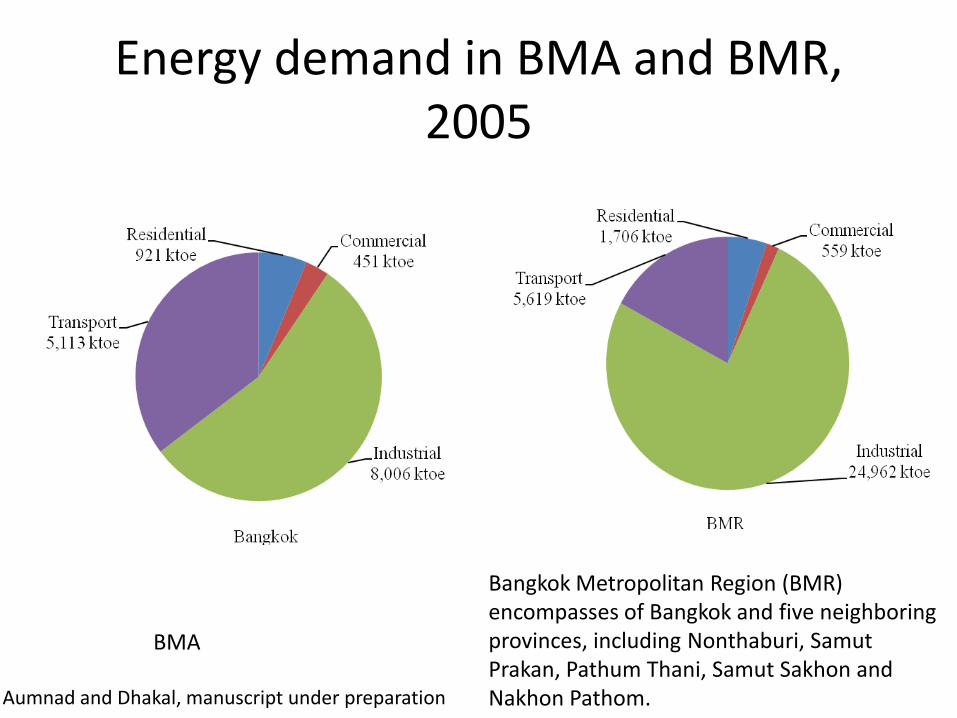
Energy demand in BMA and BMR, 2005
BMA
Bangkok Metropolitan Region (BMR) encompasses of Bangkok and five neighboring provinces, including Nonthaburi, SamutPrakan, Pathum Thani, Samut Sakhon and Nakhon Pathom.Aumnad and Dhakal, manuscript under preparation
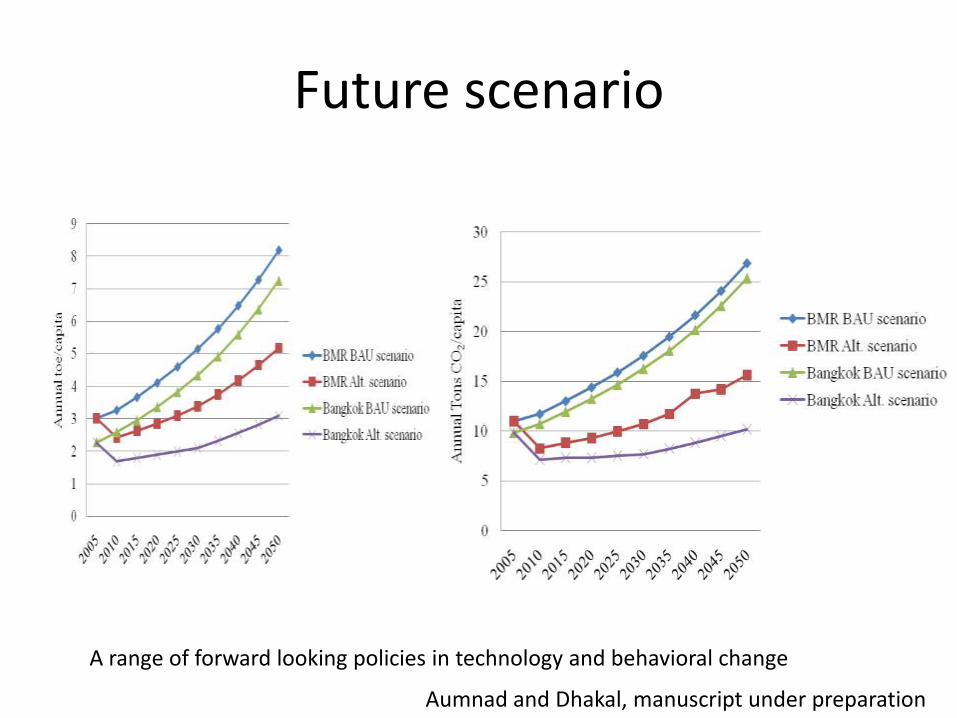
Future scenario
Aumnad and Dhakal, manuscript under preparation
A range of forward looking policies in technology and behavioral change
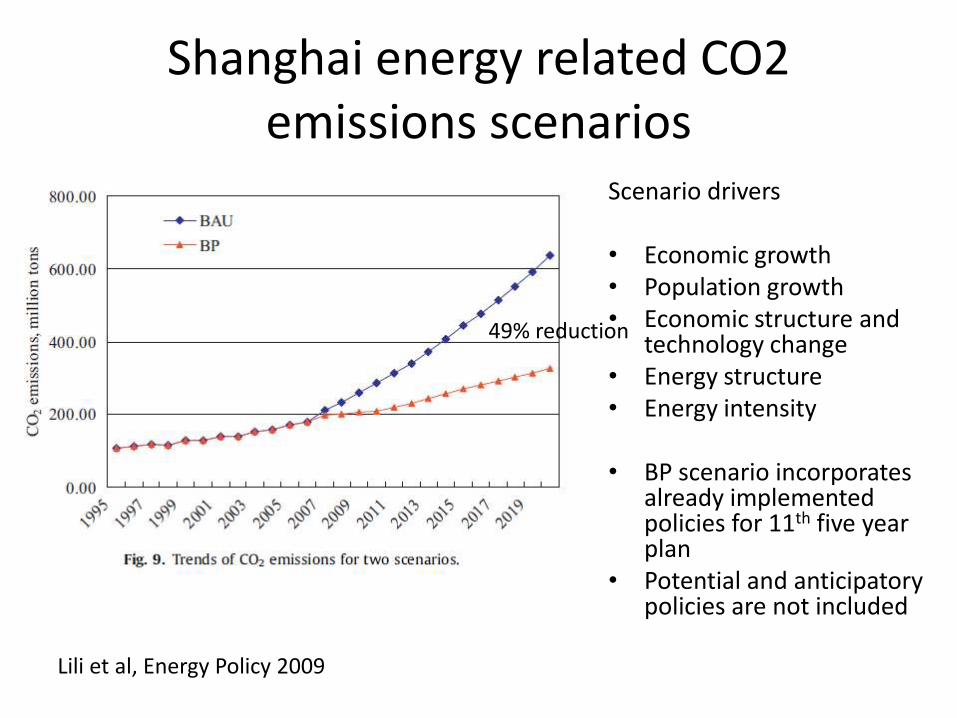
Shanghai energy related CO2 emissions scenarios
Scenario drivers
• Economic growth• Population growth• Economic structure and
technology change • Energy structure• Energy intensity
• BP scenario incorporates already implemented policies for 11th five year plan
• Potential and anticipatory policies are not included
Lili et al, Energy Policy 2009
49% reduction
Urban GHG accounting • Problems
– Scope of GHG accounting (sector coverage)
– Attributing aviation and marine transports
– Trans-boundary transport
– Setting city’s responsibility with due care to city functions, natural conditions and consumption related upstream emission
– Consistent methodology of accounting and data
IPCC inventory method
• Energy
• Non-Energy Emissions from Industrial Processes and Product Use
• Agriculture, Forestry and Other Land Use (AFOLU)
• Waste
WRI Corporate Protocol
• Scope 1: Owned / controlled sources operating within corporate boundary
• Scope 2: Electricity consumed by the company, generated “outside”
• Scope 3 (optional): Consequence of the activities of the company• WRI recommends a small set of most relevant Scope 3 items to create win-win GHG mitigation
strategies.
• ICLEI– Accounting software (city government to community wide using
simple methods with roots in IPCC method but electricity is attributed to cities)
– Recent updated ICLEI community wide protocol uses WRI Scopes 1-2-3• Cross-Boundary Scope 3 items listed as “information items”, but are
variable

46
Why Consider Out-of-Boundary Items?
• Logic: Electricity produced “outside” is already being counted; boundary is blurred
• More holistic: Per capita city-scale emissions from in boundary activities typically less than national per capita in developed countries
• Avoid Perverse Incentives: Avoid crediting emission shifts to the “outside”: e.g., hydrogen fueled transport
• Create win-win policies: Incentivize cross-boundary, cross-sector policies: e.g., sustainable food diets, green concrete, ICT strategies (e.g., teleconferencing)
• Communicate consistently with public: Consistently include major human activities at all scales from personal-scale to city-scale to national-scale
Slide Source: Kennedy, Ramaswami, Carney and Dhakal, 2009 (URS 2009 Symposium, Marseille, The World Bank)
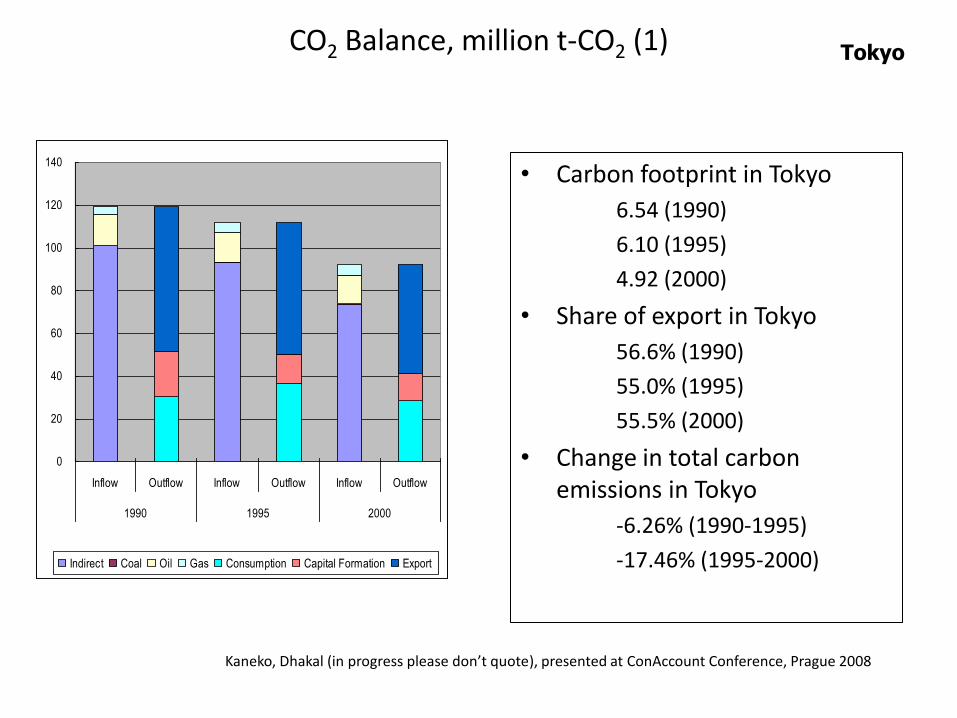
CO2 Balance, million t-CO2 (1)
• Carbon footprint in Tokyo
6.54 (1990)
6.10 (1995)
4.92 (2000)
• Share of export in Tokyo
56.6% (1990)
55.0% (1995)
55.5% (2000)
• Change in total carbon emissions in Tokyo
-6.26% (1990-1995)
-17.46% (1995-2000)
0
20
40
60
80
100
120
140
Inflow Outflow Inflow Outflow Inflow Outflow
1990 1995 2000
Indirect Coal Oil Gas Consumption Capital Formation Export
Tokyo
Kaneko, Dhakal (in progress please don’t quote), presented at ConAccount Conference, Prague 2008
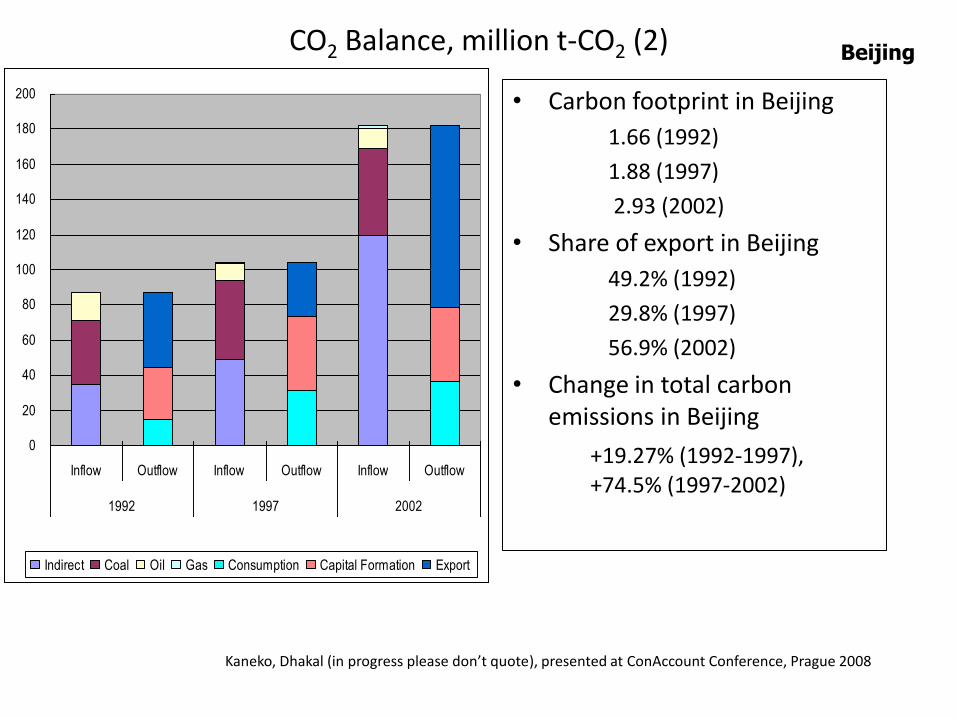
CO2 Balance, million t-CO2 (2)
• Carbon footprint in Beijing
1.66 (1992)
1.88 (1997)
2.93 (2002)
• Share of export in Beijing
49.2% (1992)
29.8% (1997)
56.9% (2002)
• Change in total carbon emissions in Beijing
+19.27% (1992-1997), +74.5% (1997-2002)
0
20
40
60
80
100
120
140
160
180
200
Inflow Outflow Inflow Outflow Inflow Outflow
1992 1997 2002
Indirect Coal Oil Gas Consumption Capital Formation Export
Beijing
Kaneko, Dhakal (in progress please don’t quote), presented at ConAccount Conference, Prague 2008
Summary
• The speed and size of global urbanization has been unprecedented for last 100 years and more specifically after second half of 1900s
• Urban data are a good reference but one should be aware of its limitations, especially in cross-comparisons
• The varying definition of “urban”, choice of “energy accounting framework”, and “responsibility-setting” can swing urban energy and carbon estimates
• 67% of global energy is used in urban areas and they are responsible for 71% of energy related CO2
• Most of the future global CO2 growth will come from urban areas from non-OECD countries- impose serious challenges
Summary
• China is and will play bigger role in determining global urban energy and emissions in the future. Urban area contribute 85% of China energy related CO2 emissions – Thus urban energy and carbon play key roles for multiple policy
objectives such as 20% EI reduction targeted, China’s 45% CO2 intensity reduction commitment in Copenhagen, energy security, and local pollution control
• China’s 35 largest cities have enormous and disproportionate influence in shaping nation’s energy and carbon future (40%). However, there are different pathways within them. They are also economy-carbon flashpoint for conflicts and solutions.
• Big cities are important
Summary
• Analyses from Bangkok, Shanghai and other existing studies are showing that a lot can be achieved from energy related interventions for carbon mitigation
• Energy provides a good entry point for carbon management with plenty local benefits
• The fact that city’s energy/carbon footprints are high needs new considerations for allocating responsibility -the ultimate goal should be to lesson footprint of cities– For developing cities: dampening footprint growth– For developed cities: reducing footprints considerably


![Carbon Emissions and Population Growth - Brown University · and urbanization on carbon emissions [16, 3, 2]. We build on this literature by expressly examining](https://static.fdocuments.net/doc/165x107/5aec76bf7f8b9a585f8ed85b/carbon-emissions-and-population-growth-brown-university-urbanization-on-carbon.jpg)


