Low-altitude, high-resolution aerial imaging systems for ...
12
Europ. J. Agronomy 70 (2015) 112–123 Contents lists available at ScienceDirect European Journal of Agronomy journal homepage: www.elsevier.com/locate/eja Review Low-altitude, high-resolution aerial imaging systems for row and field crop phenotyping: A review Sindhuja Sankaran a,b,∗ , Lav R. Khot b,a , Carlos Zú ˜ niga Espinoza a , Sanaz Jarolmasjed a , Vidyasagar R. Sathuvalli c , George J. Vandemark d , Phillip N. Miklas e , Arron H. Carter f , Michael O. Pumphrey f , N. Richard Knowles g , Mark J. Pavek g a Department of Biological Systems Engineering, Washington State University, PO Box 646120, Pullman, WA 99164, USA b Center for Precision and Automated Agricultural Systems, Department of Biological Systems Engineering, Washington State University, 24106 North Bunn Road, Prosser, WA 99350, USA c Hermiston Agricultural Research and Extension Center, Department of Crop and Soil Science, Oregon State University, 2121 S. 1st Street, Hermiston, OR 97838, USA d Grain Legume Genetics and Physiology Research Unit, United States Department of Agriculture-Agricultural Research Service, PO Box 646434, Pullman, WA 99164, USA e Vegetable and Forage Crops Production Research Unit, United States Department of Agriculture-Agricultural Research Service, 24106 North Bunn Road, Prosser, WA 99350, USA f Department of Crop and Soil Sciences, Washington State University, PO Box 646420, Pullman, WA 99164, USA g Department of Horticulture, Washington State University, PO Box 646414, Pullman, WA 99164, USA article info Article history: Received 18 March 2015 Received in revised form 15 July 2015 Accepted 20 July 2015 Available online 15 August 2015 Keywords: Aerial imaging Data mining Crop breeding High-throughput field phenomics abstract Global plant genetics research efforts have focused on developing high yielding, stress tolerant, and disease resistant row and field crop varieties that are more efficient in their use of agronomic inputs (water, nutrients, pesticides, etc.). Until recently, a key bottleneck in such research was the lack of high-throughput sensing technologies for effective and rapid evaluation of expressed phenotypes under field conditions for holistic data-driven decision making and variety selection. This review focuses on technological aspects of integrating unmanned aerial vehicles with imaging systems to enhance field phenotyping capabilities. The state-of-the-art of unmanned aerial vehicle technology for various appli- cations including crop emergence, vigor, and characterization of yield potential of row and field crops has been reviewed. The potential of using aerial imaging to evaluate resistance/susceptibility to biotic and abiotic stress for crop breeding and precision production management has been discussed along with future perspectives and developments. © 2015 Elsevier B.V. All rights reserved. Contents 1. Introduction ........................................................................................................................................... 113 2. Overview of small unmanned aerial vehicles ......................................................................................................... 113 3. Sensor integration with small UAVs .................................................................................................................. 113 4. Applications of high-resolution aerial sensing in field phenomics ................................................................................... 115 4.1. Plant water stress .............................................................................................................................. 115 4.2. Plant nutrient deficiency and heat stress ...................................................................................................... 116 4.3. Plant biotic stress .............................................................................................................................. 117 4.4. Plant growth parameters ...................................................................................................................... 118 4.5. Crop yield potential assessment ............................................................................................................... 119 4.6. Other applications ............................................................................................................................. 119 5. Concluding remarks and future perspective .......................................................................................................... 121 Acknowledgement .................................................................................................................................... 121 References ............................................................................................................................................. 121 ∗ Corresponding author at: Department of Biological Systems Engineering, Washington State University, PO Box 646120, Pullman, WA 99164, USA. Tel.: +1 509 335 8828. E-mail address: [email protected] (S. Sankaran). http://dx.doi.org/10.1016/j.eja.2015.07.004 1161-0301/© 2015 Elsevier B.V. All rights reserved.
Transcript of Low-altitude, high-resolution aerial imaging systems for ...

Europ. J. Agronomy 70 (2015) 112–123
Contents lists available at ScienceDirect
European Journal of Agronomy
journa l homepage: www.e lsev ier .com/ locate /e ja
Review
Low-altitude, high-resolution aerial imaging systems forrow and field crop phenotyping: A reviewSindhuja Sankarana,b,∗, Lav R. Khotb,a, Carlos Zúniga Espinozaa, Sanaz Jarolmasjeda,Vidyasagar R. Sathuvalli c, George J. Vandemarkd, Phillip N. Miklase, Arron H. Carter f,Michael O. Pumphreyf, N. Richard Knowlesg, Mark J. Pavekg
a Department of Biological Systems Engineering, Washington State University, PO Box 646120, Pullman, WA 99164, USAb Center for Precision and Automated Agricultural Systems, Department of Biological Systems Engineering, Washington State University, 24106 North BunnRoad, Prosser, WA 99350, USAc Hermiston Agricultural Research and Extension Center, Department of Crop and Soil Science, Oregon State University, 2121 S. 1st Street, Hermiston, OR97838, USAd Grain Legume Genetics and Physiology Research Unit, United States Department of Agriculture-Agricultural Research Service, PO Box 646434, Pullman,WA 99164, USAe Vegetable and Forage Crops Production Research Unit, United States Department of Agriculture-Agricultural Research Service, 24106 North Bunn Road,Prosser, WA 99350, USAf Department of Crop and Soil Sciences, Washington State University, PO Box 646420, Pullman, WA 99164, USAg Department of Horticulture, Washington State University, PO Box 646414, Pullman, WA 99164, USA
a r t i c l e i n f o
Article history:Received 18 March 2015Received in revised form 15 July 2015Accepted 20 July 2015Available online 15 August 2015
Keywords:Aerial imagingData miningCrop breedingHigh-throughput field phenomics
a b s t r a c t
Global plant genetics research efforts have focused on developing high yielding, stress tolerant, anddisease resistant row and field crop varieties that are more efficient in their use of agronomic inputs(water, nutrients, pesticides, etc.). Until recently, a key bottleneck in such research was the lack ofhigh-throughput sensing technologies for effective and rapid evaluation of expressed phenotypes underfield conditions for holistic data-driven decision making and variety selection. This review focuses ontechnological aspects of integrating unmanned aerial vehicles with imaging systems to enhance fieldphenotyping capabilities. The state-of-the-art of unmanned aerial vehicle technology for various appli-cations including crop emergence, vigor, and characterization of yield potential of row and field crops hasbeen reviewed. The potential of using aerial imaging to evaluate resistance/susceptibility to biotic andabiotic stress for crop breeding and precision production management has been discussed along withfuture perspectives and developments.
© 2015 Elsevier B.V. All rights reserved.
Contents
1. Introduction . . . . . . . . . . . . . . . . . . . . . . . . . . . . . . . . . . . . . . . . . . . . . . . . . . . . . . . . . . . . . . . . . . . . . . . . . . . . . . . . . . . . . . . . . . . . . . . . . . . . . . . . . . . . . . . . . . . . . . . . . . . . . . . . . . . . . . . . . . . 1132. Overview of small unmanned aerial vehicles . . . . . . . . . . . . . . . . . . . . . . . . . . . . . . . . . . . . . . . . . . . . . . . . . . . . . . . . . . . . . . . . . . . . . . . . . . . . . . . . . . . . . . . . . . . . . . . . . . . . . . . . . 1133. Sensor integration with small UAVs . . . . . . . . . . . . . . . . . . . . . . . . . . . . . . . . . . . . . . . . . . . . . . . . . . . . . . . . . . . . . . . . . . . . . . . . . . . . . . . . . . . . . . . . . . . . . . . . . . . . . . . . . . . . . . . . . . 1134. Applications of high-resolution aerial sensing in field phenomics . . . . . . . . . . . . . . . . . . . . . . . . . . . . . . . . . . . . . . . . . . . . . . . . . . . . . . . . . . . . . . . . . . . . . . . . . . . . . . . . . . . 115
4.1. Plant water stress . . . . . . . . . . . . . . . . . . . . . . . . . . . . . . . . . . . . . . . . . . . . . . . . . . . . . . . . . . . . . . . . . . . . . . . . . . . . . . . . . . . . . . . . . . . . . . . . . . . . . . . . . . . . . . . . . . . . . . . . . . . . . . 1154.2. Plant nutrient deficiency and heat stress . . . . . . . . . . . . . . . . . . . . . . . . . . . . . . . . . . . . . . . . . . . . . . . . . . . . . . . . . . . . . . . . . . . . . . . . . . . . . . . . . . . . . . . . . . . . . . . . . . . . . . 1164.3. Plant biotic stress . . . . . . . . . . . . . . . . . . . . . . . . . . . . . . . . . . . . . . . . . . . . . . . . . . . . . . . . . . . . . . . . . . . . . . . . . . . . . . . . . . . . . . . . . . . . . . . . . . . . . . . . . . . . . . . . . . . . . . . . . . . . . . 1174.4. Plant growth parameters . . . . . . . . . . . . . . . . . . . . . . . . . . . . . . . . . . . . . . . . . . . . . . . . . . . . . . . . . . . . . . . . . . . . . . . . . . . . . . . . . . . . . . . . . . . . . . . . . . . . . . . . . . . . . . . . . . . . . . 1184.5. Crop yield potential assessment . . . . . . . . . . . . . . . . . . . . . . . . . . . . . . . . . . . . . . . . . . . . . . . . . . . . . . . . . . . . . . . . . . . . . . . . . . . . . . . . . . . . . . . . . . . . . . . . . . . . . . . . . . . . . . . 1194.6. Other applications . . . . . . . . . . . . . . . . . . . . . . . . . . . . . . . . . . . . . . . . . . . . . . . . . . . . . . . . . . . . . . . . . . . . . . . . . . . . . . . . . . . . . . . . . . . . . . . . . . . . . . . . . . . . . . . . . . . . . . . . . . . . . 119
5. Concluding remarks and future perspective . . . . . . . . . . . . . . . . . . . . . . . . . . . . . . . . . . . . . . . . . . . . . . . . . . . . . . . . . . . . . . . . . . . . . . . . . . . . . . . . . . . . . . . . . . . . . . . . . . . . . . . . . . 121Acknowledgement . . . . . . . . . . . . . . . . . . . . . . . . . . . . . . . . . . . . . . . . . . . . . . . . . . . . . . . . . . . . . . . . . . . . . . . . . . . . . . . . . . . . . . . . . . . . . . . . . . . . . . . . . . . . . . . . . . . . . . . . . . . . . . . . . . . . 121References . . . . . . . . . . . . . . . . . . . . . . . . . . . . . . . . . . . . . . . . . . . . . . . . . . . . . . . . . . . . . . . . . . . . . . . . . . . . . . . . . . . . . . . . . . . . . . . . . . . . . . . . . . . . . . . . . . . . . . . . . . . . . . . . . . . . . . . . . . . . . 121
∗ Corresponding author at: Department of Biological Systems Engineering, Washington State University, PO Box 646120, Pullman, WA 99164, USA. Tel.: +1 509 335 8828.E-mail address: [email protected] (S. Sankaran).
http://dx.doi.org/10.1016/j.eja.2015.07.0041161-0301/© 2015 Elsevier B.V. All rights reserved.

S. Sankaran et al. / Europ. J. Agronomy 70 (2015) 112–123 113
1. Introduction
Accelerated crop improvement techniques are needed to satisfythe global food production demands (Alston et al., 2009; Godfrayet al., 2010), and counter the unprecedented abiotic and bioticstress conditions (Garrett et al., 2006; Mittler and Blumwald, 2010).In the last 20 years, advances in DNA sequencing and molecu-lar technologies has significantly improved knowledge of plantgenomes; however, current methods to phenotype crops remainslow, expensive, labor-intensive, and often destructive (Furbankand Tester, 2011; Walter et al., 2012; White et al., 2012; Cobb et al.,2013; Dhondt et al., 2013; Fiorani and Schurr, 2013; Araus andCairns, 2014). Since 2010, rapid high-throughput crop phenotypingmethods or ‘phenomics’ have been discussed as an approach thatcould significantly improve phenotyping efforts for plant breed-ing (Furbank and Tester, 2011; Walter et al., 2012; White et al.,2012; Cabrera-Bosquet et al., 2012; Dhondt et al., 2013; Fioraniand Schurr, 2013; Yang et al., 2013; Cobb et al., 2013; Araus andCairns, 2014; Prashar and Jones, 2014; Deery et al., 2014). Thesetechniques include the application of fluorescence sensing for esti-mating photosynthesis (Baker, 2008; Munns et al., 2010; Tuberosa,2012), visible imaging for shoot biomass estimation (Berger et al.,2010; Golzarian et al., 2011), visible-near infrared spectroscopy foridentifying physiological changes induced by water and nutrientstresses (Penuelas et al., 1994; van Maarschalkerweerd et al., 2013),and thermal imaging for detecting water stress (Jones et al., 2009).Field phenotyping is a critical component of crop improvementthrough genetics, as it is the ultimate expression of the relativeeffects of genetic factors, environmental factors, and their inter-action on critical production traits such as yield potential andtolerance to abiotic/biotic stresses (White et al., 2012; Araus andCairns, 2014). Factors such as soil characteristics, rainfall, tempera-ture, and weather events along with the presence of disease, insectpests, and weeds greatly influence plant performance and affect theefficiency of selection across years. High-throughput phenotypingmethods may be able to better account for these environmen-tal variations than current practices, thereby increasing selectionefficiency.
Both ground- and field-based platforms have been consideredfor field-based phenomics (White et al., 2012; Andrade-Sanchezet al., 2014; White and Conley, 2013; Araus and Cairns, 2014;Prashar and Jones, 2014; Deery et al., 2014). The ground-basedsensing platforms have significant benefits, one of which is plot-level data captured with global positioning systems (GPS) enablednavigation and geospatial analysis. However, from a technologydevelopment point of view, there is no unique “fit for all” groundplatform that can be used to phenotype diverse crops. The challengehas been developing cost-effective rapid field phenotyping plat-forms that can be adjusted in relation to row and plant spacing aswell as to account for inconsistencies in plot sizes and plant heightbetween different crops or different practices used by individualprograms. There are other challenges that can limit the potentialof ground-based platforms, which include (i) non-simultaneousmeasurement of different plots, which can take from minutes tohours, depending on the number of plots and plot size, (ii) com-paction of soil, and (iii) vibrations resulting from uneven terrainsurfaces. Some of these limitations can be addressed using high-resolution, low-altitude aerial platforms such as small unmannedaerial vehicles (UAVs). This review examines the potential of usinglow-altitude, high-resolution aerial imaging with UAVs for rapidphenotyping of crops in the field. Overview of UAVs and sensingsystems, potential phenotypic traits that can be evaluated, andchallenges needing further research and development to supportgenetics and other crop improvement programs are discussed. Thepaper is organized as follows: (1) overview of small UAVs, (2)integration of sensors with small UAVs, (3) application domain of
high-resolution aerial sensing in field phenomics, and (4) conclud-ing remarks and future perspectives.
2. Overview of small unmanned aerial vehicles
Sensors such as thermal cameras, hyperspectral camera, multi-spectral camera, and Light Detection and Ranging (LIDAR) systemscan be used for measuring crop growth and development (Zhangand Kovacs, 2012) as described in the following sub-section. How-ever, the selection of small UAVs to carry these sensors and achievedesired temporal frequency and high spatial resolution are charac-teristics that need to be considered before using UAVs in phenomicsresearch. Satellites are limited by frequency and spatial resolution.Similarly, ground-based sensing platforms pose difficultly in beingtransported from one location to another, may not be easy to gener-ate surface maps in real time, and cannot measure plant parametersfrom several plots at a time. Such difficulties can be addressed byuse of appropriate small UAVs to obtain data with desired tempo-ral frequency and spatial resolution (Lelong et al., 2008; Araus andCairns, 2014).
The vehicles with flying capacity without any person onboard toguide controls and decide direction or speed of the device are calledunmanned aerial vehicles (Eisenbeiss, 2004). Availability of UAVshas rapidly increased in recent years and several types, rangingfrom multicopters and helicopters to fixed wing, are now available(Zhang and Kovacs, 2012; Araus and Cairns, 2014). Broadly, smallUAVs can be classified into four types: parachutes, blimps, roto-copters, and fixed wing systems. Some of the factors influencingthe selection of these small UAVs in phenomics are summarized inTable 1.
Selection of a specific UAV type is conditional on desired applica-tion and limitations. Parachutes can be flown easily under no-windconditions, but cannot be operated under windy conditions. More-over, they cannot hover in a single location although they have lowspeeds and relatively short flight time. Blimps are commonly usedin commercial advertising; however they can also be used for aerialimaging. Although it is possible to obtain clear images of selectedareas because of their hovering capabilities, blimps are slow to bemoved from one location to another. In addition, blimps have largersurface area, which makes it difficult to be flown under windy con-ditions. The most widely used small UAV types are rotocopters andfixed wings. Rotocopters are copters that can fly at different alti-tudes driven by four to eight propellers. This platform has severaladvantages. They can hover at a given location, use GPS-based nav-igation, fly horizontally and vertically, and require very little spacefor take-off and landing. The major limitations for rotocopters arelower speed and flight time in comparison to fixed wing types.
Fixed wing UAVs have longer flight time and faster travelspeeds than multi-rotor UAV types. Nevertheless, they do nothave hovering capability. The speed of this UAV type can resultin image blurring, which can be addressed using imaging sensorswith improved capabilities including high shutter speed. Researchis ongoing to improve the battery technology that powers themulti-rotor and fixed wing UAVs to increase flight time. In regardto multi-rotors, a power tethered UAV (http://www.hoverflytech.com/livesky/) may also be a good option. Further advancements inflight time can derive from solar-powered platforms.
3. Sensor integration with small UAVs
A range of sensors can be integrated with the UAV platformsdepending on payload lift capabilities. The sensors (Table 2) canbe based on spectral interactions between object and the elec-tromagnetic spectrum such as reflectance or emission in visibleand infrared regions or time-of-flight of sound/light signals. The

114 S. Sankaran et al. / Europ. J. Agronomy 70 (2015) 112–123
Table 1Typical types of small unmanned aerial vehicles.a
Type Payloadb(kg) Flight timeb
(min)Benefits Limitations Examplesa
Parachute 1.5 10–30 • Simple operation • Not operable in windy conditions.• Have limited payload
HawkEye
Blimps >3.0 ∼600 • Simple operation • Not operable in windy conditions• Have limited payload
AB1100, Cameron FabricEngineering
Rotocopter 0.8–8.0 8–120 • Applicable with waypoint navigation• Hovering capabilities• Can hold range of sensors fromthermal, multispectral to hyperspectralcameras
• Payload may limit battery usage andflight time
DJI Inspire, Mikrocopter ARKOktoXL 6S12, Yamaha RMAX
Fixed wing 1.0–10 30–240 • Applicable with waypoint navigation• Better flight time• Multiple sensors can be mounted
• Limited hovering capacity• Lower speeds are required for imagestitching
Landcaster Precision Hawk,senseFly eBee
a Provided is an overview of different UAV platform types and there may be many commercial companies developing similar types.b Approximate values taken from manufacture provided specification.
Table 2Different types of sensors used in plant phenotype characterization.
Sensor type Details Applications Limitations Referencesa
Fluorescence sensor Passive sensing-visible andnear infrared regions
Photosynthesis,chlorophyll, water stress
• Not developed for UAVresearch yet• Can be subject tobackground noise
Chappelle et al. (1984),Gamon et al. (1990), Flexaset al. (2000), Evain et al.(2004), Xing et al. (2006),Chaerle et al. (2007)
Digital camera (RGB) Gray scale or color images(texture analysis)
Visible properties, outerdefects, greenness, growth
• Limited to visual spectralbands and properties
Lu et al. (2011), Kipp et al.(2014), Klodt et al. (2015)
Multispectralcamera/color-infraredcamera
Few spectral bands foreach pixel invisible-infrared region
Multiple plant responses tonutrient deficiency, waterstress, diseases amongothers
• Limited to few spectralbands
Lenk et al. (2007), Moshouet al. (2005), Blasco et al.(2007), Svensgaard et al.(2014), Zaman-Allah et al.(2015)
Hyperspectral camera Continuous or discretespectra for each pixel invisible-infrared region
Plant stress, producequality, and safety control
• Image processing ischallenging• Sensors can be expensive
Moshou et al. (2005),Delalieux et al. (2007),Gowen et al. (2007), Qinet al. (2009), Seiffert et al.(2010)
Thermal sensor/camera Temperature of each pixel(for sensor withradiometric calibration)related to thermal infraredemissions
Stomatal conductance,plant responses to waterstress and diseases
• Environmental conditionsaffect the performance• Very small temperaturedifferences are notdetectable• High resolution camerasare heavier
Chaerle and Van DerStraeten (2000), Leinonenand Jones (2004), Joneset al. (2009), Costa et al.(2013)
Spectrometer Visible-near infraredspectra averaged over agiven field-of-view
Detecting disease, stressand crop responses
• Background such as soilmay affect the data quality• Possibilities of spectralmixing• More applicable forground-based systems
Carter (1993), Belasqueet al. (2008), Delwiche andGraybosch (2002), Naiduet al. (2009)
3D camera Infrared laser baseddetection usingtime-of-flight information
Physical attributes such asplant height and canopydensity
• Lower accuracies• Field applications can belimiting
Jin and Tang (2009), Chénéet al. (2012)
LIDAR (Light Detection andRanging) sensor
Physical measuresresulting from laser(600–1000 nm)time-of-flight
Accurate estimates ofplant/tree height andvolume
• Sensitive to smallvariations in path length
Donoghue et al. (2007),Koenig et al. (2015),Müller-Linow et al. (2015)
SONAR (Sound Navigationand Ranging) sensor
Sound propagation is usedto detect objects based ontime-of-flight
Mapping andquantification of thecanopy volumes, digitalcontrol of application ratesin sprayers or fertilizerspreader
• Sensitivity limited byacoustic absorption,background noise, etc.• Lower sampling rate thanlaser-based sensing
Tumbo et al. (2002)
a Representative studies that have used specified sensor for listed applications.

S. Sankaran et al. / Europ. J. Agronomy 70 (2015) 112–123 115
applications of time-of-flight based sensors are commonly usedfor evaluating physical/morphological plant characteristics such asplant growth, height, and canopy volume/vigor. These parametersare important in evaluating plant performances during breeding,and can be indicative of yield potential (Wei et al., 2010; Ilkeret al., 2013; Alheit et al., 2014; Njogu et al., 2014). In regardto the spectroscopic and imaging techniques, a number of plantphenotypes such as disease susceptibility, susceptibility to droughtstress, chlorophyll content, nutrient concentrations, growth rates,and yield potential can be evaluated (Zhang and Kovacs,2012).
The plant trait can be related to wavelength of spectral radia-tion and amount of light energy emitted/absorbed, as sensed bythe detector in the sensing module. Fluorescence, visible, nearinfrared, multi/hyperspectral, and thermal spectroscopic tech-niques work on these principles, although each have their uniquecharacteristics. Such characteristics allow us to remotely sense keyplant traits. However, one of the limitations, especially for visi-ble to near-infrared-based sensing is that changes in ambient lightconditions can influence the signal intensity (spectral reflectancevalues). Therefore, it is very important to correct for the ambientlight conditions using reference calibration (e.g. Spectralon® Tar-gets, Labsphere Inc., traceable to the National Institute of Standardsand Technology, NIST) to compensate for the light variation fromone day to another, and within a day at different time periods or dueto cloud conditions. The changes in ambient light conditions canalso be partly compensated using spectral ratios (such as vegeta-tion indices) or a light sensor to estimate and correct for the incidentlight conditions. More information on some of these sensing tech-niques and data processing can be found in the literature (Lee et al.,2010; Sankaran et al., 2010; Zhang and Kovacs, 2012; Deery et al.,2014; Li et al., 2014).
4. Applications of high-resolution aerial sensing in fieldphenomics
Small UAVs with suitable sensors for remote sensing of plantresponses (to induced abiotic and biotic stress) and performance(yield) in field conditions have several benefits. The integratedsystem can provide (i) better access to the field, (ii) high-resolutiondata (1–2 cm depending on flying altitude), (iii) timely data collec-tion (even under cloudy conditions), (iv) quick evaluations of thefield growth conditions, (v) simultaneous image acquisition, (vi)self-automated flights for monitoring the plots at regular periodsin a given growing season; and (vii) low operational costs (Huntet al., 2008; Nebiker et al., 2008; Berni et al., 2009; Zhang andKovacs, 2012; Perry et al., 2012; Araus and Cairns, 2014). For exam-ple, accessing field plots with high plant volume/biomass in thefield or immediately after irrigation is challenging and can be timeconsuming. In this regard, using UAV provides higher operationalflexibility.
There are several remote sensing applications in precision agri-culture using small UAVs. Some of those include: weed detection(Herwitz et al., 2004; Göktogan et al., 2010; Torres-Sánchez et al.,2013; Rasmussen et al., 2013), aerobiological sampling (Techy et al.,2008; Schmale et al., 2008; Gonzalez et al., 2011; Aylor et al., 2011),leaf area index estimation (Hunt et al., 2008), soil characterization(Sugiura et al., 2007; d’Oleire-Oltmanns et al., 2012), water sta-tus (Sullivan et al., 2007; Berni et al., 2009; Suárez et al., 2010;Zarco-Tejada et al., 2012; Gago et al., 2015), diseases (Garcia-Ruizet al., 2013; Sankaran et al., 2013; Calderón et al., 2013, 2014),pest management (Huang et al., 2009) and yield estimation (Irmaket al., 2000; Swain et al., 2010) among others. Some of theseapplications are discussed in Zhang and Kovacs (2012). Pertinentphenomic applications for UAVs are detailed below.
4.1. Plant water stress
Water stress occurs when the plant-available water supply islower than the water required by a plant species. Plant water stresscan induce stomatal closure, which decreases photosynthesis andgrowth, and may exacerbate heat stress due to reduced transpira-tional cooling. Selection for water stress tolerance and increasedwater-use efficiency are core objectives in several breeding andagronomic research programs in the world, especially in the areaswith frequent drought episodes.
Temperature can be an indicator of stomatal conductance andresponse of plants to water stress (Jackson et al., 1977, 1981;Idso, 1982). Although the use of temperature in precision agricul-ture application has been established (Sullivan et al., 2007; Suárezet al., 2010; Zarco-Tejada et al., 2012; Gonzalez-Dugo et al., 2013;Gago et al., 2015), more recently, researchers are utilizing temper-ature in leaves to determine the plant tolerance to water stress inbreeding programs. Jones et al. (2009) and Chapman et al. (2014)demonstrated that plant temperature measurement under fieldconditions can be used effectively to select new varieties withwater stress resistance traits. The authors emphasized the needfor normalizing the imaging data to account for environmentalvariations in the readings. For phenotyping purposes, calibrationmay not be needed because the relative differences among geno-types are more important than the absolute data (Jones et al.,2009).
Thermal infrared data analysis requires elimination of back-ground temperature (soil, trunks, dead leaves) from thatattributable to leaves, especially when image pixels are bigger thanthat of the leaves (Giuliani and Flore, 1999; Jones et al., 2009; Jonesand Sirault, 2014). Methods to achieve this objective include theuse of sheet backgrounds that raise the temperature more than thatof the leaves to allow easier background elimination (Giuliani andFlore, 1999; Jones et al., 2009), determining bare soil and completecanopy cover temperatures by a regression between temperatureand percentage of leaves present in each image pixel (Jones et al.,2009), and masking the data over a known background tempera-ture (Chapman et al., 2014). Nevertheless, it is necessary to comparevisible and infrared images to know the coverage percent of thecanopy (Jones et al., 2009).
Thermal infrared sensing in combination with UAVs facili-tates scanning larger plot sizes, and may aid in selecting waterstress tolerant genotypes with less time and resources than tra-ditional methods (Jones et al., 2009; Chapman et al., 2014). Inaddition to thermal imaging, multispectral imaging can also aidin identifying water stress tolerant and susceptible genotypes.In Washington State University (WSU)-United States Depart-ment of Agriculture Agricultural Research Service (USDA-ARS)dry bean study, 20 most tolerant and 20 most susceptiblerecombinant inbred lines of dry bean were compared underterminal drought conditions (Trapp, 2015). The 40 lines (vari-eties) were planted in a randomized complete block design withtwo replications of non-stress and drought stress treatments.Aerial, high-resolution multispectral images were acquired at earlymid-pod set (growth stage) and expected to have maximum growthvigor (Fig. 1a). Plot-to-plot comparison of the modified green nor-malized difference vegetation index (GNDVI, green as visible band)estimates with that of the yield data (plot-to-plot comparison),resulted in a strong correlation with correlation coefficient of 0.79(p = 0.01, Fig. 1b). The GNDVI is vegetation index similar to nor-malized difference vegetation index (NDVI), where green band isused instead of red bands as in NDVI. The GNDVI can be moresensitive to wide range of chlorophyll concentrations than NDVI(Gitelson and Merzlyak, 1998). In addition, there was a strong asso-ciation in both non-stress and drought stress conditions, with bothsusceptible and tolerant dry bean varieties showing a significant

116 S. Sankaran et al. / Europ. J. Agronomy 70 (2015) 112–123
Fig. 1. UAV-based sensing of dry bean plant responses to water stress. (a) False color multiband image (NIR, G, B as RGB bands) of dry bean variety plots under irrigatedcontrol and drought stress treatments showing differences in crop canopy densities (note: compaction bands across the plots due to wheel tracks are more visible in droughtstress plots, marked in dotted line box), and (b) plot-to-plot comparison of GNDVI ([NIR − G]/[NIR + G]) estimated from image data with that of individual plot yield data. Thecorrelation coefficient (r) is inclusive of both treatments (control and drought).
correlation between NDVI and yield performance under both con-ditions (p = 0.01).
The limited plant growth (biomass) due to water stress cantypically be assessed using visible to near-infrared imaging. Impor-tantly, periodic thermal and visible to near-infrared imagingthroughout the crop growing season can provide vital qualitativeand quantitative data that can be related to ground-truth mea-surements. These approaches will result in developing robusthigh-throughput non-contact sensing methods for evaluatingplant traits and may eventually replace standard data collectionmethods.
4.2. Plant nutrient deficiency and heat stress
UAV-based sensing systems are rapid and efficient techniques toevaluate growth, yield and adaptation to stress in plants (Cabrera-Bosquet et al., 2012). Genotypes of most crop species showquantitative variation for abiotic stress tolerances, and differencesin nutrient- and water-use efficiencies. Although it is possible todetect differences in crop performance under different stress con-ditions (Fiorani and Schurr, 2013), more detailed research is neededto determine plant responses using real-time automated and non-destructive sensing technology. Research is needed to understandand modulate sensors that can detect and resolve specific abioticstresses such as nutrient, salinity, and heat.
Nutrient deficiency can result in visual symptoms such as lowerchlorophyll content, lower growth rate, tissue necrosis, and higherdisease susceptibility (DeTurk, 1941). These factors can be evalu-ated using UAV-based sensing techniques with relative ease (Zhu
et al., 2009; Agüera et al., 2011; Kaivosoja et al., 2013; Cilia et al.,2014; Li et al., 2015). In a low nitrogen application study in maize(Zaman-Allah et al., 2015) with multispectral camera mounted inUAV, a good correlation between nitrogen stress index and grainyield with r of 0.40–0.79 was achieved (p ≤ 0.05) with multiple Ntreatments. The crop senescence index was also correlated with theNDVI values (r = 0.84, p ≤ 0.01). The study indicated the potential ofUAV-based sensing in field phenotyping, with well-developed dataprocessing procedures and data management.
The evaluation of crop varieties resilient to salinity and heatstress can also be assessed efficiently using UAV-based sensing. Inthe case of salinity and heat stress, osmotic stress leads to stomatalclosure, decreased stomatal conductance, increased leaf temper-ature (Bowman and Strain, 1988; Wang et al., 2003; Microbes,2015), and decreased photosynthesis. These changes in photosyn-thetic rates and stomatal conductance can be detected by visibleto near-infrared spectral reflectance (Stong, 2008). Thermal imag-ing can also be used to detect plant primary responses to salinityand water stress as the temperature increases due to stomatal clo-sure (Leinonen and Jones, 2004; Jones et al., 2009; Costa et al.,2013).
Image acquisition systems mounted on small UAVs are widelyused in crop mapping for stress detection, due to their abilityto acquire images at high spatial, spectral, and temporal resolu-tions (Adams et al., 2000; Berni et al., 2009). Hairmansis et al.(2014) conducted an image-based study to detect salinity tolerancefor two varieties of rice (IR64 and Fatmawati). They successfullyused Red-Green-Blue (RGB) and fluorescence imaging, to sense tis-sue ion concentration, to differentiate between ionic and osmotic

S. Sankaran et al. / Europ. J. Agronomy 70 (2015) 112–123 117
stages of salinity stress and identify the genetic basis of salin-ity tolerance. Similarly, thermal images in combination with RGBimaging have been used to study canopy temperature changesin response to stomatal behavior and water deficit with datafrom Vicia faba L. and Vitis vinifera L. grown in greenhouse andfield conditions (Leinonen and Jones, 2004). Effect of tempera-ture was calculated assuming air temperature, active radiation,and relative humidity. Such crop sensing tools integrated withUAVs have potential for high-throughput crop phenotyping andmanagement applications in horticulture and field crops. Derivingcrop specific indicators (spectral signatures) for the above stress-ors to facilitate the development of specific, lightweight sensingmodules to be integrated with UAVs remains a key challenge andopportunity.
4.3. Plant biotic stress
The UAV-based disease management has three major applica-tions: (i) assessing the pest/disease development and symptoms(Yue et al., 2012; Garcia-Ruiz et al., 2013; Sankaran et al., 2013), (ii)assessing and monitoring the pathogen in atmosphere (Gonzalezet al., 2011; Aylor et al., 2011), and (iii) precision spraying (Cao et al.,2013; Faical et al., 2014). Evaluating the susceptibility of differentplant varieties to diseases caused by soil-borne fungal pathogens,nematodes, viruses, air-borne or vector-based fungal or bacterialinfections is a promising application. Remote sensing technologieshave been used for identifying and monitoring diseases (Nilsson,
1995; Kumar et al., 2012; Li et al., 2012; Usha and Singh, 2013). But,the application of UAV-based sensing for evaluating disease sever-ity, and susceptibility of different varieties to diseases is relativelyundeveloped.
A recent study on evaluating sugar beet varieties for Cer-cospora resistance indicated that simple vegetation indices such asnormalized difference vegetation index (NDVI), leaf water index(LWI) and Cercospora Leaf Spot Index (CLSI) could be correlated withdisease severity (Jansen et al., 2014). In WSU’s ongoing study, 20(Russets) and 30 (20 Russets + 10 Chip and Specialty) potato selec-tions/lines were screened with two replications to identify varietiesresistant and susceptible to viral (potato virus Y) and early die(Verticillium wilt) diseases, respectively. An aerial, high-resolutionmultispectral image was used to estimate the canopy vigor (leafarea) in terms of number of green pixels using GNDVI image, afterthresholding. A correlation with r of about 0.58–0.80 (Fig. 2) wasachieved when the estimated leaf area data of diseased plots at 40days after planting were compared with the potato yield data. Simi-larly, susceptibility to pathogen infections in plants can be assessedeffectively using UAV-based sensing without any bias or misinter-pretations.
Several researchers have used UAV-based sensing for diseasemonitoring in tree fruit production (Calderón et al., 2013, 2014;Garcia-Ruiz et al., 2013). A multispectral imaging sensor with sixdifferent spectral bands (530, 610, 690, 740, 850 and 900 nm)was used to detect Huanglongbing (HLB) infected trees in a cit-rus orchard. High-resolution multispectral images (5.5 cm/pixel)
20 40 60 80 10025
50
75
100
125
150
Canopy Vigor (x 100 Total Number of Pixels)
Yiel
d (x
100
0 kg
/ha)
r = 0.58
(a)
120 140 160 180 200 220 240
50
75
100
125
150
Canopy Vigor (x 100 Total Number of Pixels)
Yiel
d (x
100
0 kg
/ha)
r = 0.80
(b)
Fig. 2. Plot-by-plot comparison of UAV imaging-based canopy vigor at 40 days after planting and potato yield data in the field plots with (a) early die and (b) potato virus Yinfections. The canopy vigor was estimated as total number of green pixels after thresholding using GNDVI image to remove background.

118 S. Sankaran et al. / Europ. J. Agronomy 70 (2015) 112–123
Fig. 3. (a) GNDVI pseudocolor image of chickpeas field plots imaged from 30 m altitude, and (b) relationship between image-based canopy vigor and yield at 31 days and 66days after planting of 24 plots shown in (a). The four plots in the right represent border rows. The colors are assigned based on the GNDVI scale, for better visualization ofimage data. The canopy vigor was estimated as total number of green pixels after thresholding using GNDVI image to remove background.
with a suitable classification algorithm (support vector machine)could be used for identifying HLB-infected trees with up to85% accuracy. Amongst the different spectral bands, 710 nm pro-vided the most useful information. Similarly, Verticillium wiltin olive orchards was detected using high-resolution airbornehyperspectral and thermal imaging techniques (Calderón et al.,2013). Thermal data and Photochemical Reflectance Index (PRI)were significantly correlated with disease severity. Similar tech-niques can be applied to evaluate disease severity in breedingprograms.
4.4. Plant growth parameters
UAV-based sensing can also be used for evaluating plant growthparameters such as emergence (Sankaran et al., 2014), vigor, leafarea index (Hunt et al., 2010; Sugiura et al., 2005), and biomass.A recent study (Sankaran et al., 2014) evaluated emergence andspring stand after overwintering using GNDVI. Aerial multispectralimages of field plots were acquired to estimate GNDVI. Correlationbetween ground-truth emergence and spring stand ratings data,and image-based data was 0.86 (p < 0.0001). The technique wasuseful to identify winter wheat varieties that showed good emer-gence after planting combined with good winter hardiness, whichare important traits in the U.S. Pacific Northwest wheat productionregions.
In WSU-USDA-ARS chickpea trail, the chickpea plots wereimaged at 31 days and 66 days after planting. The chickpeaswere planted (randomized complete block design) at a densityof 43 seeds m−2 in a 1.5 m × 6.1 m block (≈430,000 seeds ha−1). Asthe remote sensing images were acquired in early growth stages,an altitude of 30 m was selected (Fig. 3a). A good correlation wasestablished between canopy vigor (total number green pixels afterthresholding with GNDVI image) and yield potential, especiallyfor images acquired at 66 days after planting (Fig. 3b). Interest-ingly, the r between number of plants manually counted at 27 daysafter planting and the image-based leaf area (number of pixels)at 31 days after planting was 0.66; and r between manual plantcount and the yield was 0.21. Similarly, GNDVI estimates extractedfrom a UAV-based multispectral camera were compared with leafarea index (LAI) from winter wheat field plots (Hunt et al., 2008,2010). Variable nitrogen application treatments resulted in LAI dif-ferences. A good relationship between NDVI values and LAI wasreported (R2 = 0.85). One of the limitations of using NDVI for esti-mating LAI could be that the NDVI saturates when canopies aregreener (i.e. higher NDVIs).
Another important trait that can be evaluated using UAV-basedimaging is plant maturity (Trapp, 2015; Khot et al., 2014). Forseveral crops such as chickpeas, dry beans, and potatoes, plantmaturity (degree of foliar senescence) is an important character-istic for variety selection. Similarly, other growth parameters suchas number of emerging plants to assess planting accuracy, efficacy
S. Sankaran et al. / Europ. J. Agronomy 70 (2015) 112–123 119
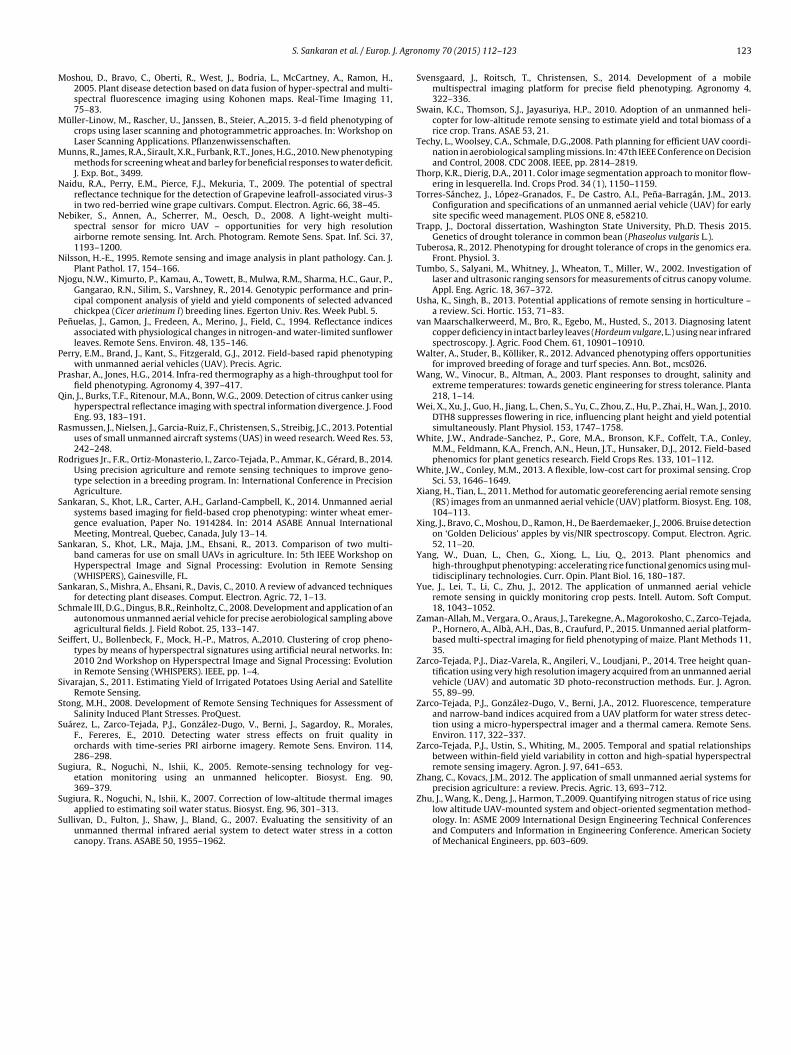
of germination-enhancing plant growth regulators, and genotypicdifferences can also be evaluated. Fig. 4 shows an example of emer-gence study in potatoes.
4.5. Crop yield potential assessment
Most breeding efforts for row and field crops have focused ondeveloping high yielding varieties that are resistant to disease,more efficient in their use of agronomic inputs, and can toleratemoderate levels of abiotic stressors. Plant flowering date (Marais,1985; Guo et al., 2015), number of heads (seeds) per plant, and size,volume, and weight at seeds/plant at harvest (Huddleston, 1978;Giri and Schillinger, 2003) of selected genotypes and check varietiesare common plant traits measured to establish yield potential ofthe new lines. Aerial platforms with adequately equipped portablemultispectral sensors can critically aid in evaluating the yieldpotential of new lines and quantification of larger field plots, whichhas been the limitation of ground-based physical assessments.Recent studies have used aerial imaging-derived vegetative indices(as summarized in Table 3) to estimate the yield potential of rowand field crops.
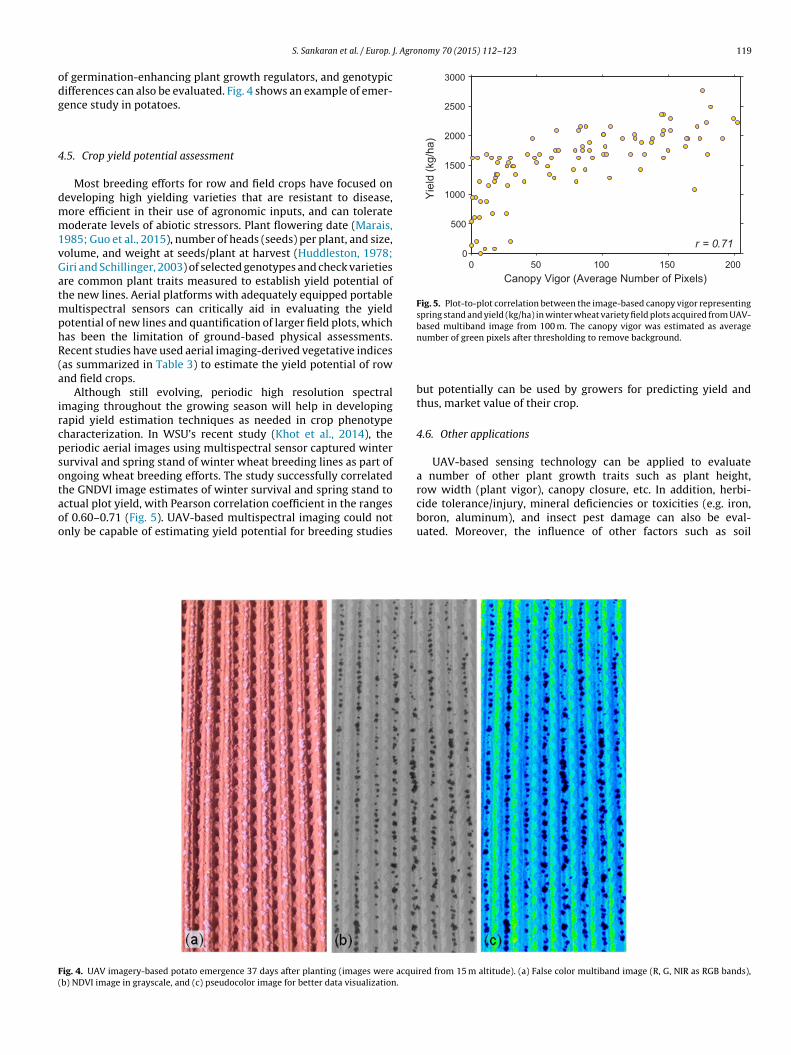
Although still evolving, periodic high resolution spectralimaging throughout the growing season will help in developingrapid yield estimation techniques as needed in crop phenotypecharacterization. In WSU’s recent study (Khot et al., 2014), theperiodic aerial images using multispectral sensor captured wintersurvival and spring stand of winter wheat breeding lines as part ofongoing wheat breeding efforts. The study successfully correlatedthe GNDVI image estimates of winter survival and spring stand toactual plot yield, with Pearson correlation coefficient in the rangesof 0.60–0.71 (Fig. 5). UAV-based multispectral imaging could notonly be capable of estimating yield potential for breeding studies
0 50 100 150 2000
500
1000
1500
2000
2500
3000
Canopy Vigor (Average Number of Pixels)
Yiel
d (k
g/ha
)
r = 0.71
Fig. 5. Plot-to-plot correlation between the image-based canopy vigor representingspring stand and yield (kg/ha) in winter wheat variety field plots acquired from UAV-based multiband image from 100 m. The canopy vigor was estimated as averagenumber of green pixels after thresholding to remove background.
but potentially can be used by growers for predicting yield andthus, market value of their crop.
4.6. Other applications
UAV-based sensing technology can be applied to evaluatea number of other plant growth traits such as plant height,row width (plant vigor), canopy closure, etc. In addition, herbi-cide tolerance/injury, mineral deficiencies or toxicities (e.g. iron,boron, aluminum), and insect pest damage can also be eval-uated. Moreover, the influence of other factors such as soil
Fig. 4. UAV imagery-based potato emergence 37 days after planting (images were acquired from 15 m altitude). (a) False color multiband image (R, G, NIR as RGB bands),(b) NDVI image in grayscale, and (c) pseudocolor image for better data visualization.

120 S. Sankaran et al. / Europ. J. Agronomy 70 (2015) 112–123
Table 3Examples of aerial (manned and unmanned) imaging based vegetative indices for yield estimation in row and field crops.
Crop Sensing details Yield ≈ f (VIs) References
Wheat (33genotypes)
Platform: Cessna 172 (manned)Sensors: Canon F1 & Kodak 2236Infrared filter (Wratten no. 12 gelatin filter)Resolution: 1: 6000 at 304 m altitudeImaging interval: 2 flights (weeks) June–JulyAnalysis software: ERDAS
Later growth stage: NDVIR2: 0.11–0.47
Ball and Konzak (1993)
Cotton Platform: – (manned)Sensors: Vis and NIR hyperspectral sensor (OKSI, Inc.)430–1012 nm with 10-nm bandwidthResolution: 1 m/pixelImaging interval: 12 flights (15 days) June–OctoberAnalysis software: ENVI 3.6
Early growth stage: RDVI,MTVI, OSAVILater growth stage: MCARI,TCARIR: 0.09–0.61
Zarco-Tejada et al.(2005)
Wheat (17genotypes)
Platform: Power glider (L’Avion Jaune) & Pixy (ABS-Aeroligt)Sensors: 3 channel Canon EOS350D and 4 channel Sony DSC-F828 with customfiltersResolution: 5 cm/pixel at 20–100 mImaging interval: 6 flights February–JuneAnalysis software: –
Early and later growthstage: LAI ≈ f (NDVI)RSE: 0.57
Lelong et al. (2008)
Rice Platform: X-Cell Fury 91, Miniature Aircraft, Billings, MTSensors: 3 channel Tetracam ADCResolution: 0.71 m/pixel at 20 mImaging interval: 65 days after plantingAnalysis software: Pixelwrench
Mid growth stage: NDVIR2: 0.76
Swain et al. (2010)
Potato Platform: Piper SenecaSensors: Kodak Megaplus 4.2i cameras customized for green, red, NIR bandsResolution: 1 mImaging interval: 3 flights (monthly) July–AugustAnalysis software: ERDAS
Later growth stage: SAVI,NDVIR2: 0.81
Sivarajan (2011)
Corn Platform: customized E-Trainer 182 (Graupner GmbH)Sensors: Mono-lithic miniature spectrometer MMS1 (Carl Zeiss GmbH)310–1100 nm (optimized to 360–900 nm)Resolution: 8–100 m altitudeImaging interval: 3 flight (monthly) August–OctoberAnalysis software: ArcGIS (ESRI). SigmaStat 3.5 (Dundas Software, Ltd.)
Early and soft dough stages:740/730, 760/730R2: 0.15–0.19
Link et al. (2013)
Wheat (112genotypes)
Platform: – (manned)Sensors: 6 channel multispectral cameraResolution: 0.3 m/pixel at 300 m altitudeImaging interval: 6 flights (weekly) March–AprilAnalysis software: –
Later growth stage: RDVI,TCARI, OSAVI, MCARI andGM1, NDVIR: −0.70 to 0.73
Rodrigues et al. (2014)
RDVI, Randomized Difference Vegetation Index; MTVI, Modified Triangular Vegetation Index; OSAVI, Optimized Soil-Adjusted Vegetation Index; MCARI, Modified ChlorophyllAbsorption Index; TCARI, Transformed Chlorophyll Absorption Index; NDVI, Normalized Difference Vegetative Index, GM1, Gitelson and Merzlyak; LAI, Leaf Area Index; RSE,Root Square Error; SAVI, Soil Adjusted Vegetation Index.
Table 4Summary of UAV-sensing based plant traits estimation in prior studies.
Phenotypic trait Standard method UAV-based sensing method References
Plant height Measuring scale LIDAR system. Technology is indevelopmental scale, although UAV-basedsystems are available. Important to knowthe elevation of the terrain. 3Dconstruction could be another possibility.
Merz and Chapman (2011),Zarco-Tejada et al. (2014)
Plant biomassPlant emergence
Visual rating; destructivesampling; Plant count
Visible-near infrared imaging to measurecanopy coverage.
Chapman et al. (2014),Sankaran et al. (2014), Khotet al. (2014)
Plant senescence Visual rating Visible to near-infrared imaging tomeasure plant greenness.
Adamsen et al. (1999)a,Khot et al. (2014)
Plant flowering Visual observation Visible imaging to estimate number offlowers.
Thorp and Dierig (2011)a,Granados et al. (2013)a
Water stress; stomatalconductance; Heat stress,salinity stress
Visual rating, soil moisturemeasurements, porometer
Visible, near and thermal infrared imagingto measure canopy temperature and waterabsorption bands. Plant growth can also berelated to abiotic stress.
Zarco-Tejada et al. (2012)
Nutrition Foliar and/or petiolenutrient analyses
Visible-near infrared imaging to estimateleaf nitrogen, and potentially othernutrients.
Jia et al. (2004)*,Lebourgeois et al. (2012)
Leaf area index Destructive sampling,plant canopy analyzer
Visible-near infrared imaging to estimateplant biomass and coverage. May getsaturated with LAI.
Hunt et al. (2010), Sugiuraet al. (2005)
Disease susceptibility Visual disease rating Visible-near infrared imaging for assessingplant health/damage. Similar techniquescan be applicable for toxicity studies.
Di Gennaro et al. (2012),Jansen et al. (2014)
a Non-UAV studies. The techniques can be integrated with low-altitude UAV-based sensing.

S. Sankaran et al. / Europ. J. Agronomy 70 (2015) 112–123 121
compaction (Fig. 1), field anomalies due to past production prac-tices (e.g. saline and low nutrient zones), presence of weeds, andsoil variability can also be easily assessed using aerial imaging.Table 4 summarizes some of the potential sensing methods forevaluating plant traits important for breeding lines and varietyselection.
5. Concluding remarks and future perspective
The successful implementation of UAVs for field phenotypingdepends on two major factors. The first factor is the charac-teristics of the UAV such as stability, safety, control, reliability,positioning, autonomy, sensor mount, and controller. The sec-ond important factor is the sensor characteristics such as specificspectral wavelengths, resolution, weight, calibration, and fieldof view. The UAV operation is often limited by sensor pay-load (size/weight), operating altitude (regulatory issues), andflight time (Ma et al., 2013; Deery et al., 2014). However,the above aspects of UAV technologies are rapidly improv-ing. In addition, an alternative flight time solution could beusing a powered tether to the UAV that would provide acontinuous source of power, and also satisfy the regulatory require-ments, especially in the United States. The U.S. Federal AviationAdministration (FAA) is currently developing rules and regu-lations to ensure privacy, safety, and security; while allowingUAV applications in agriculture. Another important aspect ofUAV-based phenomics applications is the development of data-processing algorithms or tools to convert the sensory data intouseful phenotypic data for variety selection and plant growth ingeneral. Image blur and geometric distortion corrections (Xiangand Tian, 2011; Zhang and Kovacs, 2012), image stitching, geo-referencing, and automated feature extraction capabilities need tobe improved to utilize the full potential of UAV technologies inphenomics research.
In summary, UAV provides an opportunity for high-throughputphenotyping of crops, thus addressing a current ‘bottleneck’ in theselection of superior genotypes in breeding and variety develop-ment programs. UAV can significantly accelerate the selection ofhigh-yielding crop varieties that are more efficient in their use ofagronomic inputs and with significant resistance to biotic and abi-otic stress. We predict that the use of UAV-based technology willgrow exponentially in the next few years, resulting in the devel-opment of robust aerial sensing-based crop phenotyping methodsavailable to the plant breeders and the research communityat large.
Acknowledgement
This activity was funded, in part, by USDA National Institute forFood and Agriculture, Hatch Project, 1002864 (WNP00821).
References
Adams, M.L., Norvell, W.A., Philpot, W.D., Peverly, J.H., 2000. Toward the discrimi-nation of manganese, zinc, copper, and iron deficiency in ‘Bragg’ soybean usingspectral detection methods. Agron. J. 92, 268–274.
Adamsen, F., Pinter, P.J., Barnes, E.M., LaMorte, R.L., Wall, G.W., Leavitt, S.W., Kimball,B.A., 1999. Measuring wheat senescence with a digital camera. Crop Sci. 39,719–724.
Agüera, F., Carvajal, F., Pérez, M., 2011. Measuring sun-flower nitrogen status froman unmanned aerial vehicle-based system and an on the ground device. Int. Arch.Photogramm. Remote Sens. Spat. Inf. Sci. 38, 33–37.
Alheit, K.V., Busemeyer, L., Liu, W., Maurer, H.P., Gowda, M., Hahn, V., Weissmann, S.,Ruckelshausen, A., Reif, J.C., Würschum, T., 2014. Multiple-line cross QTL map-ping for biomass yield and plant height in triticale (× Triticosecale Wittmack).Theor. Appl. Genet. 127, 251–260.
Alston, J.M., Beddow, J.M., Pardey, P.G., 2009. Agricultural research, productivity, andfood prices in the long run. Science 325, 1209–1210.
Andrade-Sanchez, P., Gore, M.A., Heun, J.T., Thorp, K.R., Carmo-Silva, A.E., French,A.N., Salvucci, M.E., White, J.W., 2014. Development and evaluation of a field-based high-throughput phenotyping platform. Funct. Plant Biol. 41, 68–79.
Araus, J.L., Cairns, J.E., 2014. Field high-throughput phenotyping: the new cropbreeding frontier. Trends Plant Sci. 19, 52–61.
Aylor, D.E., Schmale, D.G., Shields, E.J., Newcomb, M., Nappo, C.J., 2011. Tracking thepotato late blight pathogen in the atmosphere using unmanned aerial vehiclesand Lagrangian modeling. Agric. For. Meteorol. 151, 251–260.
Baker, N.R., 2008. Chlorophyll fluorescence: a probe of photosynthesis in vivo. Annu.Rev. Plant Biol. 59, 89–113.
Ball, S.T., Konzak, C.F., 1993. Relationship between grain yield and remotely-senseddata in wheat breeding experiments. Plant Breed. 110, 277–282.
Belasque Jr., J., Gasparoto, M., Marcassa, L., 2008. Detection of mechanical and diseasestresses in citrus plants by fluorescence spectroscopy. Appl. Opt. 47, 1922–1926.
Berger, B., Parent, B., Tester, M., 2010. High-throughput shoot imaging to studydrought responses. J. Exp. Bot. 61, 3519–3528.
Berni, J., Zarco-Tejada, P.J., Suárez, L., Fereres, E., 2009. Thermal and narrowband mul-tispectral remote sensing for vegetation monitoring from an unmanned aerialvehicle. IEEE Trans. Geosci. Remote Sens. 47, 722–738.
Blasco, J., Aleixos, N., Gómez, J., Moltó, E., 2007. Citrus sorting by identification ofthe most common defects using multispectral computer vision. J. Food Eng. 83,384–393.
Bowman, W.D., Strain, B.R., 1988. Physiological responses in two populations ofAndropogon glomeratus Walter BSP to short-term salinity. Oecologia 75, 78–82.
Cabrera-Bosquet, L., Crossa, J., von Zitzewitz, J., Serret, M.D., Luis Araus, J., 2012. High-throughput phenotyping and genomic selection: the frontiers of crop breedingconverge. J. Integr. Plant Biol. 54, 312–320.
Calderón, R., Navas Cortés, J.A., Lucena León, C., Zarco-Tejada, P.J., 2013. High-resolution hyperspectral and thermal imagery acquired from UAV platforms forearly detection of Verticillium wilt using fluorescence, temperature and narrow-band índices. In: Proceedings of the Workshop on UAV-based Remote SensingMethods for Monitoring Vegetation, vol. 94, pp. 7–14.
Calderón, R., Montes-Borrego, M., Landa, B., Navas-Cortés, J., Zarco-Tejada, P.,2014. Detection of downy mildew of opium poppy using high-resolutionmulti-spectral and thermal imagery acquired with an unmanned aerial vehicle.Precis. Agric. 15, 639–661.
Cao, H., Yang, Y., Pei, Z., Zhang, W., Ge, D., Sha, Y., Zhang, W., Fu, K., Liu, Y., Chen,Y., 2013. Intellectualized Identifying and Precision Control System for Horticul-tural Crop Diseases Based on Small Unmanned Aerial Vehicle, Computer andComputing Technologies in Agriculture VI. Springer, pp. 196–202.
Carter, G.A., 1993. Responses of leaf spectral reflectance to plant stress. Am. J. Bot.,pp. 239–243.
Chaerle, L., Leinonen, I., Jones, H.G., Van Der Straeten, D., 2007. Monitoring andscreening plant populations with combined thermal and chlorophyll fluores-cence imaging. J. Exp. Bot. 58, 773–784.
Chaerle, L., Van Der Straeten, D., 2000. Imaging techniques and the early detectionof plant stress. Trends Plant Sci. 5, 495–501.
Chapman, S.C., Merz, T., Chan, A., Jackway, P., Hrabar, S., Dreccer, M.F., Holland,E., Zheng, B., Ling, T.J., Jimenez-Berni, J., 2014. Pheno-copter: a low-altitude,autonomous remote-sensing robotic helicopter for high-throughput field-basedphenotyping. Agronomy 4, 279–301.
Chappelle, E.W., Wood, F.M., McMurtrey, J.E., Newcomb, W.W., 1984. Laser-inducedfluorescence of green plants: 1. A technique for the remote detection of plantstress and species differentiation. Appl. Opt. 23, 134–138.
Chéné, Y., Rousseau, D., Lucidarme, P., Bertheloot, J., Caffier, V., Morel, P., Belin, É.,Chapeau-Blondeau, F., 2012. On the use of depth camera for 3D phenotyping ofentire plants. Comput. Electron. Agric. 82, 122–127.
Cilia, C., Panigada, C., Rossini, M., Meroni, M., Busetto, L., Amaducci, S., Boschetti, M.,Picchi, V., Colombo, R., 2014. Nitrogen status assessment for variable rate fertil-ization in maize through hyperspectral imagery. Remote Sens. 6, 6549–6565.
Cobb, J.N., DeClerck, G., Greenberg, A., Clark, R., McCouch, S., 2013. Next-generationphenotyping: requirements and strategies for enhancing our understandingof genotype–phenotype relationships and its relevance to crop improvement.Theor. Appl. Genet. 126, 867–887.
Costa, J.M., Grant, O.M., Chaves, M.M., 2013. Thermography to exploreplant–environment interactions. J. Exp. Bot. 64, 3937–3949.
Deery, D., Jimenez-Berni, J., Jones, H., Sirault, X., Furbank, R., 2014. Proximal remotesensing buggies and potential applications for field-based phenotyping. Agron-omy 4, 349–379.
Delalieux, S., Van Aardt, J., Keulemans, W., Schrevens, E., Coppin, P., 2007. Detectionof biotic stress (Venturia inaequalis) in apple trees using hyperspectral data: non-parametric statistical approaches and physiological implications. Eur. J. Agron.27, 130–143.
Delwiche, S., Graybosch, R.A., 2002. Identification of waxy wheat by near-infraredreflectance spectroscopy. J. Cereal Sci. 35, 29–38.
DeTurk, E., 1941. Plant nutrient deficiency symptoms. Physiological basis. Ind. Eng.Chem. 33, 648–653.
Dhondt, S., Wuyts, N., Inzé, D., 2013. Cell to whole-plant phenotyping: the best isyet to come. Trends Plant Sci. 18, 428–439.
Di Gennaro, S.F., Benanchi, M., Primicerio, J., Fiorillo, E., Matese, A., Vaccari, F.P.,Genesio, L., Di Marco, S., Mugnai, L., Surico, G., 2012. Remote sensing byUAV (Unmanned Aerial Vehicles) for the detection of spatial distribution anddevelopment of grapevine trunk diseases. In: 8th International Workshop onGrapevine Trunk Diseases, Valencia, Spain.
d’Oleire-Oltmanns, S., Marzolff, I., Peter, K.D., Ries, J.B., 2012. Unmanned aerial vehi-cle (UAV) for monitoring soil erosion in Morocco. Remote Sens. 4, 3390–3416.

122 S. Sankaran et al. / Europ. J. Agronomy 70 (2015) 112–123
Donoghue, D.N., Watt, P.J., Cox, N.J., Wilson, J., 2007. Remote sensing of species mix-tures in conifer plantations using LiDAR height and intensity data. Remote Sens.Environ. 110, 509–522.
Eisenbeiss, H., 2004. A mini unmanned aerial vehicle (UAV): system overview andimage acquisition. Int. Arch. Photogramm. Remote Sens. Spat. Inf. Sci. 36.
Evain, S., Flexas, J., Moya, I., 2004. A new instrument for passive remote sensing:2. Measurement of leaf and canopy reflectance changes at 531 nm and theirrelationship with photosynthesis and chlorophyll fluorescence. Remote Sens.Environ. 91, 175–185.
Faical, B.S., Pessin, G., Geraldo Filho, P., Furquim, G., de Carvalho, A.C., Ueyama, J.,2014. Exploiting Evolution on UAV Control Rules for Spraying Pesticides on CropFields, Engineering Applications of Neural Networks. Springer, pp. 49–58.
Fiorani, F., Schurr, U., 2013. Future scenarios for plant phenotyping. Annu. Rev. PlantBiol. 64, 267–291.
Flexas, J., Briantais, J.-M., Cerovic, Z., Medrano, H., Moya, I., 2000. Steady-state and maximum chlorophyll fluorescence responses to water stress ingrapevine leaves: a new remote sensing system. Remote Sens. Environ. 73,283–297.
Furbank, R.T., Tester, M., 2011. Phenomics – technologies to relieve the phenotypingbottleneck. Trends Plant Sci. 16, 635–644.
Gago, J., Douthe, C., Coopman, R., Gallego, P., Ribas-Carbo, M., Flexas, J., Escalona,J., Medrano, H., 2015. UAVs challenge to assess water stress for sustainableagriculture. Agric. Water Manage. 153, 9–19.
Gamon, J., Field, C., Bilger, W., Björkman, O., Fredeen, A., Penuelas, J., 1990. Remotesensing of the xanthophyll cycle and chlorophyll fluorescence in sunflowerleaves and canopies. Oecologia 85, 1–7.
Garcia-Ruiz, F., Sankaran, S., Maja, J.M., Lee, W.S., Rasmussen, J., Ehsani,R., 2013. Comparison of two aerial imaging platforms for identifica-tion of Huanglongbing-infected citrus trees. Comput. Electron. Agric. 91,106–115.
Garrett, K., Dendy, S., Frank, E., Rouse, M., Travers, S., 2006. Climate change effectson plant disease: genomes to ecosystems. Annu. Rev. Phytopathol. 44, 489–509.
Giri, G.S., Schillinger, W.F., 2003. Seed priming winter wheat for germination, emer-gence, and yield. Crop Sci. 43, 2135–2141.
Gitelson, A.A., Merzlyak, M.N., 1998. Remote sensing of chlorophyll concentrationin higher plant leaves. Adv. Space Res. 22, 689–692.
Giuliani, R., Flore, J., 1999. Potential use of infra-red thermometry for the detectionof water stress in apple trees. In: III International Symposium on Irrigation ofHorticultural Crops, 537, pp. 383–392.
Godfray, H.C.J., Beddington, J.R., Crute, I.R., Haddad, L., Lawrence, D., Muir, J.F., Pretty,J., Robinson, S., Thomas, S.M., Toulmin, C., 2010. Food security: the challenge offeeding 9 billion people. Science 327, 812–818.
Göktogan, A.H., Sukkarieh, S., Bryson, M., Randle, J., Lupton, T., Hung, C., 2010. Arotary-wing unmanned air vehicle for aquatic weed surveillance and manage-ment. In: Selected Papers from the 2nd International Symposium on UAVs, Reno,Nevada, USA, June 8–10, 2009. Springer, pp. 467–484.
Golzarian, M.R., Frick, R.A., Rajendran, K., Berger, B., Roy, S., Tester, M., Lun, D.S., 2011.Accurate inference of shoot biomass from high-throughput images of cerealplants. Plant Methods 7, 1–11.
Gonzalez, F., Castro, M.P., Narayan, P., Walker, R., Zeller, L., 2011. Developmentof an autonomous unmanned aerial system to collect time-stamped samplesfrom the atmosphere and localize potential pathogen sources. J. Field Robot. 28,961–976.
Gonzalez-Dugo, V., Zarco-Tejada, P., Nicolás, E., Nortes, P., Alarcón, J., Intrigliolo,D., Fereres, E., 2013. Using high resolution UAV thermal imagery to assess thevariability in the water status of five fruit tree species within a commercialorchard. Precis. Agric. 14, 660–678.
Gowen, A., O’Donnell, C., Cullen, P., Downey, G., Frias, J., 2007. Hyperspectral imaging– an emerging process analytical tool for food quality and safety control. TrendsFood Sci. Technol. 18, 590–598.
Granados, J.A., Bonnet, P., Hansen, L.H., Schmidt, N.M., 2013. EcoIS: an image seri-alization library for plot-based plant flowering phenology. Ecol. Inform. 18,194–202.
Guo, W., Fukatsu, T., Ninomiya, S., 2015. Automated characterization of floweringdynamics in rice using field-acquired time-series RGB images. Plant Methods11, 7.
Hairmansis, A., Berger, B., Tester, M., Roy, S.J., 2014. Image-based phenotyping fornon-destructive screening of different salinity tolerance traits in rice. Rice 7, 16.
Herwitz, S., Johnson, L., Dunagan, S., Higgins, R., Sullivan, D., Zheng, J., Lobitz, B.,Leung, J., Gallmeyer, B., Aoyagi, M., 2004. Imaging from an unmanned aerialvehicle: agricultural surveillance and decision support. Comput. Electron. Agric.44, 49–61.
Huang, Y., Hoffmann, W., Lan, Y., Wu, W., Fritz, B., 2009. Development of aspray system for an unmanned aerial vehicle platform. Appl. Eng. Agric. 25,803–809.
Huddleston, H.F., 1978. Sampling Techniques for Measuring and Forecasting CropYields. ESCS-United States Dept. of Agriculture Economics.
Hunt, E., Hively, W.D., Daughtry, C.S., McCarty, G.W., Fujikawa, S.J., Ng, T., Tran-chitella, M., Linden, D.S., Yoel, D.W., 2008. Remote sensing of crop leaf area indexusing unmanned airborne vehicles. In: Proceedings of the Pecora 17 Symposium,Denver, CO.
Hunt, E.R., Hively, W.D., Fujikawa, S.J., Linden, D.S., Daughtry, C.S., McCarty, G.W.,2010. Acquisition of NIR-green-blue digital photographs from unmanned air-craft for crop monitoring. Remote Sens. 2, 290–305.
Idso, S.B., 1982. Non-water-stressed baselines: a key to measuring and interpretingplant water stress. Agric. Meteorol. 27, 59–70.
Ilker, E., Tonk, F.A., Tosun, M., Tatar, O., 2013. Effects of direct selection process forplant height on some yield components in common wheat (Triticum aestivum)genotypes. Int. J. Agric. Biol. 15, 795–797.
Irmak, S., Haman, D.Z., Bastug, R., 2000. Determination of crop water stress indexfor irrigation timing and yield estimation of corn. Agron. J. 92, 1221–1227.
Jackson, R., Idso, S., Reginato, R., Pinter, P., 1981. Canopy temperature as a crop waterstress indicator. Water Resour. Res. 17, 1133–1138.
Jackson, R., Reginato, R., Idso, S., 1977. Wheat canopy temperature: a practical toolfor evaluating water requirements. Water Resour. Res. 13, 651–656.
Jansen, M., Bergsträsser, S., Schmittgen, S., Müller-Linow, M., Rascher, U., 2014. Non-invasive spectral phenotyping methods can improve and accelerate cercosporadisease scoring in sugar beet breeding. Agriculture 4, 147–158.
Jia, L., Chen, X., Zhang, F., Buerkert, A., Römheld, V., 2004. Use of digital camera toassess nitrogen status of winter wheat in the northern China plain. J. Plant Nutr.27, 441–450.
Jin, J., Tang, L., 2009. Corn plant sensing using real-time stereo vision. J. Field Robot.26, 591–608.
Jones, H.G., Serraj, R., Loveys, B.R., Xiong, L., Wheaton, A., Price, A.H., 2009. Thermalinfrared imaging of crop canopies for the remote diagnosis and quantifica-tion of plant responses to water stress in the field. Funct. Plant Biol. 36,978–989.
Jones, H.G., Sirault, X.R., 2014. Scaling of thermal images at different spatial resolu-tion: the mixed pixel problem. Agronomy 4, 380–396.
Kaivosoja, J., Pesonen, L., Kleemola, J., Pölönen, I., Salo, H., Honkavaara, E., Saari,H., Mäkynen, J., Rajala, A., 2013. A case study of a precision fertilizer applica-tion task generation for wheat based on classified hyperspectral data from UAVcombined with farm history data. SPIE Remote Sens. Int. Soc. Opt. Photonics88870H.
Khot, L.R., Sankaran, S., Cummings, T., Johnson, D., Carter, A.H., Serra, S., Musacchi,S., 2014. Applications of unmanned aerial system in Washington state agricul-ture, Paper No. 1637. In: 12th International Conference on Precision Agriculture,Sacramento, CA, July 20–23.
Kipp, S., Mistele, B., Baresel, P., Schmidhalter, U., 2014. High-throughput pheno-typing early plant vigour of winter wheat. Eur. J. Agron. 52, 271–278.
Klodt, M., Herzog, K., Töpfer, R., Cremers, D., 2015. Field phenotyping of grapevinegrowth using dense stereo reconstruction. BMC Bioinform. 16, 143.
Koenig, K., Höfle, B., Hämmerle, M., Jarmer, T., Siegmann, B., Lilienthal, H., 2015.Comparative classification analysis of post-harvest growth detection from ter-restrial LiDAR point clouds in precision agriculture. ISPRS J. Photogram. RemoteSens. 104, 112–125.
Kumar, A., Lee, W.S., Ehsani, R.J., Albrigo, L.G., Yang, C., Mangan, R.L., 2012. Citrusgreening disease detection using aerial hyperspectral and multispectral imagingtechniques. J. Appl. Remote Sens. 6, 063542.
Lebourgeois, V., Bégué, A., Labbé, S., Houlès, M., Martiné, J., 2012. A light-weightmulti-spectral aerial imaging system for nitrogen crop monitoring. Precis. Agric.13, 525–541.
Lee, W., Alchanatis, V., Yang, C., Hirafuji, M., Moshou, D., Li, C., 2010. Sensing tech-nologies for precision specialty crop production. Comput. Electron. Agric. 74,2–33.
Leinonen, I., Jones, H.G., 2004. Combining thermal and visible imagery for esti-mating canopy temperature and identifying plant stress. J. Exp. Bot. 55,1423–1431.
Lelong, C.C., Burger, P., Jubelin, G., Roux, B., Labbé, S., Baret, F., 2008. Assessment ofunmanned aerial vehicles imagery for quantitative monitoring of wheat crop insmall plots. Sensors 8, 3557–3585.
Lenk, S., Chaerle, L., Pfündel, E.E., Langsdorf, G., Hagenbeek, D., Lichtenthaler, H.K.,Van Der Straeten, D., Buschmann, C., 2007. Multispectral fluorescence andreflectance imaging at the leaf level and its possible applications. J. Exp. Bot.58, 807–814.
Li, J., Zhang, F., Qian, X., Zhu, Y., Shen, G., 2015. Quantification of rice canopy nitrogenbalance index with digital imagery from unmanned aerial vehicle. Remote Sens.Lett. 6, 183–189.
Li, L., Zhang, Q., Huang, D., 2014. A review of imaging techniques for plant pheno-typing. Sensors 14, 20078–20111.
Li, X., Lee, W.S., Li, M., Ehsani, R., Mishra, A.R., Yang, C., Mangan, R.L., 2012. Spec-tral difference analysis and airborne imaging classification for citrus greeninginfected trees. Comput. Electron. Agric. 83, 32–46.
Link, J., Senner, D., Claupein, W., 2013. Developing and evaluating an aerial sensorplatform (ASP) to collect multispectral data for deriving management decisionsin precision farming. Comput. Electron. Agric. 94, 20–28.
Lu, H., Zheng, H., Hu, Y., Lou, H., Kong, X., 2011. Bruise detection on red bayberry(Myrica rubra Sieb. & Zucc.) using fractal analysis and support vector machine.J. Food Eng. 104, 149–153.
Ma, L., Li, M., Tong, L., Wang, Y., Cheng, L.,2013. Using unmanned aerial vehicle forremote sensing application. In: 2013 21st International Conference on Geoin-formatics (GEOINFORMATICS). IEEE, pp. 1–5.
Marais, G., 1985. Yield assessment of advanced wheat breeding lines the WinterRainfall Region of South Africa. I. Homogeneity of the region. S. Afr. J. Plant Soil2, 130–134.
Merz, T., Chapman, S., 2011. Autonomous unmanned helicopter system for remotesensing missions in unknown environments. Int. Arch. Photogram. Remote Sens.Spat. Inf. Sci., 31–38.
Microbes, B., 2015. Characterization of salinity-induced effects in olive trees basedon thermal imagery. Precis. Agric. 15, 1.
Mittler, R., Blumwald, E., 2010. Genetic engineering for modern agriculture: chal-lenges and perspectives. Annu. Rev. Plant Biol. 61, 443–462.
S. Sankaran et al. / Europ. J. Agronomy 70 (2015) 112–123 123
Moshou, D., Bravo, C., Oberti, R., West, J., Bodria, L., McCartney, A., Ramon, H.,2005. Plant disease detection based on data fusion of hyper-spectral and multi-spectral fluorescence imaging using Kohonen maps. Real-Time Imaging 11,75–83.
Müller-Linow, M., Rascher, U., Janssen, B., Steier, A.,2015. 3-d field phenotyping ofcrops using laser scanning and photogrammetric approaches. In: Workshop onLaser Scanning Applications. Pflanzenwissenschaften.
Munns, R., James, R.A., Sirault, X.R., Furbank, R.T., Jones, H.G., 2010. New phenotypingmethods for screening wheat and barley for beneficial responses to water deficit.J. Exp. Bot., 3499.
Naidu, R.A., Perry, E.M., Pierce, F.J., Mekuria, T., 2009. The potential of spectralreflectance technique for the detection of Grapevine leafroll-associated virus-3in two red-berried wine grape cultivars. Comput. Electron. Agric. 66, 38–45.
Nebiker, S., Annen, A., Scherrer, M., Oesch, D., 2008. A light-weight multi-spectral sensor for micro UAV – opportunities for very high resolutionairborne remote sensing. Int. Arch. Photogram. Remote Sens. Spat. Inf. Sci. 37,1193–1200.
Nilsson, H.-E., 1995. Remote sensing and image analysis in plant pathology. Can. J.Plant Pathol. 17, 154–166.
Njogu, N.W., Kimurto, P., Kamau, A., Towett, B., Mulwa, R.M., Sharma, H.C., Gaur, P.,Gangarao, R.N., Silim, S., Varshney, R., 2014. Genotypic performance and prin-cipal component analysis of yield and yield components of selected advancedchickpea (Cicer arietinum l) breeding lines. Egerton Univ. Res. Week Publ. 5.
Penuelas, J., Gamon, J., Fredeen, A., Merino, J., Field, C., 1994. Reflectance indicesassociated with physiological changes in nitrogen-and water-limited sunflowerleaves. Remote Sens. Environ. 48, 135–146.
Perry, E.M., Brand, J., Kant, S., Fitzgerald, G.J., 2012. Field-based rapid phenotypingwith unmanned aerial vehicles (UAV). Precis. Agric.
Prashar, A., Jones, H.G., 2014. Infra-red thermography as a high-throughput tool forfield phenotyping. Agronomy 4, 397–417.
Qin, J., Burks, T.F., Ritenour, M.A., Bonn, W.G., 2009. Detection of citrus canker usinghyperspectral reflectance imaging with spectral information divergence. J. FoodEng. 93, 183–191.
Rasmussen, J., Nielsen, J., Garcia-Ruiz, F., Christensen, S., Streibig, J.C., 2013. Potentialuses of small unmanned aircraft systems (UAS) in weed research. Weed Res. 53,242–248.
Rodrigues Jr., F.R., Ortiz-Monasterio, I., Zarco-Tejada, P., Ammar, K., Gérard, B., 2014.Using precision agriculture and remote sensing techniques to improve geno-type selection in a breeding program. In: International Conference in PrecisionAgriculture.
Sankaran, S., Khot, L.R., Carter, A.H., Garland-Campbell, K., 2014. Unmanned aerialsystems based imaging for field-based crop phenotyping: winter wheat emer-gence evaluation, Paper No. 1914284. In: 2014 ASABE Annual InternationalMeeting, Montreal, Quebec, Canada, July 13–14.
Sankaran, S., Khot, L.R., Maja, J.M., Ehsani, R., 2013. Comparison of two multi-band cameras for use on small UAVs in agriculture. In: 5th IEEE Workshop onHyperspectral Image and Signal Processing: Evolution in Remote Sensing(WHISPERS), Gainesville, FL.
Sankaran, S., Mishra, A., Ehsani, R., Davis, C., 2010. A review of advanced techniquesfor detecting plant diseases. Comput. Electron. Agric. 72, 1–13.
Schmale III, D.G., Dingus, B.R., Reinholtz, C., 2008. Development and application of anautonomous unmanned aerial vehicle for precise aerobiological sampling aboveagricultural fields. J. Field Robot. 25, 133–147.
Seiffert, U., Bollenbeck, F., Mock, H.-P., Matros, A.,2010. Clustering of crop pheno-types by means of hyperspectral signatures using artificial neural networks. In:2010 2nd Workshop on Hyperspectral Image and Signal Processing: Evolutionin Remote Sensing (WHISPERS). IEEE, pp. 1–4.
Sivarajan, S., 2011. Estimating Yield of Irrigated Potatoes Using Aerial and SatelliteRemote Sensing.
Stong, M.H., 2008. Development of Remote Sensing Techniques for Assessment ofSalinity Induced Plant Stresses. ProQuest.
Suárez, L., Zarco-Tejada, P.J., González-Dugo, V., Berni, J., Sagardoy, R., Morales,F., Fereres, E., 2010. Detecting water stress effects on fruit quality inorchards with time-series PRI airborne imagery. Remote Sens. Environ. 114,286–298.
Sugiura, R., Noguchi, N., Ishii, K., 2005. Remote-sensing technology for veg-etation monitoring using an unmanned helicopter. Biosyst. Eng. 90,369–379.
Sugiura, R., Noguchi, N., Ishii, K., 2007. Correction of low-altitude thermal imagesapplied to estimating soil water status. Biosyst. Eng. 96, 301–313.
Sullivan, D., Fulton, J., Shaw, J., Bland, G., 2007. Evaluating the sensitivity of anunmanned thermal infrared aerial system to detect water stress in a cottoncanopy. Trans. ASABE 50, 1955–1962.
Svensgaard, J., Roitsch, T., Christensen, S., 2014. Development of a mobilemultispectral imaging platform for precise field phenotyping. Agronomy 4,322–336.
Swain, K.C., Thomson, S.J., Jayasuriya, H.P., 2010. Adoption of an unmanned heli-copter for low-altitude remote sensing to estimate yield and total biomass of arice crop. Trans. ASAE 53, 21.
Techy, L., Woolsey, C.A., Schmale, D.G.,2008. Path planning for efficient UAV coordi-nation in aerobiological sampling missions. In: 47th IEEE Conference on Decisionand Control, 2008. CDC 2008. IEEE, pp. 2814–2819.
Thorp, K.R., Dierig, D.A., 2011. Color image segmentation approach to monitor flow-ering in lesquerella. Ind. Crops Prod. 34 (1), 1150–1159.
Torres-Sánchez, J., López-Granados, F., De Castro, A.I., Pena-Barragán, J.M., 2013.Configuration and specifications of an unmanned aerial vehicle (UAV) for earlysite specific weed management. PLOS ONE 8, e58210.
Trapp, J., Doctoral dissertation, Washington State University, Ph.D. Thesis 2015.Genetics of drought tolerance in common bean (Phaseolus vulgaris L.).
Tuberosa, R., 2012. Phenotyping for drought tolerance of crops in the genomics era.Front. Physiol. 3.
Tumbo, S., Salyani, M., Whitney, J., Wheaton, T., Miller, W., 2002. Investigation oflaser and ultrasonic ranging sensors for measurements of citrus canopy volume.Appl. Eng. Agric. 18, 367–372.
Usha, K., Singh, B., 2013. Potential applications of remote sensing in horticulture –a review. Sci. Hortic. 153, 71–83.
van Maarschalkerweerd, M., Bro, R., Egebo, M., Husted, S., 2013. Diagnosing latentcopper deficiency in intact barley leaves (Hordeum vulgare, L.) using near infraredspectroscopy. J. Agric. Food Chem. 61, 10901–10910.
Walter, A., Studer, B., Kölliker, R., 2012. Advanced phenotyping offers opportunitiesfor improved breeding of forage and turf species. Ann. Bot., mcs026.
Wang, W., Vinocur, B., Altman, A., 2003. Plant responses to drought, salinity andextreme temperatures: towards genetic engineering for stress tolerance. Planta218, 1–14.
Wei, X., Xu, J., Guo, H., Jiang, L., Chen, S., Yu, C., Zhou, Z., Hu, P., Zhai, H., Wan, J., 2010.DTH8 suppresses flowering in rice, influencing plant height and yield potentialsimultaneously. Plant Physiol. 153, 1747–1758.
White, J.W., Andrade-Sanchez, P., Gore, M.A., Bronson, K.F., Coffelt, T.A., Conley,M.M., Feldmann, K.A., French, A.N., Heun, J.T., Hunsaker, D.J., 2012. Field-basedphenomics for plant genetics research. Field Crops Res. 133, 101–112.
White, J.W., Conley, M.M., 2013. A flexible, low-cost cart for proximal sensing. CropSci. 53, 1646–1649.
Xiang, H., Tian, L., 2011. Method for automatic georeferencing aerial remote sensing(RS) images from an unmanned aerial vehicle (UAV) platform. Biosyst. Eng. 108,104–113.
Xing, J., Bravo, C., Moshou, D., Ramon, H., De Baerdemaeker, J., 2006. Bruise detectionon ‘Golden Delicious’ apples by vis/NIR spectroscopy. Comput. Electron. Agric.52, 11–20.
Yang, W., Duan, L., Chen, G., Xiong, L., Liu, Q., 2013. Plant phenomics andhigh-throughput phenotyping: accelerating rice functional genomics using mul-tidisciplinary technologies. Curr. Opin. Plant Biol. 16, 180–187.
Yue, J., Lei, T., Li, C., Zhu, J., 2012. The application of unmanned aerial vehicleremote sensing in quickly monitoring crop pests. Intell. Autom. Soft Comput.18, 1043–1052.
Zaman-Allah, M., Vergara, O., Araus, J., Tarekegne, A., Magorokosho, C., Zarco-Tejada,P., Hornero, A., Albà, A.H., Das, B., Craufurd, P., 2015. Unmanned aerial platform-based multi-spectral imaging for field phenotyping of maize. Plant Methods 11,35.
Zarco-Tejada, P.J., Diaz-Varela, R., Angileri, V., Loudjani, P., 2014. Tree height quan-tification using very high resolution imagery acquired from an unmanned aerialvehicle (UAV) and automatic 3D photo-reconstruction methods. Eur. J. Agron.55, 89–99.
Zarco-Tejada, P.J., González-Dugo, V., Berni, J.A., 2012. Fluorescence, temperatureand narrow-band indices acquired from a UAV platform for water stress detec-tion using a micro-hyperspectral imager and a thermal camera. Remote Sens.Environ. 117, 322–337.
Zarco-Tejada, P.J., Ustin, S., Whiting, M., 2005. Temporal and spatial relationshipsbetween within-field yield variability in cotton and high-spatial hyperspectralremote sensing imagery. Agron. J. 97, 641–653.
Zhang, C., Kovacs, J.M., 2012. The application of small unmanned aerial systems forprecision agriculture: a review. Precis. Agric. 13, 693–712.
Zhu, J., Wang, K., Deng, J., Harmon, T.,2009. Quantifying nitrogen status of rice usinglow altitude UAV-mounted system and object-oriented segmentation method-ology. In: ASME 2009 International Design Engineering Technical Conferencesand Computers and Information in Engineering Conference. American Societyof Mechanical Engineers, pp. 603–609.