Louisiana Department of Wildlife and Fisheries Department of Wildlife and Fisheries Office of...
92
Louisiana Department of Wildlife and Fisheries Office of Fisheries OYSTER STOCK ASSESSMENT REPORT OF THE PUBLIC OYSTER AREAS IN LOUISIANA SEED GROUNDS and SEED RESERVATIONS Oyster Data Report Series No. 17 July, 2011
Transcript of Louisiana Department of Wildlife and Fisheries Department of Wildlife and Fisheries Office of...

Louisiana Department of
Wildlife and Fisheries Office of Fisheries
OYSTER STOCK ASSESSMENT REPORT
OF THE
PUBLIC OYSTER AREAS IN LOUISIANA SEED GROUNDS and SEED RESERVATIONS
Oyster Data Report Series
No. 17
July, 2011

2011 Oyster Stock Assessment Report Page ii
Table of Contents
Statewide Overview ...............................................................................................................iii
Public Oyster Area Map.........................................................................................................xiii
Coastal Study Area (CSA) Map .............................................................................................xiv
Coastal Study Area 1 North (east of MS River and north of MRGO) ...................................1-1
Coastal Study Area 1 South (east of MS River and south of MRGO) ..................................2-1
Coastal Study Area 3 (Barataria basin) ..................................................................................3-1
Coastal Study Area 5 (Terrebonne basin) ..............................................................................5-1
Coastal Study Area 6 (Vermilion/Atchafalaya basin) ...........................................................6-1
Coastal Study Area 7 (Calcasieu and Sabine Lakes) .............................................................7-1
Dermo (Perkinsus marinus) Summary and Analysis………………………………………..8-1
Cover Photo: Shoveling oysters to be taken to market. Courtesy of The Louisiana
Conservationist.
Publication of the 2011 Oyster Stock Assessment Report was delayed due to limited agency
resources as a result of the Deepwater Horizon Oil Spill. The Report, although published in
2012, covers the time period between August 2010 and July 2011.

2011 Oyster Stock Assessment Report Page iii
Statewide Overview - 2011 Oyster Stock Assessment
Introduction
The oyster resource in Louisiana is one of the largest and most valuable in the nation. Its value
is derived from both the economic benefits it provides to the state and the ecological benefits it
provides to the estuarine environment. Due to Louisiana’s vast coastal wetland area, ample
habitat exists where oysters thrive under a variety of environmental conditions. The Department
of Wildlife and Fisheries (LDWF) is charged with managing the oyster resource on the public
grounds by closely monitoring the size and health of oysters on nearly 1.7 million acres of public
water bottoms. Oyster management on these public grounds includes activities such as setting
oyster seasons, monitoring harvest levels, and cultch planting (reef building) projects (Figure 1).
Figure 1. Cultch planting activities in Black Bay (Plaquemines Parish) during May 2009.
Limestone rock is being washed overboard using high-pressure water cannons and unloaded
using a clam bucket and crane.
Typically, the oyster industry utilizes the public oyster grounds as a source of seed oysters (< 3”)
for transplant to private leases. The public grounds also yield a supply of sack-sized oysters (
3”) and these oysters may be taken directly to market. The manner in which both the public
grounds and private leases are utilized in combination helps to keep Louisiana’s industry as a
national leader in oyster production with annual value typically in excess of $35 million worth of
dockside sales.
Oysters also play an important ecological role in the estuarine ecosystem. Oyster reefs provide
the majority of hard substrate required by other sessile invertebrate species such as barnacles,
bryozoans, tunicates, and anemones. Reefs are also utilized as shelter and forage habitat for

2011 Oyster Stock Assessment Report Page iv
many species of crabs, worms, fish, and meiofauna. Estuarine water quality can be affected by
the filter-feeding activities of oysters, and reefs may also play a role in stabilizing shorelines.
Louisiana Oyster Landings
Oysters have been a part of the Louisiana economy for many years; starting from meager
beginnings and growing into a multi-million dollar industry. Louisiana regularly leads the nation
in the production of oysters and accounted for an average of 35% of the nation’s oyster landings
over the 1999 – 2009 time period (Figure 2). Although Louisiana was the top producer of
American (=Eastern) oysters in 2009 with landings of approximately 14.0 million pounds of
oysters (Crassostrea virginica), preliminary trip ticket data for 2010 indicate that oyster
landings were among the lowest on record at approximately 6.7 million pounds. This is only the
third time since 1950 that Louisiana has landed less than 7 million pounds and the lowest annual
landing since 1966. Among Gulf of Mexico states, Louisiana consistently ranks #1 in landings
accounting for over 50% of all oysters landed.
The public oyster grounds can be considered the backbone of the Louisiana oyster resource.
These grounds are a valuable contributor to overall Louisiana oyster landings each year, while
also supplying seed oysters transplanted to private leases for grow-out purposes. The trend from
1970 – 1992 showed the majority of Louisiana oyster landings came from private reefs. From
1992 to 2001, however, the public ground stock size increased, in general, and landings from the
public grounds increased as well. In 2008, harvest levels significantly increased on the public
grounds over 2007 levels and the public grounds produced approximately 47% of all oyster
landings for the calendar year. This reliance on the public grounds reversed in 2009 and 2010.
Harvest data showed that 71%, of all oysters landed in Louisiana came from private leases
(Figure 3).
Remainder of U.S. 38%
Louisiana 35%
TX 13%
FL 6%
MS 6%
AL 2%
Figure 2. Percent of total landings (1999 – 2009) of all species of oysters based on pounds of
oyster meat (Data source: NMFS).

2011 Oyster Stock Assessment Report Page v
Figure 3. Historical oyster landings from public grounds and private leases in Louisiana.
When comparing the price per pound of oysters on public grounds and private leases, it is clear
that public ground oysters hold their value well as compared to oysters from private leases. In
2010, public ground oysters fetched $3.72 per pound at the dock while private lease oysters
valued slightly less at $3.59 per pound. Overall average price per pound for all Louisiana oysters
in 2010 ($3.62) rose for the second consecutive year compared to 2008 ($3.03) and 2009 ($3.34)
according to preliminary LDWF Trip-Ticket data. This increase in the value of oysters at the
dockside could be attributed to a lack of supply due to extensive closures of oyster harvest areas
surrounding the Deepwater Horizon oil spill. Nationwide 2010 landings data from the National
Marine Fisheries Service (NMFS) were not available during the time period covered by this
report but will be included in the Oyster Stock Assessment Report for 2012.
Statewide Oyster Stock Assessment Overview
Methods
Each summer, LDWF biologists from each Coastal Study Area (CSA) of the Fisheries Division
perform quantitative evaluation of the oyster resource on the public oyster areas. This biological
evaluation includes using SCUBA to collect oyster samples from within a square meter frame
from multiple locations (sample stations) in each public oyster ground. At each station, five
replicate square-meter samples are collected and data is combined to produce average numbers
of spat, seed, and sack oysters per station. Spat are young oysters measuring one to 24
millimeters (mm) in length. Seed oysters measure 25 to 74 mm and sack (= market-size)
measure 75 mm and above. The numbers of oysters per station is then multiplied by the reef
acreage to obtain an estimate of the total amount of oysters present on the reefs. Sampling that is
0
2
4
6
8
10
12
14
70
71
72
73
74
75
76
77
78
79
80
81
82
83
84
85
86
87
88
89
90
91
92
93
94
95
96
97
98
99
00
01
02
03
04
05
06
07
08
09
10
Po
un
ds
(M
illi
on
s)
Year
Private Public
\
Note: Long-term average (1961 to 2010) for private landings is 8.012million pounds. LTA for public landings is 3.049 million
71%

2011 Oyster Stock Assessment Report Page vi
undertaken as part of the annual stock assessment plays a valuable role in predicting the success
of the upcoming oyster season, which generally opens in early September and runs through April
of the following year (although the season may be closed or delayed if biological concerns or
enforcement problems are encountered). This stock size information is used to make
recommendations to the Wildlife and Fisheries Commission for the setting of the oyster season.
Sampling in 2011 significantly increased compared to previous years as many new stations were
incorporated into the sampling program. Overall, sampling increased from approximately 350
samples to approximately 490. Replication was increased from three samples per station to five
during the 2010 stock assessment project to provide a higher level of accuracy in determining
oyster availability on each reef. The additional sampling of 5 replicates per sampling station was
continued in 2011.
Due to recent realignment of the CSAs, changes to CSA designation must be noted. Coastal
Study Area 1 and 2 were combined and are presented as North Pontchartrain Basin (CSA 1
North) and South Pontchartrain Basin (CSA 1 South - formerly CSA 2). Additionally, CSAs 4
and 5 were combined and are presented as a combined Terrebonne Basin report (page xii).
Side-Scan Sonar Projects
Water bottom assessments continued in 2010 and 2011 to update reef information (size and
aerial extent) on selected portions of the public oyster seed grounds. Nearly all of the public
oyster seed grounds in the Breton Sound basin (CSA 1 South) were evaluated using side-scan
sonar technology. Additional areas within Calcasieu Lake (CSA 7) were also side-scanned and
reef information was updated. These projects join a long list of water bottom assessment
projects completed over the last three years including portions of Mississippi Sound, Drum Bay,
and Morgan Harbor in CSA 1 North (St. Bernard Parish) and portions of Calcasieu and Sabine
Lakes in CSA 7 (Cameron Parish). Reef acreage in Drum Bay, Morgan Harbor, and Sabine
Lake was unknown until completion of these projects, while the recent side-scan of the Breton
Sound basin updated reef acreage and location information last produced in 1977. All reef
information, with the exception of the Breton Sound basin, has now been incorporated into the
LDWF oyster management program, and is included in the respective stock assessment reports
on the following pages. Additionally, mapping projects are needed within CSA VI (Vermilion
Bay area) so that reef acreage can be obtained in order to provide a true estimate of oyster stock
availability in that
system.
Annual Stock Size
The statewide oyster
stock size in 2011 has
shown a slight decrease
compared to 2010 as
approximately 1,597,420
barrels of oysters are
available on the public
oyster areas of Louisiana
this year (Figure 4,
Table 1. Estimated Statewide oyster stock size on the public oyster
areas of Louisiana. CSA denotes Coastal Study Area. Percentage
columns (%) indicate percent of statewide total. Data in barrels and
1 barrel = 2 sacks. CSA Seed Seed % Sack Sack % Total Total %
1 N 33,691 6.0% 27,057 2.6% 60,748 3.8%
1 S 16,148 2.9% 68,725 6.7% 84,873 5.3%
3 18,341 3.2% 2,955 0.3% 21,296 1.3%
5 E 11,570 2.1% 3,146 0.3% 14,716 0.9%
5 W 102,350 18.1% 102,617 9.9% 204,967 12.8%
7 383,953 67.8% 826,867 80.2% 1,210,820 75.8%
Total 566,053 1,031,367 1,597,420

2011 Oyster Stock Assessment Report Page vii
Table 1). The 2011 oyster stock size represent an approximate decrease of 5.0% (-84,655
barrels) over 2010 levels and total stock is largely influenced by oyster stocks in Calcasieu and
Sabine Lakes (CSA 7). Although the 2010 oyster stock assessment report did not include Sabine
Lake, an oyster stock assessment was performed in that public oyster area in August 2010
(following the publication of the 2010 report). Stock size information from that assessment is
included in all 2010 information presented herein. Statewide seed oyster availability dropped
approximately 38% as compared to 2010 levels, while market-size availability increased
approximately 34% (Figure 5).
Data generated from the 2011 oyster stock assessment sampling yielded continued troubling
results both on a statewide level and within several CSAs. The historic primary public grounds
east of the Mississippi River showed drastic decreases in oyster stock abundance with CSA 1
North (Lake Borgne, Mississippi Sound, etc.) falling approximately 72% to its lowest point in
over 20 years. Unfortunately, successful spat sets in the fall of both 2009 and 2010 in CSA 1
apparently did not survive as seed abundance dropped to less than 34,000 barrels and sack stocks
decreased to just over 27,000 barrels. Similar decreases were observed in seed oyster stocks in
the Breton Sound basin (CSA 1 South) with a drop of nearly 85% as compared to 2010 levels.
There was, however, an increase in the availability of market size oysters in CSA 1 South of
approximately 73% to 68,725 barrels. (Table 1). The average size of animals collected during the
0
1
2
3
4
5
6
7
8
9
1982
1983
1984
1985
1986
1987
1988
1989
1990
1991
1992
1993
1994
1995
1996
1997
1998
1999
2000
2001
2002
2003
2004
2005
2006
2007
2008
2009
2010*
2011* B
arr
els
of
Oys
ters
Ava
ila
ble
(m
illi
on
s)
Year
Sd & Sk Combined
LTA
NOTE:1994-2004 includes CSA I data revision * 2010 to present data includes Sabine Lake data.
Figure 4. Historical oyster stock size on all public oyster areas combined. LTA denotes
long-term average.
2011 Oyster Stock Assessment Report Page viii
2011 oyster stock assessment sampling in CSA 1 South were nearly four inches in length,
indicating that very few spat and seed-size oysters exist in this area.
Coastal Study Areas 3 and 5 East (formerly CSA 4) showed significant increases both seed and
sack stocks. Although the overall oyster stock size remains low in Hackbery Bay (CSA 3),
significant increases were noted in both seed (+265%) and market-size (+145%) oyster
abundance. Similarly, Lakes Chien and Felicity (CSA 5 East) increased in overall stock
abundance in 2011 as compared to 2010 with the majority of the oyster stocks contained in the
seed-size category (approximately 12,000 barrels, Table 1).
Significant increases in market-size oyster stocks (+181%) were noted in CSA 5 West (Sister
Lake, Lake Mechant, Bay Junop), although a 34% decrease was found in seed oysters. Calcasieu
Lake showed modest gains in sack oysters on the east side where stocks of market-size oysters
rose slightly to just over 27,000 sacks. However, decreases in both seed and market-size oysters
in West Cove of Calcasieu Lake resulted in the overall oyster stock abundance dropping by
approximately 13%. As with past stock assessments, the highest stock densities within each
CSA were generally found on recent cultch plants such as the 2009 cultch plant in Sister Lake
(CSA 5 West).
Factors Affecting the 2011 Oyster Stock Assessment
A variety of factors, both natural and anthropogenic, affect the oyster stock size on the public
grounds in any given year. Natural threats to oyster survival include extreme low salinities
Figure 5. Historical Louisiana oyster stock size on the public oyster areas. LTA denotes the
long-term average of 1982 - 2010.
0
1
2
3
4
5
6
1982
1983
1984
1985
1986
1987
1988
1989
1990
1991
1992
1993
1994
1995
1996
1997
1998
1999
2000
2001
2002
2003
2004
2005
2006
2007
2008
2009
2010*
2011*
Ba
rre
ls (
mil
lio
ns
)
Year
Seed Oysters Sack Oysters
NOTE:1994-2004 includes CSA I data revision * 2010 to present data includes Sabine Lake data.
Seed LTA
Sack LTA
2011 - 38% seed + 34% sack - 5% total

2011 Oyster Stock Assessment Report Page ix
caused by high river discharge and localized rainfall, as well as predation and disease typically
associated with periods of high salinity and high temperature. Construction activities (e.g. oil and
gas production), harvest and environmental perturbations (e.g. hurricanes) can also impact oyster
abundance.
One significant event impacting a large portion of the coastline and oyster resources was the
Deepwater Horizon oil spill. The BP Deepwater Horizon drilling rig exploded in the Northern
Gulf of Mexico on April 20, 2010, approximately 40 miles southeast of the mouth of the
Mississippi River. The rig subsequently sank, damaging the well head and associated well
structures at the ocean floor. This resulted in the release of millions of barrels of oil into the Gulf
of Mexico impacting many coastal areas of Louisiana. In direct response to the threat of oil
entering coastal marshes, Louisiana released freshwater from diversions and siphons along the
Mississippi River in 2010. Research continues on the ongoing impacts of oil and freshwater
releases to Louisiana’s near shore environment, including to oysters and oyster habitat.
Environmental Conditions
Scientific research indicates that reproduction of oysters becomes limited as salinities drop below
seven parts per thousand (ppt). Additionally, salinities below five ppt coupled with water
temperatures above 23o Celsius has been documented to cause significant oyster mortalities. As
depressed salinities continue into the hotter summertime months, physiological stress on oysters
increases and mortalities can occur. This is a somewhat regular occurrence in areas such as the
Vermilion Bay system (CSA 6), but can also occur periodically in other areas of Louisiana’s
public oyster grounds.
The 2011 freshet (period of increased freshwater input) occurred during the late spring and early
summer of 2011. Freshwater entered Lake Borgne/MS Sound (CSA 1 North) via the Bonnet
Carre’ Spillway which was opened for the second time in four years (2008, 2011). A high
Mississippi River also prompted the opening of the Morganza Spillway, which provided
additional fresh water into the Atchafalaya basin (CSA 6). This basin was also receiving large
amounts of fresh water inputs from a high Atchafalaya River. River flooding entered CSA 1
South via the Bohemia Spillway and through wrap-around freshwater flow via the main delta of
the Mississippi River. During this period of high fresh water input, corresponding drops in
salinity were noted in many areas of the primary public oyster grounds of the Black Bay area.
Elevated oyster mortalities were observed in LDWF dredge sampling, which occurred in the
months and weeks prior to stock assessment sampling. Reduced oyster abundance observed in
the 2011 oyster stock assessment may be due, in part, to those documented mortalities occurring
prior to stock assessment sampling.
Oyster Reproduction and Larval Recruitment
The ability of a species to produce successful offspring is critical to long-term sustainability of
the population. Oysters are broadcast spawners, and release millions of gametes (eggs and
sperm) into the water column when environmental conditions are conducive to reproduction.
This reproductive activity typically peaks in coastal Louisiana, cued mainly by water
temperature changes, in the spring and fall of each year.

2011 Oyster Stock Assessment Report Page x
LDWF biological sampling since the spring of 2010 has shown troubling indications of
reproductive failures in some areas. While successful spat sets (the settlement of oyster larvae
onto a suitable surface and the metamorphosis of those larvae into baby oysters, called spat) were
noted in the fall of 2010 in portions of CSA 1 North, significant numbers of seed oysters were
not found in the 2011 stock assessment sampling, suggesting a high incidence of spat mortality at
some point since the fall 2010 reproductive event. Additionally, very few spat have been
collected in CSA 1 South samples since the fall of 2009. This area experienced very little
spatfall in the spring and fall of 2010, and the 2011 stock assessment samples located only 16
total spat in 155 replicate samples indicating poor larval recruitment success in the spring of
2011, likely due to the affects of the Deepwater Horizon oil spill and response efforts. CSA 3
(Hackberry Bay) also showed very little larval recruitment during the fall of 2010, again likely
due to the oil spill and related response actions, but a successful spatset was documented in this
area during 2011 oyster stock assessment sampling.
Reproductive success varied widely among the CSAs, as evidenced by spat-to-market ratios
(Figure 6) from the 2011 oyster stock assessment sampling. Strong reproductive output was
achieved in CSA 3 (Hackberry Bay) and CSA 5 East (Lake Chien/Felicity), and greater than one
spat was produced per market-size animal in CSA 5 West (Sister Lake) and CSA 7 (Calcasieu
Lake). Poor reproductive success was noted east of the Mississippi River (CSA 1 North and
South) as well as in CSA 6. These areas were influenced by the high Mississippi River in the
spring of 2011 as corresponding decreases in salinity were documented during the flooding
event. For those CSAs within the area impacted by the Deepwater Horizon oil spill, the lack of
reproductive success may be a result of the oil spill and response actions.
Figure 6. Spat-to-market ratios for oysters collected on various public oyster areas in Louisiana during
the 2011 oyster stock assessment sampling. Actual ratios are indicated above/within each data bar.
0.00 0.25 19.90 12.30
1.23
0.00
1.15 0.55
0.00
2.00
4.00
6.00
8.00
10.00
Nu
mb
er
of
Spat
pe
r
Mar
ket-
Size
Oys
ter

2011 Oyster Stock Assessment Report Page xi
Commercial Harvest
Estimated commercial harvest pressure was especially low during the 2010/2011 oyster season
(Table 2) as documented by LDWF boarding report data. The small harvest was directly
impacted by a complete
closure of public
grounds east of the
Mississippi River for
much of the season in
response to the 2010
Deepwater Horizon oil
spill. A short season in
the Lake Borgne/MS
Sound area was opened
in May 2011 in front of
freshwater provided by
the Bonnet Carre’
Spillway opening, but
overall harvest was only
estimated at
approximately 10,000
barrels (Table 2). The
most significant commercial harvest occurred in Calcasieu Lake (CSA 7). Harvest was once
again strong in this area, likely driven by the scarcity of available oysters and fishing
opportunities on other public oyster areas as a result of the oil spill, and was estimated at nearly
83,000 sacks (Table 2).
Recent Legislation
The 2011 regular legislative session included several bills filed with direct ties to oysters (Table
3). One of the most notable was SB 73 which effectively produced a limited-entry scenario for
commercial oyster harvest in Calcasieu Lake. This bill, which became Act 329, requires a
permit to fish the lake and allows only 126 permits to be issued each year by LDWF.
Conclusion and Acknowledgements
The following report includes both biological stock assessment and historical oyster landings
data from each CSA in Louisiana (CSA map depicted on page xiv), as well as a brief report on
the most recent oyster season in each area. Biological data was generated from quantitative
square-meter sampling (see above) and landings data was generated from field boarding runs and
trip ticket information. Countless hours were spent by the field biologists of each CSA,
especially in light of this year’s increase in sampling effort. Additionally, Ty Lindsey, Felixcia
Blanchard, and Denise Kinsey greatly assisted with editorial review and preparation of this
document. The efforts of both the field and office staff are greatly appreciated as this report
could not be produced without the hard work and dedication of these many people. Questions
and/or comments can be directed to Patrick Banks at [email protected].
1 Data for CSA 7 (Calcasieu Lake) harvest obtained using LDWF trip-ticket data and not fisheries dependent
surveys.
Table 2. Harvest estimates for the 2010/2011 oyster season on the
public oyster grounds of Louisiana. Data derived from fisheries
dependent surveys of harvesting vessels (=boarding reports) and not
from LDWF Trip-Ticket data (except CSA 7). Percentages in
parentheses indicate change from 2009/2010. 1 barrel = 2 sacks.
CSA Seed Oysters
(barrels)
Market Oysters
(sacks)
Total (barrels)
1 North 10,000 0 10,000
1 South 0 0 0
3 0 0 0
5 East 1,008 610 1,313
5 West 0 217 1,888
6 0 3,775 0
7 0 82,8961 41,448
Total 11,008 (-92.8%) 87,498 (-81.7%) 56,649 (-85.5%)

2011 Oyster Stock Assessment Report Page xii
Table 3. Legislation proposed during the 2011 Louisiana legislative session.
Bill Legislator Description Passed? Act # Effective Date
HB 245 G. Jackson Requires oysters harvested from in-state
waters that are to be sold for raw
consumption within the state between May
and October must be put in refrigeration no
more than five hours after harvest.
Yes 1 5/20/11
HB 246 Simon Designates the cabochon cut gemstone,
derived from the Crassostrea virginica
mollusk (American or Eastern Oyster) as
the official state gemstone.
Yes 232 8/15/11
HB 293 Dove Requires a vessel monitoring system
(VMS) for vessels taking oysters for
commercial purposes under the authority
of the Oyster Seed Ground Vessel Permit.
Yes 266 8/15/11
HB 301 Billiot Establishes a standard measurement of the
common volume units used in the oyster
industry.
No.
Stalled in
committee
n/a n/a
SB 73 Morrish Creates the Calcasieu Lake Oyster
Harvester Permit. LDWF shall issue 126
permits annually on a first-come-first-
served basis.
Yes 329 6/29/11
SB 240 Chabert Holds parties harmless from claims for
damages done to leased water bottoms as
part of conservation, coastal protection, or
restoration efforts.
No.
Stalled in
committee
n/a n/a
SCR 18 Morrish Requests OCPR and LDWF to jointly
study shoreline protection, effects on
marine species diversity and habitat
quality, and economic and other ecosystem
service values of the Sabine Reef.
n/a
Filed with
Sec. of
State
n/a n/a
2011 Oyster Stock Assessment Report Page xiii
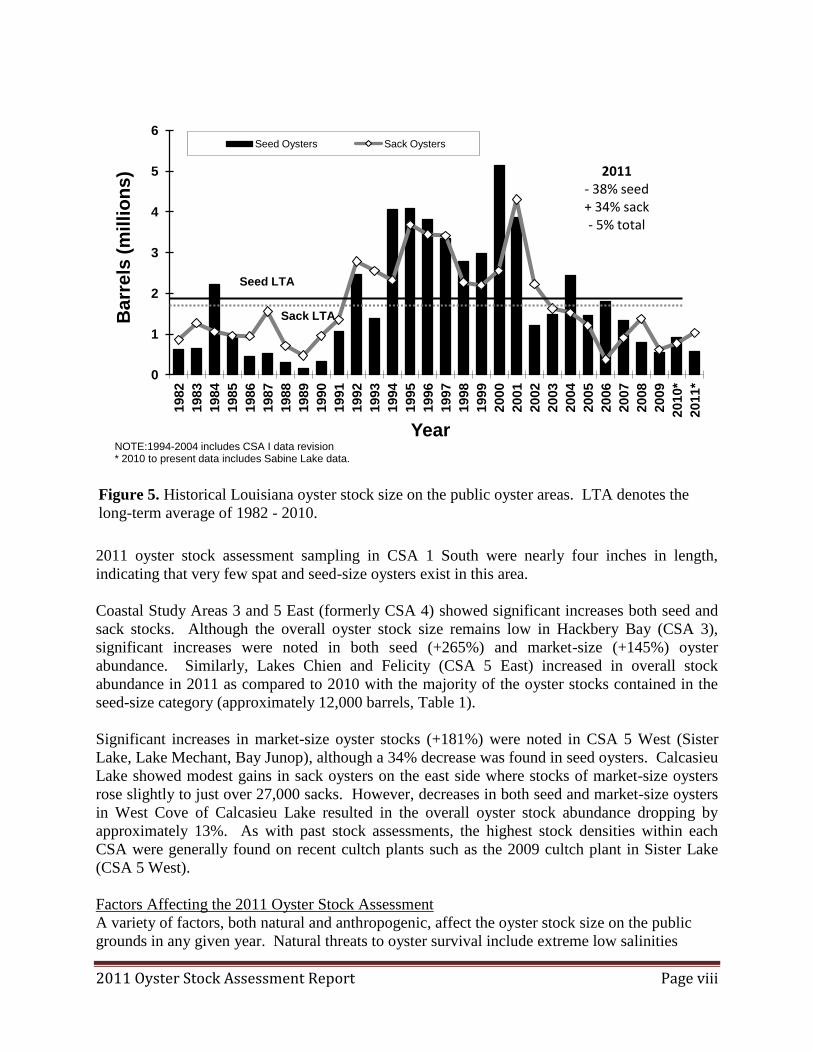
Public Oyster Areas
Public Seed Grounds* Public Seed Reservations** Lake Borgne
Chandeleur/Breton Sound (Primary Public Oyster Seed Grounds)
Barataria Bay
Little Lake
Deep Lake
Lake Chien
Lake Felicity
Lake Tambour
Lake Mechant
Vermilion/Cote Blanche/Atchafalaya Bays
*Seed grounds are designated by the Louisiana Department of Wildlife and Fisheries Commission
**Seed reservations, Calcasieu Lake, and Sabine Lake are designated by the state legislature
Bay Gardene
Hackberry Bay
Sister (Caillou) Lake
Bay Junop
Public Oyster Areas** Calcasieu Lake
Sabine Lake

2011 Oyster Stock Assessment Report Page xiv
LDWF Fisheries’ Coastal Study Areas (CSAs)

CSA 1N – 2011 Oyster Stock Assessment Report Page 1-1
North Pontchartrain Basin (CSA1N) – Oyster Stock Assessment
Introduction
The public oyster areas within the North Pontchartrain Basin (formerly CSA1) consist of
approximately 690,000 water bottom acres and are located in the Louisiana portion of Mississippi
Sound, Lake Borgne, Chandeleur Sound and adjacent waters. These areas have historically been used
by both Louisiana and Mississippi fishermen, and have recently been areas of high oyster production
within the state of Louisiana. Although some of the area was managed as public oyster seed grounds
by the State for many decades, the majority of this area was designated by Louisiana Wildlife and
Fisheries Commission rule as public grounds in 1988. Much of Lake Borgne was later added as a
public oyster seed ground in 1995 and was expanded in 2004. The Department also continually
expands and enhances the public oyster reefs through the placement of cultch material (i.e., shell,
limestone, crushed concrete) on suitable water bottoms. The most recent plants were in 2007, 2009
and 2011
Currently, these areas are managed in an effort to balance the economic opportunity of the fishery
with the long term biological sustainability of the resource. This management is contingent upon
obtaining and utilizing the best fishery dependent and independent data available. This includes
monitoring the harvest and resource availability throughout the fishing season and performing yearly
stock assessments. The information these data provide allow resource managers to implement
management changes to both effectively utilize the current resource as well as protect long-term
viability. This report will fulfill one of those data needs by providing estimates of the current stock
size of the oyster resource within this Basin.
Methods
Samples were taken between July 18 and July 21, 2011 using a one square-meter frame placed
directly on the bottom. Divers removed all enclosed live and dead oysters, as well as shell, by hand.
Live and dead oysters, spat, fouling organisms, and oyster predators were identified and enumerated.
A total of 16 stations were visited with five square-meter replicates taken at each station except for the
Shell Point cultch plant (= 2009 cultch plant). At the Shell Point cultch plant, five 0.25m2 replicates
were made. The average of the replicates was then pooled within reef systems. This average density
per reef system was multiplied by the total area of the same reef system. The resulting number was
adjusted into a barrel unit of measure where one barrel equals 720 seed-sized oysters or 360 market-
sized oysters. Seed oysters are those measuring between 25 and 74 mm with market oysters being
greater than 74 mm. Spat oysters are those 24mm and less. The Lake Borgne Public Oyster Seed
Ground was not sampled due to a lack of reef acreage information.
Results and Discussion
Seed and Sack Stock
The current stock size for the North Pontchartrain Basin is estimated at 33,691 barrels (bbls) of seed-
size oysters and 27,057 bbls of market-size oysters. These numbers include all of the currently
assessed reefs and the 2009 Shell Point cultch plant (Figure 1.1). Comparing with last year’s
assessment, there was a 72% decrease in the seed-size estimate and a 72% decrease in the sack-size
estimate.

CSA 1N – 2011 Oyster Stock Assessment Report Page 1-2
Figure 1.1. Map showing North Pontchartrain Basin oyster stock assessment stations within the Mississippi and
Chandeleur Sounds. Numbers below stations are average numbers of seed (SD) and sack (SK) oysters per m2.
Oyster density and abundance were not evenly distributed among areas (Table 1.1) with the highest
density estimates of seed and sack oysters at the Shell Point cultch plant. Highest overall abundances
of seed and sack oysters were in the Three-Mile/West Karako and Morgan Harbor areas, respectively.
It is important to note variability both within and among stations when comparing estimates,
especially given small or unequal sample sizes. However, changes since the last assessment have been
dramatic on an individual reef basis and only limited areas of large resource availability were
identified.
The current estimate falls well below the previous ten years’ average for both seed and sack oysters
(Figure 1.2). However, it is important to note the range of inter-annual variability in this average.
There have been several years of heavy localized harvest, high recent mortalities, strong tropical
events such as Hurricane Katrina in 2005, the Deepwater Horizon oil spill, related spill response
activities, and continual limits to recruitment that appear to have severely limited abundances.

CSA 1N – 2011 Oyster Stock Assessment Report Page 1-3
Spat Production
Live spat were not present in all samples containing a suitable substrate. Means ranged from 0 to
208.8 individuals per m2 with the maximum value occurring at the Shell Point cultch plant. Spat
densities were extremely low to non-occurring across remaining areas with the second-highest spat
density at only 1.6 per m2 at the Cabbage Reef location. Based on previous years’ data, the square
meter samples may have occurred between seasonal spawning events in some areas. Of course the
number of spat in a given sample is also necessarily related to the amount of substrate collected.
However, this continues an observed lack of spat set over several of the reef areas during the spring
spawning events. This could be attributed to several different things or a combination of stressors
discussed below.
Fouling Organisms
The hooked mussel, Ischadium recurvum, was present at seven of the 16 sample stations. The highest
density of mussels was 222.4 individuals / m2 at the Petit Island station. Higher mussel densities were
generally restricted to the lower salinity areas in Lake Borgne and western Mississippi Sound. Higher
mussel densities were noted pre-stock assessment but dramatic increases in salinity seem to have
lowered densities on reefs in eastern Mississippi Sound. Additionally, a sponge-like covering has been
present on much of the live oysters and exposed shell in the western and central assessment area. This
covering can be quite thick and widespread on the shell. Although still under investigation at time of
writing, widespread covering on shell may limit attachment points for oyster larvae.
Oyster Predators
The southern oyster drill, Stramonita haemastoma, was not collected at any of the sample stations.
The lack of this predator is probably due to extremely cold winter temperatures, and greatly reduced
salinities; such conditions which scientific literature show can limit the drill’s abundance and
distribution. Furthermore, hypoxic conditions in the Study Area may have had direct effects on the
oyster drill population as well as the indirect effect of removing the oyster resource within the usually
high salinity areas. However, subsequent to stock assessment sampling, oyster drill egg cases were
noted on outer, high-salinity reefs in the area. No stone crabs, Menippe adinia, or blue crabs,
Callinectes spp, were collected in dive samples. Other Xanthid crabs were noted in the majority of the
samples containing shell.
Mortality
Mortality estimates were highly variable between size classes and stations (Table 1.2) during this
sampling event. Spat mortalities ranged from 0 to 100%. Highest spat mortalities were located in
Mississippi Sound stations. Seed mortalities ranged from 0 to 100% and were highest in Mississippi
Sound and Morgan Harbor. There was no sack mortality noted in stock assessment sampling.
Although mortality estimates in many cases were limited to small sample sizes many of these samples
were taken after apparently large mortality events that have either subsided or have severely depleted
abundances (see Cumulative Impacts and Mortalities section below).
Tropical and Climatic Events
There were no tropical systems affecting the northern Gulf of Mexico since the last stock assessment.
However, record rainfall throughout the Mississippi River Basin triggered the opening of the Bonnet
Carre’ Spillway, diverting water from the Mississippi River to Lake Pontchartrain and adjacent coastal
waters. The structure began to open on May 9 and was fully closed on June 20, 2011. Maximum
discharges reached 316,000 cubic feet per second (cfs) with an average event discharge of 208,000

CSA 1N – 2011 Oyster Stock Assessment Report Page 1-4
cfs. Additionally, the Pearl River system input a relatively large volume of fresh water into western
Mississippi Sound in March 2011.
Table 1.1. Mean densities of oysters collected at each station.
1 – station temporarily suspended. Values in
parenthesis are percent changes from the 2010 assessment. N/A indicates no live animals in 2011.
Both of these events depressed salinities on the reef systems. The salinities of reefs within Mississippi
Sound were impacted the most as they are adjacent to areas of freshwater input. Reefs located in
western Mississippi Sound experienced salinities less than 5 parts per thousand (ppt) for several weeks
(Figure 1.3).
2010/2011 Public Oyster Season
Given the reduced availability of the resource, the Public Seed Grounds east of the River were not
opened for the regular 2010/2011 season.
Station Station
Number
Reef Group
Acreage
Seed
Oysters
per m2
Sack
Oysters
per m2
Number of
seed oysters
(bbls)
Number of
sack oysters
(bbls)
Grassy Is.
2
0.4
0
Halfmoon Is. 3 6,850 0.2 0 9.626
(-80%)
3,850
(-92%)
Petit Is.
Grand Banks
4
23
0
0.4
0.2
0
Three-mile Bay
West Karako
5
20
3,059 0.8
0.6
0
0.4
12,035
(N/A)
6,877
(0%)
Grand Pass 6 0.0 0
Cabbage Reef. 7 1,802 0.2 0 1,350
(-51%)
0
(N/A)
Turkey Bayou 11 0.2 0
Martin Is.
Holmes Is.
9
10
4,156
0
0
0
0
0
(N/A)
0
(N/A)
Shell Point
18
47
26.4
3.2
7,004
(-82%)
1698
(+400%)
Johnson Bayou 17 200 3.2 0.6 3,597
(+1600%)
1,349
(+150%)
Millennium Reef 12 70 0.2 0 79
(-97%)
0
(-100%)
Drum Bay 15 1,796 0 0 0
(-100%)
0
(-100%)
Morgan Harbor 16 2,954 0 0.4 0
(-100%)
13,283
(-33%)
Hospital Wall1
1
376
2011 Total
33,691
(-72%)
27,057
(-72%)

CSA 1N – 2011 Oyster Stock Assessment Report Page 1-5
Figure 1.2. Current and historical Stock Assessment (seed and sack oysters) values. Horizontal lines represent
the previous ten-years’ seed and sack average.
However, in anticipation of impacts from the Bonnet Carre’ Spillway, the Louisiana Wildlife and
Fisheries Commission (LWFC) chose to open reefs within Louisiana Department of Health and
Hospitals (LDHH) Harvest Areas 1, 2, and a portion of 3 to allow the relocation of the resource to
leases in protected, higher salinity areas. This included areas that were currently approved for harvest
as well as permitted relays from Harvest Area 1 which had been closed by LDHH. The special season
ran from May 14 to May 31, 2011. Based on information obtained by LDWF and the LDHH, it was
estimated that about 20,395 sacks were relocated to private leases during the season. The majority of
harvest was from areas in LDHH Harvest Area 1, recent cultch plants, and the Grand Banks area.
Cumulative Impacts and Mortalities
This section will focus on greater detail concerning environmental conditions observed, as well as
direct impacts that have occurred since the previous stock assessment in 2010 or continual impacts to
the population. It is also important to note that many of the topics listed below are correlated with one
another, i.e. freshwater inputs-salinity stratification-hypoxia.
Deepwater Horizon Oil Spill and Related Response Actions
The Deepwater Horizon oil spill released millions of barrels of oil into the Gulf of Mexico affecting
the Louisiana coastline. In direct response to the spill, in an effort to keep incoming oil from the Gulf
0
0.2
0.4
0.6
0.8
1
1.2
1.4B
arr
els
(M
illi
on
s)
Year
Seed
Sack
10 YR Seed Average
10 YR Sack Average

CSA 1N – 2011 Oyster Stock Assessment Report Page 1-6
out of Louisiana’s sensitive marshes and estuaries, freshwater was released from diversions and
siphons along the Mississippi River. The impacts of oil and freshwater diversions on oyster health and
habitat continue to be of concern. Assessments on the direct and indirect impacts of oil and response
actions on Louisiana’s near shore environment, including oysters and oyster habitat, is ongoing.
Hypoxia
The definition of hypoxia varies as it is based on the percent saturation of water by oxygen. This
varies with temperature and amount of other solutes. For most environmental assessments in this area
hypoxia can be viewed as concentrations of dissolved oxygen below 3 milligrams per liter (mg/L)
As oysters are a sessile species, reef systems can often be impacted by hypoxia in an estuarine setting.
Within the Pontchartrain Basin estuary the most common driver of hypoxia over reef systems is the
stratification of the water column due to density differences in water masses. These density
differences are oftentimes driven by salinity and temperature. Basically, warmer, fresher water
overrides denser salt water and does not allow the diffusion of oxygen throughout the water column.
Table 1.2. Mean oyster mortality (recent) estimates from each square-meter
sample station. N/A = no live or dead oysters were collected for mortality
estimates.
Station
Spat Mortality
(%)
Seed Mortality
(%)
Sack Mortality
(%)
Grassy Island N/A 50.0 N/A
Millennium Reef N/A 0 N/A
Johnson Bayou 100 40.7 0
Petit Island 100 100 0
Half Moon Island N/A 0 N/A
Three-Mile Bay 20.0 0 0
Turkey Bayou 0.0 0 N/A
Cabbage Reef 20.0 0 N/A
Grand Pass 0 N/A N/A
Shell Point 14.0 0.1 0
Drum Bay 50.0 N/A N/A
Morgan Harbor 0 100 0
Martin Island N/A N/A N/A
Holmes Island N/A N/A N/A
Grand Banks 100 0 N/A
West Karako 0 0 0

CSA 1N – 2011 Oyster Stock Assessment Report Page 1-7
This is common in areas that have experienced high freshwater inputs, especially after the return of
higher salinity waters once freshwater inputs subside. In other cases, in relatively confined areas,
increases in biological oxygen demand can also lead to hypoxia, although localized. Some instance of
hypoxia is “usual” in most areas, but prolonged exposure can result in reduced growth, decreased
disease resistance, or direct mortality.
At the time of the 2010 assessment several reef areas were experiencing hypoxic to anoxic conditions.
For example Johnson Bayou, in July of 2010, had a surface salinity of 9.3 ppt and a bottom salinity of
20.3 ppt. This resulted in dissolved oxygen (DO) surface and bottom values of 8.1 and 0.9 milligrams
per liter (mg/L), respectively. An adjacent station, Turkey Bayou, registered a bottom DO
Figure 1.3. Salinities for the northern Mississippi Sound public seed grounds since 2010 Assessment. Data
presented are from discrete measurements taken on each reef once per month or twice when denoted with a
second monthly reading.
value of 0.4 mg/L. During that assessment, few live oysters were found at the Johnson Bayou which
had been a very productive area since its creation in 2007. At the Turkey Bayou station recent seed
mortality was estimated at 92% with sack mortality at 100%. It is apparent that hypoxia is certainly a
contributing factor to the overall mortality within a reef system.
0
5
10
15
20
25
30
35
Jul 2010
Aug Aug2 Sep Sep2 Oct Oct2 Nov Dec Jan Feb Mar Apr May May2 Jun Jun2 July 2011
Salin
ity
(pp
t)
Sample
Cabbage
Petit
Turkey
Three-mile
Grassy

CSA 1N – 2011 Oyster Stock Assessment Report Page 1-8
Hypoxic conditions were also noted prior to the 2011 assessment. This condition was brought about
by interaction of freshwater inputs and the higher salinity waters of Chandeleur Sound. Lowered DO
concentrations and hypoxia became widespread throughout the assessment area starting in June 2011
and had become persistent in some areas. At the time of the 2011 assessment all of the nine stations in
Mississippi Sound had bottom DO values at or below 4 mg/L. All but one of those had values at or
below 3 mg/L.
Freshets
As mentioned previously, the Bonnet Carre Spillway structure was opened in May of 2011. Although
not instantaneous, water from this structure makes its way through Lake Pontchartrain and eventually
the surrounding waters of Lake Borgne and the Mississippi Sound. The reefs within western
Mississippi Sound were impacted first and saw the longest duration of depressed salinities. For
example Grassy Island, in extreme western Mississippi Sound, had bottom salinities of 1 ppt on May
24th and June 6
th of 2011. Although these values are discrete measurements these values were also
seen in non-related observations as well as data derived from continuous salinity recorders within the
area. Given the above, it is likely that these bottom salinities, with some variability, were below 5.0
ppt for an extended period. This salinity suppression extended to eastern Mississippi Sound where a
bottom salinity reading of 3.5 ppt was recorded at Cabbage Reef. Lowered salinities persisted over the
Mississippi Sound and adjacent reefs until late June when the structure was closed and changing
weather patterns allowed for higher-salinity waters to return from the Gulf of Mexico.
While freshets often provide benefits to the reef system, either by reducing disease or predation, or
enhancing cultch opportunities, there are often other cumulative impacts that may affect recovery
from any one event. The impact/recovery are also modified by not only the magnitude of a freshet, but
perhaps also by the duration and timing.
Sedimentation/Subsidence
During periods of high freshwater input, sedimentation over reefs can be a problem. This
sedimentation can affect the reef either through direct mortality (burial) or through reduced growth
and reproduction (both production and clean places for larval attachment). During the 2011
assessment, divers noted on many reefs, especially in the Mississippi Sound area, that some of the
cultch had a covering of silt and still other areas were buried. Both of these conditions limit the
amount of suitable substrate available for larval settlement.
Subsidence of the reefs is usually balanced by reef accretion or growth. If no appreciable shell is
added over a period of time, the reefs, especially those in less than optimal environments, will subside
to the point of shell burial. The lowering of the reef profile also subjects associated organisms to more
frequent hypoxia events as well as changing the local water flow and sedimentation processes.
Cultch Condition
Any successful spat set is dependent on clean, stable cultch for larval attachment. The condition of the
cultch and live oyster shell within the Pontchartrain Basin appears to be currently poor. As noted
above, many areas are buried or covered with a thin layer of silt. Much of the shell within the areas
east of the River are also covered with an unidentified algal/sponge growth. Although still under
investigation, this covering may serve to limit suitable area for attachment of oyster larvae. In other

CSA 1N – 2011 Oyster Stock Assessment Report Page 1-9
areas, the addition of shell to a reef has become so infrequent that the cultch on hand is being
transformed into small “hash” particles that may not provide optimal substrate for larval attachment.
Harvest
As stated previously, a special season was held in advance of expected Bonnet Carre’ Spillway
impacts. It was estimated that at least 20,000 sacks were relocated from endangered areas during the
season. Although the season was for bedding-only, all fishermen reported harvested amounts in sacks.
Also, it is not known what percentage of the harvest was seed-, sack-sized, or shell. Therefore, no
estimate of total number of individual oysters removed can be made.
Intra-assessment mortalities
Given all of the above, we can examine mortality estimates generated within the assessment period.
This year a subset of stations was sampled quantitatively in May to determine a baseline prior to the
arrival of freshwater via the Bonnet Carre’ Spillway opening. Three of the stations contained
sufficient data to compare to the July assessments. All three of the stations (Grand Banks, Johnson
Bayou, Millenium Reef) showed decreases in availability from May to July. When numbers are
pooled there was an 84% reduction in seed oysters and an 88% reduction in market-size oysters
between the sampling events. Changes in abundances from May to July, and changes between full
assessments, indicate that a significant mortality event has taken place. This is also corroborated by
recent mortality estimates obtained in supplemental dredge tows on three Mississippi Sound reefs
made in early July. Although the estimates were based on small numbers of individuals, mortality
estimates ranged from 30.8 to 85.2% for seed oysters and 10 to 64.3% for market-size oysters.
The values above help to explain changes in availability where single point mortality estimates do not.
Although background natural mortality may certainly shape a population, there has apparently been
other, higher magnitude, mortalities since the last stock assessment. These seem to have come
primarily immediately after the 2010 assessment and one to two months before the 2011 assessment.

CSA 1S – 2011 Oyster Stock Assessment Report Page 2-1
South Pontchartrain Basin (CSA 1S) – Oyster Stock Assessment
Introduction
The Public Oyster Seed Grounds (POSG) located in the South Pontchartrain Basin (Basin)
include areas south of the Mississippi River Gulf Outlet (MRGO) to the Mississippi River, and
from the eastern extent of private leases to the Breton National Wildlife Refuge. This area
encompasses approximately 300,000 of the 880,597 total acres of POSG east of the Mississippi
River and includes areas designated “sack harvest only” in Lakes Fortuna and Machias, and Bay
Long, as well as the Bay Gardene Public Oyster Seed Reservation. Historically this area has
provided seed- and market-sized oysters for oyster fishermen both east and west of the
Mississippi River. Hydrology in the area is affected at high Mississippi River stages by
discharge through gaps in the levee south of Pointe a la Hache , discharge from the Caernarvon
and Bayou Lamoque freshwater diversion structures, the siphon at White’s Ditch, and the main-
stem river distributaries in the south.
An active cultch planting program has been in effect in the area for a long period of time with
two recent cultch plants in 2007 and 2009. Numerous cultch plants have been constructed
throughout the area since 1917 in places such as Bay Gardene, Bay Crabe, Black Bay, and
California Bay. Several more cultch plants are planned in the near future within this part of the
Basin.
Currently, these areas are managed in an effort to balance the economic opportunity of the
fishery with the long term biological sustainability of the resource. This management is
contingent upon obtaining and utilizing the best fishery dependent and independent data
available. This includes monitoring the harvest and resource availability throughout the fishing
season and performing yearly stock assessments. The information these data provide allow
resource managers to implement management changes to both effectively utilize the current
resource as well as protect long term viability. This report will fulfill one of those data needs by
providing estimates of the current stock size of the oyster resource within this portion of the
Basin.
Methods
Samples were taken between July 19 and August 1, 2011 using a one square-meter frame
randomly placed on the bottom. Divers removed all enclosed live and dead oysters, as well as
shell, by hand. Live and dead oysters, spat, fouling organisms, and oyster predators were
identified and enumerated. A total of 31 stations were visited with 5 square-meter replicates
taken at each station except for the 2009 cultch plant. At the cultch plant, five 0.25m2 replicates
were made. The average of the replicates was then pooled within reef systems. This average
density per reef, or reef system, was then multiplied by the total area (reef acreage). The
resulting number was adjusted into a barrel unit of measure where one barrel equals 720 seed-

CSA 1S – 2011 Oyster Stock Assessment Report Page 2-2
sized oysters or 360 market-sized oysters. Seed oysters are those measuring between 25 and 74
mm with market oysters being greater than 74 mm. Spat oysters are those less than 25 mm.
Results and Discussion
Seed and Sack Stock
The current stock size is estimated at 16,148 barrels (bbls) of seed oysters and 68,725 bbls of
market sized oysters for a total of 84,873 bbls of overall stock. These numbers include all of the
currently assessed reefs and the 2009 Black Bay cultch plant (Figure 2.1). Overall abundance is
down 42% from last year, down 93% from the 10 year average (2001 - 2010), and down 95%
from the long term average (1982 – 2010). Seed oyster stock is down 84.8 % from last year, and
is the lowest estimated abundance since 1982. Sack oyster stock is up 72.9% from 2010 but is
87% below the past ten years’ average, and 89% less than the long-term average (1982 – 2010)
(Figure 2.2).
Figure 2.1 Map Showing assessment stations within the South Pontchartrain Basin. Numbers
below stations are average numbers of seed and sack oysters per m2.

CSA 1S – 2011 Oyster Stock Assessment Report Page 2-3
Oyster density and abundance was not evenly distributed among areas (Table 2.1) with the
highest density and abundance of seed oysters found on the 2009 Cultch Plant. The highest
density of sack-sized oysters was located in Elephant Pass with the highest total abundance
found on the Bay Long reef system.
Seed-sized oyster stock decreased from 2010 levels and seed oysters were not found at 11
stations. The anticipated (predicted) increase in seed stocks after successive high freshwater
inputs has not been realized (see Cumulative Impacts for further discussion). Approximately 8%
of seed oysters (not available for bedding) are located in areas historically designated as sacking
only (Lake Fortuna and Bay Long) with all of that resource located in Bay Long.
Figure 2.2. Current and historical Stock Assessment values. Horizontal lines represent the
previous ten-years’ seed and sack average.
Spat Production
Live spat were observed at only 5 stations. Densities ranged from 0 to 0.8/m2. When
extrapolated, the largest single sample per station would have been 4 individuals. Although these
assessment events may occur outside of the peak spawning period, it is evident that there has
0.0
0.5
1.0
1.5
2.0
2.5
3.0
3.5
4.0
1982
1983
1984
1985
1986
1987
1988
1989
1990
1991
1992
1993
1994
1995
1996
1997
1998
1999
2000
2001
2002
2003
2004
2005
2006
2007
2008
2009
2010
2011
Ba
rre
ls (
Millio
ns
)
Year
Seed OystersSack OystersSeed 10YR AverageSack 10YR Average
CSA 1S – 2011 Oyster Stock Assessment Report Page 2-4
been little to no spring or summer spatcatch on these reefs. This marks a continuation of poor to
no spat catches within this area. This may be attributed to several causes discussed below.
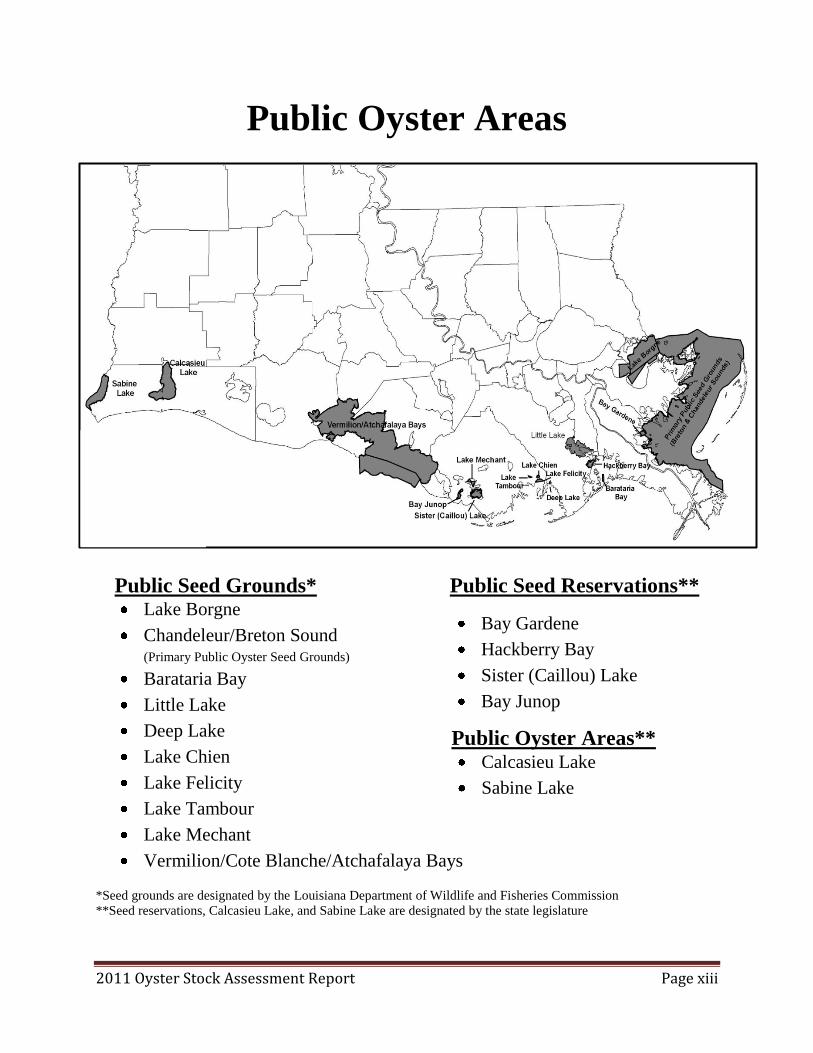
Mortality
Mortality estimates were highly variable between size classes and stations (Table 2.2). Spat
mortalities ranged from 33.3 to 100%. However, as stated above live spat were only sampled at 5
stations with dead spat noted at 13. Seed mortalities ranged from 0.0 to 100% with an average
mortality of about 40%. There was no sack-sized mortality noted in the assessment samples, but
sample sizes were extremely low and it was apparent that previous mortality events had already
taken place on many of the stations.
Table 2.1. Mean density and abundance of live oysters per reef system. Percent changes are from
2010 Stock Assessment.
Station Approx. Reef
Acres Seed Oysters
per m2
Sack Oysters per m
2
Number of Seed Oysters
(bbls)
Number of Sack Oysters
(bbls)
1 Snake
506 0 0 0 0
2 Jessie
59 1.8 0 597 0
3 North Lonesome
896 0 0 0 0
5 Bayou Lost
118 1.8 1.2 1194 1592
6 Lonesome
473 0 0.2 0 1063
- 2009 Shell plant
243 6.4 1.6 8742 4371
7 Black Bay
301 0 0.8 0 2707
8 West Bay Crabe
501 0 0.2 0 1126
9 Stone
461 0.4 0.2 1036 1036
10 South Black Bay
145 0.2 1.0 163 1630
11 Elephant
339 0.2 3.4 381 12957
12 Curfew
425 0.2 0.2 478 956
13 North California
109 0.2 1.0 123 1225
14 California
7 0.2 0.4 8 31
16 Sunrise
174 0.4 1.4 391 2738
17 Bay Long
572 0.4 3.0 1286 19291
19 Mangrove
937 0 0 0 0
20 West Pelican
293 0.2 0.6 329 1976
21 Bay Crabe
659 0.0 0.8 0 5927
22 East Bay Crabe
122 0.0 0.2 0 274
23 East Bay Gardene
28 0.4 1.2 63 378
24 Bay Gardene
69 0.2 0 78 0
4,26 North Black Bay
315 0 0 0 0
15 Telegraph
127 0 1.8 0 2570
18 East Pelican
782 0 0.2 0 1758
25 Battledore
1419 0 0 0 0
27,30 Lake Fortuna
4288 0 0 0 0
28,29 Wreck 2276 0.1 0.2 1279 5117
2011 Totals
16,148 68,725
Percent Change -84.8% +72.9%
CSA 1S – 2011 Oyster Stock Assessment Report Page 2-5
Deepwater Horizon Oil Spill and Related Response Actions
The Deepwater Horizon oil spill released millions of barrels of oil into the Gulf of Mexico
affecting the Louisiana coastline, including oyster habitat. In direct response to the spill, in an
effort to keep incoming oil from the Gulf out of Louisiana’s sensitive marshes and estuaries,
freshwater was released from diversions and siphons along the Mississippi River. The impacts of
oil and freshwater diversions on oyster health and habitat continue to be of concern. Assessment
continues on the direct and indirect impacts of oil and response actions to Louisiana’s near shore
environment, including to oysters and oyster habitat.
Fouling Organisms
Hooked mussels (Ischadium recurvum) are a sessile bivalve that is oftentimes associated with
oyster reefs and competes with oysters for food and settlement surfaces. During the assessment
samples hooked mussels were present at each station and ranged in density from 3.2 to 422.5
individuals / m2. Overall hooked mussel density has increased over the previous assessment with
the largest increases in density coming from reefs in Black Bay and Bay Gardene. Although
some decreases were noted they were of a small magnitude.
Additionally, a sponge-like covering has been present on much of the live oysters and exposed
shell in within the assessment area. This covering can be quite thick and widespread on the shell
and may limit the attachment of oyster larvae.
Oyster Predators/Disease
The southern oyster drill (Stramonita haemastoma) is a predatory marine gastropod known to
prey on oysters and other sessile animals using a small tooth-like scraping organ called a radula
to bore a hole through the oyster shell. Snails were found at only one station (Wreck) with no
egg cases found in any of the samples. The recent extended periods of low salinity may have
limited snail abundance in the area. No stone crabs (Mennipe adinia) or blue crabs (Callinectes
sapidus) were observed in the samples.
Perkinsus marinus (= dermo), a protozoan parasite that infects oyster tissue, is known to cause
extensive oyster mortalities especially under high salinity and high water temperature conditions.
Dermo samples were attempted at 7 stations throughout the area. Of those seven stations only
five contained sufficient sack-sized oysters and only one contained enough oysters for a seed-
size analysis (see Dermo section in this document for further information).
Tropical and Climactic Events
There were no substantial tropical systems impacting the northern Gulf of Mexico during the
assessment period. However, record rainfall along the Mississippi River drainage led to severe
and prolonged flood conditions along most of its reach, including Louisiana. River levels
prompted the opening of both the Bonnet Carre Spillway and the Morganza Floodway to protect
the cities of New Orleans and Baton Rouge.
CSA 1S – 2011 Oyster Stock Assessment Report Page 2-6
The main input of freshwater to the Basin during this flood event was from main-stem
distributaries and breaches/spillways, such as the Pointe a la Hache relief outlet located below
the town of Pointe a la Hache, Louisiana. This outlet comprises several river miles of low levees
that are regularly overtopped with high Mississippi River stages. Salinities throughout the entire
system were depressed through the spring and early summer and, in most areas, showed a steady
decline from late winter until conditions changed in late June and early July. (Figure 2.3).
On several of the reefs salinities remained under 5 parts per thousand (ppt) for 2 to 3 weeks.
Most of the areas adjacent to the River remained under 5 ppt for much longer. By the time of
assessment, all station bottom salinities had risen to greater than 5 ppt. Worth noting, however,
was a 2.7 ppt surface salinity at Battledore reef which shows the continual residence and
movement of the freshwater within systems near the River.
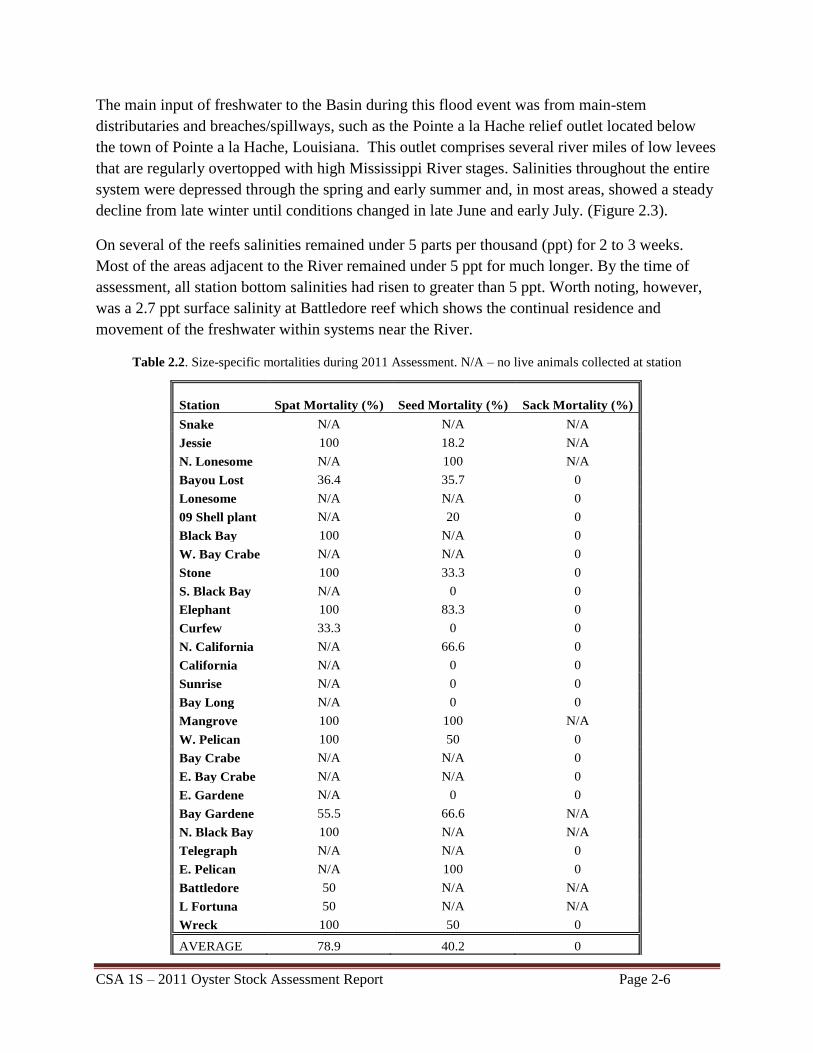
Table 2.2. Size-specific mortalities during 2011 Assessment. N/A – no live animals collected at station
Station Spat Mortality (%) Seed Mortality (%) Sack Mortality (%)
Snake N/A N/A N/A
Jessie 100 18.2 N/A
N. Lonesome N/A 100 N/A
Bayou Lost 36.4 35.7 0
Lonesome N/A N/A 0
09 Shell plant N/A 20 0
Black Bay 100 N/A 0
W. Bay Crabe N/A N/A 0
Stone 100 33.3 0
S. Black Bay N/A 0 0
Elephant 100 83.3 0
Curfew 33.3 0 0
N. California N/A 66.6 0
California N/A 0 0
Sunrise N/A 0 0
Bay Long N/A 0 0
Mangrove 100 100 N/A
W. Pelican 100 50 0
Bay Crabe N/A N/A 0
E. Bay Crabe N/A N/A 0
E. Gardene N/A 0 0
Bay Gardene 55.5 66.6 N/A
N. Black Bay 100 N/A N/A
Telegraph N/A N/A 0
E. Pelican N/A 100 0
Battledore 50 N/A N/A
L Fortuna 50 N/A N/A
Wreck 100 50 0
AVERAGE 78.9 40.2 0

CSA 1S – 2011 Oyster Stock Assessment Report Page 2-7
2010/2011 SEASON SUMMARY
Given the declining availability of the resource and potential impacts from the Deepwater
Horizon Oil Spill, the Public Seed Grounds east of the River were not opened for the regular
2010/2011 season. Although historical records are incomplete, this may be the first time that the
entire public oyster seed ground was closed to harvest for the entire season.
Cumulative Impacts and Mortalities
This section will focus on greater detail concerning some environmental conditions observed as
well as direct impacts that have occurred since the 2010assessment or continue to impact the
oyster resource. It is also important to note that many of the topics listed below are correlated
with one another, i.e. freshwater inputs-salinity stratification-hypoxia.
Hypoxia
The definition of hypoxia varies as it is based on the percent saturation of water by oxygen. This
varies with temperature and amount of other solutes. For most environmental assessments in this
area hypoxia can be viewed as concentrations of dissolved oxygen below 3 milligrams per liter
(mg/L).
As oysters are a sessile species, reef systems can often be impacted by hypoxia in an estuarine
setting. Within the Pontchartrain Basin estuary the most common driver of hypoxia over reef
systems is the stratification of the water column due to differing density water masses in turn
driven by salinity and temperature. Basically, warmer, fresher water overrides denser salt water
and does not allow the diffusion of oxygen throughout the water column. This is common in
areas that have experienced high freshwater inputs, especially after the high flows have stopped
and allow higher saline bottom waters to return. This can also be modified by amount of sunlight
and physical mixing (wind/current). In other cases, in relatively confined areas, increases in
biological oxygen demand can also lead to hypoxia, although localized.
Although some instance of hypoxia is “usual” in most areas, prolonged exposure can result in
reduced growth, decreased disease resistance, or direct mortality. During the assessment period
nine of the stations experienced DO values less than 3 mg/L. At the time of writing many areas
within the Pontchartrain Basin were still experiencing hypoxia with several areas showing levels
approaching anoxia (extremely low dissolved oxygen).
Freshets
As mentioned previously, the Mississippi River reached, and remained at, flood stage for an
extended period in early 2011. Higher than average River discharge also occurred late in 2010.
Salinities were suppressed over many of the reefs below the “critical” concentration of 5 ppt.
These lowered salinities also coincided with warm water temperatures. This is the fourth
consecutive year of abnormally high spring inputs or late season increases in Mississippi River
discharge. While freshets often provide benefits to the reef system, either by reducing disease or

CSA 1S – 2011 Oyster Stock Assessment Report Page 2-8
predation, or enhancing cultch opportunities, we must also realize that other variables are also
operating at the same time. The impact/recovery may also be modified by not only the magnitude
of a freshet, but also the duration and timing. Specifically this area has experienced two such
events over the assessment period occurring during, or very near, peak spring and fall spawning
times.
Figure 2.3. Weekly bottom salinities from August 2010 through July 2011 over 5 selected reef
areas.
Sedimentation/Subsidence
During periods of high freshwater input sedimentation over reefs can be a problem. This
sedimentation can affect the reef either through direct mortality (burial) or through reduced
growth and reproduction (both production and clean places for larval attachment). During the
2011 assessment, divers noted on several reefs that some of the cultch had a covering of silt and
still others had buried cultch. Both of these conditions limit the amount of suitable substrate
available for larval settlement.
Subsidence of the reefs is usually balanced by reef accretion or growth. If no appreciable shell is
added over a period of time, the reefs, especially those in less than optimal environments, will
subside to the point of shell burial. The lowering of the reef profile also subjects associated
0
5
10
15
20
25
30
1 3 5 7 9 11 13 15 17 19 21 23 25 27 29 31 33 35 37 39 41 43 45 47 49 51
Salin
ity
(pp
t)
Week
Gardene
Crabe
Sunrise
Stone
Fortuna
Aug 2010 Jul 2011
CSA 1S – 2011 Oyster Stock Assessment Report Page 2-9
organisms to more frequent hypoxia events as well as changing the local water flow and
sedimentation processes.
Cultch Condition
Any successful spat set is dependent on clean, stable cultch for larval attachment. As stated in
previous sections the condition of the cultch within the Basin appears to be currently poor. Many
areas are buried or covered with a thin layer of silt. Much of the shell within areas east of the
river is also covered with an algal/sponge growth. Although still under investigation at time of
writing, widespread covering of a substance on shell may limit attachment points for oyster
larvae. In other areas, the addition of shell to a reef has become so infrequent that the cultch on
hand is being transformed into small “hash” particles that may not provide optimal substrate for
larval attachment.
Harvest
Although no harvest was authorized on the public reefs within the assessment area, harvest over
the previous years, especially seed harvest, should be included in cumulative impacts.
Intra-assessment mortalities
Given all of the above we can also examine mortality estimates generated within the assessment
period to examine effects on abundance. This assessment period in particular had a unique study
conducted one month after the completion of the 2010 assessment. The study was initiated to
examine mortalities on the public and private oyster bottoms in the Breton and Barataria
estuaries. When looking at the public grounds in the Breton Sound estuary, recent mortalities of
seed and sack were estimated at 62.4 and 39.3%, respectively. More important to note was that
the areas further “inshore” suffered the highest mortalities. These are the areas with the greatest
production on the public grounds. For example, two stations in Bay Gardene both had combined
(seed+sack) mortalities of 100%. Bay Crabe was listed at 50% and Snake Island at 44%. These
three systems were responsible for 22% of the overall availability in the 2010 assessment. This
fell to 9% in the current assessment. More dramatically, in the 2010 assessment these three reef
systems had an estimated 26,247 barrels of seed-sized oysters. The 2011 assessment estimates
141 barrels, a decrease of 99.5%. In comparison, the 2011 assessment shows somewhat higher
mortality estimates on reefs in “offshore” areas when compared to the 2010 mortality study. The
results reflect the cumulative effects of factors within and prior to the assessment period acting
on a basin-wide level as well as the dynamic nature of these factors.

CSA 3 – 2011 Oyster Stock Assessment Report Page 3-1
Coastal Study Area (CSA) 3 – Oyster Stock Assessment
Introduction
For the purpose of oyster management, Coastal Study Area (CSA) 3 consists of three public
oyster areas distributed generally in a north-south direction within the Barataria Bay estuary: 1)
Little Lake Public Oyster Seed Grounds, 2) Hackberry Bay Public Oyster Seed Reservation, and
3) Barataria Bay Public Oyster Seed Grounds. Hackberry Bay is the oldest of the three as it was
designated by the Louisiana Legislature as a public oyster seed reservation in 1944. Barataria
Bay was designated by the Louisiana Wildlife and Fisheries Commission (LWFC) as a public
oyster seed ground in 2000, and Little Lake was designated by the LWFC in 2007. Coastal
Study Area 3 (CSA 3) has historically monitored three sampling sites for annual oyster stock
assessment, all in Hackberry Bay. Sampling has expanded in recent years, however, with the
addition of the Barataria Bay Public Oyster Seed Ground, and the addition of newly constructed
oyster reefs in Hackberry Bay.
Hackberry Bay (Jefferson/Lafourche Parishes) is an approximately 4402-acre mesohaline lake
with a mostly soft silt and clay bottom, of which approximately only 14.7 acres is naturally
occurring reef material. The three historical sampling sites within Hackberry Bay are the upper,
middle, and lower Hackberry sampling sites. The middle Hackberry site is the only site located
over historical existing reef while the upper and lower sites are over former cultch plants placed
on top of historical reefs. The upper Hackberry sampling site was the result of a 1994 cultch
plant using federal disaster funds from Hurricane Andrew in 1992. The upper site had also been
the location of cultch plants in 1943 (140 acres), 1945 (70 acres), 1946 (92 acres) and 1981 (67
acres). The 1994 cultch site was comprised of six different sections of substrate for a total of
145 acres. The substrates were crushed concrete, shucked shell, reef shell, mixed shell,
Kentucky limestone and Bahamian limestone. The lower Hackberry sampling site is on a reef
that was part of a 450 acre 1973 cultch plant. Since very little natural reef exists in the
Hackberry Bay Public Oyster Seed Reservation, production is highly dependent upon and
reflective of when and where cultch plants are placed in the bay. It is unknown how much, if
any, cultch material from the 1994 and earlier cultch plants remains exposed above the surface of
the mud. Therefore, the acreage of these cultch plants is not factored into the annual oyster stock
assessment.
In response to impacts from Hurricane Lilly in 2002, two cultch plants were placed in Hackberry
Bay in 2004. The northern Hackberry Bay cultch plant, 10 acres, was planted near the old 1994
cultch plant on May 10, 2004 using approximately 2,322 cubic yards of #57 limestone. The
southern Hackberry Bay cultch plant, 25 acres, was planted between May 10 and 12, 2004 using
approximately 4,005 cubic yards of #57 limestone.

CSA 3 – 2011 Oyster Stock Assessment Report Page 3-2
In 2008, a new cultch plant was placed in the northeastern portion of Hackberry Bay using
federal funds dedicated to the impacts of Hurricanes Katrina and Rita. The 2008 cultch plant is
approximately 50 acres in size and was planted between May 20 and 25, 2008 using
approximately 75% #57 limestone, 15% crushed concrete, and 10% oyster shell. The total
amount of material was approximately 10,171 cubic yards weighing approximately 13,223 tons.
The Barataria Bay Public Oyster Seed Ground was designated as a public oyster ground in
response to possible changes in the salinity regime of the estuary stemming from the Davis Pond
Freshwater Diversion project. Davis Pond is a large Mississippi River diversion project that aims
to reintroduce freshwater and nutrients into the Barataria Bay estuary. As this new coastal
restoration project was anticipated to reduce salinities in the estuary, LDWF felt that an
additional public oyster seed ground farther down-estuary may be productive during years with
high freshwater input. The only known reef in existence on the Barataria Bay Public Oyster
Seed Ground is a 40-acre reef constructed in 2004 utilizing Coastal Impact Assistance Program
(CIAP) and Oyster Seed Ground Development Account (compensation from oil and gas impacts)
funding. The reef is comprised of approximately 7,536 cubic yards of crushed concrete. The
Barataria Bay cultch plant was placed onsite from May 6 to 8, 2004 and is located in the
northeast section of the Barataria Bay Public Oyster Seed Ground. It is vulnerable to predators
such as oyster drills and other stressors (i.e., Dermo) associated with higher salinities. Consistent
production cannot be expected until salinity regimes in the basin change due to natural forces or
coastal restoration efforts.
On February 1, 2007 the Louisiana Wildlife and Fisheries Commission (LWFC) created the
Little Lake Public Oyster Seed Ground (POSG). This area had been utilized in the past as a
temporary natural reef area, last in 2004, and was once covered with private oyster leases. These
leases all fell within the Davis Pond freshwater diversion impact area and were either purchased
or moved by the state and federal government prior to the opening of Davis Pond. Davis Pond
has not been consistently utilized to its maximum capacity since it first opened in 2002, and
environmental conditions during some years have allowed oysters to continue to exist in Little
Lake. Therefore, the LWFC designated this area a public oyster ground so that oysters could be
harvested and reefs could be actively managed by LDWF. The location of the Little Lake POSG
makes it vulnerable to freshwater input from the northern portion of the basin such as heavy
rainfall, freshwater input from the Intracoastal Waterway and outflow from the Davis Pond
freshwater diversion. Reduced salinities caused by these sources of freshwater can have a
negative impact on oyster survival and availability. However, when higher salinities in the
northern portion of the basin exist the Little Lake POSG has allowed the oyster industry access
to additional seed and sack oysters in the Barataria Bay Basin. Since very little information on
reef acreage exists for Little Lake, LDWF hopes to undertake a water bottom assessment of the
area in the future.

CSA 3 – 2011 Oyster Stock Assessment Report Page 3-3
Materials and Methods
Samples used in this assessment were collected by CSA 3 staff on July 20 and 21, 2011. All
samples were taken using a one square-meter frame placed randomly on the bottom over reef at
each sampling location. Using SCUBA, all live and dead oysters, as well as shell, in the upper
portion (exposed) of the substrate were removed from the area enclosed in the frame. Live and
dead oysters, spat, fouling organisms, and oyster predators were identified and enumerated. All
oysters were measured in 5 millimeter work groups and divided into size groups of spat (0-
24mm), seed (25-74mm), and sack oyster (75mm and greater). A total of seven stations were
visited (Figure 3.1) with five replicate square meter samples taken at each location. The average
of the five samples at each station was used, in combination with reef acreage, to estimate the
current oyster availability for CSA 3. The Little Lake POSG was not sampled due to lack of reef
acreage information.
Results and Discussion
Seed and Sack Stock
Stock for the Hackberry Bay Public Oyster Seed Reservation (POSR), including the 2004 and
2008 cultch plants, is estimated at 18,341 barrels of seed size oysters and 2,955 barrels of market
size oysters for a total of 21,296 barrels of overall stock. Seed were present at all stations. Seed
availability is up 265% from 2010, 512% above the past 10 year average, and 29.4 % above the
long term average since 1976. Sack oysters were also present at all stations with stock up
144.9% from last year, 82.7% above the past 10 year average, but 63.7 % below the long term
average since 1976 (Table 3.1, Figure 3.2). Combined stock increased 242% over 2010, 361.6%
over the 10 year average, but 4.6 % below the long term average since 1976. Seed oysters
averaged 1.41 inches with approximately 89% in the 1-2 inch size range. Sack oysters averaged
3.53 inches with approximately 88% in the 3-4 inch size range. The increase in seed and sack
stock may be related to multiple factors such as salinity, predation levels, disease, exposed
cultch, and water temperature. In addition, the Hackberry Bay Public Oyster Seed Reservation
was closed to harvest on Nov 4, 2009 and remained closed through the stock assessment
sampling in 2011. This twenty month period without harvest could have allowed undisturbed
recruitment and growth resulting in an increase in stock. In addition to the harvest closure,
LDWF and LSU released approximately 100M larvae on June 2, 2011 at the 2004 North
Hackberry Bay Cultch Plant approximately 1.5 months prior to stock assessment sampling.
These larvae may have settled and grown to seed size by the time stock assessment sampling
occurred. Oyster leaseholders in surrounding bays reported a spatfall event in June 2011, so
natural oyster reproduction may have also contributed to the increase in seed oyster abundance.
Additionally, small sample sizes often lead to large amounts of variability around an estimate.
While statistical comparisons of the 2010 and 2011 estimate (stock size) variability have not
been conducted, a thorough statistical analysis may show that the increase is not statistically
significant and within the range of error expected from an estimate generated by low sample
sizes.

CSA 3 – 2011 Oyster Stock Assessment Report Page 3-4
No live spat, seed, or sack oysters were observed in the Barataria Bay POSG (Figure 3.1, Table
3.1). Market-size oyster availability has not been documented on the Barataria Bay POSG since
it was created in 2004.
Spat Production
Live spat were present at all stations in Hackberry Bay and ranged from 0 to 248 spat per square
meter with an average catch of 47.2. This is well above the long-term average since 1975 (6.6
spat/frame) and second only to 2000’s catch of 61.2 spat per square meter. The highest numbers
were found at both 2004 Hackberry Bay cultch plants. 79.5% of spat observed were greater than
½ inch (Figure 3.3).
No live spat were observed in the Barataria Bay POSG. Considerable fouling was observed on
the exposed cultch and may have contributed to the lack of a successful spat set. Since its
creation in May 2004, the only stock assessments with a record of spat were in the assessments
of 2005 (8 spat per M2), 2009 (53.5 spat per M
2), and 2010 (5.2 spat per M
2).
Fouling Organisms
The hooked mussel (Ischadium recurvum), is a reef-associated benthic bivalve species that
competes with oysters for food and settlement surfaces. Hooked mussels were present at all six
sampling locations located in Hackberry Bay with the highest densities at the 2004 North cultch
plant (Table 3.2). The average number of hooked mussels observed in the Hackberry Bay POSR
was 31.2 per square meter. This represents an increase over last year’s average of 19.7 per frame
and may be attributable to lower salinities in the basin.
Although no hooked mussels were found in any of the Barataria Bay POSG samples,
considerable fouling was observed on the cultch in all five replicate samples taken.
Mortality
Recent spat mortality on the Hackberry Bay POSR ranged from 6.1% to 13.3% with an average
of 9.4%. Recent seed oyster mortality ranged from 3.1% to 4.5% averaging 3.3%. No recent
mortalities in sack size oysters were observed (Table 3.2).
The Barataria Bay POSG exhibited 100% recent mortalities in both spat and seed oysters. A total
of five recently dead spat were observed in the five square meter samples taken in Barataria Bay.
Four recently dead seed oysters were observed in the same five samples. No live or recently dead
market size oysters were observed.
Additional sources of oyster mortality data available since the 2010 oyster stock assessment
include the on-going Nestier tray project and a special Oyster Mortality Study Project.

CSA 3 – 2011 Oyster Stock Assessment Report Page 3-5
Due to extended periods of depressed salinities during the spring and summer of 2010, an Oyster
Mortality Study was initiated in August 2010. Dredge samples were taken at multiple sites on
public grounds and private leases throughout the Barataria basin and oyster mortality was
recorded. Mortality on the public grounds was estimated at 45% for seed, 19.4% for sack, and
34.7% combined. Spat mortality was estimated at 49%. Locations in the upper estuary exhibited
higher mortality than those in the lower basin with the exception of Bay Jaques (100% mortality)
which is located near the mouth of the Mississippi River.
The Nestier tray project places oysters in trays at multiple sites throughout the Barataria basin in
January and mortality data is recorded from the trays on a monthly basis. By the end of May
2011, oyster mortality on the Nestier trays placed in Hackberry Bay in January 2011 was 7.7%.
One hundred percent mortality was observed at tray sites in Grand Terre Bay, Bay des Ilettes,
and Bay Batiste.
Oyster Predators
The Southern oyster drill (Stramonita haemastoma) is a predatory marine snail that feeds on
oysters and other sessile organisms using a radula (a small tooth-like rasping organ) to bore a
hole through the shell. Neither snails nor their associated egg cases were observed from any
samples on the Barataria Bay POSG or the Hackberry Bay POSR.
Tropical and Climatic Events
Higher than normal Mississippi River flows occurred in both 2010 and 2011. According to data
supplied by the United States Army Corps of Engineers (USACE) website, Mississippi River
flow was above the LTA (1961-2010) in January, February, and from May to October 2010.
Flow was also above the LTA from March through June 2011 (Figure 3.4). Both the Morganza
and Bonnet Carre’ spillways were opened in 2011 to relieve pressures on New Orleans levees.
Output through the Davis Pond freshwater diversion through most of 2010 and 2011 continued to
be above the long term average since the structure opened in 2002 (Figure 3.5). According to the
United States Geologic Survey (USGS) constant data recorder located near the structure’s
outflow, Davis Pond flow averaged 3,094 cubic feet per second from January 2010 to June 2011
with monthly flow rates varying between 209 cfs and 7,944 cfs.
With the exception of March 2011, southeast Louisiana rainfall monthly totals were below
normal from September 2010 through June 2011 (Figure 3.6). Rainfall for July 2011 was 5.4
inches above normal. (Data from the Southern Regional Climate Center).
On July 25, 2010, what was left of Tropical Storm Bonnie made landfall near the southeastern tip
of Louisiana as a remnant low pressure system and continued inland over east-central Louisiana

CSA 3 – 2011 Oyster Stock Assessment Report Page 3-6
with no significant effect on the study area. No other tropical systems have affected the study
area since the 2010 stock assessment.
Hackberry Bay POSG salinities from January 2010 to June 2011 averaged 5.7 ppt. with a range
of 0.44 to 14.95 ppt. (Figure 3.8). Average for June 2011 was 14.95 ppt. which is well above the
June 2001 to 2010 average of 10.7 ppt. (Figure 3.7) (USGS Hackberry Bay constant data
recorder).
Salinities in the Barataria Bay POSG have averaged 17.2 ppt. with a range of 8.9 to 23.2 ppt.
(Figure 3.8) since January of 2010. The average salinity in June was 8.9 ppt. (USGS Barataria
Bay constant data recorder).
Salinities in the Little Lake POSG averaged 4.5 ppt. between January 2010 and June 2011
(Figure 3.8) with a range from 0.53 to 12 ppt. Average June 2011 salinity in the Little Lake
POSG was 12 ppt. (USGS Little Lake constant data recorder).
Non-Climatic Events
Deepwater Horizon Oil Spill and Related Response Actions
The BP Deepwater Horizon oil spill released millions of barrels of oil into the Gulf of Mexico
affecting the Louisiana coastline, including oyster resources. In direct response to the spill, in an
effort to keep incoming oil from the Gulf out of Louisiana’s sensitive marshes and estuaries,
freshwater was released from diversions and siphons along the Mississippi River. The impacts
of oil and freshwater diversions on oyster health and habitat continue to be of concern.
Assessment continues on the direct and indirect impacts of oil and response actions to
Louisiana’s near shore environment, including to oysters and oyster habitat.
Oyster Larvae and Spat Deployment
A joint effort between LDWF and Louisiana State University (LSU) is producing oyster larvae
and spat at the LSU oyster hatchery at LDWF’s Fisheries Research Laboratory located on Grand
Isle. LSU is developing and testing methods for high density oyster larval production. LDWF
has utilized the larvae/spat to develop and test deployment methods of the young oysters onto
public oyster areas. Since June 2, 2011 approximately 90 million oyster larvae and 1.4 million
spat have been deployed in the Hackberry Bay Public Seed Reservation. All releases to date have
occurred over existing cultch plant locations within the bay with the most recent release
occurring on August 10, 2011 at the 2004 south cultch plant.
2010/2011 Oyster Season Summary
The 2010/2011 oyster season remained closed in Hackberry Bay. No harvest was observed in the
Little Lake or Barataria Bay Public Oyster Seed Grounds (Table 3.3).

CSA 3 – 2011 Oyster Stock Assessment Report Page 3-7
Figure 3.1 2011 Hackberry Bay POSR and Barataria Bay POSG sample results as an average
per square meter (SP=Spat, SD=Seed, SK=Sack, and M=Mussels) and map of sample locations.

CSA 3 – 2011 Oyster Stock Assessment Report Page 3-8
Table 3.1 2011 square meter results for the Barataria Basin (CSA 3).
Average Average
Approx Live Seed Live Sack Barrels of Seed Barrels of Sack Oyster
Station No. Reef Acres Oysters / M2 Oysters / M2 Available Available Spat/M2
Hackberry Bay 2004 6 10 92.6 6.8 5,204.8 764.4 98.8
North Cultch Plant
Hackberry Bay 2004 7 25 65 4.4 9,133.6 1,236.5 92.6
South Cultch Plant
Hackberry Bay 9 50 12.6 1.6 3,541.0 899.3 32.8
2008 Cultch Plant
Hackberry Bay 1,2,3 14.7 5.6 0.33 461.8 54.4 19.6
Existing Reefs
Barataria Bay 8 40 0 0 0 0 0
2004 Cultch Plant
Little Lake Unknown Unknown Unknown Unknown Unknown
Totals 139.7 18,341.2 2,954.7
2010 2011 % Change
Seed 5,019.7 18,341.2 +265.4 %
Sack 1,206.7 2,954.7 +144.9%
Total 6,226.4 21,295.9 +242.0%

CSA 3 – 2011 Oyster Stock Assessment Report Page 3-9
Table 3.2 2011 square meter predator/mortality results for the Barataria Basin (CSA 3).
Figure 3.2 Estimated seed and sack oyster availability in the Hackberry Bay Public Oyster Seed
Reservation from 1976 to 2011. * includes the 2004 cultch plants **includes the 2008 cultch plant.
Oyster Spat Seed Sack Seed & Sack All Size
Hooked Drills Percent Percent Percent Percent Percent
Station No. Mussels/m2Present Mortality Mortality Mortality Mortality Mortality
Hackberry Bay 2004 6 106.8 0 6.1 3.1 0 2.9 4.5
North Cultch Plant
Hackberry Bay 2004 7 33.4 0 9.7 3.3 0 3.1 6.5
South Cultch Plant
Hackberry Bay 9 6.8 0 10.4 3.1 0 2.7 7.6
2008 Cultch Plant
Hackberry Bay 1,2,3 13.5 0 13.3 4.5 0 4.3 11.3
Existing Reefs
Barataria Bay 8 0 0 100 100 na 100 100
2004 Cultch Plant
Little Lake Unknown
0.05.0
10.015.020.025.030.035.040.045.050.055.060.065.070.075.080.085.090.095.0
100.0
19
76
19
77
19
78
19
79
19
80
19
81
19
82
19
83
19
84
19
85
19
86
19
87
19
88
19
89
19
90
19
91
19
92
19
93
19
94
19
95
19
96
19
97
19
98
19
99
20
00
20
01
20
02
20
03
20
04
20
05
20
06
20
07
*2
00
8*
20
09
*2010**2011**
Nu
mb
er
of
Bar
rels
(Th
ou
san
ds)
Year
Bbls seedBbls sackSeed LTASack LTA

CSA 3 – 2011 Oyster Stock Assessment Report Page 3-10
Figure 3.3 Oyster size distribution by 5 mm work groups in square meter samples collected from the
Hackberry Bay Public Oyster Seed Reservation during 2011.
Figure 3.4 Mississippi River discharge in thousands of cfs. Mississippi River discharge data supplied
by the United States Army Corps of Engineers (USACE).
0
5
10
15
20
25
30
35
40
45
50
0 1 2 3 4 5 6 7 8 9 10 11 12 13 14 15 16 17 18 19 20 21 22 23 24 25
Ave
rage
Nu
mb
er
of
Oys
ters
pe
r Sq
uar
e M
ete
r
5 mm Work Groups
2008 Cultch Plant (n=5) 2004 Cultch Plants (n=10) Historic Stations (n=15)
0
200
400
600
800
1000
1200
1400
1600
Jan
Fe
b
Ma
r
Ap
r
Ma
y
Jun
e
July
Au
g
Se
pt
Oct
No
v
De
c
CF
S t
ho
usa
nd
s
1961-2010 2010 2011
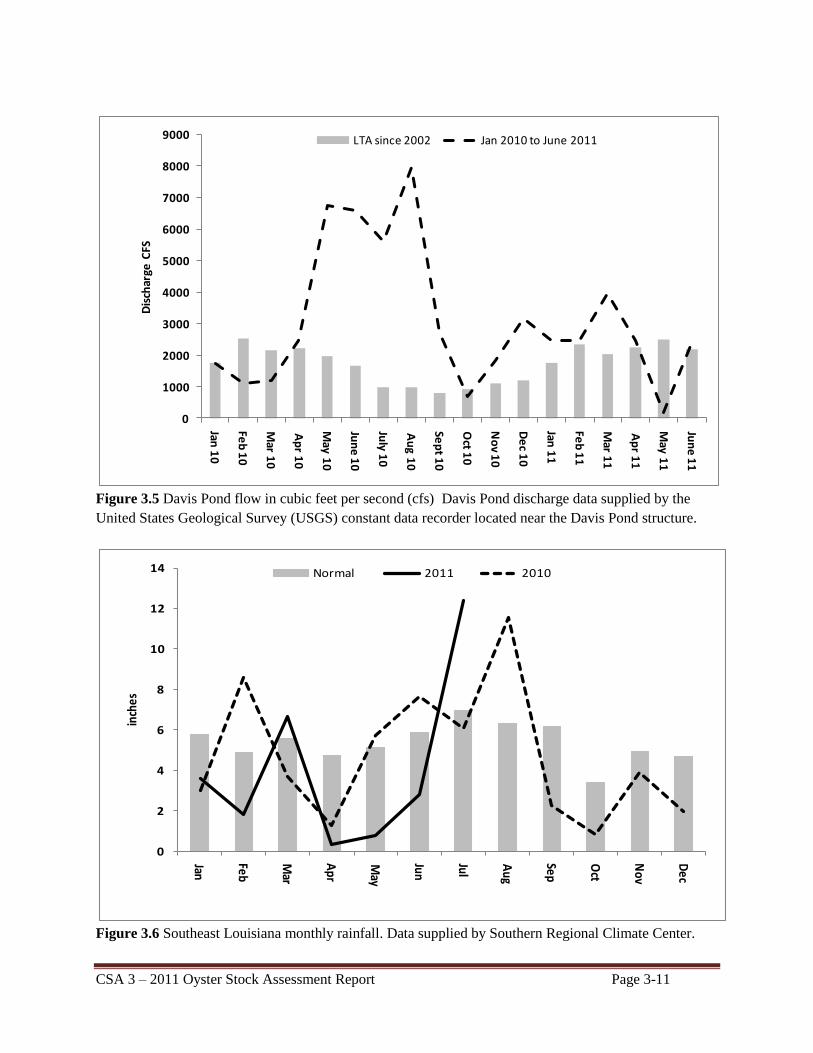
CSA 3 – 2011 Oyster Stock Assessment Report Page 3-11
Figure 3.5 Davis Pond flow in cubic feet per second (cfs) Davis Pond discharge data supplied by the
United States Geological Survey (USGS) constant data recorder located near the Davis Pond structure.
Figure 3.6 Southeast Louisiana monthly rainfall. Data supplied by Southern Regional Climate Center.
0
1000
2000
3000
4000
5000
6000
7000
8000
9000
Jan 1
0
Feb
10
Mar 1
0
Ap
r 10
May 1
0
Jun
e 1
0
July 1
0
Au
g 10
Sep
t 10
Oct 1
0
No
v 10
De
c 10
Jan 1
1
Feb
11
Mar 1
1
Ap
r 11
May 1
1
Jun
e 1
1
Dis
char
ge C
FSLTA since 2002 Jan 2010 to June 2011
0
2
4
6
8
10
12
14
Jan
Feb
Mar
Apr
May
Jun
Jul
Aug
Sep
Oct
Nov
Dec
inch
es
Normal 2011 2010
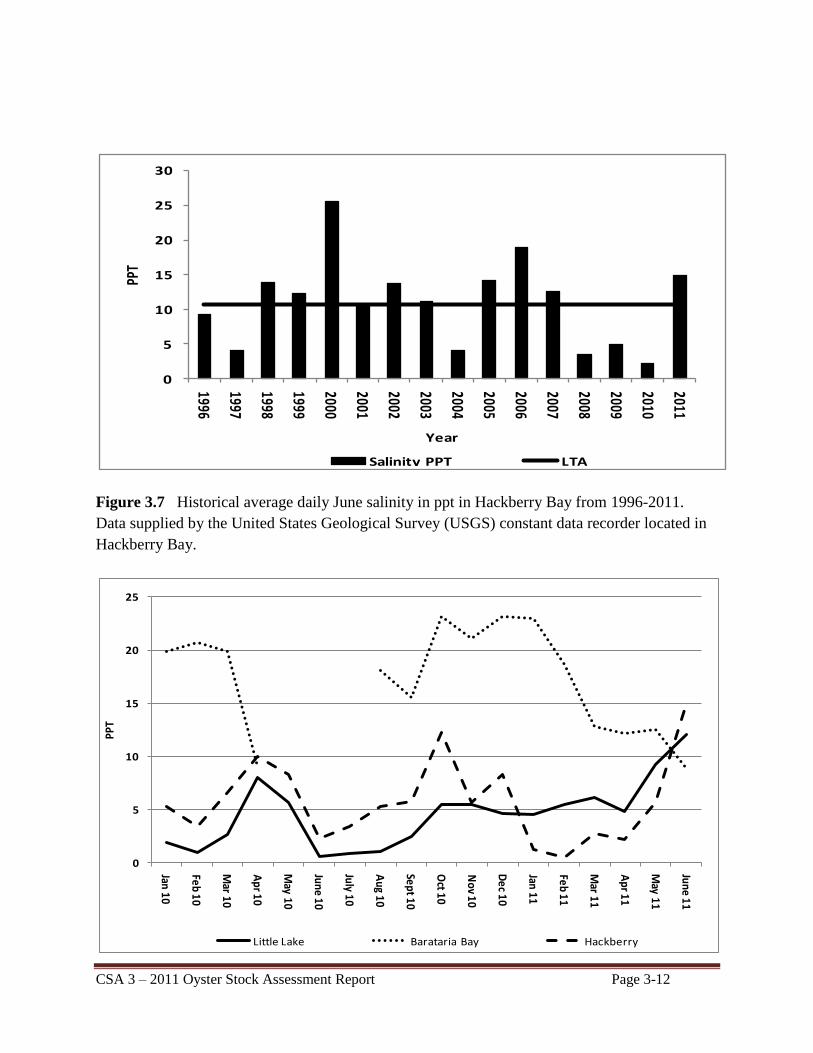
CSA 3 – 2011 Oyster Stock Assessment Report Page 3-12
Figure 3.7 Historical average daily June salinity in ppt in Hackberry Bay from 1996-2011.
Data supplied by the United States Geological Survey (USGS) constant data recorder located in
Hackberry Bay.
0
5
10
15
20
25
30
1996
1997
1998
1999
2000
2001
2002
2003
2004
2005
2006
2007
2008
2009
2010
2011PP
T
Year
Salinity PPT LTA
0
5
10
15
20
25
Jan 10
Feb 10
Mar 10
Apr 10
May 10
June 10
July 10
Aug 10
Sept 10
Oct 10
Nov 10
Dec 10
Jan 11
Feb 11
Mar 11
Apr 11
May 11
June 11
PPT
Little Lake Barataria Bay Hackberry

CSA 3 – 2011 Oyster Stock Assessment Report Page 3-13
Figure 3.8 Average monthly salinities in the Barataria Bay POSG, Little Lake POSG and
Hackberry Bay POSR from Jan 2010 through June 2011. Data from United States Geological
Survey (USGS) constant data recorders located in the Barataria Bay POSG, Little Lake POSG
and Hackberry Bay POSR.
Table 3.3 Estimates of oyster harvest from the public oyster areas in Coastal Study Area 3 for the
2010/2011, 2009/2010, 2008/2009, 2007/2008, and 2006/2007 season.
Public Oyster Area
Seed Oysters Harvested
(BBLS)
Sack Oysters Harvested (Sacks)
2010/2011 CSA 3 Totals 0 0
2009/2010 CSA 3 Totals 7,885 504
2008/2009 CSA 3 Totals 1,985 3,270
2007/2008 CSA 3 Totals 13,930 976
2006/2007 CSA 3 Totals 12,190 6,091

CSA 5 - 2011 Oyster Stock Assessment Report Page 5-1
Coastal Study Area (CSA) 5 - Oyster Stock Assessment
Introduction
The Terrebonne Basin (TB) historically included Coastal Study Areas (CSA) IV and V, and separate
oyster stock assessment reports were completed for each area. The two CSAs were merged in 2010
and renamed as CSA V.
There are currently eight different Public Oyster Seed Reservations (POSR) or Public Oyster Seed
Grounds (POSG) within the Terrebonne Basin; these include Sister Lake (Caillou Lake) POSR, Bay
Junop POSR, Lake Mechant POSG, Deep Lake POSG, Lake Felicity POSG, Lake Chein POSG, and
Lake Tamour POSG. Sister Lake, Bay Junop, and Lake Mechant are located in the western TB while
Deep Lake, Lake Felicity, Lake Chein, and Lake Tamour are found in the eastern TB (Figures 5.1 and
5.2).
Sister Lake (Caillou Lake) (Figure 5.1) was designated as a POSR in 1940 and includes 7,752 acres of
water bottoms. The first known cultch deposition projects were established here between 1906-1909
by the U.S. Bureau of Fisheries. Subsequent plantings by the State of Louisiana began in Sister Lake
in 1917; since then 21 cultch plants totaling 4,562 acres have been made. Recent Sister Lake cultch
deposition projects included a 67 acre site in 2004 and a 156 acre site in 2009. A recent 2005 side
scan sonar survey in Sister Lake documented a total reef acreage of 2,279 acres, an increase of 45%
from the earlier estimate of 1,566 acres.
The Bay Junop POSR (Figure 5.1) was established in 1948 and consists of approximately 2,448 acres
of water bottoms. Due to the shallow water depth of the bay and inability of barges and tugs to enter
for cultch deposition, no reef-building projects have been implemented in this area to augment natural
oyster reef production. Total reef acreage in this bay is estimated at approximately 158 acres.
The Lake Mechant POSG (Figure 5.1), with approximately 2,131 acres of water bottoms, was
designated in 2001. In 2004, a 30 acre cultch plant was established. In 2007, approximately 500 acres
of unleased water bottoms between the POSG and private oyster leases was added, which increased
the total acreage within the public oyster seed ground to 2,631 acres.
The Lake Tambour, Lake Chein, Lake Felicity, and Deep Lake POSGs (Figure 5.2) were
established in 2001. These POSGs are located either in a high-salinity zone (where oyster
populations are primarily intertidal because of extensive predation) or a wet zone (where subtidal
oysters may be found when salinities are lower than normal). The upper portion of Lake Felicity
was used as a public seed reservation during the 1940s and early 1950s, but was discontinued
because salinities were usually too high for oyster production. However, future planned coastal
freshwater diversion projects may return the area to a more favorable salinity regime for oyster
production.

CSA 5 - 2011 Oyster Stock Assessment Report Page 5-2
Figure 5.2. Public oyster areas within the eastern portion of Coastal Study Area (CSA) 5.
Figure 5.1. Public oyster areas within the western portion of Coastal Study Area (CSA) 5.
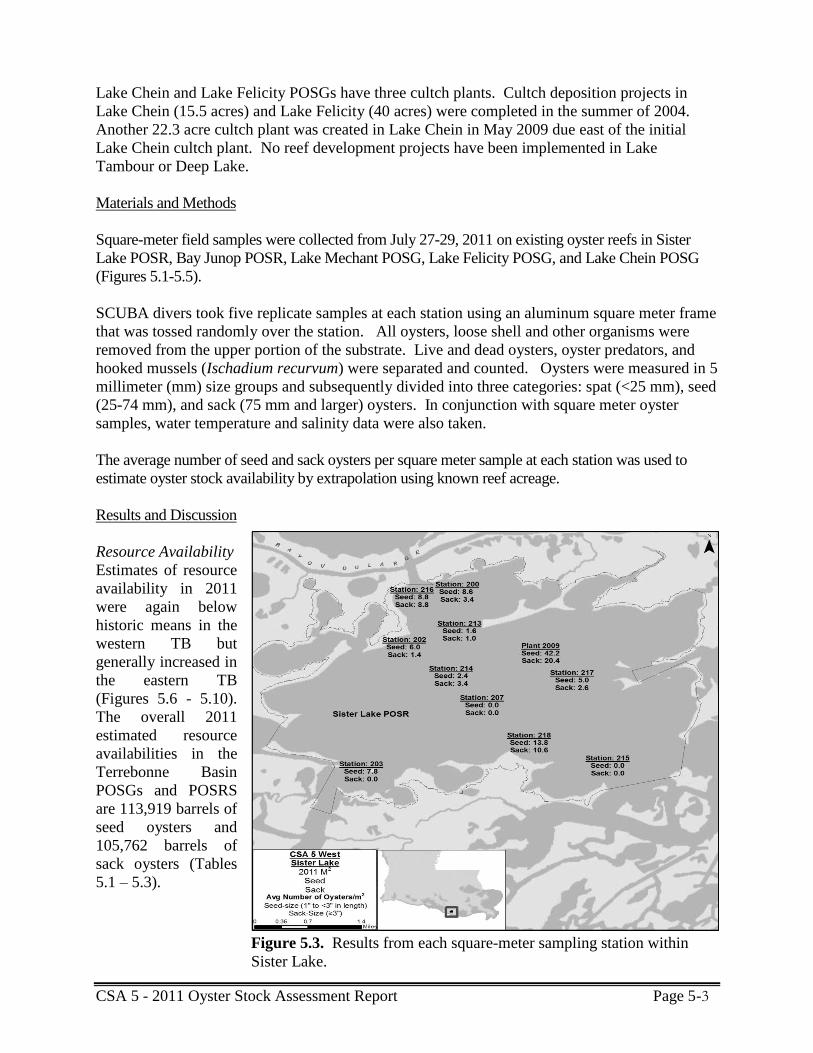
CSA 5 - 2011 Oyster Stock Assessment Report Page 5-3
Lake Chein and Lake Felicity POSGs have three cultch plants. Cultch deposition projects in
Lake Chein (15.5 acres) and Lake Felicity (40 acres) were completed in the summer of 2004.
Another 22.3 acre cultch plant was created in Lake Chein in May 2009 due east of the initial
Lake Chein cultch plant. No reef development projects have been implemented in Lake
Tambour or Deep Lake.
Materials and Methods
Square-meter field samples were collected from July 27-29, 2011 on existing oyster reefs in Sister
Lake POSR, Bay Junop POSR, Lake Mechant POSG, Lake Felicity POSG, and Lake Chein POSG
(Figures 5.1-5.5).
SCUBA divers took five replicate samples at each station using an aluminum square meter frame
that was tossed randomly over the station. All oysters, loose shell and other organisms were
removed from the upper portion of the substrate. Live and dead oysters, oyster predators, and
hooked mussels (Ischadium recurvum) were separated and counted. Oysters were measured in 5
millimeter (mm) size groups and subsequently divided into three categories: spat (<25 mm), seed
(25-74 mm), and sack (75 mm and larger) oysters. In conjunction with square meter oyster
samples, water temperature and salinity data were also taken.
The average number of seed and sack oysters per square meter sample at each station was used to
estimate oyster stock availability by extrapolation using known reef acreage.
Results and Discussion
Resource Availability
Estimates of resource
availability in 2011
were again below
historic means in the
western TB but
generally increased in
the eastern TB
(Figures 5.6 - 5.10).
The overall 2011
estimated resource
availabilities in the
Terrebonne Basin
POSGs and POSRS
are 113,919 barrels of
seed oysters and
105,762 barrels of
sack oysters (Tables
5.1 – 5.3).
Figure 5.3. Results from each square-meter sampling station within
Sister Lake.

CSA 5 - 2011 Oyster Stock Assessment Report Page 5-4
These estimates represent declines in oyster stocks from the historic means of -57% for seed and
-53% for market-size (sack) oysters. As has been the case in previous years, total oyster stock
size in the Terrebonne Basin is driven largely by oyster stock availability in Sister Lake.
Although estimated resource availabilities in Sister Lake was reduced 54% for seed oysters and
48% for market oysters from historic means (Figure 5.6), 2011 estimates of sack oysters was
greater than during any year since 2007. The increase in 2011 Sister Lake sack oyster resource
availability is partially attributed to the addition of the 2009 156-acre cultch plant, which
contributed 37% of the total estimated sack oyster production (Figure 5.3).
Spat Production
Numbers of spat increased 82% and 72% from historic means in Sister Lake and Lake Mechant
but showed declines of 100% in Bay Junop, 77% in Lake Felicity, 74% in the 2004 Lake Chein
cultch plant, and 50% in the 2009 Lake Chein cultch plant.
Figure 5.4. Results from square-meter sampling stations within Bay Junop and Lake Mechant.

CSA 5 - 2011 Oyster Stock Assessment Report Page 5-5
Hydrological Data
Average salinities
and temperatures
on the cultch plants
associated with
May-June oyster
dredge samples are
provided in Tables
5.4 and 5.5. Mean
water temperatures
were below
average in the
western TB and
average in the
eastern TB. Mean
salinities were near
average in the
western TB but
above average in
the eastern TB.
Salinities in the
western TB July
square meter
samples were
substantially lower
than May-June
dredge samples.
Salinity data collected in conjunction with July square meter samples averaged 6.0 ppt, 7.3 ppt,
0.8 ppt, 18.8 ppt, and 17.8 ppt in Sister Lake, Bay Junop, Lake Mechant, Lake Felicity, and
Lake Chein, respectively.
Mortality
Recent mortalities of spat, seed or sack oysters in square meter samples for 2011 as compared to
long-term means are provided in Table 5.6. Except for Lake Mechant, 2011 mortalities of seed
and sack oysters declined versus historic means.
Fouling Organisms / Predators / Disease
The only oyster reef associated species collected in square meter samples were hooked mussels and
mud crabs (Table 5.7). No predators such as oyster drills (Stramonita haemastoma), gulf stone crabs
(Menippe adina), and blue crabs (Callinectes sapidus) were observed.
Dermo (Perkinsus marinus), a protozoan parasite found in oysters, may cause extensive oyster
mortalities in conditions of high salinities and water temperatures. The results of the Dermo tests from
CSA V public oyster areas are included in a separate section.
Figure 5.5. Results from square-meter sampling stations within Lake
Chien and Lake Felicity.

CSA 5 - 2011 Oyster Stock Assessment Report Page 5-6
Deepwater Horizon Oil Spill and Related Response Actions
The BP Deepwater Horizon oil spill released millions of barrels of oil into the Gulf of Mexico
affecting the Louisiana coastline, including oyster resources. The impacts of oil on oysters
resources continue to be of concern. Assessment continues on the direct and indirect impacts of
oil and response actions to Louisiana’s near shore environment, including to oysters and oyster
habitat.
Tropical Weather / Flooding Events
No tropical weather events impacted Terrebonne Parish oyster populations in summer of 2011.
Abnormally high river discharges in the Atchafalaya River reduced salinities in western
Terrebonne Parish in summer 2011.
2010/2011 Oyster Season Summary
Oyster harvests on the POSGs and POSRs were monitored through boarding reports and trip
ticket records. These data were used to calculate annual estimates for each public oyster area
(Tables 5.8 and 5.9).
Sister Lake: Sister Lake was closed for the 2010-2011 season.
Lake Mechant: Lake Mechant was open from October 29-31, 2010. Effort was very low because of
persistent rough weather conditions and the Department of Health and Hospitals (DHH) seasonal
classification closure of the northern portion of the POSG. Eleven boats were observed on opening
day, but boarding interviews were cancelled because of extremely rough seas; unfortunately, only two
trip tickets were submitted as most fishermen harvested only seed and trip tickets are not required to
document seed oyster harvest. The trip ticket data could not be reported because of confidentiality
requirements.
Bay Junop: Bay Junop was open from November 15-21, 2010. Fishing effort was very low because
of a DHH closure which excluded the majority of the POSR to oyster harvest. Thirteen trip tickets
were documented; a total of 433 sacks of oysters were harvested.
Lake Chein / Lake Felicity: Lake Felicity and Lake Chein excluding the 2009 cultch plant were
open from November 15-16, 2010. Boarding reports were obtained from vessels in both Lake
Felicity and Lake Chein. Eight vessel days of effort yielding 405 sacks of market oysters were
documented in Lake Chein. Harvest activity in Lake Felicity included four vessel days of effort
producing an estimated 205 sacks of market oysters. With the exception of 2007, total fishing
effort was similar to earlier years. Overall production declined after 2007 because of persistent
high salinities, continued subsidence of the reef materials, and the detrimental effects of silt
overburden from Hurricanes Katrina and Rita in 2005 and Gustav and Ike in 2008.

CSA 5 - 2011 Oyster Stock Assessment Report Page 5-7
Table 5.1 2011 Sister Lake Oyster Availability
METER²
STATION
HISTORICAL
REEF
ACREAGE
ADJUSTED
REEF
ACREAGE* #METER²
#SEED
OYSTERS
#SACK
OYSTERS
BARRELS
SEED
OYSTERS
BARRELS
SACK
OYSTERS
200 221.58 322.40 1,304,707.40 8.6 3.4 15,584.01 12,322.24
202 81.93 119.21 482,420.24 6 1.4 4,020.17 1,876.08
203 151.31 220.16 890,943.57 7.8 0 9,651.89 0.00
207 185.72 270.22 1,093,556.54 0 0 0.00 0.00
213* 96 139.68 565,267.22 1.6 1 1,256.15 1,570.19
214 129 187.70 759,577.83 2.4 3.4 2,531.93 7,173.79
215 81 117.86 476,944.22 0 0 0.00 0.00
216 115 167.33 677,143.02 8.8 8.8 8,276.19 16,552.39
217 438 481.29 1,947,719.51 5 2.6 13,525.83 14,066.86
218 67 97.49 394,509.41 13.8 10.6 7,561.43 11,616.11
2009 cultch plant
156.00 631,312.19 42.2 20.4 37,001.91 35,774.36
TOTAL 2,123.32 8,592,788.98 96.2 51.6 99,409.50 100,952.01
*2005 Side Scan Sonar Survey conducted May 2005 measure Sister Lake acreage to be 2279 acres of reef. This is an increase of 45.5% over prior
years' estimates. Starting in 2007, individual site acreage has been adjusted accordingly to reflect this increase of availability.
Table 5.2 2011 Bay Junop Oyster Availability
METER²
STATION
REEF
ACREAGE #METER²
#SEED
OYSTERS
#SACK
OYSTERS
BARRELS
SEED
OYSTERS
BARRELS
SACK
OYSTERS
251 17.2 69,606.22 6.8 2 657.39 386.70
252/255 67.36 272,597.37 1.3 0.6 492.19 454.33
253 73.26 296,473.92 1.4 1 576.48 823.54
254** 94.2 381,215.44
TOTAL 252.02 1,019,892.93 9.50 3.6 1,726.06 1,664.57
** Suspended due to conflict with private lease
Table 5.3 2011 Lake Mechant/Lake Chein/Lake Felicity Oyster Availability
METER²
STATION
REEF
ACREAGE #METER²
#SEED
OYSTERS
#SACK
OYSTERS
BARRELS
SEED
OYSTERS
BARRELS
SACK
OYSTERS
300 (Mechant) 30 121,406.19 7.20 0.00 1,214.06 0.00
Felicity 40 161,874.92 16.80 2.00 3,777.08 899.31
Chein 2004 15.5 62,726.53 62.40 8.00 5,436.30 1,393.92
Chein 2009 22.3 90,245.27 18.80 3.40 2,356.40 852.32
TOTAL 107.8 436,252.91 105.2 13.40 12,783.85 3,145.54
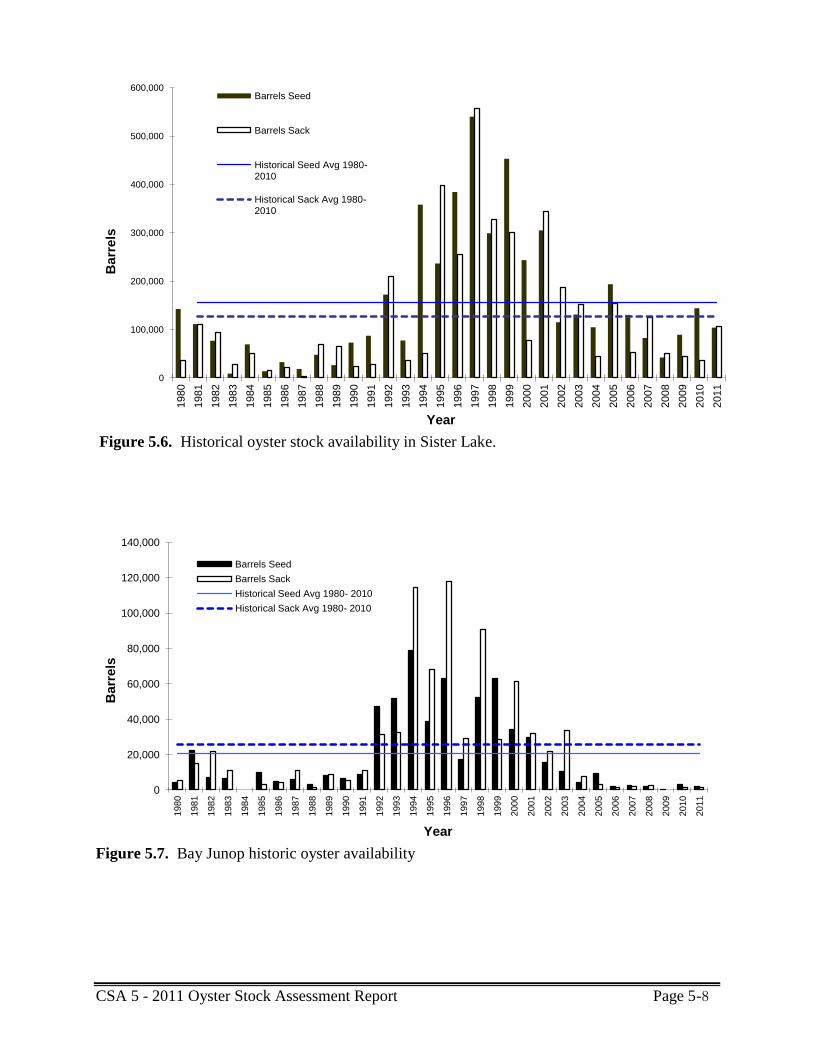
CSA 5 - 2011 Oyster Stock Assessment Report Page 5-8
Figure 5.7. Bay Junop historic oyster availability
0
20,000
40,000
60,000
80,000
100,000
120,000
140,000
1980
1981
1982
1983
1984
1985
1986
1987
1988
1989
1990
1991
1992
1993
1994
1995
1996
1997
1998
1999
2000
2001
2002
2003
2004
2005
2006
2007
2008
2009
2010
2011
Barr
els
Year
Barrels Seed
Barrels Sack
Historical Seed Avg 1980- 2010
Historical Sack Avg 1980- 2010
Figure 5.6. Historical oyster stock availability in Sister Lake.
0
100,000
200,000
300,000
400,000
500,000
600,000
1980
1981
1982
1983
1984
1985
1986
1987
1988
1989
1990
1991
1992
1993
1994
1995
1996
1997
1998
1999
2000
2001
2002
2003
2004
2005
2006
2007
2008
2009
2010
2011
Barr
els
Year
Barrels Seed
Barrels Sack
Historical Seed Avg 1980-2010
Historical Sack Avg 1980-2010

CSA 5 - 2011 Oyster Stock Assessment Report Page 5-9
Figure 5.8. Lake Mechant historic oyster availability
Figure 5.9. Lake Felicity historic oyster availability
0.00
10,000.00
20,000.00
30,000.00
40,000.00
50,000.00
60,000.00
2005 2006 2007 2008 2009 2010 2011
Barr
els
Year
BARRELS SEED
BARRELS SACK
Average (prior years) SEED
Average (prior years) SACK
0
1,000
2,000
3,000
4,000
5,000
6,000
7,000
8,000
9,000
2004
2005
2006
2007
2008
2009
2010
2011
Barr
els
Year
Seed (ba)
Sack (sacks)
Historical Seed Avg (2004-2010)
Historical Sack Avg (2004-2010)

CSA 5 - 2011 Oyster Stock Assessment Report Page 5-10
Figure 5.10. Lake Chein historic availability
0
5,000
10,000
15,000
20,000
25,000
30,000
35,000
40,000
45,000
2004
2005
2006
2007
2008
2009
2010
2011
Barr
els
Year
Seed (ba)
Sack (sacks)
Historical Seed Avg (2004-2010)
Historical Sack Avg (2004-2010)
Table 5.4 Mean May-June and historic means of water temperature ( C) and salinity (ppt)
from Sister Lake, Bay Junop, and Lake Mechant dredge samples (X= not designated as
seed ground or reservation).
YEAR
TEMPERATURE SALINITY
Sister Lake Bay Junop Lake
Mechant
Sister Lake Bay Junop Lake
Mechant
1995 28.2 29.3 X 11.7 18.0 X
1996 28.4 29.4 X 11.6 18.3 X
1997 28.6 27.5 X 3.4 10.7 X
1998 29.0 28.5 X 5.7 11.5 X
1999 26.9 26.9 X 15.1 16.2 X
2000 28.1 29.0 X 20.3 26.6 X
2001 27.1 28.1 X 12.9 14.1 X
2002 28.6 28.5 26.9 12.7 16.3 2.8
2003 28.9 28.9 28.4 11.3 13.6 5.0
2004 28.7 28.4 27.8 14.7 18.8 3.8
2005 28.3 28.2 27.5 16.2 18.5 4.7
2006 28.9 28.3 28.4 17.7 18.4 10.5
2007 27.6 27.5 29.2 19.4 20.0 11.5
2008 28.1 27.9 28.1 6.4 5.7 0.5
2009 29.5 29.2 28.9 10.4 12.1 2.7
2010 28.7 28.1 30.2 17.9 15.5 5.7
2011 26.5 26.6 25.7 15.3 15.6 5.4
Mean
28.2 28.3 28.4 13.1 15.6 5.3

CSA 5 - 2011 Oyster Stock Assessment Report Page 5-11
Table 5.6. Overall mortalities of seed and sack oysters in 2011 versus historic means
by seed ground or reservation (TB=Terrebonne Basin; NA=not applicable).
Region
Seed Ground Percent Mortality Change
Seed Oysters Sack Oysters
Western TB Sister Lake -71 -100
Bay Junop -100 -100
Lake Mechant +806 NA
Eastern TB Lake Felicity -70 NA
Lake Chein 2004 -100 -100
Lake Chein 2009 NA NA
Table 5.5 Mean May-June and historic means of water
temperature ( C) and salinity (ppt) from Lake Felicity and Lake
Chein dredge samples.
YEAR
TEMPERATURE SALINITY
Felicity Chein Felicity Chein
2006 27.6 27.8 24.9 25.0
2007 27.4 27.6 20.9 20.7
2008 28.2 28.6 16.0 16.0
2009 28.3 28.6 21.3 21.1
2010 29.2 29.5 18.6 17.8
2011 27.2 27.5 25.0 24.9
Mean 27.1 27.4 20.3 20.1
Table 5.7 Average numbers of hooked mussels and mud crabs per sample by seed
ground or reservation (TB=Terrebonne Basin).
Region
Seed Ground Numbers Per Sample
Hooked Mussels Mud Crabs
Western TB Sister Lake 8.5 0.9
Bay Junop 2.4 0.6
Lake Mechant 2.6 0.2
Overall 6.6 0.8
Eastern TB Lake Felicity 0 1.2
Lake Chein 2004 1.4 2.8
Lake Chein 2009 0.6 2.2
Overall 0.7 2.1

CSA 5 - 2011 Oyster Stock Assessment Report Page 5-12
Table 5.8 Annual totals and long term means of commercial seed oyster
(barrels) and sack oyster (sacks) harvests from Sister Lake, Lake Mechant,
and Bay Junop (NS=no season; X=not designated as seed ground or
reservation).
YEAR
SISTER LAKE BAY JUNOP LAKE MECHANT
Seed Sack Seed Sack Seed Sack
1995 51,160 48,824 NS NS X X
1996 20,055 40,019 3,770 26,908 X X
1997 31,668 43,727 NS NS X X
1998 15,228 16,510 6,205 20,345 X X
1999 29,934 47,586 NS NS X X
2000 NS NS NS NS X X
2001 18,183 34,060 NS NS X X
2002 NS NS 40 1,031 X X
2003 11,840 92,580 NS NS X X
2004 NS NS 5 2,623 0 2,211
2005 3,200 81,788 NS NS NS NS
2006 NS NS 10 3,890 NS NS
2007 16,960 42,514 NS NS 19,665 132,703
2008 600 5,530 0 737 NS NS
2009 4,610 13,676 NS NS NS NS
2010 NS NS 0 433 0 91
MEAN 18,494 42,438 1,433 7,995 6,555 45,002
Table 5.9. Annual totals and long term means of seed oyster (barrels) and
sack oyster (sacks) harvests from Lake Felicity and Lake Chein cultch plants
(NS=no season; X=not designated as seed ground or reservation).
YEAR
LAKE FELICITY LAKE CHIEN 2004 LAKE CHIEN 2009
Seed Sack Seed Sack Seed Sack
2005 15 0 252.5 0 X X
2006 0 0 1,940 0 X X
2007 470 4,830 2,157 2,439 X X
2008 0 0 205 17.2 X X
2009 NS NS NS NS NS NS
2010 0 205 0 405 NS NS
MEAN 97 1,007 911 572 0 0

CSA 6 – 2011 Oyster Stock Assessment Report Page 6-1
Coastal Study Area (CSA) 6 – 2011 Oyster Stock Assessment
Introduction
Oyster reefs found in the Vermilion/East and West Cote Blanche/Atchafalaya Public Oyster Seed
Ground generally fall within the boundaries of Coastal Study Area 6 (CSA6). The inside oyster
seed ground, promulgated by the Louisiana Wildlife and Fisheries Commission in 1990, consists
of that portion of state water bottoms found generally north of a line from the western shore of
Vermilion Bay and Southwest Pass eastward to Point Au Fer. The outside area, designated in
1988, consists of Louisiana State Territorial Waters from the private oyster lease boundary near
Mound Point/Marsh Island eastward to Point Au Fer. Since 1986 (prior to the official
designation of these areas as seed grounds), LDWF managed the oyster resources found on local
state water bottoms in a manner similar to present seed ground management procedures. This
allowed limited harvest/relays from the Vermilion Bay area reefs when hydrological conditions
and oyster abundance and distribution permitted.
The Vermilion/Cote Blanche/Atchafalaya Bays Complex is a large, primarily open-water
brackish system with the area seed grounds consisting of approximately 541,787 water bottom
acres. Primary influences on the bays dynamic salinity regime are the Gulf of Mexico,
Atchafalaya River and the adjacent Wax Lake Outlet, and the Vermilion River. In general, the
public oyster seed grounds within CSA 6 are highly influenced by freshwater discharge from the
Atchafalaya River. Typically, oyster reproduction occurs in the fall after the river stage abates,
with oysters growing to seed size (1 inch to < 3 inches) by the following spring. However,
spring and early summer floodwaters depress salinities, placing extreme physiological stress on
the organisms. These low salinities, coupled with high water temperatures through the summer
months, typically results in extensive oyster mortalities on the public grounds. Occasionally,
however, reduced freshwater inflow from the Atchafalaya River leads to higher-than-normal
salinities and the normal annual cycle of extensive oyster mortalities is broken, leading to a
harvestable population of seed oysters during the following oyster season (September through
April). Such was the case in 2000, 2001, 2005, 2006, and 2007 when sizeable quantities of seed
oysters were available for harvest.
An overall Vermilion Bay area stock assessment is not possible at this time, as figures relative to
oyster reef sizes are not available. However, data collected from this year’s sampling program
will be compared to previous years’ data, with a look at hydrologic conditions, marine fouling,
and oyster predators on sampled reefs. The effects of extended high Atchafalaya River levels
during the period of March 2011 through July 2011 will be addressed. In addition, information
regarding the 2010/2011 oyster season harvest on the Vermilion Bay area public oyster seed
grounds will be presented.
Methods
As a result of the implementation of LDWF’s expanded Fisheries Inshore Monitoring Program,
additional square meter field sampling locations were added to the historically designated sites
on the inside and outside areas of the Vermilion, East and West Cote Blanche and Atchafalaya
Bays Public Oyster Seed Ground. The addition of the new sites achieved an improved spatial
CSA 6 – 2011 Oyster Stock Assessment Report Page 6-2
distribution of sampling effort on the hard-bottom areas found within the system. Field sampling
was conducted July 18 through July 20, 2011. A total of ten stations (Figure 6.1 and 6.2) were
sampled with five replicate samples collected at each station. Upon reaching the designated site,
the square meter frame was randomly thrown onto the oyster reef. A SCUBA diver removed all
oysters, associated macroscopic organisms, and loose surface shell within the frame. All live
oysters, and shells from recently dead oysters, were counted, measured in five millimeter (mm)
intervals, then classified as spat (<25 mm), seed (25 mm to < 75mm), or sack oysters (≥75mm).
Shells from recently dead oysters were defined as “box” (both valves attached) or “valve” (one
valve). Oyster size was determined by measuring the “straight-line” distance from the hinge to
the apex of the shell. Live predators and fouling organisms were counted. Cultch type and reef
condition were noted.
Results and Discussion
Seed and Sack Stock
Live seed-sized oysters were found at the Indian Point, Lighthouse Point and Bayou Blanc sites,
with replicates averaging 0.8, 1.6, and 0.8 oysters respectively. No live seeds were taken at the
remaining seven sites. Similar to last year’s survey, the majority of the seed size oysters were
found at sample sites in the vicinity of Southwest Pass. Only one sack sized oyster was collected
during the 2011 meter square sampling program, with that specimen taken at the Indian Point site
(Figures 6.1 and 6.2).
Low production years associated with extended periods of high Atchafalaya River output are not
uncommon on the seed grounds of this bay system. Near 100% mortality on the grounds was
noted as recently as 2002, 2003, 2004, 2008, 2009, 2010, and 2011.
Spat Production
Despite the presence of suitable substrate at all locations, only a single spat was collected during
the 2011 square meter sampling effort. This single specimen was found at the Lighthouse Point
site, located in southeastern Southwest Pass adjacent to the leased area (Figure 6.1). Low spat
productivity during periods of high Atchafalaya River flow (with associated low salinity
conditions) are common.
Fouling organisms
A decrease in hooked mussel (Ischadium recurvum) productivity compared to last year’s
assessment was documented at the historical sites in the eastern part of the system and at Big
Charles north of Southwest Pass. A slight increase was noted at the Indian Point site. Mussel
numbers at the new sample sites were not found to be high, with many of the mussels very small,
likely a result of the low salinity conditions seen throughout the system again this year (Table
6.1).
Oyster Predators
No evidence of the southern oyster drill (Stramonita haemastoma) was noted in any of the square
meter samples, which is not surprising considering the depressed salinities in this area. These
predatory marine snails are more often associated with higher saline waters where they are
known to prey heavily on oysters and other bivalve species. A general increase in the number of

CSA 6 – 2011 Oyster Stock Assessment Report Page 6-3
mud crabs (Xanthidae sp.) was observed at all sites compared to last year’s assessment. They
were found at all stations except Middle Reef. No blue crabs (Callinectes sapidus) or stone crabs
(Menippe adinia) were captured in the samples.
Disease
Due to the lack of live oysters of appropriate size, no sample was collected from the eastern part
of the system for the analysis of the presence of pathogens. A sample was collected from the
Indian Point site in southwestern Vermilion Bay and forwarded to Dr. Tom Soniat for
quantification of the infestation rate of the protozoa Perkinsus marinus (commonly known as
Dermo). Results of Dermo analysis are contained within a separate section of this document.
Mortality
The oyster resource found in the area is highly vulnerable to low salinity/high turbidity
conditions often seen as a result of extended freshwater conditions associated with high
Atchafalaya River discharge. Independent of local rainfall, rising water levels at the Butte La
Rose gauge can generally be tied to falling salinity levels in the Vermilion Bays complex. This
correlation was documented for the spring/early summer of 2011 (Figure 6.5), with its effects on
local oysters noted in this year’s assessment.
Though very few seed or sack-size oysters were present in the eastern part of the system
following the summer 2010 mortality event, dredge samples taken subsequent to last year’s stock
assessment indicated a positive spat set at the end of August. Indian Point in Vermilion Bay held
promising numbers of seed and a few sack-sized oysters as well. Continued monitoring found
that conditions throughout the complex were conducive to oyster productivity until the end of
February 2011, with growth and increasing numbers noted at the historical sites and several of
the new locations as well. Middle Reef (south of South Pt/Marsh Island), Indian Point, and
Lighthouse Point were especially promising.
A dramatic increase in Atchafalaya River flow, beginning in March 2011, began to push fresh
and turbid water into the system. By the end of April salinity averaged less than 2.0 parts per
thousand (ppt) at sampled dredge sites. On May 14, the US Army Corps of Engineers opened
the Morganza Spillway flood-control structure (the trigger to open the spillway is a projected
Mississippi River water flow rate of 1.5 million cubic feet per second past Red River Landing
above Baton Rouge) to allow excess flow into the Atchafalaya River basin. Water diverted from
the Mississippi into the spillway merges downstream with the Atchafalaya floodway before
flowing into the Vermilion/Atchafalaya Bays system via the main river channel, the Wax Lake
Outlet, or the various water ways that empty into the bays from the Gulf Intracoastal Waterway
(GIWW). The spillway remained open at some level for 54 days, with a peak operational flow
rate of 182,000 cfs diverted into the basin. The gauge height at Butte La Rose peaked at 23.1
feet on May 27, a height not seen since 1964. A decrease in the number of live oysters collected
in dredge samples on the seed ground was noted as water temperatures began to rise in June,
with continued mortality in July resulting in few live oysters collected in the 2011 stock
assessment effort (Figures 6.1 and 6.2).
Actual recent mortality documented in July 2011 square meter samples was found primarily in
the western part of the system, as near complete mortality had occurred at the eastern sites during

CSA 6 – 2011 Oyster Stock Assessment Report Page 6-4
the preceding months. Dredge samples taken in late June found 100% mortality at the South
Point, Bayou Blanc, Rabbit Island, and Middle Reef sites. The only live oyster found in the
eastern area was collected at North Reef near Mound Point/Marsh Island. While reefs in the
vicinity of Southwest Pass had fared better during June, significant loss of live resource was
documented in July dredge samples. Continued mortality was noted at these sites during the
square meter assessment, when Big Charles and Lighthouse Point had recent mortality levels of
100% and 74% respectively. It should be pointed out that documentation of recently dead
oysters for this area is difficult, as the valves are readily separated in the high energy
environment and fouling in the turbid, highly organic water is almost instantaneous.
The cycle of recovery from a distressed resource resulting from low salinity/high water
temperatures each summer to positive productivity as salinity rises and water temperatures fall in
autumn is very common in this system. As occurred in the spring of 2011, the resource becomes
stressed as the rising river lowers salinity and raises turbidity levels. Oysters are then hit by
rising summer-time water temperatures, leading to a loss in available resource and completion of
the cycle. Although Atchafalaya River stages reached a very high level at the end of May 2011,
the duration of the high water period may have a more significant impact on low salinity induced
stress in this system. The river stage at Butte La Rose remained well above the long-term
average until the end of July (Figure 6.5), contributing to a delay in the normal rise in salinity
levels seen with a falling river. Monthly average salinity collected at the Indian Point location
started to rise (from its low of 1.8 ppt.) a full month later than usually recorded at this site
(Figure 6.4). The residual effect that this delay may have on spat set success and subsequent
growth and viability will be monitored through continued dredge sampling until next year’s
square meter assessment.
Tropical and Climatic Events
No tropical storms or significant climatic events affected the Vermilion area seed grounds since
the 2010 assessment.
DWH Oil Spill and Related Response Actions
The BP Deepwater Horizon oil spill released millions of barrels of oil into the Gulf of Mexico
affecting the Louisiana coastline, including oyster resources. The impacts of oil and freshwater
diversions on oyster health and habitat continue to be of concern. Assessment continues on the
direct and indirect impacts of oil and response actions to Louisiana’s near shore environment,
including to oysters and oyster habitat.
2010/2011 Oyster Season Summary
Methods
Roving surveys on portions of the seed grounds with “OPEN” designation under DHH’s
classification system and areas under DHH relay permit are made to obtain fishery dependent
data (i.e. harvest estimates). Fishermen working the seed ground are surveyed and asked to
provide estimates of past and current catch rates as well as an estimate of future fishing effort.
These data are summarized weekly to maintain a cumulative estimate of harvest for specific reef
complexes. Trip ticket data is analyzed to provide additional harvest information.

CSA 6 – 2011 Oyster Stock Assessment Report Page 6-5
Results & Discussion
The Vermilion/East and West Cote Blanche/Atchafalaya Bay Public Oyster Seed Grounds
opened one-half hour before sunrise on November 15, 2010 and remained open until one-half
hour after sunset on April 1, 2011.
An estimated 3,775 sacks were taken from the areas seed ground, with the majority harvested
from reefs north of Southwest Pass in Vermilion Bay. No harvest of seed oysters was observed
or reported.

CSA 6 – 2011 Oyster Stock Assessment Report Page 6-6
Fig
ure
6.1
. M
ap d
esig
nat
ing C
SA
6 2
011 o
yst
er s
quar
e m
eter
sta
tions
in t
he
wes
tern
par
t of
the
Ver
mil
ion, E
ast
and
Wes
t C
ote
Bla
nch
e an
d A
tchaf
alay
a B
ays
publi
c oyst
er s
eed g
round. D
ata
bel
ow
sta
tion n
um
ber
s re
pre
sent
aver
age
spat
,
seed
and s
ack o
yst
ers
per
squar
e m
eter
sam
ple
.
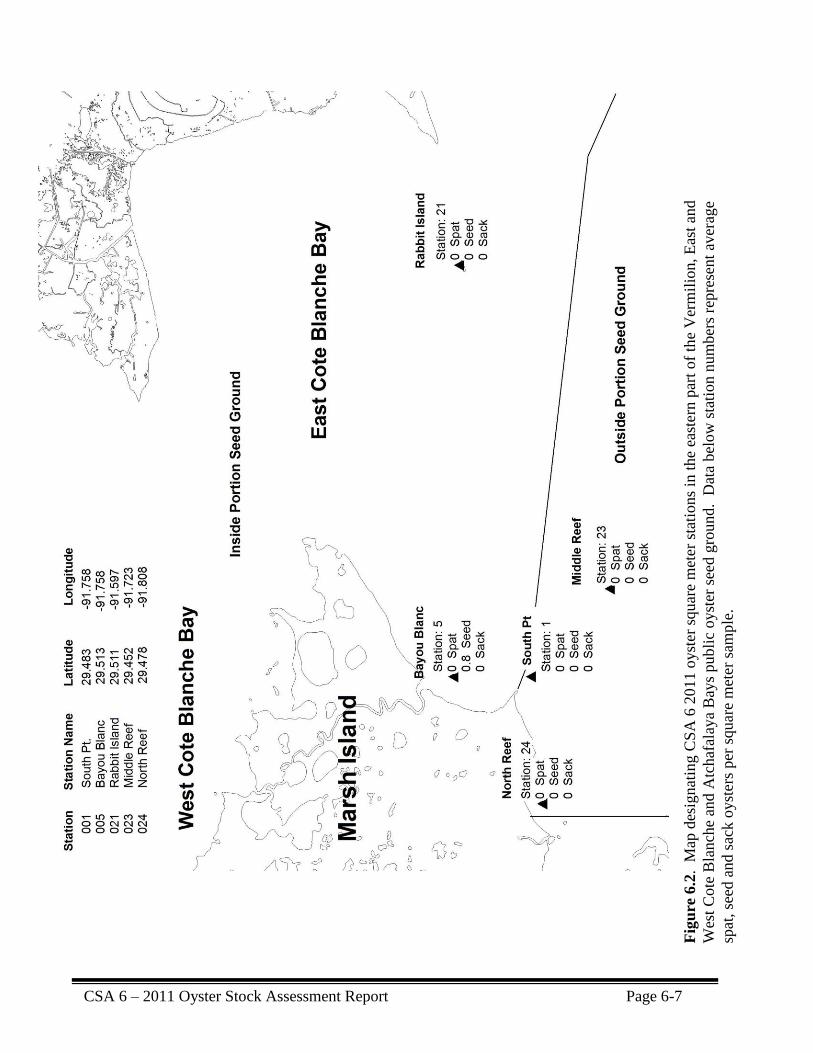
CSA 6 – 2011 Oyster Stock Assessment Report Page 6-7
Fig
ure
6.2
. M
ap d
esig
nat
ing C
SA
6 2
011 o
yst
er s
quar
e m
eter
sta
tions
in t
he
east
ern p
art
of
the
Ver
mil
ion, E
ast
and
Wes
t C
ote
Bla
nch
e an
d A
tchaf
alay
a B
ays
publi
c oyst
er s
eed g
round. D
ata
bel
ow
sta
tion n
um
ber
s re
pre
sent
aver
age
spat
, se
ed a
nd s
ack o
yst
ers
per
squar
e m
eter
sam
ple
.
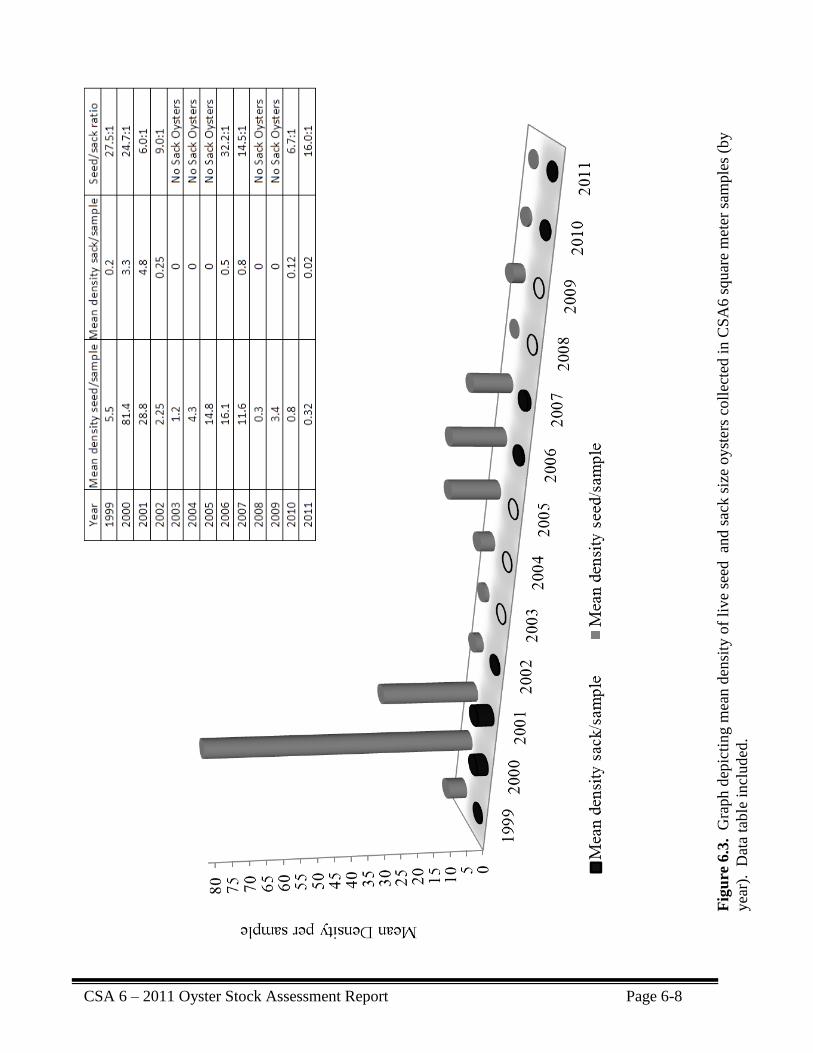
CSA 6 – 2011 Oyster Stock Assessment Report Page 6-8
Fig
ure
6.3
. G
raph d
epic
ting m
ean
den
sity
of
live
seed
an
d s
ack s
ize
oyst
ers
coll
ecte
d i
n C
SA
6 s
quar
e m
eter
sam
ple
s (b
y
yea
r). D
ata
table
incl
ud
ed.

CSA 6 – 2011 Oyster Stock Assessment Report Page 6-9
Figure 6.4. Graph depicting average monthly salinity levels measured at the Indian
Point site (station 003) for the period January through August.
Table 6.1. Mean density of the hooked mussel, Ishadium recurvum, recorded at each CSA6
square meter station (by year).
* 2011 was the first year for square meter samples for these stations
Station no. Station name 2006 2007 2008 2009 2010 2011
001 South Pt./Marsh Island 16 26.0 1.0 0.0 11.2 1.4
002 Big Charles 17 16.0 2.5 0.0 18.4 5.2
003 Indian Point 9 33.5 0.5 16.0 18.2 20.4
004 Dry Reef/Vermilion Bay 0 0 2.0 37.0 0 6.6
005 Bayou Blanc 7 18.5 2.5 0.0 4 2
020* Sally Shoals * * * * * 3.8
021* Rabbit Island * * * * * 0
022* Lighthouse Point * * * * * 11.8
023* Middle Reef * * * * * 0.2
024* North Reef * * * * * 4.4
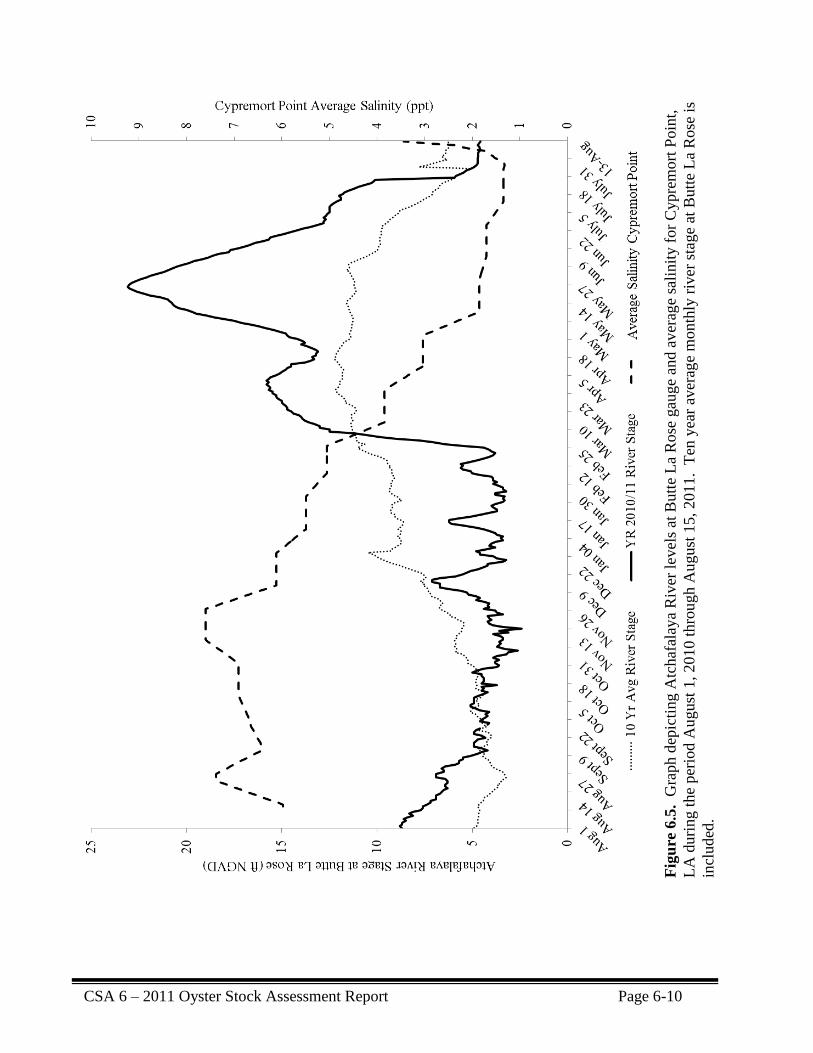
CSA 6 – 2011 Oyster Stock Assessment Report Page 6-10
Fig
ure
6.5
. G
raph d
epic
ting A
tchaf
alay
a R
iver
lev
els
at B
utt
e L
a R
ose
gau
ge
and a
ver
age
sali
nit
y f
or
Cypre
mort
Poin
t,
LA
duri
ng t
he
per
iod A
ugust
1, 2010 t
hro
ugh A
ugust
15
, 2011. T
en y
ear
aver
age
month
ly r
iver
sta
ge
at B
utt
e L
a R
ose
is
incl
uded
.
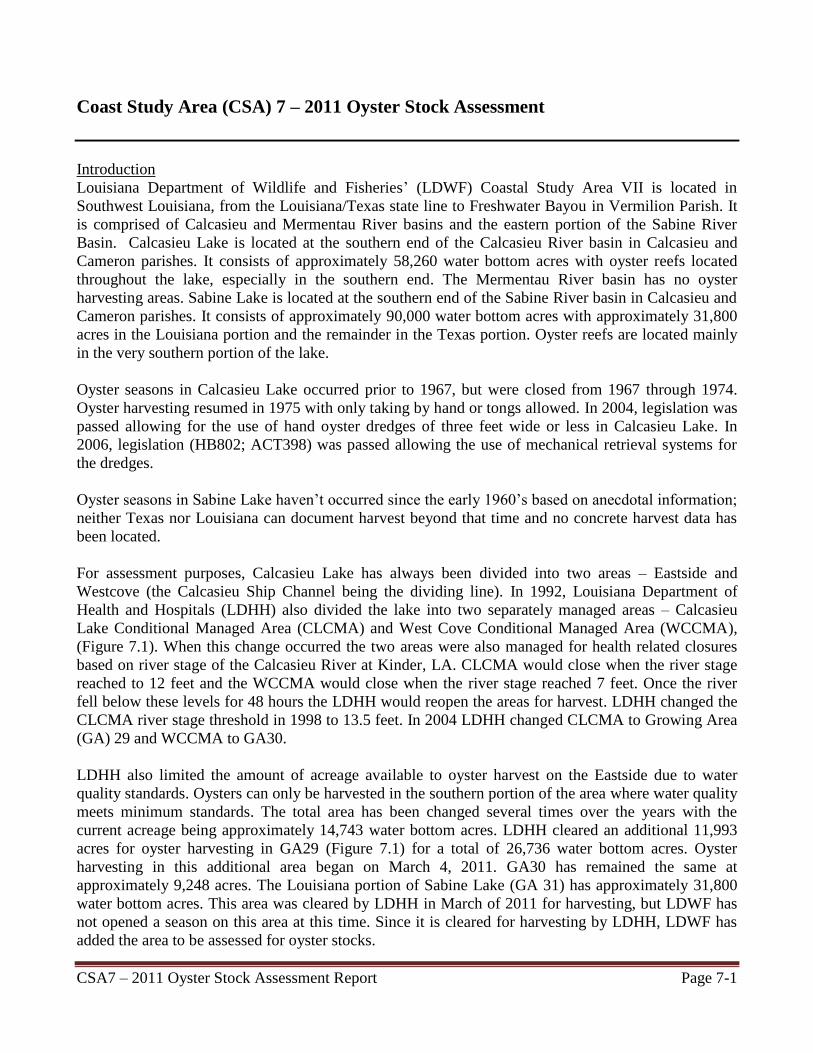
CSA7 – 2011 Oyster Stock Assessment Report Page 7-1
Coast Study Area (CSA) 7 – 2011 Oyster Stock Assessment
Introduction
Louisiana Department of Wildlife and Fisheries’ (LDWF) Coastal Study Area VII is located in
Southwest Louisiana, from the Louisiana/Texas state line to Freshwater Bayou in Vermilion Parish. It
is comprised of Calcasieu and Mermentau River basins and the eastern portion of the Sabine River
Basin. Calcasieu Lake is located at the southern end of the Calcasieu River basin in Calcasieu and
Cameron parishes. It consists of approximately 58,260 water bottom acres with oyster reefs located
throughout the lake, especially in the southern end. The Mermentau River basin has no oyster
harvesting areas. Sabine Lake is located at the southern end of the Sabine River basin in Calcasieu and
Cameron parishes. It consists of approximately 90,000 water bottom acres with approximately 31,800
acres in the Louisiana portion and the remainder in the Texas portion. Oyster reefs are located mainly
in the very southern portion of the lake.
Oyster seasons in Calcasieu Lake occurred prior to 1967, but were closed from 1967 through 1974.
Oyster harvesting resumed in 1975 with only taking by hand or tongs allowed. In 2004, legislation was
passed allowing for the use of hand oyster dredges of three feet wide or less in Calcasieu Lake. In
2006, legislation (HB802; ACT398) was passed allowing the use of mechanical retrieval systems for
the dredges.
Oyster seasons in Sabine Lake haven’t occurred since the early 1960’s based on anecdotal information;
neither Texas nor Louisiana can document harvest beyond that time and no concrete harvest data has
been located.
For assessment purposes, Calcasieu Lake has always been divided into two areas – Eastside and
Westcove (the Calcasieu Ship Channel being the dividing line). In 1992, Louisiana Department of
Health and Hospitals (LDHH) also divided the lake into two separately managed areas – Calcasieu
Lake Conditional Managed Area (CLCMA) and West Cove Conditional Managed Area (WCCMA),
(Figure 7.1). When this change occurred the two areas were also managed for health related closures
based on river stage of the Calcasieu River at Kinder, LA. CLCMA would close when the river stage
reached to 12 feet and the WCCMA would close when the river stage reached 7 feet. Once the river
fell below these levels for 48 hours the LDHH would reopen the areas for harvest. LDHH changed the
CLCMA river stage threshold in 1998 to 13.5 feet. In 2004 LDHH changed CLCMA to Growing Area
(GA) 29 and WCCMA to GA30.
LDHH also limited the amount of acreage available to oyster harvest on the Eastside due to water
quality standards. Oysters can only be harvested in the southern portion of the area where water quality
meets minimum standards. The total area has been changed several times over the years with the
current acreage being approximately 14,743 water bottom acres. LDHH cleared an additional 11,993
acres for oyster harvesting in GA29 (Figure 7.1) for a total of 26,736 water bottom acres. Oyster
harvesting in this additional area began on March 4, 2011. GA30 has remained the same at
approximately 9,248 acres. The Louisiana portion of Sabine Lake (GA 31) has approximately 31,800
water bottom acres. This area was cleared by LDHH in March of 2011 for harvesting, but LDWF has
not opened a season on this area at this time. Since it is cleared for harvesting by LDHH, LDWF has
added the area to be assessed for oyster stocks.

CSA7 – 2011 Oyster Stock Assessment Report Page 7-2
Historical reef acreage for all of Calcasieu Lake is 1,690.95. West Cove consists of 726.98 acres and
the Eastside consists of 963.97 acres. The historical reef acreage on the Eastside is made up of reefs
that fall both within and outside of the conditional managed area. Therefore, assessments of oyster
stock sizes are based on total reef acreage within the lake and not just that portion of reef acreage that
lies within areas accessible to commercial fishing.
LDWF contracted ENCOS, Inc. to perform a comprehensive water bottom assessment of a portion
(approximately 10,421 of 52,878 acres) of Calcasieu Lake in the latter half of 2008. GA29 assessment
indicates 4,034.9 acres of Type II bottom (moderately firm mud, firm mud, and buried shell) and
1434.3 acres of Type IIIB bottom (slightly covered buried shell and exposed reef). Type IIIB bottom
was further categorized into: Reef, 1,003.8 acres and Exposed Shell, 430.5 acres. GA30 assessment
indicates 2,190.0 acres of Type I (soft mud) bottom, 289.0 acres of Type II bottom, 2,472.8 acres of
Type IIIB bottom. Type IIIB bottom was further categorized into: Reef, 396.6 acres and Exposed
Shell, 2,103.2 acres. Sabine Lake was also assessed by ENCOS, Inc. in 2008 (approximately 11,405.1
of 31,800 acres). GA31 assessment indicates 6,125.2 acres of Type I bottom and 3,800.4 acres of Type
II bottom and 2,520.5 acres of Type IIIB bottom. Type IIIB was categorized further into: Reef, 1,041.0
acres and Exposed Shell, 438.5 acres (Figures 7.2 and 7.4)
LDWF contracted Bio-West, Inc. in early 2011 to perform a water bottom assessment of the remaining
(those areas cleared by LDHH for oyster harvesting) portion of GA29 (19,772 acres) and GA30 (3,935
acres). GA29 assessment indicates approximately 16,433 acres of Type I bottom, 2,811 acres of Type
II bottom and 528 acres of Type IIIB bottom. The Type IIIB bottom was categorized further into: Reef,
432 acres and Exposed Shell, 96 acres. GA30 assessment indicates approximately 1,882 acres of Type
I bottom, 1,138 acres of Type II bottom and 915 acres of Type III bottom. The Type IIIB bottom was
broken down further in Reef, 750 acres and Exposed Shell, 165 acres (Figure 7.2).
For the 2011 LDWF stock assessment and all future LDWF assessments, unless another water bottom
assessment is performed, all the assessments will be figured using a combination of acreages from the
ENCOS, Inc. and Bio-West, Inc. assessments. GA29 will have 1,435.8 acres of Reef and 529.5 acres
of Exposed Shell. GA30 will have 1,119.6 acres of Reef and 2,268.2 acres of Exposed Shell. GA31
will have 1,041 acres of Reef and 438.5 acres of Exposed Shell (Tables 7.1, 7.2 and 7.3).
LDWF placed a 14.3 acre cultch plant in the southern portion of GA 30 (on the south side of the “Old
Revetment”) in May of 2009. No oystering was allowed by the Louisiana Wildlife and Fisheries
Commission (LWFC) during the 2009-2010 and 2010-11 seasons on this cultch plant. This area was
included in the Reef acreage of the Bio-West water bottom assessment.
Methods
The oyster assessment for Calcasieu Lake was derived by taking “meter square” samples. A one meter
square frame is randomly tossed in the vicinity of the sample station located on known reef or exposed
shell bottom. There are five replicate samples taken by a SCUBA diver at each station and there are six
stations in GA29, four in GA30 and six in GA31 (Figures 7.1, 7.2, 7.3, and 7.4). The diver removes all
live and dead oysters and shell on the top portion of the reef substrate. Any live and recent dead oysters
are measured in five millimeter (mm) groups and divided into three categories – spat (<25mm), seed
oysters (25mm – 74mm) and sack oysters (75mm and larger). Oyster predators and Hooked mussels

CSA7 – 2011 Oyster Stock Assessment Report Page 7-3
(Ishchadium recurvum) that were collected were identified and tallied. As no bedding (seeding)
operations occur in Calcasieu Lake and all harvest is for direct market, the results of data collected are
reported in sacks rather than barrels (two sacks equals one barrel).
Results
Growing Area 29
The oyster assessment for GA29 indicates 27,014.5 sacks of sack oysters and 52,838.6 sacks of seed
oysters available (Table 7.1). The sacks of sack oysters available on the Reef Bottoms are 25,824.1 and
the amount on the Exposed Shell Bottoms are 1,190.4 (Table 7.1).
Sack oysters showed an increase of 14.7% over the 2010 assessment of 23,540.1 sacks (Table 7.4).
The availability of seed oysters showed an increase of 518.3% over the 2010 assessment of 8,545.3
sacks (Table 7.4).
Growing Area 30
The oyster assessment for GA30 indicates 594,744.1 sacks of sack oysters and 308,927.2 sacks of seed
oysters available (Table 7.2). The sacks of sack oysters available on the Reef Bottoms are 145,993.1
and the amount on the Exposed Shell Bottoms are 448,751.0 (Table 7.2).
Sack oysters showed a decrease of 13.7% over the 2010 assessment of 689,375.7 sacks (Table 7.4).
The availability of seed oysters showed a decrease of 49.0% over the 2010 assessment of 605,983.5
sacks (Table 7.4).
Growing Area 31
The oyster assessment for GA31 indicates 1,031,976.2 sacks of sack oysters and 406,141.1 sacks of
seed oysters available (Table 7.3). The sacks of sack oysters available on the Reef Bottoms are
937,334.6 and the amount on the Exposed Shell Bottoms are 94,641.6 (Table 7.3).
Sack oysters showed an increase of 115.5% over the 2010 assessment of 478,985.9 sacks (Table 7.4).
The availability of seed oysters showed a decrease of 6.9% over the 2010 assessment of 436,409.4
sacks (Table 7.4).
2009 Cultch Plant
The oyster assessment for the 2009 cultch plant indicates the presence of spat, seed and sack oysters.
Sampling indicates that there are 173,609 spat, 771.6 sacks of seed oysters and 578.7 sacks of sack
oysters available.
The 2011 spat assessment is down considerably from the 2010 assessment of 1,342,585. The 2010
assessment of seed oysters is also down from the 2009 assessment of 24,434 sacks.
Total mortality on the cultch plant was 40.0%.

CSA7 – 2011 Oyster Stock Assessment Report Page 7-4
Discussion
Sack Oysters
The overall assessment is down 12.7% from the 2010 assessment in Calcasieu Lake (GA29 and 30).
Though there was a slight increase in oysters in GA29, this was offset by a 13.7% decrease in oysters
in GA30 (Table 7.4). The continued low amount of sack oysters in GA29 and high demand is a
continued concern.
GA30 will need to be watched closely; the assessment indicates a high number of oysters, but when
broken down by bottom type the assessment indicates 145,993.1 sacks of available on the Reef
Bottoms and 448,751.0 sacks available on the Exposed Shell Bottom. Most fishing pressure occurs on
the Reef Bottom type.
Complete Calcasieu Lake oyster landings data via the LDWF Trip-Ticket program indicated that there
were 82,896 sacks reported landed in the 2010-11 season (Table 7.5). This is a decrease from the
previous year. It is estimated that about 58% or 48,079 sacks, of the total harvest came from GA30
(derived from CSA7 boat count harvest estimates).
GA31 has 1,031,976.2 sacks of sack oysters available, this is up 115.5% over the 2010 assessment. At
this time there is no season on GA31. The 2010 stock assessment of GA31was completed in August
2010 which was after the statewide stock assessment was published; therefore the oyster stock data for
GA31was not included in last year’s report. No oyster season was set for GA31 this past year.
Seed Oysters
Seed oysters increased in GA29 by 518.3% from the 2010 assessment, but were still down by 80.3%
from the short term average (2006-10) (Table 7.4). Seed oysters decreased in GA30 by 49.0% from the
2010 assessment, but were still up by 14.8% from the short term average (2006-10) (Table 7.4). Seed
oysters in GA31had a slight drop of 6.9% from the 2010 assessment (Table 7.4)
Hydrology
Average water temperatures for May and June were 24.8oC and 29.2
oC respectively and were above
the long term average (LTA) of 1970-2010 (Table 7.7). The average water temperature during the
oyster assessment was 31.0oC which is slightly higher that the LTA of 29.5
oC.
Average salinities (in parts per thousand - ppt) for May and June were 18.5ppt and 16.8ppt
respectively; this is much higher than the LTA for the same months (Table 7.7). The average salinity
during the oyster assessment was 19.2ppt which is above the LTA of 15.5ppt; this is due to low
amounts rainfall since July of last year. Rainfall during the timeframe of July 2010 through present at
the Lake Charles Airport is -22.25 inches (from the NOAA Lake Charles weather website).
Disease, Fouling Organisms, and Predators
Hooked mussels continue to be about the same as 2010 assessment in GA29 and 30. There were no
hooked mussels in the GA29 samples. Increased fishing pressure in that area may have served to
reduce mussel numbers. Hooked mussels were present in GA30 averaging 200.7 per sample station
and is slightly higher than last year’s 168.3 per station. Hooked mussels were present in GA31
averaging 613.5 per sample station. The high numbers in GA31 could be attributed to no oyster dredge
activity on the reefs.

CSA7 – 2011 Oyster Stock Assessment Report Page 7-5
There were a total of 20 Southern Oyster drills (Stramonita haemastoma), a predatory marine snail,
collected during this assessment in GA29. This is higher than last the 2010 number of 13 oyster drills.
There have been very few oyster drills present in either the meter square or dredge samples for a long
time; in looking back at the dredge data since 2005, they started increasing in 2009 with a total
collected in 2011 of 323 (Figure 7.9). There were no oyster drills collected in GA30 or 31.
There was a total of 298 unidentified mud crabs found in the samples from all three growing areas. No
other species of concern were found.
Future assessments
All the areas open to oystering in GA29, 30 and 31 that likely have oysters have had bottom surveys
completed. The upper half of Calcasieu Lake hasn’t been surveyed, but is not available at this time to
oyster fishing because of LDHH closure. The upper area of Sabine Lake probably has few if any
oysters and will not need bottom surveying at this time.
2010-11 Oyster Season
The Louisiana Wildlife and Fisheries Commission started the 2010-11 season with GA30 opening
October 15th with a limit of 20 sacks/boat/day, then GA29 opened along with GA30 in November 15th
with the limit set at 10 sacks/boat/day for both growing areas (Table 7.8).
With the low numbers of available oysters on the eastern oyster areas of the state, demand continues to
be high. This has caused continued high fishing pressure in Calcasieu Lake with an average of 129
vessels landing oysters per month in the 2010-11 oyster season (Figure 7.5). The highest number of
boats landing oysters from the 2010-11 season in Calcasieu Lake was March 2011 at 151.
With the continued increase in fishing pressure mentioned above has come a corresponding increase in
harvest from 19,327 in the 2005-06 season to one of the highest on record at 137,074 in the 2009-10
season, with the landings in the 2010-11 season being 82,896 sacks (Table 7.5).
The completed bottom survey of GA29 showed very little added Type IIIB acreage added to GA29 by
the additional area that LDHH opened in early March.
The heavy harvest pressure appears to be affecting the availability of oysters in GA29 where most of
the harvest has occurred in past years. Dredge samples in GA29 taken through the season continued to
show very little oyster resource available as low catch per unit effort (CPUE) persisted (Figure 7.8).
Due to low resource and enforcement issues GA29 was closed in March with GA30 remaining open
until the end of April (LDWF News Release 3/22/2011 and Table 7.8).
Lack of rainfall since last summer allowed harvest for 100% of the season in GA29 and 95% of the
season in GA30. The amount of days that GA30 was open was unprecedented since the inception of
the river stage closures (Table 7.6).
For the three seasons 2005-2008 (Table 7.8), attempts were made to urge more fishermen to utilize the
resource in GA30, but to no avail. Oysters in GA30 have not been fished in that area and many
fishermen report that those oysters are less desirable for the market. Since this was the case, the 2008-
09 and 2009-10 seasons, both GA29 and GA30 were opened at the same time. The LWFC opened the

CSA7 – 2011 Oyster Stock Assessment Report Page 7-6
first month of oystering to just GA30, with the shortage of oysters in GA29 and the closure of GA29 in
March, the oyster fishermen were forced to fish GA30 to a much greater degree. It was estimated that
about 58% of the total harvest came from GA30.
2011-12 Oyster Season
SB73 passed and became Act 329 and at this time will be effective for the 2011-12 season. This Act
will limit the number of oyster fishermen to 126 for Calcasieu Lake. Unless something changes this
Act in the future, it will remain in effect until 2014.
Figure 7.1. The Calcasieu Lake Public Oyster Area indicating the two conditional management areas
(one east of the Calcasieu Lake Ship Channel and one west of the channel), as well as the 2011 oyster
square meter sample stations.

CSA7 – 2011 Oyster Stock Assessment Report Page 7-7
Figure 7.2. Oyster habitat (reef) coverage within the Calcasieu Lake Public Oyster Area as delineated
by recent side-scan sonar projects in 2008 and 2011.
Figure 7.3. The 2011 oyster square meter sampling stations and results within the Sabine Lake Public
Oyster Area.

CSA7 – 2011 Oyster Stock Assessment Report Page 7-8
Figure 7.4. Oyster habitat (reef) as determined by the 2008 side scan sonar project

CSA7 – 2011 Oyster Stock Assessment Report Page 7-9
Table 7.1. 2011 Oyster Stock Assessment: Calcasieu Lake – GA29.
CALCASIEU LAKE - EASTSIDE (GA29) OYSTER STOCK ASSESSMENT
AUGUST 2011
TYPE IIIB – REEF
5,810,424.156 Square Meters (1,435.8 Acres)1
Oysters
Size
Station
Ave.
BIG
WASHOUT
LITTLE
WASHOUT
MID
LAKE
’09 CULTCH
PLANT
Spat (<1”) 0 150 17 15 9.10
Seed (1”-<3”) 0 29 11 24 3.20
Sack (≥3”) 0 6 1 9 0.80
No. of Replicates 5 5 5 5
Availability of Oysters
No. of Spat Oysters: 52,874,859.82
No. of Seed Oysters: 18,593,357.30 Sacks of Seed Oysters: 51,648.2
No. of Sack Oysters: 4,648,339.32 Sacks of Sack Oysters: 25,824.1
Total: 77,472.3
TYPE IIIB – EXPOSED SHELL
2,142,791.190 Square Meters (529.5 Acres)1
Oysters
Size
Station
Ave. NINE MILE LONG POINT
Spat (<1”) 0 0 0.00
Seed (1”-<3”) 0 2 0.20
Sack (≥3”) 0 1 0.10
No. of Replicates 5 5
Availability of Oysters
No. of Spat Oysters: 0
No. of Seed Oysters: 428,558.24 Sacks of Seed Oysters: 1,190.4
No. of Sack Oysters: 214,279.12 Sacks of Sack Oysters: 1,190.4
Total: 2,380.8
OYSTERS AVAILABLE IN GA29
Sacks of Seed Oysters: 52,838.6 Sacks of Sack Oysters: 27,014.5
1 – Area listed is from LDWF contracted assessments from Encos, Inc. from 2008 and Bio-West from 2011.

CSA7 – 2011 Oyster Stock Assessment Report Page 7-10
Table 7.2. 2011 Oyster Stock Assessment: Calcasieu Lake – GA30.
CALCASIEU LAKE – WEST COVE (GA30) OYSTER STOCK ASSESSMENT
AUGUST 2011
TYPE IIIB – REEF
4,530,819.672 Square Meters (1,119.6 Acres)1
Oysters
Size
Station
Ave. SOUTHEAST RABBIT ISLAND WEST COVE TRANSPLANT
Spat (<1”) 22 43 6.50
Seed (1”-<3”) 33 20 5.30
Sack (≥3”) 51 7 5.80
No. of Replicates 5 5
Availability of Oysters
No. of Spat Oysters: 29,450,327.87
No. of Seed Oysters: 24,013,344.26 Sacks of Seed Oysters: 66,703.7
No. of Sack Oysters: 26,278,754.10 Sacks of Sack Oysters: 145,993.1
Total: 212,696.8
TYPE IIIB – EXPOSED SHELL
9,178,997.124 Square Meters (2,268.2 Acres)1
Oysters
Size
Station
Ave. NORTHEAST RABBIT ISLAND WEST RABBIT ISLAND
Spat (<1”) 16 34 5.00
Seed (1”-<3”) 26 69 9.50
Sack (≥3”) 36 52 8.80
No. of Replicates 5 5
Availability of Oysters
No. of Spat Oysters: 45,894,985.62
No. of Seed Oysters: 87,200,472.68 Sacks of Seed Oysters: 242,223.5
No. of Sack Oysters: 80,775,174.69 Sacks of Sack Oysters: 448,751.0
Total: 690,974.5
OYSTERS AVAILABLE IN GA30
Sacks of Seed Oysters: 308,927.2 Sacks of Sack Oysters: 594,744.1
OYSTERS AVAILABLE IN CALCASIEU LAKE
Sacks of Seed Oysters: 361,176.8 Sacks of Sack Oysters: 621,758.6
1 – Area listed is from LDWF contracted assessments from Encos, Inc. from 2008 and Bio-West from 2011.

CSA7 – 2011 Oyster Stock Assessment Report Page 7-11
Table 7.3. 2011 Oyster Stock Assessment: Sabine Lake – GA31.
SABINE LAKE (GA31) OYSTER STOCK ASSESSMENT
AUGUST 2011
TYPE IIIB – REEF
4,212,739.620 Square Meters (1,041.0 Acres)1
Oysters
Size
Station
Ave. SL1 SL2 SL3 SL4
Spat (<1”) 95 49 82 33 12.95
Seed (1”-<3”) 181 139 210 90 31.00
Sack (≥3”) 198 220 244 139 40.05
No. of Replicates 5 5 5 5
Availability of Oysters
No. of Spat Oysters: 54,554,978.081
No. of Seed Oysters: 130,594,928.22 Sacks of Seed Oysters: 362,763.7
No. of Sack Oysters: 168,720,221.78 Sacks of Sack Oysters: 937,334.6
Total: 1,300,098.3
TYPE IIIB – EXPOSED SHELL
1,774,530.570 Square Meters (438.5 Acres)1
Oysters
Size
Station
Ave. SL5 SL6
Spat (<1”) 31 22 5.30
Seed (1”-<3”) 36 52 8.80
Sack (≥3”) 56 40 9.60
No. of Replicates 5 5
Availability of Oysters
No. of Spat Oysters: 9,405,012.02
No. of Seed Oysters: 15,615,869.02 Sacks of Seed Oysters: 43,377.4
No. of Sack Oysters: 17,035,493.47 Sacks of Sack Oysters: 94,641.6
Total: 138,019
OYSTERS AVAILABLE IN GA31
Sacks of Seed Oysters: 406,141.1 Sacks of Sack Oysters: 1,031,976.2
1 – Area listed is from LDWF contracted assessments from Encos, Inc. from 2008.

CSA7 – 2011 Oyster Stock Assessment Report Page 7-12
Table 7.4. Calcasieu Short Term Assessments and Percentage Change. Data presented are in sacks.
ASSESSMENTS BY CONDITIONAL MANAGED AREA
SACK OYSTERS (≥ 3”) SEED OYSTERS (< 3”)
YEAR EASTSIDE WESTCOVE SABINE EASTSIDE WESTCOVE SABINE
2006 140,876.1 98,069.2 NA 159,298.4 65,379.5 NA
2007 548,333.3 114,414.1 NA 598,181.8 337,566.5 NA
2008 752,061.9 142,199.9 NA 449,720.0 212,483.3 NA
20091 612,687.3 711,613.6 NA 191,435.5 422,520.6 NA
20101 23,540.1 689,375.7 478,985.9 8,545.3 605,983.5 436,409.4
AVERAGE 415,499.7 351,134.5 478,985.9 281,435.8 328,786.7 436,409.4
20112 27,014.5 594,744.1 1,031,976.2 52,831.9 308,927.2 406,141.1
%
CHANGE
FROM
AVE. -93.5 +69.4 +115.5 -81.2 -6.0 -6.9
%
CHANGE
FROM
2010 +14.8 -13.7 +115.5 +518.3 -49.0 -6.9
1 – assessed using updated reef acreage from ENCOS (3,907.1) in 2008.
2 – assessed using updated reef acreage from ENCOS (2008) and Bio-West (2011).
Figure 7.5. Monthly average of boats landing oysters from Calcasieu Lake (GA29 and 30).

CSA7 – 2011 Oyster Stock Assessment Report Page 7-13
Figure 7.6. Calcasieu Lake Available Seed and Sack Oysters.
Figure 7.7. Calcasieu Lake Available Oysters and Landings.

CSA7 – 2011 Oyster Stock Assessment Report Page 7-14
Figure 7.8. Dredge sample comparison (GA31 LT Ave. is the just for 2010 and 2011 data).
Figure 7.9. Average of all Oyster drills taken in all samples from Calcasieu Lake (2011 is only
January – June).
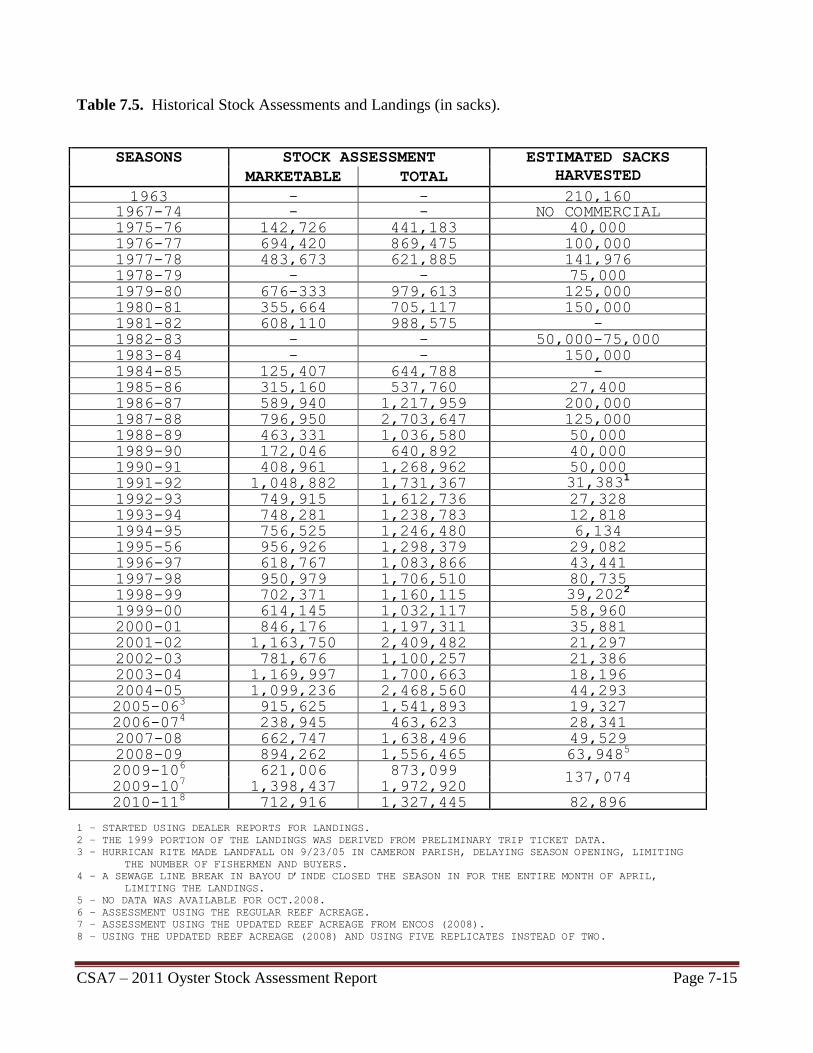
CSA7 – 2011 Oyster Stock Assessment Report Page 7-15
Table 7.5. Historical Stock Assessments and Landings (in sacks).
SEASONS STOCK ASSESSMENT ESTIMATED SACKS
HARVESTED MARKETABLE TOTAL
1963 - - 210,160 1967-74 - - NO COMMERCIAL
LANDINGS 1975-76 142,726 441,183 40,000 1976-77 694,420 869,475 100,000 1977-78 483,673 621,885 141,976 1978-79 - - 75,000 1979-80 676-333 979,613 125,000 1980-81 355,664 705,117 150,000 1981-82 608,110 988,575 - 1982-83 - - 50,000-75,000
1983-84 - - 150,000 1984-85 125,407 644,788 - 1985-86 315,160 537,760 27,400 1986-87 589,940 1,217,959 200,000 1987-88 796,950 2,703,647 125,000 1988-89 463,331 1,036,580 50,000 1989-90 172,046 640,892 40,000 1990-91 408,961 1,268,962 50,000 1991-92 1,048,882 1,731,367 31,383
1
1992-93 749,915 1,612,736 27,328 1993-94 748,281 1,238,783 12,818 1994-95 756,525 1,246,480 6,134 1995-56 956,926 1,298,379 29,082 1996-97 618,767 1,083,866 43,441
1997-98 950,979 1,706,510 80,735 1998-99 702,371 1,160,115 39,202
2
1999-00 614,145 1,032,117 58,960 2000-01 846,176 1,197,311 35,881 2001-02 1,163,750 2,409,482 21,297 2002-03 781,676 1,100,257 21,386 2003-04 1,169,997 1,700,663 18,196 2004-05 1,099,236 2,468,560 44,293 2005-06
3 915,625 1,541,893 19,327
2006-074 238,945 463,623 28,341
2007-08 662,747 1,638,496 49,529 2008-09 894,262 1,556,465 63,948
5
2009-106 621,006 873,099
137,074 2009-10
7 1,398,437 1,972,920
2010-118 712,916 1,327,445 82,896
1 – STARTED USING DEALER REPORTS FOR LANDINGS.
2 – THE 1999 PORTION OF THE LANDINGS WAS DERIVED FROM PRELIMINARY TRIP TICKET DATA.
3 – HURRICAN RITE MADE LANDFALL ON 9/23/05 IN CAMERON PARISH, DELAYING SEASON OPENING, LIMITING
THE NUMBER OF FISHERMEN AND BUYERS.
4 – A SEWAGE LINE BREAK IN BAYOU D’INDE CLOSED THE SEASON IN FOR THE ENTIRE MONTH OF APRIL,
LIMITING THE LANDINGS.
5 – NO DATA WAS AVAILABLE FOR OCT.2008.
6 – ASSESSMENT USING THE REGULAR REEF ACREAGE.
7 – ASSESSMENT USING THE UPDATED REEF ACREAGE FROM ENCOS (2008).
8 – USING THE UPDATED REEF ACREAGE (2008) AND USING FIVE REPLICATES INSTEAD OF TWO.

CSA7 – 2011 Oyster Stock Assessment Report Page 7-16
Table 7.6. Calcasieu Lake Percent of Season Days Open.
SEASON TOTAL
DAYS
LOWER CALCASIEU LAKE CMA
GA29
WEST COVE CMA
GA30
OPEN DAYS PERCENTAGE OPEN DAYS PERCENTAGE
1991-92 199 114 57 114 57
1992-93* 165 137 83 76 46
1993-94 181 146 81 84 46
1994-95 181 90 50 9 5
1995-96 188 175 93 115 61
1996-97 197 149 76 114 58
1997-98 197 139 71 96 49
1998-99 197 135 69 120 61
1999-00 197 197 100 182 92
2000-01 198 180 95 106 53
2001-02 198 158 80 61 31
2002-03 198 146 74 66 33
2003-04 199 172 87 126 63
2004-05 198 168 85 68 34
2005-06 LCLCMA 198 187 94
WCCMA 205 165 40
2006-07 LCLCMA 181 118 65
WCCMA 197 70 35
2007-08 LCLCMA 182 165 91
WCCMA 199 131 66
2008-09 LCLCMA
198 183 92
WCCMA 125 63
2009-10 LCLCMA
198 157 79
WCCMA 80 40
2010-11 GA29 131 131 100
GA30 196 186 95
* 92-93 SEASON STARTED USING CALCASIEU RIVER GAUGE AT KINDER FOR DHH CLOSURES.
Table 7.7. Calcasieu Lake Salinity and Temperature.
2011 HYDROLOGY
GA29 GA30 GA31 LONG TERM (CALCASIEU LAKE)1
MONTH AVE.
SAL.
AVE.
TEMP.
AVE.
SAL.
AVE.
TEMP.
AVE.
SAL.
AVE.
TEMP.
AVE.
SAL.
AVE.
TEMP.
MAY DREDGE SAMLES
15.8 26.8 17.6 22.7 22.2 24.9 10.7 24.5
JUNE DREDGE SAMPLES
14.6 29.1 17.3 28.2 18.5 30.3 11.1 28.1
AUGUST SQ. MTR. ASSESSMENT
20.8 30.7 17.6 31.2 19.3 31.0 15.5 29.5
1 – Longterm is only available from Calcasieu Lake, from 16’trawl data (1970-2010).

CSA7 – 2011 Oyster Stock Assessment Report Page 7-17
Table 7.8. Calcasieu Lake Oyster Season Dates.
SEASON
REGULAR SEASON EXTENDED SEASON
TOTAL
DAYS
IN
SEASON
DATES
DHH HEALTH CLOSURES
DATES
DHH HEALTH CLOSURES
CAL. L. CMA WEST COVE CMA CAL. L. CMA WEST COVE
CMA
OPEN
DATE
CLOSED
DATE
TOTAL
DAYS
DAYS
OPEN
DAYS
CLOSED
DAYS
OPEN
DAYS
CLOSED
OPEN
DATE
CLOSED
DATE
TOTAL
DAYS
DAYS
OPEN
DAYS
CLOSED
DAYS
OPEN
DAYS
CLOSED
1989-90 11-15 3-15 121 79 42 79 42 3-16 4-30 46 40 6 40 6 165
1990-91 11-15 3-1 147 95 52 95 52 3-30 4-20 34 20 0 0 0 181
1991-92 10-15 3-1 139 69 70 69 70 3-2 4-30 60 45 15 15 15 199
1992-931 10-15 3-1 138 123 15 76 62 3-8 4-3 27 14 13 13 27 165
1993-94 11-1 3-1 121 94 27 61 60 3-2 4-30 60 52 8 8 7 181
1994-952 11-1 3-1 121 69 52 9 112 3-2 4-30 60 21 39 39 60 181
1995-96 10-16 3-1 138 125 13 80 58 3-2 3-31 30 30 0 0 0 -
4-11 4-30 20 20 0 0 15 188
1996-97 10-16 5-1 197 149 48 83 114 - - - - - - - 197
1997-98 10-16 4-30 197 139 58 101 96 - - - - - - - 197
1998-993 10-16 4-30 197 135 62 77 120 - - - - - - - 197
1999-00 10-16 4-30 197 197 0 182 15 - - - - - - - 197
2000-01 10-15 4-30 198 180 18 106 92 - - - - - - - 198
2001-02 10-15 4-30 198 158 40 61 137 - - - - - - - 198
2002-03 10-15 4-30 198 146 52 66 132 - - - - - - - 198
2003-04 10-15 4-30 199 172 27 126 73 - - - - - - - 199
2004-05 10-15 4-30 198 168 30 68 130 - - - - - - - 198
2005-06 LCLCMA 10-15 4-30 198 187 11 - - - - - - - 198
WCCMA 10-8 4-30 205 165 40 - - - - - - - 205
2006-07 LCLCMA 11-1 4-30 181 118 63 - - - - - - - 181
WCCMA 10-16 4-30 197 70 127 - - - - - - - 197
2007-08 LCLCMA 11-1 4-30 182 - - - - - - - 181
WCCMA 10-15 4-30 199 - - - - - - - 198
2008-09 LCLCMA
10-15 4-30 198 183 15 - - - - - - -
198 WCCMA 125 73 - - - - - - -
2009-10 GA29
10-15 4-30 198 157 41 - - - - - - -
198 GA30 80 118 - - - - - - -
2010-11 GA29 11-15 3-25
5 131 131 0 - - - - - - - 131
GA304 10-15 4-30 196 186 10 - - - - - - - 196
1 – STARTING WITH THE 92-93 SEASON CALCASIEU LAKE WAS SPLIT INTO TWO UNITS: CAL. LAKE CMA (W/ RIVER STAGE CLOSURE @ 12 FT.) AND WEST
COVE CMA (W/ RIVER STAGE CLOSURE @ 7 FT.).
2 – DHH CLOSED THE CAL. LAKE CMA (FROM 11/1-12/10/94) AND WEST COVE (FROM 11/1-1/28/95) WITH A PRECAUTIONARY (POSSIBLE LEAD
CONTAMINATION) CLOSURE.
3 – DURING THIS SEASON THE RIVER LEVEL CRITERIA IN THE CAL. LAKE CMA CHANGED FROM 12 TO 13.5 FT.
4 – FROM 10-15 THROUGH 11-14, THE SACK LIMIT WAS 20; SACK LIMIT REVERTED TO 10 FOR THE REMAINDER OF THE SEASON IN BOTH GROWING AREAS
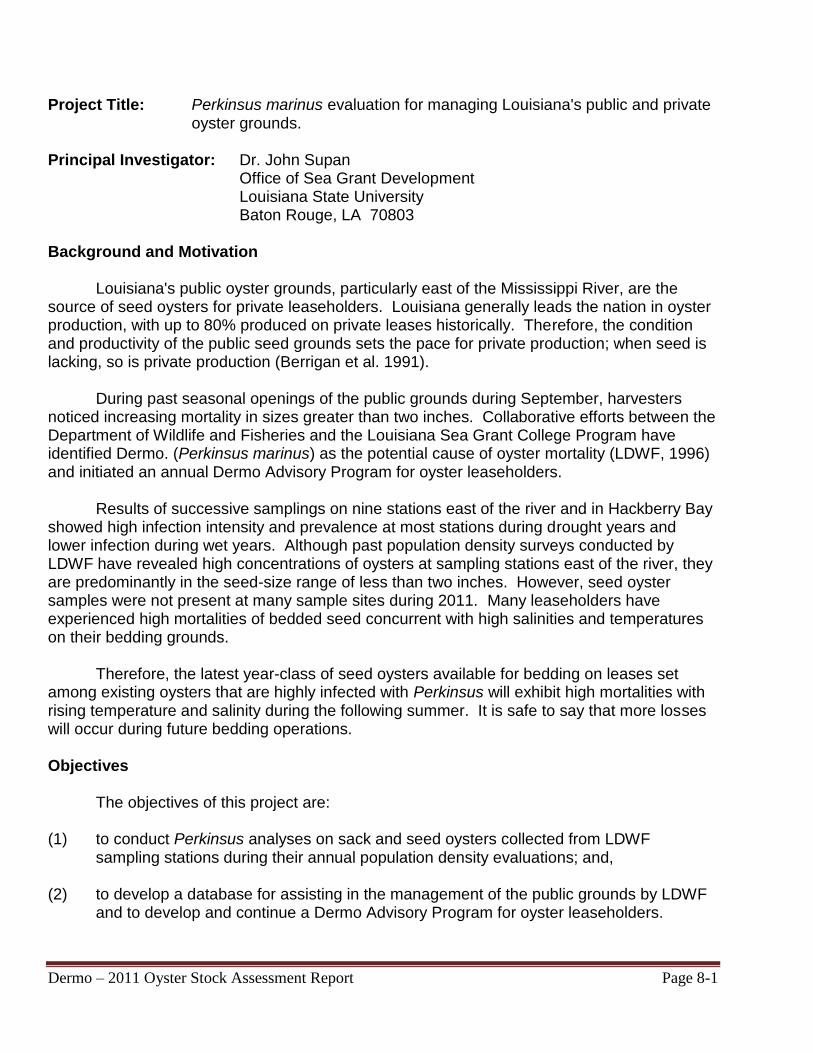
Dermo – 2011 Oyster Stock Assessment Report Page 8-1
Project Title: Perkinsus marinus evaluation for managing Louisiana's public and private oyster grounds.
Principal Investigator: Dr. John Supan
Office of Sea Grant Development Louisiana State University Baton Rouge, LA 70803
Background and Motivation
Louisiana's public oyster grounds, particularly east of the Mississippi River, are the source of seed oysters for private leaseholders. Louisiana generally leads the nation in oyster production, with up to 80% produced on private leases historically. Therefore, the condition and productivity of the public seed grounds sets the pace for private production; when seed is lacking, so is private production (Berrigan et al. 1991).
During past seasonal openings of the public grounds during September, harvesters noticed increasing mortality in sizes greater than two inches. Collaborative efforts between the Department of Wildlife and Fisheries and the Louisiana Sea Grant College Program have identified Dermo. (Perkinsus marinus) as the potential cause of oyster mortality (LDWF, 1996) and initiated an annual Dermo Advisory Program for oyster leaseholders.
Results of successive samplings on nine stations east of the river and in Hackberry Bay
showed high infection intensity and prevalence at most stations during drought years and lower infection during wet years. Although past population density surveys conducted by LDWF have revealed high concentrations of oysters at sampling stations east of the river, they are predominantly in the seed-size range of less than two inches. However, seed oyster samples were not present at many sample sites during 2011. Many leaseholders have experienced high mortalities of bedded seed concurrent with high salinities and temperatures on their bedding grounds.
Therefore, the latest year-class of seed oysters available for bedding on leases set
among existing oysters that are highly infected with Perkinsus will exhibit high mortalities with rising temperature and salinity during the following summer. It is safe to say that more losses will occur during future bedding operations. Objectives
The objectives of this project are: (1) to conduct Perkinsus analyses on sack and seed oysters collected from LDWF
sampling stations during their annual population density evaluations; and, (2) to develop a database for assisting in the management of the public grounds by LDWF
and to develop and continue a Dermo Advisory Program for oyster leaseholders.

Dermo – 2011 Oyster Stock Assessment Report Page 8-2
Approach
Seed and sack oysters were collected by LDWF personnel from ten stations during the annual sampling of the public grounds, including nine stations east of the river and Hackberry Bay. Samples were taken to the Sea Grant Oyster Hatchery for subsequent analyses.
Perkinsus assays were conducted using oyster rectal tissue in Ray's Fluid
Thioglycollate Media (RFTM) with a 7-14 day incubation period (Ray, 1966), and ranked according to intensity of infection by a 0-5 evaluation scale (Mackin 1962). Fifteen of each size range of oysters (seed [<1 inch]: market-size [>3 inches]) were analyzed, unless otherwise noted in the Table 1.
Final laboratory results were forwarded to LDWF for incorporation into its database for oyster management decision making and for the continuation of the Dermo Advisory Program at the Oyster Sentinel website. Results
The Dermo infection intensity (weighted incidence) and percent prevalence at the ten stations during July 2011 are listed in Table 1. The 2010 data are listed in Table 2 for comparison. Dermo infections at most stations were greater in 2011 than in 2010. Infections were weighted incidence valued at 1 or greater, which is considered a dangerous or lethal value for any given oyster population, were found in market-size oysters at two sample sites, Three Mile Island, and Black Bay South. Many stations had few or no seed oysters in the sample.
Literature Cited Anonymous, 1996. Special Report on Recent Oyster Population Dynamics in Coastal Study
Area II (1992-1996). Louisiana Department of Wildlife and Fisheries, New Orleans, La. Berrigan, M., T. Candies, J. Cirino, R. Dugas, C. Dyer, J. Gray, T. Herrington, W. Keithly, R.
Leard, J.R. Nelson and M. Van Hoose. 1991. The Oyster Fishery of the Gulf of Mexico, United States: A regional management plan. Pub. No. 24, Gulf States Fisheries Commission, Ocean Springs, MS, 184 p.
Mackin, J. G. 1962. Oyster disease caused by Dermocystidium marinum and other
microorganisms in Louisiana. Publ. Inst. Mar. Sci. Univ. Texas, 7(1961):132-229. Ray, S.M., 1996. A review of the culture method for detecting Dermocystidium marinum, with
suggested modifications and precautions. Natl. Shellfish. Assoc. Proc. 54:55-69.

Dermo – 2011 Oyster Stock Assessment Report Page 8-3
Table 1 2011 DERMO RESULTS
EAST OF RIVER & HACKBERRY BAY
____________________________________________________ __________Seed__________ _________Market__________
Weighted Weighted
Prevalence Incidence Prevalence Incidence
Bay Gardene 50% 0.5 n=8 66% 0.6
Lonesome I. 75% 0.7 n=4 73% 0.7
Mozambique Pt. 7% 0.03 20% 0.1
N. Black Bay no sample no sample
S. Black Bay no sample 73% 1.0
Bay Crabe no sample 26% 0.4
Telegraph Pt. no sample 53% 0.7
Cabbage Reef no sample 10% 0.1 n=10
Three Mile 66% 0.6 73% 1.3
Hackberry Bay 0% 0.0 53% 0.5
____________________________________________________
Table 2 2010 DERMO RESULTS
EAST OF RIVER & HACKBERRY BAY
____________________________________________________ __________Seed__________ _________Market__________
Weighted Weighted
Prevalence Incidence Prevalence Incidence
Bay Gardene 0% 0 33% 0.2
Lonesome I. 13% 0.1 0% 0
Mozambique Pt. 7% 0.03 20% 0.1
N. Black Bay 14% 0.1 20% 0.1
S. Black Bay 20% 0.1 0% 0
Bay Crabe 27% 0.1 14% 0.1
Telegraph Pt. 40% 0.4 33% 0.2
Cabbage Reef 27% 0.3 60% 0.3
Three Mile 20% 0.1 53% 0.3
Hackberry Bay 33% 0.2 13% 0.1
___________________________________________ Mackin Scale used to determine incidence.

Dermo – 2011 Oyster Stock Assessment Report Page 8-4
Levels of the oyster parasite Perkinsus marinus
from Louisiana oysters west of the Mississippi River:
Summer 2011
by
Thomas M. Soniat, Ph.D.
6 August 2011

Dermo – 2011 Oyster Stock Assessment Report Page 8-5
Among the most significant causes of oyster mortality is the parasite Perkinsus marinus
(formerly Dermocystidium marinum), which is responsible for annual mortality rates that exceed
50% in most populations of adult eastern oysters, Crassostrea virginica. Perkinsus marinus was
described in 1950 by John Mackin, Malcolm Owen and Albert Collier as Dermocystidium
marinum – hence the common name “Dermo” which is still in use (Mackin et al. 1950).
The discovery of the parasite was the result of investigations (funded by a consortium
of oil companies and directed by Texas A&M University) of the impact of oil and gas activities
on the Louisiana oyster industry (Mackin and Hopkins, 1962). Extensive studies were conducted
on the effects of crude oil, bleed water, natural gas, drilling mud and seismographic surveys. It
was ultimately realized that none of these pollutants or activities explained the widespread
mortalities of oysters that were observed. It is now known that the parasite is a major cause of
oyster mortality from Maine to Mexico (Soniat, 1996).
The critical environmental factors which favor the proliferation of the parasite are high
water temperatures and high salinities. Thus infections are more intense in the late summer, on
the seaward side of estuaries and during droughts. Drought conditions on the Gulf Coast are
associated with the La Niña phase of El Niño Southern Oscillation; however, increases in
prevalence (percent infection, PI) precede sharp increases in intensity (weighted incidence, WI)
and epizootics of Dermo in Louisiana can lag La Niña events by about 6 months (Soniat et al.,
2005). Management techniques to minimize disease and increase oyster harvest include moving
infected oysters to lower salinity, early harvest of infected populations, and even freshwater
diversion into high-salinity estuaries. Because of the key role of Dermo as a cause of oyster
mortality, the success of oyster farming depends on the ability to manage oyster populations in
the presence of high levels of disease (Soniat and Kortright, 1998).
The standard assay for determining the level of parasitism is the fluid thioglycollate
method (Ray, 1966). A small piece of tissue is removed and assayed for disease after incubation
in fluid thioglycollate and antibiotics for one week. P. marinus intensity is scored using a 0-to-5
scale developed by Mackin (1962), where 0 is no infection and 5 is an infection in which the

Dermo – 2011 Oyster Stock Assessment Report Page 8-6
oyster tissue is almost entirely obscured by the parasite. Calculations are made of percent
infection (PI) and weighted incidence (WI), which is the sum of the disease code numbers
divided by the total number of oysters in the sample. A WI of 1.5 could be considered a level at
which disease-related mortalities are occurring. For example, Mackin (1962) claims: “a
population of live oyster with a weighted incidence of 2.0 contains an intense epidemic, and
more than half of the population may be in advanced stages of the disease, with all of the
individuals infected.”
Oysters for the summer 2011 study were collected from 10 sites west of the Mississippi
River. Samples were taken from one site in Lake Felicity (LF), one site in Lake Chien (LC), two
sites in Sister Lake, two sites in Bay Junop, one site (Indian Point, IP) in Vermilion Bay, two
sites in Lake Calcasieu, and one site in Sabine Lake (SL) The Sister Lake sites were Grand Pass
(GP) and Old Camp (OC). The Bay Junop sites were Bayou DeWest (DW) and Buckskin Bayou
(BB). The Lake Calcasieu sites were the 2009 Shell Plant (SP) and Northeast Rabbit Island (NE).
The length of 10 oysters was measured; mantle tissue was removed from each of the 10
oysters, incubated at room temperature in fluid thioglycollate for about a week, and assayed
according to the standard Ray (1966) technique. The level of infection (disease code) was scored
from 0 to 5, where 0 is no infection and 5 is near total coverage of the oyster tissue by the
parasite. Weighted incidence (WI) was calculated by summing the disease code values and
dividing by 10, the number of oysters in the sample.
Weighed incidence (WI) and percent infection (PI) results are shown in Table 1. WI
values were 0.00 (Bayou DeWest), 0.00 (Buckskin Bayou), 0.07 (Grand Pass), 0.00 (Old Camp),
0.00 (Indian Point), 0.07 (Lake Chien), 0.00 (Lake Felicity), 0.50 (Shell Plant), 0.10 (Northeast
Rabbit), and 1.13 (Sabine Lake). Salinity and disease levels were generally depressed, especially
in areas that were likely affected by this year’s diversions of Mississippi River into the
Atchafalaya Basin. The weighted incidence values are below critical levels, but there is some
cause for concern in Lake Calcasieu and Sabine Lake. Most of the oysters from Lake Calcasieu
were infected, and the Sabine Lake sample showed 100% infection and a weighted incidence
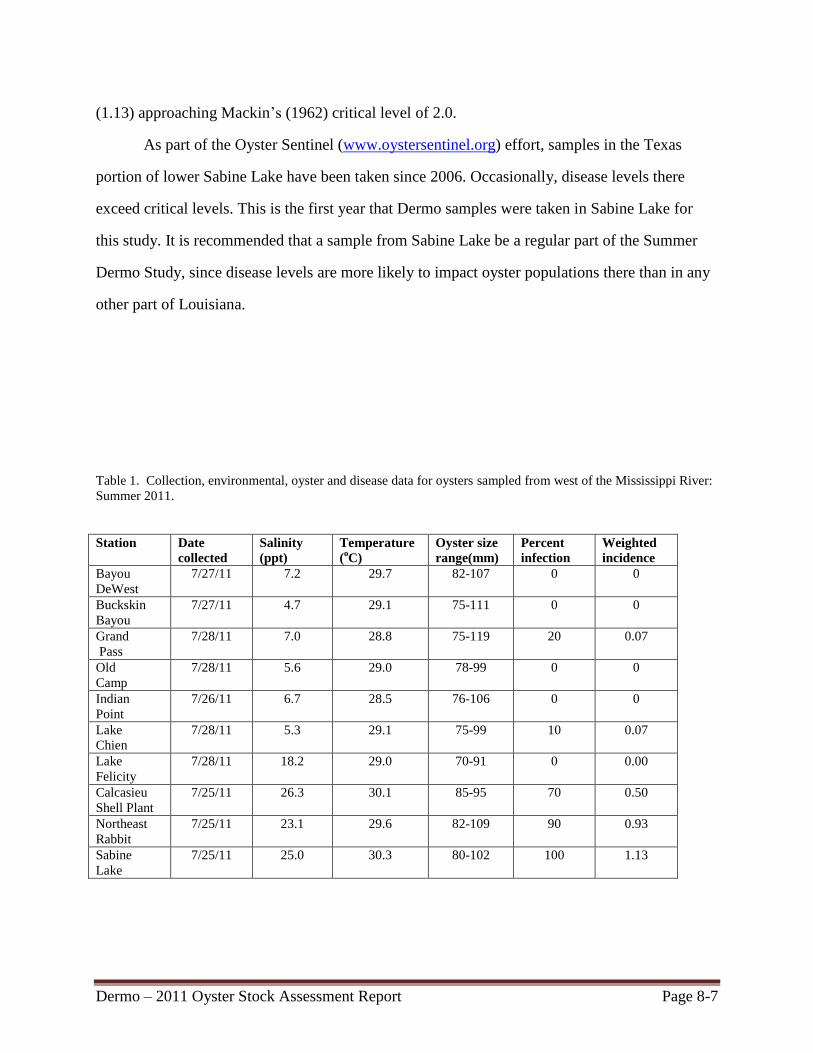
Dermo – 2011 Oyster Stock Assessment Report Page 8-7
(1.13) approaching Mackin’s (1962) critical level of 2.0.
As part of the Oyster Sentinel (www.oystersentinel.org) effort, samples in the Texas
portion of lower Sabine Lake have been taken since 2006. Occasionally, disease levels there
exceed critical levels. This is the first year that Dermo samples were taken in Sabine Lake for
this study. It is recommended that a sample from Sabine Lake be a regular part of the Summer
Dermo Study, since disease levels are more likely to impact oyster populations there than in any
other part of Louisiana.
Table 1. Collection, environmental, oyster and disease data for oysters sampled from west of the Mississippi River:
Summer 2011.
Station Date
collected
Salinity
(ppt)
Temperature
(oC)
Oyster size
range(mm)
Percent
infection
Weighted
incidence
Bayou
DeWest
7/27/11 7.2 29.7 82-107 0 0
Buckskin
Bayou
7/27/11 4.7 29.1 75-111 0 0
Grand
Pass
7/28/11 7.0 28.8 75-119 20 0.07
Old
Camp
7/28/11 5.6 29.0 78-99 0 0
Indian
Point
7/26/11 6.7 28.5 76-106 0 0
Lake
Chien
7/28/11 5.3 29.1 75-99 10 0.07
Lake
Felicity
7/28/11 18.2 29.0 70-91 0 0.00
Calcasieu
Shell Plant
7/25/11 26.3 30.1 85-95 70 0.50
Northeast
Rabbit
7/25/11 23.1 29.6 82-109 90 0.93
Sabine
Lake
7/25/11 25.0 30.3 80-102 100 1.13

Dermo – 2011 Oyster Stock Assessment Report Page 8-8
Literature Cited
Mackin, J.G. 1962. Oyster disease caused by Dermocystidium marinum and other
microorganisms in Louisiana. Publ. Inst. Mar. Sci. Univ. Tex. 7:132-299
Mackin, J.G. and S.H. Hopkins. 1962. Studies on oyster mortality in relation to natural
environments and to oil fields in Louisiana. Publ. Inst. Mar. Sci. Univ. Tex. 7:1-131.
Mackin, J.G., H.M. Owen and A. Collier. 1950. Preliminary note on the occurrence of a new
protistan parasite, Dermocystidium marinum n.sp. in Crassostrea virginica (Gmelin) Science
111:328-329.
Ray S.M. 1966. A review of the culture method for detecting Dermocystidium marinum with
suggested modifications and precautions. Proc. Natl. Shellfish. Assoc. 54:55-70.
Soniat, T.M. 1996. Epizootiology of Perkinsus marinus disease of eastern oysters in the Gulf of
Mexico. J. Shellfish Res. 15:35-43.
Soniat, T.M. and E.V. Kortright. 1998. Estimating time to critical levels of Perkinsus marinus in
eastern oysters, Crassostrea virginica. J. Shellfish Res. 17:1071-1080.
Soniat, T.M., J.H. Klinck, E.N. Powell, and E.E. Hofmann. 2005. Understanding the success and
failure of oyster populations: climatic cycles and Perkinsus marinus. J. Shellfish Res. 24: 83-93.