LOU LAMBERT, DEPUTY DIRECTOR
78
LOU LAMBERT, DEPUTY DIRECTOR BUREAU OF TRANSPORTATION PLANNING
Transcript of LOU LAMBERT, DEPUTY DIRECTOR

LOU LAMBERT, DEPUTY DIRECTOR
BUREAU OF TRANSPORTATION PLANNING

FIVE MAJOR AREAS
Evolving Process of Strategic
Analysis
New Paradigm in Transportation
Current Activities in Asset
Management
Michigan Business Process
Emerging Issues

From Needs Studies to
Asset Management
EVOLVING PROCESS OF
STRATEGIC ANALYSIS

NEEDS STUDIES
Key Objectives
Produce for Legislature, Governor and the public a single volume of highway system inventories and revenues needed to retire deficiencies
Serve as a backdrop to establish revenue increases and the distribution of funds
Michigan conducted several – most extensive in 1984

PROBLEMS
The funds needed to retire deficiencies
were staggering: over $22 billion just for
highways
Assessments assumed that all dollar needs
were of equal importance
No prioritization of needs
No standards or performance measures

1980’S
CRUMBLING INFRASTRUCTURE
America in Ruins: Beyond the Public Works
Pork Barrel
Public Works Infrastructure: Policy
Considerations for the 1980s
Federal Policies for Infrastructure Management
Reinventing Government: How the
Entrepreneurial Spirit is Transforming the
Public Sector

1990’S
DECADE OF PERFORMANCE
1991: Passage of ISTEA
1993: Government Performance & Results Act
1994: EO 12893 – Principles for Federal Infrastructure Investment
1995: National Highway System Act
1998: TEA-21
1999: GASB Statement 34

WHAT IS DRIVING
ASSET MANAGEMENT?
Aging infrastructure and mature systems
Public expectations
Changes in leadership philosophy
• Customer-driven
• “Best Management Practices”
Advanced management systems and improved
technology
Productivity of the system and economic growth

ASSET MANAGEMENT
BASIC APPROACH
Set Goals and Objectives
Collect Inventory and Condition Data
Rates of Deterioration
Performance Standards & Measures
Life-Cycle Cost Analysis
Investment Strategies
Programs, Projects, and Practices
Monitoring Feedback and Adjustments

ASSET MANAGEMENT
A strategic approach to managing our
infrastructure
• Quality Performance
• Continuous Improvement
Investing wisely
Data are “corporate assets”

NEW PARADIGM

NEW PARADIGM
IN TRANSPORTATION
Transportation Networks viewed
as Utilities
Investments in Assets rather than
the traditional public idea of mere
Expenditures of Funds

ASSET MANAGEMENT
Asset management is the philosophy that
best fits this paradigm
A “strategic” approach to managing your
infrastructure
Provides a systematic process for
maintaining, upgrading, and operating the
assets cost-effectively

CONSISTS OF
Thinking long-term rather than immediate
need
Continuous system performance assessment
Collecting appropriate data
Using technology and analytical tools
Monitoring results

GOALS OF
ASSET MANAGEMENT
Build, preserve, and operate assets cost-
effectively with improved performance
Deliver to customers the best value for the
dollars spent
Enhance credibility and accountability

CRITICAL ELEMENTS
Consider a range of alternatives in addressing
problems and needs
Procedures and evaluation criteria are consistent
and reinforce policy goals and objectives
Decisions based on relative merit and an
understanding of comparative costs and
consequences
Investing wisely

MANAGING PAVEMENTS
NOT ROAD CONDITION
Set targets
Establish strategy to meet targets
Establish cost-effective, long- & short-range programs
Maximize benefits to motoring public
Maximize pavement condition and minimize costs
Maintain and improve future pavements


WHAT’S DIFFERENT?
• OLD PROCESS
Tactical
Reactive
Compartmental & Piecemeal
Stove Pipes
Basic Tools
“Slice in Time
Deficiencies
Retiring Backlog
Look Backwards
• NEW PROCESS
Strategic
Proactive
Integrated and
Systematic
Interdisciplinary
Advanced Systems
Continuous assessment
Function of Road
Systems Approach
Forward Looking

CURRENT ACTIVITIES IN
ASSET MANAGEMENT

CURRENT ACTIVITIES IN
ASSET MANAGEMENT
Nationally
In Michigan – HB 5396
Growing Partnerships
Universities
Industry Representatives
Financial Sector
Local Governments

MANY PARTNERSHIPS
AASHTO Task Force on Asset
Management
FHWA – Office of Asset Management
Other transportation agencies and providers
Private Sector
Universities – Regional Transportation
Centers

AASHTO
1998: Established Task Force on Asset
Management
1999: NCHRP Project to develop first
generation asset management guide
1999/2000: Adoption of Strategic Plan
2002: Established a joint website

STRATEGIC PLAN
Develop partnerships with public and private entities
Develop and document an understanding of asset management
Promote the development of tools, analysis methods, and research topics
Inform member states on how to utilize asset management
Assist member states in assessing and implementing asset management principles

ASSET MANAGEMENT GUIDE
First Phase is completed and consists of 3 volumes
• Synthesis of Asset Management Practice
• Asset Management Framework
• Recommended Research Program
Second Phase is just beginning
• Provide state agencies with a “rating” guide to judge
how effectively they are implementing asset
management principles

FEDERAL HIGHWAY
ADMINISTRATION:
OFFICE OF ASSET MANAGEMENT
Created in response to strategic planning efforts
3 Key Responsibilities:
• Provide national leadership in asset management
principles for highway program administration
• Develop asset management policies for pavement,
bridge, and system preservation
• Partner with AASHTO, other FHWA offices and others
to conduct nationwide programs

MICHIGAN: HB 5396
Special Committee issued a report in June
2000 that recommended that all road
agencies use an asset management approach
HB 5396 was introduced last fall in the
Michigan House of Representatives
Passed the House last December: 99-0
Senate is expected to pass it soon
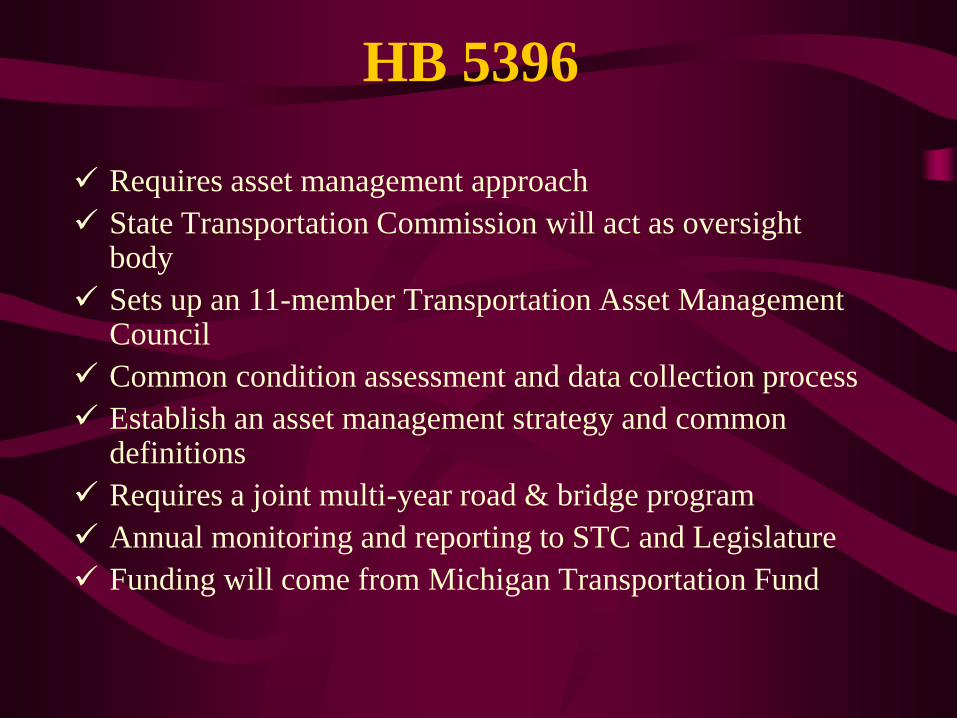
HB 5396
Requires asset management approach
State Transportation Commission will act as oversight body
Sets up an 11-member Transportation Asset Management Council
Common condition assessment and data collection process
Establish an asset management strategy and common definitions
Requires a joint multi-year road & bridge program
Annual monitoring and reporting to STC and Legislature
Funding will come from Michigan Transportation Fund

TRANSPORTATION ASSET
MANAGEMENT COUNCILMISSION STATEMENT
To advise the State Transportation
Commission on a statewide asset
management strategy and the necessary
procedures and analytical tools to
implement such a strategy on Michigan’s
highway system in a cost-effective, efficient
manner

ORGANIZATION CHART

GROWING PARTNERSHIPSUNIVERSITIES
Regional Transportation Centers
Local Technical Assistance Program
(LTAP)
Need for developing curricula for training a
new generation of engineers and planners

GROWING PARTNERSHIPSPRIVATE & FINANCIAL SECTORS
?Opportunities

GROWING PARTNERSHIPSLOCAL GOVERNMENTS
Pilot study with 5 counties, several cities
and regional planning commissions
Collection of road condition data on the
federal-aid system
Used PASER rating system

7
4
9
6
5
7
7
5
8 8
4
3 5
6
7
5
5 6
6
4
6
5
4
4
4
8
9
8
4
8
4
4
4
4
93
6
4
8
5
6
9
4
3
8
7
5
10
5
5
9
7
3
62
10
1
8
2
9
4
9
8
5
8
3
. Genesee County Federal Aid .
0 2 4 6
Miles
PASER Condition RatingsGood
Fair
Poor
561
332
85
MILES
0
100
200
300
400
500
600
GOOD
FAIR
POOR
PASER CONDITION RATING

ASSET MANAGEMENT SCALE
0 2 4 6
Miles
CATEGORIES 1 = No Maintenance Needed
2 = Routine Maintenance
3 = Preservative Treatments
4 = Structural Rehab
5 = Reconstruction
ASSET MANAGEMENT SCALE
0 2 4 6
Miles
CATEGORIES 1 = No Maintenance Needed
2 = Routine Maintenance
3 = Preservative Treatments
4 = Structural Rehab
5 = Reconstruction
86
255
362
263
11
MILES
0
50
100
150
200
250
300
350
400
CATEGORY 1 (PASER Ratings 9 -10)
CATEGORY 2 (PASER Ratings 7 - 8)
CATEGORY 3 (PASER Ratings 5 - 6)
CATEGORY 4 (PASER Ratings 3 - 4)
CATEGORY 5 (PASER Ratings 1 - 2)
ASSET MANAGEMENT SCALE

0
200
400
600
800
1000
1200
1400
Miles
None Routine Preventive Structural Reconstruct
Type of Work
535
1207 1171
662
72
Asset Management: TotalsFederal-Aid System

MICHIGAN’S
ASSET
MANAGEMENT PROCESS

MICHIGAN BUSINESS
PROCESS Five Major Components:
•Policy Goals & Objectives
•Information & Data Collection
•Planning & Programming
•Program Delivery
•Monitoring & Reporting
Cash Flow Model
Call for Projects
5-Year Road & Bridge Program

MDOT ASSETS Over 9,700 miles of road (27,000 lane miles) and 5,679
bridges
215 park-and-ride lots
2,400 trucks, maintenance vehicles, vans and cars
450,000 signs; 4,025 traffic lights; 8 million linear feet of guardrails
83 rest areas and 13 travel information centers
85 roadside parks and 27 scenic turnouts; 41 picnic sites and 2,400 picnic tables
163 pump houses; 188 water wells; 54 sewage disposal facilities and 64,000 catch basins
Nearly 2,000 miles of non-motorized facilities; 700 miles of rail lines; 4,500 miles of fences

MDOT’S CONSTRUCT
Policy goals and objectives
Information and data collection
Planning and programming
Program delivery
Monitoring and reporting

POLICY GOALS & OBJECTIVES
Reflect a comprehensive, long-term view of
asset performance and cost
Development of a strategic plan
Managing for results
Focus on performance

POLICY GOALS & OBJECTIVES
Michigan Transportation Policy Plan
State Long Range Plan
MDOT’s Business Plan
Program Specific Strategies
• Strategy for Repairing & Rebuilding Roads
• Freeway Modernization Strategy
• Corridor Management Strategy
• Access Management Strategy
• Border Crossing & Trade Corridor Strategy

INFORMATION & DATA
Maintain high-quality information that supports
asset management and business process
Collect and update data cost-effectively
Data viewed as “corporate asset”
Information automated and accessible to all parties
• GIS Framework Project
• Global Positioning Satellite (GPS)

PLANNING &
PROGRAMMING
Consider a range of alternatives in addressing problems and deficiencies
Procedures and evaluation criteria are consistent and reinforce policy goals and objectives
Decisions based on relative merit and an understanding of comparative costs and consequences

ALTERNATIVE ANALYSES
Strategic rather than tactical
Decisions made with regard to the long-range condition of the entire system
Assessing improvements based on desired outcomes
Tools
• Road Quality Forecasting System
• Bridge Condition Forecasting System

PROGRAM DELIVERY
Consider all available program delivery methods
• Cost tracking
• Options for delivery
Track program output and outcomes
• Feedback mechanism
• Change process
Communicate and apply outcomes internally and externally
Deliver the approved program
• Delivery measures
• Change management

MONITORING & REPORTING
Monitoring directly relates to selected
performance measures
Provide feedback on whether the activities
undertaken are moving you toward
achieving your goals and objectives
Analysis feeds into the next round of
proposed projects

0.00%
10.00%
20.00%
30.00%
40.00%
50.00%
60.00%
70.00%
80.00%
90.00%
100.00%
1985 1986 1987 1988 1989 1990 1991 1992 1993 1994 1995 1996 1997 1998 1999
FREEWAY NON-FREEWAY
SUFFICIENCY: ROUTE MILES GOOD
UNIVERSITY REGION

MDOT PROCESS
HIGHWAYS & BRIDGES Strategic Analysis
Ride Quality Forecasting/Remaining Service Life/Bridge Condition Forecasting
Multi-Year Strategy
Call for Projects
Candidate List of Projects
Prioritization Process
5-Year Program
Monitor Progress

BASIS FOR DECISIONS
Cash Flow Model
Road Quality Forecasting System & Bridge
Condition Forecasting System
Call for Projects
• Corridor Approach
• Capital Preventive Maintenance Strategy
Five-Year Road & Bridge Program

CASH FLOW MODEL Provides an evaluation of the amount and type of
road & bridge projects that can be built with a given funding amount
Calculates the expected expenditures and revenues for 7-10 years
Revenues less expenditures yields the expected cash balance at the end of the year
Allows management to approximate impact of:
• New revenue sources
• Changes in cost of projects
• Change in timing of federal-aid reimbursements and lagged effect of expenditures
Talk with Governor and Legislature about financial expectations and the resulting condition

RIDE QUALITY
FORECASTING SYSTEM
Strategy analysis tool to project results of
pavement rehabilitation policies
Remaining Service Life
Collection of fixes that will extend the life
of the road
Analyze various pavement strategies and
funding scenarios

PAVEMENT PRESERVATIONSTRATEGIC OBJECTIVES
Establish cost-effective, long- and short-
range programs
Maximize benefits to the motoring public
Maximize pavement condition and
minimize costs
Manage pavements not road condition

STRATEGY ELEMENTS
Mix of fixes
Varying fix lives
Short-term versus long-term
Meet condition goals

HIGHWAYS: MIX OF FIXES
CAPITAL PREVENTIVE
MAINTENANCE:
• Short-term fix: 10 years or less
REHABILITATION:
• Medium-term fix: 10-20 years
RECONSTRUCTION:
• Long-term fix: 20 years or more

CAPITAL PREVENTIVE MAINTENANCE
TREATMENTS
FLEXIBLE & COMPOSITE
• Non-Structural Bituminous Overlay
• Surface Milling
• Chip Seals
• Micro-Surfacing
• Overband Crack Filling
• Bituminous Shoulder Ribbons
• Ultra Thin Overlay
• RIGID PAVEMENTS
• Full Depth Concrete Pavement
Repair
• Joint Resealing
• Spall Repair
• Crack Sealing
• Diamond Grinding
• Dowel Bar Retrofit
• Bituminous Shoulder Ribbons
• Open-graded Underdrain
Cleaning and Repair

FIX LIVES: Bituminous Non-structural Bituminous Overlay
• Flexible: 5-10 years
• Composite: 4-9 years
Surface Milling
• Flexible: 5-10 years
• Composite: 4-9 years
Chip Seal
• Flexible Single Seal: 3-6 years
• Flexible Double Seal: 4-7 years
Micro-Surfacing: Flexible
• Single Course: 3-5 years
• Double Course: 4-6 years
Ultra-Thin Bituminous Overlay
• Flexible: 3-5 years
• Composite: 3-5 years

FIX LIVES: Concrete
Full Depth Concrete Repair: Rigid
• 3-10 years
Diamond Grinding: Rigid
• 3-5 years
Concrete Pavement Restoration: Rigid
• 3-5 years


BRIDGE STRATEGY
HISTORIC APPROACH
Structure-by-structure basis
Preservation strategies were reactive
Limited investment on “good” and “fair”
structures
Maintenance was also reactive rather than
preventive

BRIDGE CONDITION
FORECASTING SYSTEM
Need for a network modeling tool
• Modeling information
• Deterioration rates
• Historic cost data
Network impacts of work activities
Assess current business practices

BCFS PROVIDES
A NEW APPROACH
Address all structures of critical concern
Develop long-term network goals
Emphasize preservation
Pro-actively manage deterioration
Develop comprehensive maintenance plan
Commitment to allocate necessary resources
Strengthen organizational commitment

BRIDGE PRESERVATION
EFFORTS INCLUDE:
Capital Scheduled Maintenance: Regularly scheduled activities that maintain serviceability
Capital Preventive Maintenance: Scheduled work activities that restore element integrity
Rehabilitation: Programmed work activities that improve element integrity
Replacement: Replace various elements

BRIDGE CONDITION
776
1753
669
413
666
302
Freeway Non-Freeway0
500
1000
1500
2000
Good
Fair
Poor

CALL FOR PROJECTS
Heart of our asset management process!
Project lists developed based on identified
investment strategies
Fiscally-constrained

5-YEAR ROAD & BRIDGE
PROGRAM
Identifies current investment
strategies
Specific list of road and bridge
projects
Rolling 5-year period

PROGRAM TARGETS
PERCENT RATED “GOOD”
HIGHWAYS:
• 95% of trunk line freeways
• 85% of trunk line non-freeways
BRIDGES:
• 95% of trunk line freeway bridges
• 85% of trunk line non-freeway bridges

BENEFITS OF STRATEGY
Systematic approach to network
Pro-actively manages deterioration rates
Commitment to do the right work at the
right time
Ability to meet established network goals
Integrating regional strategies

EMERGING ISSUES

EMERGING ISSUES
GASB Statement 34
Safety & Security
Reauthorization of Federal
Program
Role of Technology in Managing
Transportation Systems

GOVERNMENT ACCOUNTING
STANDARDS BOARDSTATEMENT 34
Recommends that infrastructure
investments be included in typical
government financial reports
Depreciate infrastructure assets
Having an asset management process will
allow you to use a “modified” approach

MODIFIED APPROACH
Manage the system using a “management” system
On-going, up-to-date inventory and condition assessment
Identification and use of performance measures
Assessing results of on-going maintenance and preservation activities

SAFETY & SECURITY
9-11 highlighted need for enhanced security
Michigan – Extensive border crossings with
Canada
• 3 Major Locations
• Bridges, Tunnels, Soo Locks
• Leading state in terms of trade and crossings

AREAS OF CONCERN
Make the border crossings safe without hampering the flow of trade
• Biometric identifiers – retinal scans
• Electronic systems
• Inspections on both sides
• Joint facilities
Movements of hazardous and nuclear wastes and possible sabotage

FEDERAL
RE-AUTHORIZATION
Continue the momentum we began with
ISTEA and carried on in TEA-21

ROLE OF TECHNOLOGY
Smart cars, smart roads
Aging population
Hybrid vehicles and impact on revenues
Fuel cell development
Taxing miles driven rather than fuel
consumed

CONCLUDING
OBSERVATIONS
A way of strategically managing our system
in a cost-effective, efficient manner
Investing rather than simply spending
Managing pavements
It’s using data and technology in a proactive
rather than reactive way
It is a sensible way of conducting business

IT’S THE WAY
WE DO
BUSINESS