
Lost Values Predatory Lending in Philadelphia
102
LOST VALUES A Study of Predatory Lending in Philadelphia Ira J. Goldstein
Transcript of Lost Values Predatory Lending in Philadelphia

Lost VaLuesA Study of Predatory Lending in Philadelphia
Ira J. Goldstein

about tRF
the Reinvestment Fund (tRF) is an innovator in capitalizing distressed communities and stimulating economic growth for low- and moderate-income families. tRF identifies the point of impact where capital can deliver its greatest financial and social influence. tRF’s investments in homes, schools and businesses reclaim and transform neighborhoods, driving economic growth and improving lives throughout the Mid-atlantic region. since its inception in 1985, tRF has made more than $530 million in community investments.
tRF has also received national recognition for its research and housing-related policy analysis. tRF’s data analysis focuses both on helping tRF identify opportunities to invest its own resources as well as providing services to public sector and private clients seeking assistance with their own strategies to preserve and rebuild vulnerable communities. tRF has quickly emerged as a highly regarded source of unbiased information for public officials and private investors. tRF’s Policy Group, led by Ira Goldstein, has conducted extensive analyses of predatory lending and foreclosures throughout the Mid-atlantic region, under contract to the Pennsylvania and Delaware state Departments of Banking and the Federal Reserve Bank of Philadelphia, and has provided litigation support for law enforcement entities including the Pa Human Relations Commission and the us attorney for the eastern District of Pennsylvania.

Lost VaLuesA Study of Predatory Lending in Philadelphia
Ira J. Goldstein

Acknowledgements
This study of predatory lending has taken several years to complete and is truly the product of many thoughtful people. We first acknowledge the Ford Foundation and our Program Officer George McCarthy for the intellectual and financial support he has given to this effort. Additionally, there are many others whose efforts are gratefully acknowledged:
Review and CommentJeremy Nowak, TRFMaggie McCullough, TRF Irv Ackelsberg, Langer and Grogan, P.C.Michael Blume, U.S. Attorney for Eastern District of Pennsylvania Margaret Berger Bradley, TRFDeb Cooper, Consumer Credit Counseling Service of Delaware ValleyMike Crist, TRFPatricia Hasson, Consumer Credit Counseling Service of Delaware Valley
Don Hinkle-Brown, TRF
All of our interviewees, too many to name individually, but especially, Veronica Harding who
helped us understand the deeply personal impact of predatory lending
Data Collection and ResearchDan Urevick-Ackelsberg, University of Pennsylvania Law SchoolRebekah Cook-Mack, New York University School of Law
Morgan Heyward
Graphics and EditorialJanet Benton, Benton Editorial Greg Condon, Greg Condon Design
Al Parker, TRF
Page ii • Lost VaLues: a study of Predatory Lending in Philadelphia
Contents
Acknowledgements II
Executive Summary V
Introduction 1
A Study of Philadelphia: Finding the Facts 2
What is Predatory Lending? 5
Understanding Prime and Subprime Mortgages 5
Understanding Predatory Lending 7
Why Do Predatory Lenders Succeed? 19
The Broker’s Role 21
Problems in the Broader Market 23
Methodology 25
Some Indicators of Predatory Lending in Philadelphia 29
Overvaluation 30
Equity Loss 30
Rapidly Refinancing in Increasing Amounts 31
Summary of Indicators of Predatory Lending in Philadelphia 31
Philadelphia’s Neighborhoods: A Closer Look at Indicators of Predatory Lending 33
Foreclosures and Predatory Lending: The Nexus 53
Distribution of Foreclosures 57
Market Corrections 61
Conclusions: Salient Findings and the Policy Shifts they Suggest 65
Appendix A: Home Mortgage Disclosure Act Analysis, Philadelphia, 2002 71
Appendix B: Who Gets What Kind of Loan in a Mortgage Refinance? 73
Appendix C: Extent of Government Sponsored Enterprise (GSE) Benefit in Lower-Income Communities 75 Endnotes 77
References 85
Page iii • Lost VaLues: a study of Predatory Lending in Philadelphia
co
nt
en
ts

Page iv • Lost VaLues: a study of Predatory Lending in Philadelphia

Executive Summary
In the middle-1990’s, complaints about a new form of abusive mortgage lending, predatory lending, began to surface. Housing counselors, state and federal regula-tory agencies, consumer rights lawyers and others began to observe people whose needs for small amounts of money were expanded into large first mortgages on their homes. The transactions they received were complex. The terms were both misrepre-sented and hidden, and, in the final analysis, it was difficult to determine how the bor-rower may have benefited from the transaction.
Systematic and objective documentation of the phenomena was difficult to find. Individual cases were documented, but no comprehensive objective study of the problem was to be found. Some consumer activists called predatory lending an epi-demic and some mortgage industry representatives called it little more than a series of unfortunate anecdotes.
Given the general deficit of systematic knowledge and the obviously important public policy ramifications of this growing phenomena, The Reinvestment Fund sought and was granted funds by the Ford Foundation to answer three basic questions, using Philadelphia, Pennsylvania as its case study:
• Can predatory lending be systematically estimated on a large-scale
(citywide) basis?
• If so, how much predatory lending exists in the city of Philadelphia?
• When people lose their homes, how often does predatory lending
play a role?
Briefly, the answers to these questions are:
• Predatory lending can be operationally defined and estimated on a
citywide basis
• Conservatively, 3.1 percent of owner occupied homes in Philadelphia
manifest a financing pattern suggestive of the fact that they were touched by
predatory lending;
Page v • Lost VaLues: a study of Predatory Lending in Philadelphia
ex
ec
ut
iVe
su
mm
ar
y

• Where the home’s equity has been
put in play (i.e., the equity has been
accessed three or more times by the
current property owner), the percent-
age of homes whose financing history
indicates predatory lending rises to
14.1 percent;
• Homes subject to mortgage foreclo-
sure are considerably more likely than
a random sample of properties to
exhibit financing patterns consis-
tent with prior predatory lending.
Compared to the random sample of
Philadelphia properties, properties
in foreclosure are more than twice
as likely to show financing patterns
indicative of predatory lending (4.6
percent versus 2.1 percent). Where
the home’s equity was accessed fre-
quently by the owner, the percent-
age showing indicators of predatory
lending among foreclosure properties
rises to 18.2 percent compared to 8.2
percent for the random sample.
The process TRF employed to answer these questions involved the collec-tion and systematic analysis of more than 15,500 properties in the city of Philadelphia and interviews with a broad range of subject matter experts. Complete mortgage and sale histories were gathered for these properties and a set of indicators of predatory lending were designed and computed. Those indicators include: (1) rapid refinancing;
(2) existence of a loan that exceeds the likely value of the property; (3) wrap-ping up of small loans into large (post-1993) subprime first-position loans. Additionally, we conducted interviews with subject matter experts ranging from borrowers to brokers, lenders to secu-ritizers, appraisers to title agents, and attorneys to housing counselors, all in an effort to properly understand what to measure and to gain an objective context within which to interpret our results. TRF also collected mortgage foreclosure filings for 2000 through 2003 and ana-lyzed these filings against the predatory lending indicia in an effort to determine how often those in foreclosure had a history of transactions consistent with our working definition of predatory lending.
While we believe that each of the afore-mentioned indicators on its own is a reasonable marker of predatory lending, we are also keenly aware that there are reasonable (and non-predatory) circum-stances around which any of these phe-nomena could exist for a given home-owner. Our logic, however, is that we are on much firmer ground (i.e., conservative in our estimates) if we rely upon those in-stances where more than one indicator is present for a given property.
Our qualitative and quantitative research findings brought us to a series of recom-mendations which conclude this report. Many of these have been highlighted in other work and are already in the
Page vi • Lost VaLues: a study of Predatory Lending in Philadelphia

forum of public debate. We wish par-ticularly to highlight the following two recommendations:
We recommend the adoption of a suit-ability standard for professionals who sell mortgages. Professionals who sell securities, frequently of far less value than the mortgage sold by a loan officer or broker, operate under a standard of conduct that mandates the sale of the security to be consistent with the cus-tomer’s financial and tax status as well as their particular objectives. The parallels between the sale of a mortgage and a security are clear. Why does the cus-tomer need a mortgage? What kind of mortgage best fits her overall financial circumstance? Does the customer have the requisite experience so that the loan officer/broker can reasonably conclude that they understand the transaction they are about to enter into. Product recom-mendations based on answers to these questions are likely to be more suitable to the customer. This standard is not so onerous that millions of shares of stock cannot be traded every day by brokers on behalf of thousands of individual in-vestors. It is our sincere hope that this research can inform the public debate around the development of appropri-ate policy, legislation and regulation designed to curb predatory lending and keep credit reasonably flowing through-out our communities.
We also recommend changes to current record-keeping practices to add market transparency for the lending process. This study took a very long time to complete and required considerable human and financial re-sources, in part because the information needed to answer the very basic ques-tions we sought to answer really does not exist in any easily accessible loca-tion. This study presents indicators of potential predatory lending which could be useful filters for others who examine lending practices as financial regulators and local, state, and federal law enforce-ment agencies must. Those required to routinely monitor and examine lending practices would rarely have the resourc-es to devote to researching a particular locality that we had for this analysis. We therefore make recommendations about changes to current record-keeping and distribution practices that will enhance the ability of those responsible parties to do their jobs.
ex
ec
ut
iVe
su
mm
ar
y
Page vii • Lost VaLues: a study of Predatory Lending in Philadelphia

Page viii • Lost VaLues: a study of Predatory Lending in Philadelphia

Introduction
The policy of making the American Dream – homeownership - more accessible to lower-income Americans is by no means a partisan one. The Republican platform of 2004 included the claims that access to homeownership increased over the first four years of George Bush’s presidency and that for the first time in American history, more than half of minorities were homeowners.1,2 Former President Clinton also placed a high value on homeownership and took numerous steps to increase it (Lehman, 1995), and the same policy was codified in the 2004 Democratic platform.3 Why are policymakers enamored with helping lower-income people purchase homes? One reason is that homeownership is the principal way to acquire equity for most Americans.4
This study of predatory lending in Philadelphia was carried out by The Reinvestment Fund (TRF) to yield a richer and more detailed understanding of a set of practices that, at a minimum, reduces the financial worth of the sole or primary asset typically available to lower- and moderate-income people than is oftentimes portrayed in studies of this phenomenon. Data from the U.S. Census show that in Philadelphia, where the home-ownership rate was 59.3 percent in 2000, an estimated 39.7 percent of the households with incomes below 80 percent of the average had no other asset than their home; 48 percent had neither assets5 nor a home (i.e., they are not occupants of a home they own with or without a mortgage). By comparison, among those at the highest income level (i.e., over three times the average), the figures are 34 percent with nothing but a home and 11 percent with neither assets nor home. When predatory lending results in the loss of someone’s home, that 39.7 percent with only a home (and no assets) shrinks and the 48.3 percent that have neither asset nor home expands. When the home is not lost to predatory lending, which is the more common situation at the lowest income levels, predatory-lending practices still diminish the value of that primary asset to the homeowner. An understanding of predatory lending is crucial not only because of the legal and ethical challenges it presents, but also because it undermines the long-held, commonly accepted belief among Americans that economic and social progress is fa-cilitated through homeownership.
1. In
tr
od
uc
tIo
n
Page � • Lost VaLues: A Study of Predatory Lending in Philadelphia

Homeownership in the United States is still related to race and income with higher-income people more likely to own homes than lower-income people and White (non-Hispanic) people more likely to own homes than non-Whites and people of Hispanic origin. Nevertheless, the American Housing Survey data does reveal that the differences between high and low income as well as between White and minority homeownership rates have lessened somewhat.
The racial homeownership divide remains but did decrease between 1993 and 2005. The rate of homeownership among Blacks rose from 43.0 percent in 1993 to 48.1 percent in 2005 (an 11.9 percent increase), and the raw number of Black owner-occupied households rose from 4.79 to 6.47 million between 1993 and 2005 (a 35.13 percent increase). For Whites, the homeownership rate rose from 70.4 to 72.7 percent (a 3.3 percent rise) over the same period, while the number of White homeowners rose from 54.9 million in 1993 to 65 million in 2005 (an 18.4 percent increase).
A Study of PhilAdelPhiA: finding the fActS
This study is quite different than the ex-isting literature on predatory lending, which focuses on rates of subprime lending to various demographic sub-groups.6 Our findings and conclusions derive from a set of interviews conducted
with participants in every sector of the lending process – from the borrower to the securitizer and everyone in between – and also rest upon a unique and sys-tematic quantitative analysis of 15,500 Philadelphia properties and their respec-tive sale and mortgage histories. The methodology created by TRF enables us to estimate the frequency of specific in-dicators of predatory lending using pub-licly available data. This detailed informa-tion is a valuable resource that allows us to answer three fundamental questions:
• Can the extent of predatory lending be systematically estimated on a large-scale (citywide) basis?
• If so, how much predatory lending exists in the city of Philadelphia?
• When people lose their homes, how often does predatory lending play a role?
Philadelphia’s Past and Present
As Philadelphia has served as the focus of our work, let us consider a brief de-mographic and economic description of the city.
• Philadelphia reached its peak in population in 1950, when its residents numbered over 2.1 million. Since then, the city has experienced a steady and substantial decline in population; its current total popula-tion is under 1.5 million. Were it not for natural increases in population and a small increase due to international migration between 1990 and 2004,
Page � • Lost VaLues: A Study of Predatory Lending in Philadelphia

domestic migration would have reduced the population by an another 354,000 people over the past fifteen years.7 Yet the story of Philadelphia’s population is not uniformly bleak. Over the last several years, certain areas of Philadelphia have experi-enced stability or even growth in population and households.
• Housing stock serves as another indi-cator of a city’s health. Philadelphia’s housing stock, built largely prior to its peak population period,8 has been abandoned and/or devalued in many areas. Average residential property values and rents between 1990 and 2000 fell by 5.9 percent and 6.1 percent citywide in constant dollar terms. During the 1990s, Philadelphia demolished more than a thousand buildings a year, but even at this rate it could not keep pace with its aban-donment problem. Between 2000 and 2005 though, building permits were issued for the creation of 9,783 units, 55% of which were in 2004 and 2005. These are extraordinary numbers in light of Philadelphia’s recent history of few new units added annually.
• Since the late 1990s, several parts of Philadelphia’s housing market have shown remarkable strength. For example, Center City Philadelphia has added an estimated 6,436 units since 1998, most through conversion from other uses.9 Across the city, home sale prices rose 20 percent between 1997 and 2002. Also during that time, in addition to the well-publicized increase in the prosperity
of the Center City area, several other neighborhoods were especially robust (includ Perrcent of Properties With Indications OfPredatory Lending For Selected Areas ing University City, portions of South Philadelphia and Northern Liberties).10
• Once the center of manufacturing pro-duction for the region, Philadelphia’s role as a central economic force has changed. After a huge decline in manufacturing, Philadelphia has evolved into the region’s leader in education and health services, as well as in the information/business/profes-sional and financial services sectors. Today, Philadelphia’s largest employ-ers (aside from the government sector) are the University of Pennsylvania and the University of Pennsylvania Health System, Jefferson Health System, Temple University and the Temple University Health System and Tenet Health Systems (Philadelphia City Planning Commission, 2005). In fact, the area known as Center City Philadelphia can still boast that it is home to the largest concentration of jobs in the metropolitan area (Center City District, et al., 2005).
• The African American and Latino populations of Philadelphia have grown over the last century. Today, African Americans constitute approxi-mately 44 percent of all Philadelphians, and Latinos constitute 10 percent. Yet Philadelphia remains a highly segregated city. Philadelphia’s Index of Dissimilarity (D) score, one of the more widely used measures of segregation,
1. In
tr
od
uc
tIo
n
Page � • Lost VaLues: A Study of Predatory Lending in Philadelphia

is 76.4 for African Americans. With a range of 0 to 100 where a D value of 0 represents perfect integration and 100 total segregation, a value of 76.4 represents substantial racial segregation. The Philadelphia region, although showing some small signs of improvement, remains the twelfth most segregated large region in the country with a D value of 72.0 (U.S. Department of Commerce, 2002).11
• Philadelphia’s banking community, a source of capital to purchase and renovate homes, has invested more heavily in certain ethnic and economic communities throughout the city’s history, leaving other communities to rely upon smaller banking institu-tions and other outlets when seeking housing capital (c.f., Adams, et al., 1991). Patterns of lending that skipped over areas of minority concentration many decades ago continue to effect racial settlement patterns (Bartelt, 1984; Goldstein, 1985). Were it not for several significant Community Reinvestment Act settlements and special programs like the Philadelphia Mortgage Plan and its successor, the Delaware Valley Mortgage Plan, many of Philadelphia’s lower-income and minority communities would have been without reasonable access to the city’s mainstream financial institutions. Today, this pattern has improved and credit is more readily available throughout the city. Many point to this historic pattern of discriminatory lending as having given rise to an environment that fosters today’s predatory lending.
Page � • Lost VaLues: A Study of Predatory Lending in Philadelphia

What is Predatory Lending?
The exact boundaries of the definition of predatory lending are elusive, and while some dispute the extent of predatory lending, there is wide agreement that the prac-tices often identified with it are most often observed in the subprime market. As Carr and Kolluri (2001) plainly state, “Predatory lending is a subset of subprime lending.” Inasmuch as most efforts to define predatory lending start with the term subprime lending, let us begin by defining prime and subprime lending.
underStAnding Prime And SubPrime mortgAgeS
In general terms, the mortgage market in the United States can be split into the prime and subprime markets. The prime mortgage market usually serves individuals whose credit history, collateral quality and income are sufficient to support the mortgage they seek, either for the purchase or the improvement of a home or for the refinance of an existing mortgage. The criteria for determining who is eligible for a prime-market mortgage may vary slightly from institution to institution, largely depending upon which secondary-market purchaser will end up with the loan, but typical prime lending thresholds are as follows:
• FICO® scores of 620 to 660 and above;12
• Loans with acceptable loan-to-value ratios (i.e., the loan amount is no more than approximately 95 percent of the value of the home);13
• Borrowers with collateral property that meets critical appraisal standards; • Borrowers with complete and verifiable documentation of income, savings,
down payment sources and/or employment; and• Borrowers with housing and other debt that is less than 45 percent of
monthly gross income.
A borrower approved for a prime-market mortgage will benefit from a mortgage with a rate and fees that are normally lower than their subprime counterparts. In contrast, when a risk assessment reveals that a potential borrower is more likely to subject the
Page � • Lost VaLues: A Study of Predatory Lending in Philadelphia
2. W
ha
t Is
Pr
ed
at
or
y L
en
dIn
g?

lender to late payments, default and/or foreclosure (Danis, et al., 2005) or when the borrower has not been sold a product that is appropriate to their credit worthiness, that borrower will most likely be considered eligible only for a sub-prime mortgage.
Subprime borrowers generally have the following characteristics:
• FICO® scores below 620 to 660;
• High loan-to-value ratios (i.e., the loan amount is more than 95 percent of the value of the home);14
• Collateral property that fails to meet one or more critical appraisal standards (e.g., detrimental conditions that adversely affect a property’s marketability, such as hazardous conditions);
• Incomplete or unverifiable docu-mentation of income, savings, down payment sources and/or employment; and
• Housing and other debt that exceeds 45 percent of monthly gross income.
Because the risk of a transaction affects the cost a lender charges the customer to borrow funds, prime borrowers tend to pay less than subprime borrowers.15 The price differences may in fact be ex-cessive; research suggests that many subprime borrowers could have quali-fied for prime loans and that the cost difference between the two loan prod-ucts exceeds the increased risk profile.16
Justified or not, the cost difference to the borrower can be substantial.
The subprime market has grown remark-ably in the second half of the 1990s and beyond. Subprime mortgages totaled $35 billion in 1994; that total rose to more than $140 billion by 2000, to $332 billion by 2003 (Gramlich, 2004) and to $625 billion by 2005 (Simon and Hagerty, 2006).
On the local level, figures may differ. In the city of Philadelphia in 1999, 14.3 percent of all originated purchase money mortgages recorded in the HMDA dataset were subprime and 41.5 percent of all originated mortgage refinances were subprime; those percents were 12.3 percent and 18.3 percent respectively in the 2002 dataset.17,18 And while the sub-
cost dIfferences BetWeen PrIme and suBPrIme Loans
For the Commonwealth of Pennsylvania, FICO® reports that the typical thirty-year, fixed-rate mortgage in December 2002 (during the time period of the study) carried a 5.94 percent inter-est rate if the borrower’s FICO® score exceeded 720; a borrower with a FICO® score of between 500 and 600 typically paid approximately 8.76 percent. The difference in monthly payment on a $100,000 mortgage between these two typical borrowers was more than $190; over the life of the loan, it amounts to just under $69,000. Inter-est-rate differentials between these two typical borrowers for home equity and auto loans were even greater (www.myfico.com).
Page � • Lost VaLues: A Study of Predatory Lending in Philadelphia

prime share of mortgages was consider-ably lower in 2002, this was largely due to a substantial increase in prime refi-nancing following a period of aggressive interest rate cuts by the Federal Reserve.
underStAnding PredAtory lending
Within the subprime market, loans char-acterized as predatory have the follow-ing characteristics:19 they are advertised via target marketing which is market-ing based on a characteristic unrelated to credit worthiness, such as race; they include unreasonable or unjustifiable loan terms; and they often involve out-right fraud. Engels and McCoy describe predatory lending as a “syndrome” that involves one or more of the following: a loan structure that results in serious and disproportionate net harm to borrow-ers, “harmful rent seeking,”20 fraud or deception, a lack of transparency in the terms that does not necessarily rise to the level of fraud and a requirement that borrowers waive their rights to redress through, for example, mandatory arbitra-tion clauses.
TRF used these defining characteristics to characterize predatory lending in our study. Their accuracy was further bol-stered in interviews with experts whose definitions helped form ours. In the end, we used a definition of predatory lending that gives it three sets of defining char-acteristics: the terms and consequences
of the loan; the way individuals got their loan; and the imbalance of information, experience and thus power between borrower and lender/intermediary (e.g., broker) inherent in the transaction. By judging loans in terms of these charac-teristics, we are able to make a meaning-ful distinction between predatory and nonpredatory loans. TRF’s quantitative analysis contributes to an understand-ing of the first and second features of the definition while interview results illustrate the third.
Terms and Consequences
As most who have studied predatory lending have noted, predatory loans generally carry interest rates and fees that cannot be justified by the credit characteristics of the borrower or her col-lateral.21 Fees that have no reasonable justification get packed into these trans-actions and drive up the level of indebt-edness unnecessarily, stripping equity and enhancing the riskiness of the trans-action to both the borrower and lender over and above that risk which would have otherwise been presented by the borrower. The HUD-1 Settlement sheet that follows, (Figure 2.1) obtained from a housing counseling agency that was as-sisting a local homeowner, reveals a loan transaction in which the terms and other circumstances around the loan manifest several of the characteristics considered predatory in various definitions.
Page � • Lost VaLues: A Study of Predatory Lending in Philadelphia
2. W
ha
t Is
Pr
ed
at
or
y L
en
dIn
g?

Loan Features:
• Mandatory Arbitration• Inflatedappraisal• Excessive debt:income• Prepaymentpenalty• Rateincreased;pay-
ment increased over previousloan
Some of the Borrower’s Disbursements:
Chase Mortgage $49,518.15Fingerhut $1,480Montgomery Ward $170AmericanAppliance$282HomeDepot$1,068CreditLife$2,458CreditDisability$1,928
7.25percent “Discount Points” ($4,642)
��Figure�2.1�HUD-1�Settlement�Sheet
Page � • Lost VaLues: A Study of Predatory Lending in Philadelphia

Figure�2.2�Secondary�Mortgage�Loan�Revolving�Loan�Fixed�Rate�Agreement
Notice several things about this transaction: (1) the 7.25 discount points do not appear to discount the interest rate on the loan; (2) there is almost $5,000 in charges for credit life and disability insurance; (3) the interest rate and monthly payment on this loan were both greater than the loan it replaces. These features, taken together with a second loan with a higher interest rate and additional fees to pay the fees on the first loan should raise serious questions about whether the loan(s) carried any advantage at all to the borrower.
Page � • Lost VaLues: A Study of Predatory Lending in Philadelphia
2. W
ha
t Is
Pr
ed
at
or
y L
en
dIn
g?

A second set of documents (Figure�2.3,�
2.4)�reveals that this borrower was prob-ably a victim of predatory lending in past transactions as well as in the one detailed here. As the loan document shows, this borrower took out a $70,000 refinance loan that included a $2,500 broker fee, a $1,400 origination fee and a $4,700 fee for single premium credit life insurance. Among the liens rolled into the mortgage is a HEMAP loan from the Pennsylvania Housing Finance Agency (PHFA), an action that makes little eco-nomic sense, given the favorable terms and conditions of HEMAP loans.
This borrower’s loan history suggests a pattern of the type of lending that causes
a loss of home equity. The borrower took out a series of small loans, refinanced frequently and eventually rolled those loans into a mortgage of $46,000. This larger loan, along with the PHFA HEMAP loan, was then refinanced into the loan discussed above. Finally, the above loan was refinanced by the same mortgage company just seven months later.
This borrower like the first, ended up with a loan that culminated in the sig-nificant loss of equity in their home as a result of fees and products (credit life and disability insurance) that are of ques-tionable value to the borrower. In the case of the second example, the borrow-er replaced continued page 14
What Is the homeoWner’s emergency mortgage assIstance Program (hemaP)?
HEMAP was created in 1983 by Act 91 of the Pennsylvania Legislature. When HEMAP was enacted, Pennsylvania was experiencing very high unemployment rates statewide; the rates at that time generally exceeded 12 percent. Unemployment rates of that level had not been experienced for decades and have not been equaled to date.The act’s underlying principle is that families should not lose their homes to foreclosure if the payment delinquency is through no fault of their own. Situations that the State will consider beyond the control of the individual include the loss of a job due to layoff or a plant closing, divorce, separation, or a serious medical problem. To be approved, not only does there need to be an eligible reason, but the State also needs to be shown that the homeowner has a reasonable prospect of being able to resume payments in the near future. HEMAP is funded by the Commonwealth of Pennsylvania and is administered by the Pennsylvania Housing Finance Agency (PHFA). Specifically excluded from eligibility for HEMAP assistance are FHA/VA insured mortgages.Applications to the HEMAP program must be made through a PHFA approved housing counseling agency. Usually, HEMAP will keep the homeowner’s mortgage current for a period during which the homeowner will make minimum payments to HEMAP and full payments on their existing mortgage. Some homeowners, given their unique circumstance, may be eligible for continuing assistance. In either instance, the maxi-mum eligibility is currently $60,000 and 24 months, and the homeowner must make a minimum monthly payment of $25. At the conclusion of the 24 month period of assistance, the homeowner will be responsible for establishing a schedule to repay HEMAP in full. (For more information on HEMAP, see http://www.phfa.org/consumers/homeowners/hemap.aspx)
Page �0 • Lost VaLues: A Study of Predatory Lending in Philadelphia

Figure�2.3�HUD-1�Settlement�Sheet
Page �� • Lost VaLues: A Study of Predatory Lending in Philadelphia
2. W
ha
t Is
Pr
ed
at
or
y L
en
dIn
g?

Figure�2.4�Mortgage�and�Sale�History�of�Collateral�Property�in�Figure�2.3
Page �� • Lost VaLues: A Study of Predatory Lending in Philadelphia

Figure�2.4�continued
Page �� • Lost VaLues: A Study of Predatory Lending in Philadelphia
2. W
ha
t Is
Pr
ed
at
or
y L
en
dIn
g?

a loan provided by the Commonwealth of Pennsylvania designed to assist bor-rowers in financial difficulty. On its face, this is problematic.
How Borrowers End Up with Predatory Loans
Through interviews conducted by TRF and literature on the topic (cf., US. GAO, 2004), it appears that victims of preda-tory lending were not looking for a loan but were subject to a loan solicitation. Target marketing is a generally accepted practice among mainstream businesses. Its underlying rationale is that aiming sales efforts directly at consumers who are most likely to want or need a product increases the efficiency of those efforts. This is qualitatively different than the sort of targeted marketing done by those seeking to make predatory loans.22
But how is it different? First, the pur-chase of typical consumer goods (articles of clothing, personal electronics, and so on) does not typically threaten the finan-cial capacity of the consumer. Generally speaking, these purchases use only a small portion of the purchaser’s assets and are at least fairly well suited to the purchaser. As a matter of public policy, we operate under the principle that it is not acceptable to target market a partic-ular consumer group when the products being marketed are not suitable for that group (e.g., to market cigarettes in ways that are attractive to children) or to
attempt to exploit a vulnerability.23 While such marketing practices can still be found, our public policy provides tools for fighting it.
In the securities industry, a concept known as suitability dictates that the in-vestment vehicle a broker/advisor seeks to sell must be consistent with the knowl-edge, age, experience and risk tolerance of the customer.24 In residential mort-gage lending, there is no such suitability standard. As a result, borrowers can be targeted for, and presented with, loan options that are unsuitable and even dis-advantageous to them.
The absence of a suitability standard in the home-mortgage market makes virtu-ally all borrowers into potential targets of predatory lending. In addition, the methods used by would-be predatory lenders to find customers can lead them to consumers who could be particularly vulnerable to their tactics. Interviews with lenders and mortgage brokers reveal some of the ways in which they find po-tential customers. One broker reported going to a website that allows a broker to enter any desired characteristic(s), from age, sex and income to the likelihood of homeownership or living alone and then obtain listings for pennies a name. When the broker searches for character-istics that he knows can make a home-owner especially vulnerable to predatory lending, this tactic becomes egregious.
Page �� • Lost VaLues: A Study of Predatory Lending in Philadelphia

Another broker reported searching the public records for people who held mort-gages with a previously active finance company. Because the broker knew that this company engaged in lending to people who did not have ready access to more mainstream lending (either because of poor credit, low income or because they resided in the city’s minority com-munities), he reasoned that anyone who had a loan with this company could easily be talked into a loan with a similar entity. Other brokers reported working from leads provided by lenders who provide the subprime loans that the brokers offer.
Not all questionable marketing is done by brokers. Housing counselors report that one prominent subprime lender mails checks to a variety of people (many of whom are already delinquent). The literature accompanying the “live check” tells the recipient that the check, which is in effect a home-equity loan, can be immediately deposited in his or her bank account; in the case of delinquent bor-rowers, the live check can be used to bring the mortgage current. If a recipi-ent deposits the check, the same mort-gage company contacts the borrower, and says that his or her new home-equity line carries a very high interest rate, and attempts to sell the borrower a full mort-gage refinance, with the home-equity loan folded in.
When subprime mortgage loans are targeted to a distinct spatial area, their
long-term consequences can be seen not only in the lives of individuals, but also in entire neighborhoods. Equicredit, known as one of Philadelphia’s biggest sub-prime lenders, has been sued for target-ing minorities, among other things, and when one examines the company’s list of foreclosures from 2000 to 2003, one can see that areas of the city with high numbers of minorities were the most se-riously affected (see figure 2.5).
Individual brokers can also play a signifi-cant role in impoverishing enough bor-rowers to affect their entire geographic area, and some get caught; a broker found to have violated the Pennsylvania Human Relations Act was fined $900,000 for targeting African Americans for high-cost loans.25
The Imbalance of Information and Experience
A review of the loan documents for loans considered predatory, along with interviews conducted with attorneys who represent borrowers, suggests that many transactions between borrowers and subprime mortgage brokers and lenders make no economic sense. It is easy to wonder how borrowers could fall into such terrible traps. Yet if the borrowers had access to full, complete and accu-rate information, they would never have entered into the transactions. Interviews with borrowers, lenders, attorneys repre-senting both lenders and borrowers and
Page �� • Lost VaLues: A Study of Predatory Lending in Philadelphia
2. W
ha
t Is
Pr
ed
at
or
y L
en
dIn
g?

Figure�2.5�Racial�Compostition�of�Areas�with�Equicredit�Loans�in�Foreclosure,�2000-2003
settlement agents reveal that a lack of in-formation is a crucial aspect of the trans-actions. Interviewees frequently noted that, when settlement is made on a predatory loan, the borrower is the least experienced, least informed and most at risk in the transaction. Borrowers report that their loan settlements occurred at their kitchen tables and took little more than a few minutes. And settlement
agents will readily admit that borrowers, although signing numerous documents, generally have no idea at all what they are getting into.
When borrowers – especially lower-income borrowers – do not read relevant documents or lack the capacity to un-derstand them, brokers and lenders can easily take advantage of them.
Page �� • Lost VaLues: A Study of Predatory Lending in Philadelphia

The borrower’s uninformed view of the mortgage market makes him or her a prime target.26,27
Several borrowers interviewed by TRF reported having no knowledge that the loan they obtained was secured by their home and that they could lose their home if they were unable to keep up with the loan payments. They also reported thinking that they have one loan when they have two. Borrowers say they believed, albeit incorrectly in Pennsylvania and many other states, that the broker they hired represented their best interests. In fact, brokers in the Commonwealth of Pennsylvania do not have a fiduciary obligation to their
customers. While some act as though they do, many do not. For borrowers who already have a wide-angle view of the credit markets, as many higher-income borrowers do, this may not present a serious problem. However, when the borrower’s view of the credit market is limited, the broker can arrange a trans-action that produces a sizeable return for his/her efforts and no real benefit (often real harm) for the borrower.28 One broker reported to TRF that he tries not to attend closings, specifically because he does not want anyone, particularly the borrower, to be able to question his fees.
A lack of knowledge or information about the transaction is not peculiar to
Figure�2.6
extract from fannie mae national housing Surveys, 2002 and 2003
Survey YearCorrectAnswer
AllAdults
AfricanAmericans
EnglishSpeakingHispanics
Spanish SpeakingHispanics
2003Housing lenders are required by law to give
you the best possible rates on loansFALSE 59% 36% 42% 25%
2003If you haven't always paid your bills on time orhave carried some debt, you won't qualify for
a mortgageFALSE 64% 49% 5% 29%
2003Average percentage of those having accurateinformation about the home-buying process
N/A 69% 6% 64% 44%
CorrectAnswer
AllAdults
AfricanAmericans
HispanicsHispanic
Immigrants
2002Housing lenders are required by law to give
you the best possible rates on loansFALSE 61% 49% 44% 36%
2002Neighborhood mortgage brokers will give you
a better deal than large banks and housinglenders
FALSE 61% 55% 47% 37%
Percentage Of Respondents Answering Correctly
Page �� • Lost VaLues: A Study of Predatory Lending in Philadelphia
2. W
ha
t Is
Pr
ed
at
or
y L
en
dIn
g?

Philadelphia. Fannie Mae’s 2002 and 2003 National Housing Surveys demon-strate that a substantial portion of the adult population does not have a complete and accurate picture of the mortgage and home-buying process. Figure 2.6, extracted from those surveys, shows that some very critical gaps in in-formation are not only generalized across the population, but exist acutely among minority adults.
The lack of knowledge is not evenly dis-tributed among potential borrowers. Evidence suggests that those borrow-ers who end up with some of the more expensive (and often complex) loan products are the least able to under-stand and appreciate the consequences of them. Lax, et al. (2004), for example, identify certain very critical differences between prime and subprime borrow-ers with respect to knowledge, experi-ence and mortgage-search behavior. In general, subprime borrowers were less knowledgeable, less well prepared and did substantially less searching for the best loans available. In fact, subprime borrowers were more likely to respond to telephone calls or other advertisements rather than to independently pursue a loan.
Finally, unlike in the prime mortgage market, subprime lenders generally operate under a veil of secrecy when it comes to the costs and rates of their mortgages, thus intentionally placing the
borrower at a disadvantage. White (2003) states, “[s]ubprime mortgage rates at the retail level are secret. No newspaper’s real estate section will list current sub-prime mortgage rates. The rate tables used by wholesale subprime lenders are made available only to brokers and are sometimes regarded as trade secrets” (p. 8). This statement is corroborated by our interviews. One subprime broker even reported, “Anything monetary is negotiable.”
In summary, then, TRF’s working defi-nition of a predatory loan takes into account the terms and consequences of a loan, the method by which the borrow-er comes to get the loan and the imbal-ance of information between seller and buyer. We have found that examining the nature of these conditions allows for a fair determination of whether or not a loan is predatory.
Page �� • Lost VaLues: A Study of Predatory Lending in Philadelphia
Why Do Predatory Lenders Succeed?
The processes and outcomes described in this research are more than just the consequence of a series of financial decisions. They affect individuals, families and communities in tangible ways. Purely economic logic may suggest that predatory transactions should never have taken place.29 But in the context of people’s needs, knowledge and experience their occurrence is understandable.
Interviews with both brokers and borrowers affirm a historically documented pattern of mortgage lending that disadvantages minority and lower-income individuals, as well as other residents living in minority and lower-priced areas. People generally agree that credit discrimination and redlining historically limited access to mortgages from mainstream vehicles leaving the finance companies as one of the main sources of mortgages and other related loans. And the terms for borrowing money from non-mainstream sources are different. Although finance companies, check cashers, and payday lenders do lend money in many communities avoided by mainstream lenders, they do so with high interest rates. One interviewee, the owner of a now-closed consumer discount company that was once active in the Philadelphia market, reported that his institution was more lenient in giving credit than the mainstream banks that refused to lend money in the communities in which his finance company operated. But no doubt the rates were not so forgiving.
With changes in the legal environment (Mansfield, 2000) and the concomitant evo-lution of the lending industry, the consumer discount and finance companies were largely replaced by the bigger subprime lenders who were willing to make loans in areas of more modest means.30 But their loans were in amounts far in excess of what people needed or wanted. People were often talked into paying off debts at terms that simply made no financial sense.
Lower-income people are more likely to suffer from a lack of savings and also often don’t have sufficient income to maintain their homes.31 One way for lower-income homeowners to make up the gap in savings has been to use their homes, in effect,
Page �� • Lost VaLues: A Study of Predatory Lending in Philadelphia
3. W
hy
do
Pr
ed
at
or
y L
en
de
rs
su
cc
ee
d?
as credit cards. A consequence of this practice is the creation of a “data arti-fact” that brokers and lenders may use to identify homeowners to solicit with various financial products. As noted pre-viously, some brokers target people with a history of borrowing from finance com-panies – which is more frequent among lower-income individuals – and proactive-ly solicit them for subprime debt-consoli-dation/refinance loans. Brokers and those who sell credit information report that credit scores help target those whose al-ternatives are likely to be limited.32
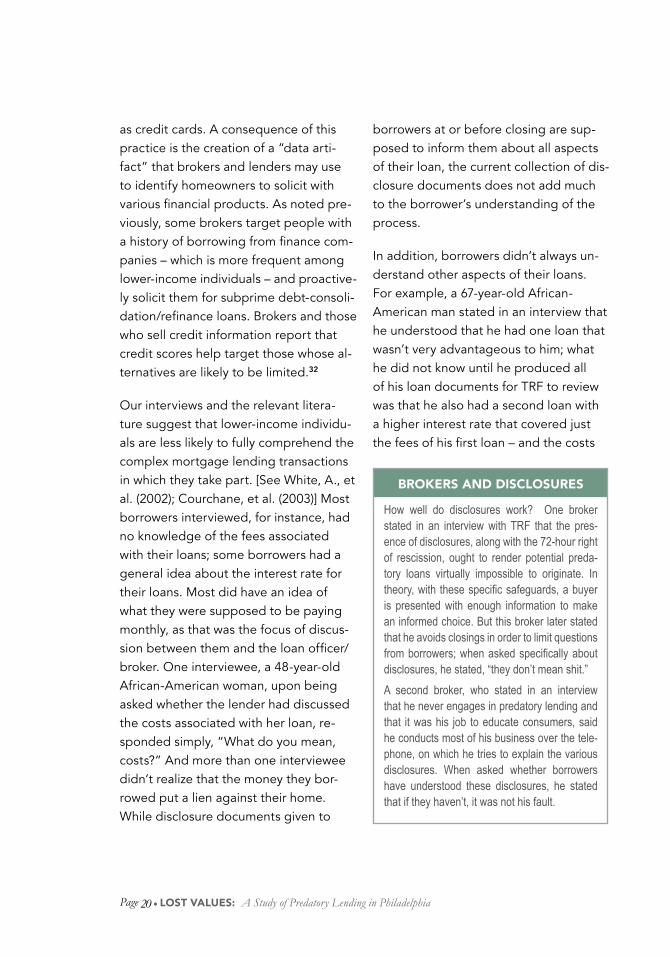
Our interviews and the relevant litera-ture suggest that lower-income individu-als are less likely to fully comprehend the complex mortgage lending transactions in which they take part. [See White, A., et al. (2002); Courchane, et al. (2003)] Most borrowers interviewed, for instance, had no knowledge of the fees associated with their loans; some borrowers had a general idea about the interest rate for their loans. Most did have an idea of what they were supposed to be paying monthly, as that was the focus of discus-sion between them and the loan officer/broker. One interviewee, a 48-year-old African-American woman, upon being asked whether the lender had discussed the costs associated with her loan, re-sponded simply, “What do you mean, costs?” And more than one interviewee didn’t realize that the money they bor-rowed put a lien against their home. While disclosure documents given to
borrowers at or before closing are sup-posed to inform them about all aspects of their loan, the current collection of dis-closure documents does not add much to the borrower’s understanding of the process.
In addition, borrowers didn’t always un-derstand other aspects of their loans. For example, a 67-year-old African-American man stated in an interview that he understood that he had one loan that wasn’t very advantageous to him; what he did not know until he produced all of his loan documents for TRF to review was that he also had a second loan with a higher interest rate that covered just the fees of his first loan – and the costs
Brokers and dIscLosures
How well do disclosures work? One broker stated in an interview with TRF that the pres-ence of disclosures, along with the 72-hour right of rescission, ought to render potential preda-tory loans virtually impossible to originate. In theory, with these specific safeguards, a buyer is presented with enough information to make an informed choice. But this broker later stated that he avoids closings in order to limit questions from borrowers; when asked specifically about disclosures, he stated, “they don’t mean shit.”A second broker, who stated in an interview that he never engages in predatory lending and that it was his job to educate consumers, said he conducts most of his business over the tele-phone, on which he tries to explain the various disclosures. When asked whether borrowers have understood these disclosures, he stated that if they haven’t, it was not his fault.
Page �0 • Lost VaLues: A Study of Predatory Lending in Philadelphia
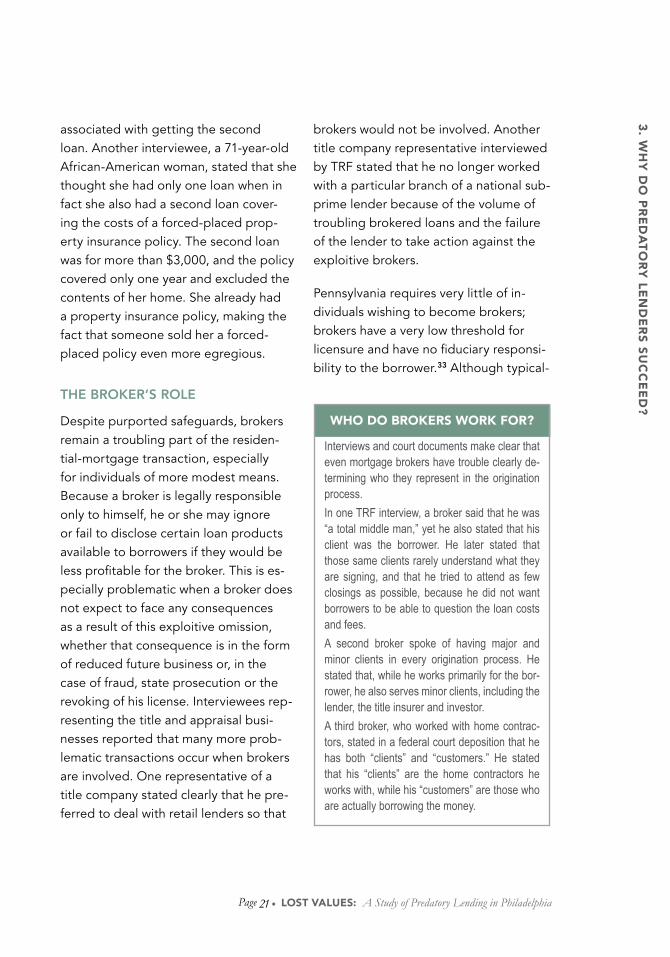
brokers would not be involved. Another title company representative interviewed by TRF stated that he no longer worked with a particular branch of a national sub-prime lender because of the volume of troubling brokered loans and the failure of the lender to take action against the exploitive brokers.
Pennsylvania requires very little of in-dividuals wishing to become brokers; brokers have a very low threshold for licensure and have no fiduciary responsi-bility to the borrower.33 Although typical-
associated with getting the second loan. Another interviewee, a 71-year-old African-American woman, stated that she thought she had only one loan when in fact she also had a second loan cover-ing the costs of a forced-placed prop-erty insurance policy. The second loan was for more than $3,000, and the policy covered only one year and excluded the contents of her home. She already had a property insurance policy, making the fact that someone sold her a forced-placed policy even more egregious.
the broker’S role
Despite purported safeguards, brokers remain a troubling part of the residen-tial-mortgage transaction, especially for individuals of more modest means. Because a broker is legally responsible only to himself, he or she may ignore or fail to disclose certain loan products available to borrowers if they would be less profitable for the broker. This is es-pecially problematic when a broker does not expect to face any consequences as a result of this exploitive omission, whether that consequence is in the form of reduced future business or, in the case of fraud, state prosecution or the revoking of his license. Interviewees rep-resenting the title and appraisal busi-nesses reported that many more prob-lematic transactions occur when brokers are involved. One representative of a title company stated clearly that he pre-ferred to deal with retail lenders so that
Who do Brokers Work for?
Interviews and court documents make clear that even mortgage brokers have trouble clearly de-termining who they represent in the origination process.In one TRF interview, a broker said that he was “a total middle man,” yet he also stated that his client was the borrower. He later stated that those same clients rarely understand what they are signing, and that he tried to attend as few closings as possible, because he did not want borrowers to be able to question the loan costs and fees.A second broker spoke of having major and minor clients in every origination process. He stated that, while he works primarily for the bor-rower, he also serves minor clients, including the lender, the title insurer and investor.A third broker, who worked with home contrac-tors, stated in a federal court deposition that he has both “clients” and “customers.” He stated that his “clients” are the home contractors he works with, while his “customers” are those who are actually borrowing the money.
Page �� • Lost VaLues: A Study of Predatory Lending in Philadelphia
3. W
hy
do
Pr
ed
at
or
y L
en
de
rs
su
cc
ee
d?

ly they view the borrower as a customer, brokers can arrange deals that benefit them more than they do the borrower. Brokers report a range of this sort of be-havior, with some stating that they do whatever is quickest and easiest.34 Other brokers do report shopping a borrow-er’s application around and finding the best deal. But section one of the NAMB Model Mortgage Loan Origination Agreement, executed between borrower and broker at the time they initiate their business relationship, states the actual relationship between borrower and broker:
“In connection with this mortgage loan
we are acting as an independent con-
tractor and not as your agent. We will
enter into separate independent con-
tractor agreements with various lenders.
While we seek to assist you in meeting
your financial needs, we do not distrib-
ute the products of all lenders or inves-
tors in the market and cannot guarantee
the lowest price or best terms available
in the market” (National Association of
Mortgage Brokers Model Disclosure
Form; Approved by the NAMB Board,
June 22, 1997).
For most borrowers, the legal distinction between “agent” and “independent con-tractor” is meaningless. They still believe that the broker is working for them.35
tItLe Insurers: WItnesses to Predatory LendIng
One title insurer stated in an interview with TRF that it is reasonably clear when predatory lending is occurring. He sees it occurring when the bor-rower lacks financial sophistication; in his words, these borrowers are “promised a dream.” While some borrowers may have a hunch that they are not getting the best deal, even those people may have no idea that they have the option to negoti-ate. Instead, they think they need to accept all of the loan officer’s conditions or that they will get nothing. Because they simply want things to work out – or believe that things will work out - they will sign their names to mortgages that do not make financial sense.As is the case with appraisers, there are disin-centives for title insurers to raise red flags when they see cases of predatory lending. As one title insurer stated, he is generally at a mortgage closing on behalf of the lender, not the borrower. Further, he noted, giving borrowers advice on the quality of loans would expose him to real risk, as he could be sued for giving legal advice when he has no standing to do so. As a result, he watches predatory loans being made, and he has no safe way to stop them or to help those at risk. Yet, while the title insurer can’t stop a particularly bad transaction that is already underway, he or she can have a broader effect. One title insurer, upon seeing many problematic cases from a specific lender, declined to accept business from that lender.
As P. McCoy (2004) notes, this imbalance of information is further exacerbated when loan agents are able to frame loan transactions in ways that steer borrow-
Page �� • Lost VaLues: A Study of Predatory Lending in Philadelphia

ers away from considering the adverse aspects of the transaction. As she notes, when borrowers are in a situation in which the actual features of the trans-action are not transparent (a situation typical of the subprime market), or when the borrower is inexperienced, brokers and lenders can focus on the potential “gains” of the loan, which makes people more willing to take risks, as opposed to being realistic about potential losses, which makes people more risk-averse. This phenomenon was echoed by a title company agent, who told us that, judging from what he sees at closings, borrowers are ready to believe that, not withstanding any misgivings they may have, “things will work out.”
ProblemS in the broAder mArket
Structural problems in the market proba-bly fuel predatory lending, as the market does not offer small loans at a cost similar to larger first liens. While reports vary by broker, brokers often report that actual costs per transaction are in excess of $1,000. Thus, individuals seeking smaller amounts of money are likely to have to pay a higher percentage in fees than individuals seeking larger amounts. Another possible outcome of the current situation, according to borrowers and others we interviewed, is that needs for small amounts of money are converted by the brokers into larger loans than the borrower requires.
Page �� • Lost VaLues: A Study of Predatory Lending in Philadelphia
3. W
hy
do
Pr
ed
at
or
y L
en
de
rs
su
cc
ee
d?

Figure�4.1��2,289�Randomly�Selected�Properties�in�Philadelphia
Page �� • Lost VaLues: A Study of Predatory Lending in Philadelphia

Methodology
To gather data for this study TRF used multiple methods, and searched several pub-licly available databases. TRF collected mortgage history information for a random sample of 2,289 properties in Philadelphia in order to comprehend characteristics of those loan transactions. We also gathered an additional set of property histories from more than 13,000 other properties in nine different Philadelphia census tracts. From our close examination of more than 15,000 property histories, TRF was able to characterize several indicators of predatory lending including rapid loan refinancing leaving the borrower with a larger balance due, overvaluation (i.e., loans exceeding the likely value of the home) and lending reflecting systematic extraction of equity from the home. Each of these three indicators reflects upon that aspect of our defini-tion that distinguishes the typical subprime loan from one that is predatory based on the terms and conditions of the loan.
Additionally, TRF conducted a series of interviews designed to provide us with a deeper understanding of what predatory lending is, how it might be measured, its effects on those involved and whether what we observed in the data – and how we interpreted those observations – was realistic. Specifically, TRF staff interviewed these categories of participants in the lending process, none of which was randomly selected:
• borrowers: The borrowers we interviewed were chosen either because they were involved in complaints/litigation involving alleged predatory lending or because their documented borrowing history reflected an unusual pattern (e.g., many refinances within a short time).
• lenders: The lenders interviewed included mortgage bankers and the current (and former) representatives of consumer discount companies.
• mortgage brokers: The brokers interviewed were either referred to TRF by another interviewee, identified on mortgage documents TRF collected through its interviews or identified in local press accounts of predatory lending.
Page �� • Lost VaLues: A Study of Predatory Lending in Philadelphia
4. m
et
ho
do
Lo
gy

• title and settlement professionals: Interviewees in this industry were se-lected because they were suggested by other interviewees as especially knowledgeable or were demonstrably very active in the Philadelphia mortgage market.
• local and State representatives of the mortgage bankers’ and mortgage brokers’ trade associations
• local credit, homeownership and specially trained predatory-lending counselors
• A high-ranking representative of one of the nation’s largest securitiz-ers of subprime mortgage-backed securities
• Attorneys: TRF interviewed attorneys who represent both borrowers and lenders. Additionally, several of the attorneys who handle most of Philadelphia’s mortgage foreclosures and sheriff sales were interviewed.
• other real estate professionals, such as realtors and appraisers
Quantitative data were obtained from several sources:
• first American real estate Solution’s realQuest® database: realQuest is a subscription service that captures in its database the com-plete sale and mortgage history for all of the properties in Philadelphia.36
• u.S. census Summary file 3 (2000) data for census tracts in Philadelphia.
• Prothonotary of Philadelphia: It is the prothonotary with which foreclosure actions must be filed in Philadelphia. The prothonotary pro-vided TRF with an electronic database that registered and provided certain case information for all foreclosures filed between 2000 and 2003 (inclusive).
• home mortgage disclosure Act (hmdA) database: This is a publicly available database of the character-istics of mortgage applications at covered financial institutions. The HMDA data were analyzed along with the HUD list of subprime lenders, permitting TRF to divide originated loans into those originated by lenders reputed by HUD to conduct primarily prime or subprime business.37
Page �� • Lost VaLues: A Study of Predatory Lending in Philadelphia

TRF extracted the complete mortgage and sale histories for a total of 15,553 properties (2,289 randomly selected city-wide plus 13,264 in specific areas) from the RealQuest database and manually coded particular characteristics of each one. The specific items coded reflec-tive of predatory lending included the following:
• Amount of mortgage in relation to the property’s assessed value: estimated values of homes were ob-tained for all residential properties in the city of Philadelphia from its Board of Revision of Taxes (BRT). The BRT is the agency responsible for estimat-ing the value of properties for the purpose of taxation. In Philadelphia, the ratio of the “true market value” to the assessed value for tax purposes
is approximately three to one. In order to be most conservative in our estimations, and because properties in Philadelphia tend to be under-as-sessed in relation to their true market value, we identified those properties whose largest mortgage balance exceeded five times the assessed value as indicative of a false/inflated appraised value.
For example, property with an assessed value of $30,000 for tax purposes has an estimated market value of $90,000. In an effort to be conservative in our estimates of the incidence of overvaluation, TRF decided that, for our purposes, the property would only be coded as overvalued if the largest mortgage exceeded $150,000.
TRF created ten samples of data – one citywide sample of 2,289 randomly selected properties and nine census tracts in which all or nearly all residential properties were selected. Individual tracts and sample sizes follow:
tract name Sample Size
25 Pennsport 1,079120 Wynnefield 321161 West Kensington 1,769168 Glenwood 1,863177 Harrowgate 3,067188 Juniata Park 2,434215 Roxborough 1,334255 East Mt. Airy 829345 Bustleton 568
total properties 13,264
Page �� • Lost VaLues: A Study of Predatory Lending in Philadelphia
4. m
et
ho
do
Lo
gy
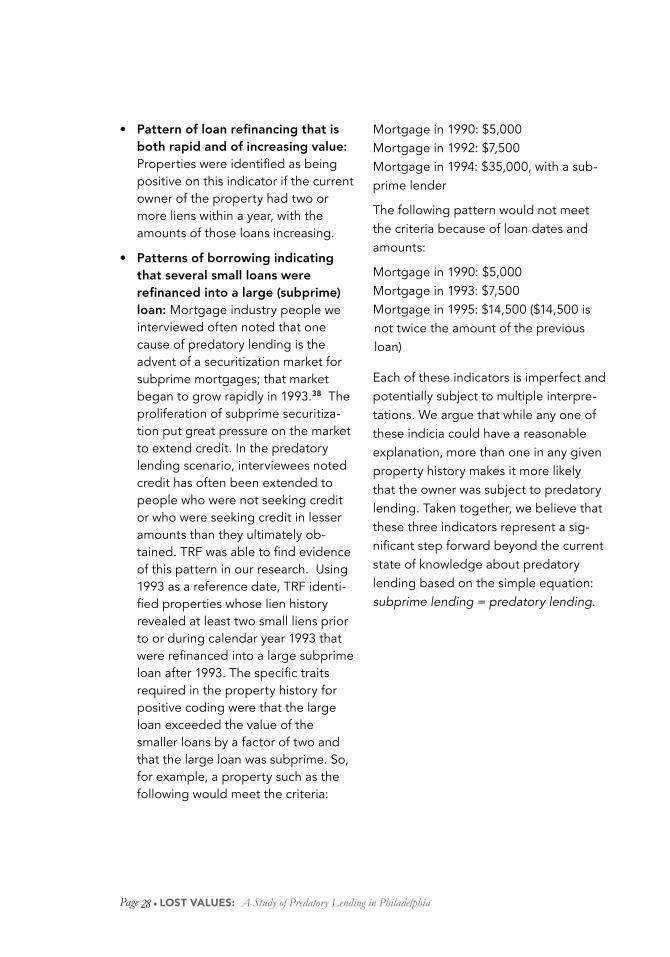
• Patternofloanrefinancingthatisboth rapid and of increasing value: Properties were identified as being positive on this indicator if the current owner of the property had two or more liens within a year, with the amounts of those loans increasing.
• Patterns of borrowing indicating that several small loans were refinancedintoalarge(subprime)loan: Mortgage industry people we interviewed often noted that one cause of predatory lending is the advent of a securitization market for subprime mortgages; that market began to grow rapidly in 1993.38 The proliferation of subprime securitiza-tion put great pressure on the market to extend credit. In the predatory lending scenario, interviewees noted credit has often been extended to people who were not seeking credit or who were seeking credit in lesser amounts than they ultimately ob-tained. TRF was able to find evidence of this pattern in our research. Using 1993 as a reference date, TRF identi-fied properties whose lien history revealed at least two small liens prior to or during calendar year 1993 that were refinanced into a large subprime loan after 1993. The specific traits required in the property history for positive coding were that the large loan exceeded the value of the smaller loans by a factor of two and that the large loan was subprime. So, for example, a property such as the following would meet the criteria:
Mortgage in 1990: $5,000Mortgage in 1992: $7,500Mortgage in 1994: $35,000, with a sub-prime lender
The following pattern would not meet the criteria because of loan dates and amounts:
Mortgage in 1990: $5,000Mortgage in 1993: $7,500Mortgage in 1995: $14,500 ($14,500 is not twice the amount of the previous loan)
Each of these indicators is imperfect and potentially subject to multiple interpre-tations. We argue that while any one of these indicia could have a reasonable explanation, more than one in any given property history makes it more likely that the owner was subject to predatory lending. Taken together, we believe that these three indicators represent a sig-nificant step forward beyond the current state of knowledge about predatory lending based on the simple equation: subprime lending = predatory lending.
Page �� • Lost VaLues: A Study of Predatory Lending in Philadelphia

Some Indicators of Predatory Lending in Philadelphia
Having defined what predatory lending is, the climate within which it exists and the sector of the market that it occupies, we now attempt to answer a fundamental ques-tion: Can predatory lending be measured on a large scale? And, if so, how much predatory lending exists in Philadelphia? To attempt to answer these questions, we focused on the three indicators described above and measured the extent to which each of those three factors (i.e., mortgage exceeds the value of the property, rapid loan refinancing, and patterns of lending reflective of refinancing small loans into a single large subprime loan) – separately and together – exists in the Philadelphia resi-dential-mortgage market. The analysis utilizes the random sample of 2,289 proper-ties in the city of Philadelphia and also examines separately each of the nine specific census tracts noted in our section on methodology. We begin here with our findings from the random sample.39,40
The frequency for each of the three indicators, separately and combined, will be pre-sented two ways. First, percentages will be presented based upon an unrestricted sample of properties. This presentation allows for a generalization to all Philadelphia owner occupied homes. Second, percentages will be presented for a restricted sample based upon the number of liens placed against the property by the current owner; the specific restriction will be three or more liens. This restriction provides an indication of how frequently predatory lending indicators exist for homes whose equity has been put “in play.” We use the expression “in play” to distinguish two types of homeowners:
• Those who have a mortgage on their home and, like most homeowners, re-finance infrequently generally to take advantage of a non-trivial interest rate change or owing to a sufficiently great financial need that accessing the equity in the home becomes necessary (e.g., education, uninsured medical expense).
• Those who have frequently refinanced the mortgages on their home either because they are seeking additional credit, a better mortgage term/rate, or because they are aggressively solicited for mortgage credit.
Page �� • Lost VaLues: A Study of Predatory Lending in Philadelphia
5. s
om
e In
dIc
at
or
s o
f P
re
da
to
ry
Le
nd
Ing
In P
hIL
ad
eL
Ph
Ia

overvAluAtion
Our examination of this factor in the random sample revealed that regardless of the number of liens existing against a property, approximately 18 percent of the homes in our random sample had loans exceeding five times the property’s assessed value. This figure, however, is not uniform across the city. In low-priced areas, 12.5 percent of properties had loans exceeding five times the estimat-ed value; in moderately priced areas, 23.0 percent had such excessive loans; in middle-priced areas, 16.7 percent had excessive loans and in high-priced areas, 13.4 percent had excessive loans.41
If we restrict our sub-grouping only to those homes with three or more liens (homes who asset value has been put in play), we find that the percentages of loans exceeding value are substantial-ly different in each area. In low-priced areas, 50 percent of properties had ex-cessive loans; in moderately priced areas, the percentage was 50.9; in middle-priced areas, the percentage was 23.1 and in high-priced areas, the percentage was 15.8.
eQuity loSS
Repeated mortgage refinances on a home may suggest loss of equity. Approximately 21 percent of all proper-ties in the sample had a mortgage refi-nance in their history with their current owners and had complete information
on the first and most recent mortgages. Among those properties, 61.1 percent had gotten their first mortgages from a prime lender; among those same properties, 52.1 percent had procured second or subsequent loans with a prime lender.42
One distinct (and measurable) equity-loss pattern, as noted previously, is when a property owner has multiple small loans that are then rolled into a larger loan, with the large loan being a sub-prime loan dated after 1993.43 If we focus on the properties in our sample with this pattern of lending in their histories, we observe that 16.3 percent of proper-ties exhibited this pattern. In lower-value areas, such refinance patterns suggest-ing loss of equity are more prevalent.44 Owing to sample size concerns, we’ve collapsed low- and moderate-priced areas into one group (“low/moderate”). In low/moderate areas, 20.4 percent of homes manifested this pattern; in middle-priced areas, 16.3 percent mani-fest this loss of equity and in high-priced areas, the percentage drops to 12.8.
rAPidly refinAncing in increASing AmountS
As noted earlier, this indicator is defined as manifesting the origination of two loans within twelve months, with the second loan amount being greater than the first. Overall, 4.7 percent of proper-ties met the criteria; 19.0 percent with three or more liens exhibited this pattern.
Page �0 • Lost VaLues: A Study of Predatory Lending in Philadelphia

Due to similar sample size concerns, we have grouped the properties into two sets: low/moderate and medium/high. We find that 3.6 percent of properties in low/moderate areas test positive for this indicator, while 9.0 percent of proper-ties in medium/high areas test positive, as well.
SummAry of indicAtorS of PredAtory lending in PhilAdelPhiA
Out of the entire Philadelphia sample, we found 22.3 percent of homes revealed at least one of three indicators of predatory lending, with the most prevalent indi-cator being potential overvaluation. At least two measures of predatory lending were found for 3.1 percent of the proper-ties in our sample. For those properties with at least three liens attributed to their current owner, 50.9 percent of properties manifest at least one of the three preda-tory lending indicators, and 14.1 percent of properties have at least two measures.
Page �� • Lost VaLues: A Study of Predatory Lending in Philadelphia
5. s
om
e In
dIc
at
or
s o
f P
re
da
to
ry
Le
nd
Ing
In P
hIL
ad
eL
Ph
Ia

Fig
ure
6.1
Cen
sus
Trac
t C
hara
cter
isti
cs O
f Se
lect
ed A
reas
Cen
sus
Trac
tC
hara
cter
isti
csO
fSe
lect
edA
reas
Hom
eV
alue
Hou
seho
ldIn
com
eC
red
itSc
ore
%H
hld
rH
isp
anic
%H
hld
rB
lack
%O
wne
rO
ccPo
p20
00Po
p19
90Pc
tC
hg
Trac
t25
:Pen
nsp
ort
$69,
500
$26,
250
2.60
4.3%
37.7
%51
.3%
3149
3436
-8.4
%Tr
act
120:
Wyn
nefie
ld$1
64,9
00$4
4,95
42.
542.
0%60
.4%
50.5
%16
6117
81-6
.7%
Trac
t16
1:W
est
Ken
sing
ton
$21,
800
$19,
098
2.22
16.6
%5.
8%59
.1%
5548
6034
-8.1
%Tr
act
168:
Gle
nwoo
d$3
1,00
0$1
9,77
02.
070.
5%98
.1%
62.6
%45
5353
70-1
5.2%
Trac
t17
7:H
arro
wg
ate
$25,
800
$15,
687
2.07
49.2
%22
.6%
55.4
%94
5985
9810
.0%
Trac
t18
8:Ju
niat
aPa
rk$3
5,30
0$2
2,48
93.
0816
.5%
9.0%
66.5
%72
5771
671.
3%Tr
act
215:
Rox
bor
oug
h$8
0,20
0$4
5,46
43.
082.
0%2.
6%71
.7%
3541
3542
0.0%
Trac
t25
5:E
ast
Mt.
Air
y$1
07,7
00$5
0,69
92.
540.
0%73
.2%
70.3
%27
6228
98-4
.7%
Trac
t34
5:B
ustl
eton
$88,
900
$31,
049
3.48
3.8%
5.7%
31.2
%84
4079
506.
2%
Per
rcen
to
fP
rop
erti
esW
ith
Ind
icat
ions
Of
Pre
dat
ory
Lend
ing
For
Sele
cted
Are
as
Rap
idR
efin
anci
ng
Rap
idR
efin
anci
ng(3
orm
ore
loan
s)O
ver
Val
ued
Ove
rV
alue
d(3
orm
ore
loan
s)
Eq
uity
Stri
pp
ing
(3or
mor
elo
ans)
2or
Mor
eIn
dic
ator
s
2or
Mor
eIn
dic
ator
s(3
orm
ore
loan
s)Tr
act
25:P
enns
por
t4.
5%15
.2%
23.5
%49
.7%
17.5
%3.
8%19
.3%
Trac
t12
0:W
ynne
field
7.8%
20.9
%17
.1%
22.0
%20
.9%
3.7%
11.0
%Tr
act
161:
Wes
tK
ensi
ngto
n2.
7%29
.9%
22.8
%62
.6%
27.1
%2.
5%35
.5%
Trac
t16
8:G
lenw
ood
2.3%
27.7
%24
.8%
83.2
%30
.3%
3.0%
41.2
%Tr
act
177:
Har
row
gat
e2.
2%22
.7%
18.7
%43
.6%
8.2%
1.1%
15.5
%Tr
act
188:
Juni
ata
Park
3.5%
21.5
%15
.9%
35.1
%18
.1%
1.5%
14.2
%Tr
act
215:
Rox
bor
oug
h4.
6%15
.3%
18.1
%27
.0%
12.5
%2.
5%11
.7%
Trac
t25
5:E
ast
Mt.
Air
y5.
8%13
.8%
14.8
%14
.3%
13.8
%2.
9%7.
4%Tr
act
345:
Bus
tlet
on5.
5%20
.4%
6.9%
17.2
%14
.0%
2.1%
10.8
%
cen
sus
trac
t c
hara
cter
isti
cs o
f Se
lect
ed A
reas
Percent of Properties with indications of Predatory lending for Selected Areas
Perc
ent
of
Pro
per
ties
wit
h in
dic
atio
ns o
f P
red
ato
ry l
end
ing
fo
r Se
lect
ed A
reas
Page �� • Lost VaLues: A Study of Predatory Lending in Philadelphia

Philadelphia’s Neighborhoods: A Closer Look at Indicators of Predatory Lending
In addition to looking at the random sample of properties representative of the city of Philadelphia, we separately examined nine specific neighborhoods (i.e., roughly corresponding to census tracts) within Philadelphia. These tracts were not chosen at random, but instead were selected because they exhibited specific characteristics that we wanted to examine and together offered potentially useful differences in area income, racial composition and population change. Like most cities, Philadelphia is far from homogenous, and the relationship of this heterogeneity to predatory lending is one issue that we attempt to understand (Figure 6.1).
We can make several generalizations about this analysis. Using as our benchmark of the incidence of predatory lending the percent of properties with two or more indica-tors and three or more liens, we observe the following:
• Higher income areas tend to have lower incidences of predatory lending;
• Higher home value areas tend to have lower incidences of predatory lending;
• Areas home to people with less risky credit scores tend to have lower inci-dences of predatory lending;
• Areas that underwent the greatest proportionate population loss between 1990 and 2000 experienced higher incidences of predatory lending; and
• Higher owner occupancy areas tend to have higher incidences of predatory lending.
When it comes to the relationship between the percent minority in an area, be it Hispanic or African American, the relationship is not quite so clear cut. For example, the area with the highest percent African American (i.e., census tract 168) has the highest incidence of predatory lending. On the other hand, census tract 255 (also with a very high percent African American) has a very low incidence. What the data do suggest is that when income or home value are made equal across areas, the inci-dence of predatory lending tends to be higher in African American areas. The same cannot be said of the Hispanic areas, where that relationship does not seem to hold.
Page �� • Lost VaLues: A Study of Predatory Lending in Philadelphia
6. P
hIL
ad
eL
Ph
Ia’s
ne
Igh
Bo
rh
oo
ds
: A C
loser Look at Indicators of Predatory L
ending
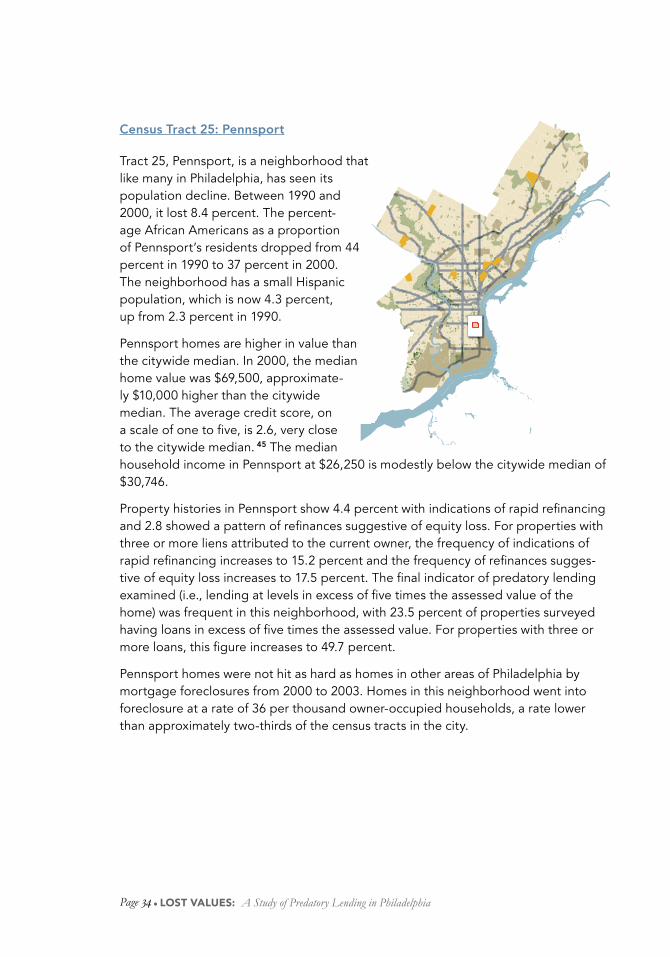
census tract 25: Pennsport
Tract 25, Pennsport, is a neighborhood that like many in Philadelphia, has seen its population decline. Between 1990 and 2000, it lost 8.4 percent. The percent-age African Americans as a proportion of Pennsport’s residents dropped from 44 percent in 1990 to 37 percent in 2000. The neighborhood has a small Hispanic population, which is now 4.3 percent, up from 2.3 percent in 1990.
Pennsport homes are higher in value than the citywide median. In 2000, the median home value was $69,500, approximate-ly $10,000 higher than the citywide median. The average credit score, on a scale of one to five, is 2.6, very close to the citywide median. 45 The median household income in Pennsport at $26,250 is modestly below the citywide median of $30,746.
Property histories in Pennsport show 4.4 percent with indications of rapid refinancing and 2.8 showed a pattern of refinances suggestive of equity loss. For properties with three or more liens attributed to the current owner, the frequency of indications of rapid refinancing increases to 15.2 percent and the frequency of refinances sugges-tive of equity loss increases to 17.5 percent. The final indicator of predatory lending examined (i.e., lending at levels in excess of five times the assessed value of the home) was frequent in this neighborhood, with 23.5 percent of properties surveyed having loans in excess of five times the assessed value. For properties with three or more loans, this figure increases to 49.7 percent.
Pennsport homes were not hit as hard as homes in other areas of Philadelphia by mortgage foreclosures from 2000 to 2003. Homes in this neighborhood went into foreclosure at a rate of 36 per thousand owner-occupied households, a rate lower than approximately two-thirds of the census tracts in the city.
Page �� • Lost VaLues: A Study of Predatory Lending in Philadelphia
SOMERSET
YL
OR
BA
ILE
Y
ST
ILL
MA
N
BA
MB
RE
Y
SELTZE

Page �� • Lost VaLues: A Study of Predatory Lending in Philadelphia
6. P
hIL
ad
eL
Ph
Ia’s
ne
Igh
Bo
rh
oo
ds
: A C
loser Look at Indicators of Predatory L
ending

CensusTract120:Wynnefield
Tract 120, Wynnefield, is the highest-income tract of the nine examined for this study. That said, like many other neighbor-hoods, Wynnefield experienced a net decline in its population of 6.7 percent. The neighborhood was 68 percent African American in 1990 a figure that declined to 60.4 percent in 2000. The Hispanic population saw a small increase, from 1.7 percent to 2.0 percent.
Relatively speaking, homes in tract 120 are high in value. With a median value of $164,900, they are worth more than homes in most neighborhoods in Philadelphia. And Wynnefield’s residents, with a median household income of $44,954, have significantly more income than the median household in Philadelphia. The average credit score, on the same one to five scale, is 2.54, very close to that of Pennsport and to the median census tract score in the city.
Interestingly, despite the fact that Wynnefield had the highest property values of the tracts studied, it also has the highest incidence of rapid refinancing among its proper-ties. In fact, 7.8 percent of all properties met the criteria. Of properties with three or more liens attributed to the current owner, 20.9 percent indicate those rapid refinanc-ings, ranking it in the middle of the studied tracts.
Wynnefield also showed the highest incidence of refinance patterns suggestive of equity loss, with 5.9 percent of its properties indicating this pattern of lending. For properties with three or more liens, 20.9 percent of properties showed this same pattern, ranking Wynnefield among those tracts near the average.
In terms of potential overvaluing, 17.1 percent of homes in Wynnefield have loans that total over five times the assessed value. For properties with three or more loans at-tributed to their current owners, this frequency increases to 22 percent.
Wynnefield saw fewer foreclosures than the median Philadelphia census tract for the years 2000 to 2003. In those four years, approximately 43 homes went into foreclo-sure per thousand owner-occupied housing units.
Page �� • Lost VaLues: A Study of Predatory Lending in Philadelphia
SOMERSET
YL
OR
BA
ILE
Y
ST
ILL
MA
N
BA
MB
RE
Y
SELTZE

Page �� • Lost VaLues: A Study of Predatory Lending in Philadelphia
6. P
hIL
ad
eL
Ph
Ia’s
ne
Igh
Bo
rh
oo
ds
: A C
loser Look at Indicators of Predatory L
ending

census tract 161: West kensington
West Kensington is one of the poorer tracts studied and also significantly losing population. From 1990 to 2000, the tract lost 8.1 percent of its popula-tion. Unlike the two previously dis-cussed tracts, the population loss for this predominantly White neighborhood was concentrated in the White com-munity. In 1990, the neighborhood was just 0.5 percent African American and 5.2 percent Hispanic. These numbers increased to 5.8 percent and 16.6 percent respectively by 2000.
Compared to other neighborhoods in Philadelphia, the homes of West Kensington are of low value, with a median home value of $21,800. The median household income in 161 is also low, $19,098, significantly less than the city-wide median. On a one to five scale, the average credit score is 2.22, which places the neighborhood below approximately 60 percent of tracts in the city.
In terms of predatory lending indicators, West Kensington properties had evidence of rapid refinancing on 2.7 percent on all properties, ranking it seventh out of the nine tracts examined. However, when restricting properties to those meeting the three or more lien criteria, the rate of rapid refinancing jumps to first, with 29.9 percent. Of tract 161’s properties, 1.6 percent had a pattern of refinances suggestive of equity loss, ranking it eighth of nine. However, for properties with three or more liens attrib-uted to the current owner, the frequency increases to 27.1 percent, ranking it second.
In terms of potential overvaluing, 22.8 percent of properties had loans with amounts more than five times their property’s assessed values. For properties with three or more liens attributed to their current owner, this increases to 62.6 percent.
West Kensington had more foreclosures than the median Philadelphia census tract for the years 2000 to 2003. In those four years, approximately 86 homes went into fore-closure per thousand owner-occupied housing units, the third highest rate of the nine tracts studied.
Page �� • Lost VaLues: A Study of Predatory Lending in Philadelphia
SOMERSET
YL
OR
BA
ILE
Y
ST
ILL
MA
N
BA
MB
RE
Y
SELTZE

Page �� • Lost VaLues: A Study of Predatory Lending in Philadelphia
6. P
hIL
ad
eL
Ph
Ia’s
ne
Igh
Bo
rh
oo
ds
: A C
loser Look at Indicators of Predatory L
ending

census tract 168: glenwood
Tract 168, a North Philadelphia neighbor-hood known as Glenwood, lost a large portion of its population, 15.2 percent, from 1990 to 2000. That was the largest rate of population loss for any of the tracts studied. Glenwood is an overwhelmingly African American tract, with 100 percent of the population in 1990 and 98.1 percent of the popula-tion in 2000 identifying as such.
Both income and home values are relatively low in Glenwood. The median household income is $19,770, and the median home value is $31,000, both of which are signif-cantly lower than the city as a whole. On a one to five scale, the average credit score is 2.07, well below the median Philadelphia tract, and tied for the lowest score of the nine tracts studied.
In terms of predatory lending indicators, 2.3 percent of tract 168 homes showed signs of rapid refinancing. However, for those properties with three or more liens attribut-ed to the current owner, this jumped to 27.7 percent, the second highest rate of the nine tracts studied. Similarly, while only 1.9 percent of properties show an indication of refinances suggesting an equity loss, 30.3 percent of all properties with three or more liens attributed to the current owner had this pattern of refinancing, the highest rate of any of the studied tracts. With a similar pattern of lending as West Kensington, as well as a similar jump in rankings when restricted to properties with three or more liens in their owner’s history, we may be identifying neighborhoods that generally do not have a large amount of lending activity. However, once the home is put in play, predatory lending is frequent.
In terms of loans made at a greater price than the value of the homes, tract 168 leads all studied tracts, both in terms of all properties, as well as all properties that have three or more loans attributed to their current owner. Of all properties in tract 168, 24.8 percent had loans that were more than five times their assessed value. For properties with three or loans attributed to the current owner, this jumped to 83.2 percent, easily the highest of the tracts studied.
Glenwood has experienced a level of foreclosure filings similar to the median tract of Philadelphia. Roughly 49 out of every thousand owner-occupied homes in the tract (or 4.9 percent of owner-occupied housing) went into foreclosure from 2000 to 2003, close to the citywide median value of 52.95.
Page �0 • Lost VaLues: A Study of Predatory Lending in Philadelphia
SOMERSET
YL
OR
BA
ILE
Y
ST
ILL
MA
N
BA
MB
RE
Y
SELTZE

Page �� • Lost VaLues: A Study of Predatory Lending in Philadelphia
6. P
hIL
ad
eL
Ph
Ia’s
ne
Igh
Bo
rh
oo
ds
: A C
loser Look at Indicators of Predatory L
ending

census tract 177: harrowgate
Tract 177, Harrowgate, grew by 10 percent from 1990 to 2000, the highest growth rate of the tracts studied. The pro-portion of minority residents in Harrowgate grew exponentially from 1990 to 2000. In 1990, Harrowgate had a negligible African American popu-lation (0.2 percent). By 2000, this number grew to 22.6 percent. Similarly, Hispanics accounted for 6.7 percent of the neighborhood’s population in 1990. By 2000, Hispanics were the largest ethnic group in the tract, with 49.2 percent of residents.
Like Glenwood, Harrowgate is a tract with relatively low incomes and home values. The median household income was $15,687, significantly lower than the Philadelphia median and the lowest of the tracts studied. The median home value in Harrowgate is $25,800, also much lower than the Philadelphia median. The average credit score is the same as Glenwood’s, ranking Harrowgate in the bottom third of all Philadelphia tracts.
Aside from an extraordinary rate of foreclosure, Harrowgate does not show a com-mensurate amount of predatory lending indicators. For all properties, 2.2 percent of properties showed signs of rapid refinancing. For those properties with three or more liens attributed to the current owner, the rate increased to 22.7 percent. Overall. 0.3 percent had a pattern of refinances suggestive of equity loss. For properties with three or more liens attributed to their current owner, this frequency increases to 8.2 percent. Each of these percentages is the smallest of the tracts studied. That said, 18.7 percent of Harrowgate homes have liens that are more than five times the as-sessed value. For properties with three or more liens, this climbs to 43.6 percent, placing Harrowgate in the middle of the tracts studied.
Like virtually no other neighborhood in Philadelphia, Harrowgate was ravaged by foreclosures between 2000 and 2003. For these four years, roughly 173 properties per thousand owner-occupied units, or over 17 percent of the housing stock, went into foreclosure. That is an astounding number and the second highest rate of the roughly 300 residential tracts in Philadelphia.
SOMERSET
YL
OR
BA
ILE
Y
ST
ILL
MA
N
BA
MB
RE
Y
SELTZE
Page �� • Lost VaLues: A Study of Predatory Lending in Philadelphia

Page �� • Lost VaLues: A Study of Predatory Lending in Philadelphia
6. P
hIL
ad
eL
Ph
Ia’s
ne
Igh
Bo
rh
oo
ds
: A C
loser Look at Indicators of Predatory L
ending

census tract 188: Juniata Park
The population of tract 188, Juniata Park, grew slightly from 1990 to 2000, increasing by 1.3 percent. Juniata Park has a small but growing African American and Hispanic population. From 1990 to 2000, the Hispanic popu-lation grew from 1.8 percent to 16.5 percent. Over that same time period, the African American population grew from zero percent in 1990 to 9 percent population in 2000.
Both incomes and home values are lower in tract 188 than they are across the city. The median household income in Juniata Park is $22,489 and the median home value is $35,300 – both below the citywide median values. The average credit score is 3.08, higher than roughly two-thirds of all tracts in the city.
In terms of the predatory lending indicators, 3.5 percent of all Juniata Park homes were identified as having experienced rapid refinancing. When we consider only those properties with three or more liens, the incidence of such refinancing climbs to 21.5 percent. In terms of the pattern of refinances suggestive of equity loss, 1.6 percent of properties in tract 188 had that pattern. When we restrict the computation to properties with three or more liens attributed to the current property owner, this climbs to 18.1 percent. Finally, 15.9 percent of properties had loans five times higher than the assessed value. When given the familiar three-lien restriction, this climbs to 35.1 percent.
Like Harrowgate, Juniata Park was devastated by an extraordinary wave of foreclo-sures. There were 144 foreclosure filings per thousand owner-occupied housing units, fully 14 percent of the owner-occupied housing stock. Juniata Park had the second highest rate of owner-occupied homes in foreclosure of the tracts studied and was higher than 98 percent of the tracts in Philadelphia.
SOMERSET
YL
OR
BA
ILE
Y
ST
ILL
MA
N
BA
MB
RE
Y
SELTZE
Page �� • Lost VaLues: A Study of Predatory Lending in Philadelphia

Page �� • Lost VaLues: A Study of Predatory Lending in Philadelphia
6. P
hIL
ad
eL
Ph
Ia’s
ne
Igh
Bo
rh
oo
ds
: A C
loser Look at Indicators of Predatory L
ending

census tract 215: roxborough
The population of Tract 215, Roxborough, was stable between 1990 and 2000. Roxborough has small African American and Hispanic popu-lations that grew in percentage terms slightly from 1.8 percent to 2.6 percent and from 0.4 to 2 percent, respectively.
The median household income in Roxborough is $45,464, roughly $15,000 higher than the median income for Philadelphia. The median housing value is $80,200, also signifi-cantly higher than the citywide average. Average credit scores of Roxborough residents are generally good. At 3.08, the average credit score in Roxborough is higher than roughly three-quarters of all tracts in the city.
Rapid refinancing occurs in 4.6 percent of all properties and 15.3 percent of proper-ties with three or more liens attributed to the current owner. Of all properties, 2.3 percent showed a pattern of lending suggestive of equity loss. When limited by the three lien criteria, this percentage climbs to 12.5 percent. In terms of lending at levels higher than home value, 18.1 percent of properties and 27.0 percent properties with three owner liens had loans more than five times the assessed value.
Compared to its counterparts in this study, Roxborough was not hit hard by 2000 to 2003 foreclosures. In those four years, tract 215 had 25 foreclosures per thousand owner-occupied housing units, ranking it among the lower rates in Philadelphia.
SOMERSET
YL
OR
BA
ILE
Y
ST
ILL
MA
N
BA
MB
RE
Y
SELTZE
Page �� • Lost VaLues: A Study of Predatory Lending in Philadelphia

Page �� • Lost VaLues: A Study of Predatory Lending in Philadelphia
6. P
hIL
ad
eL
Ph
Ia’s
ne
Igh
Bo
rh
oo
ds
: A C
loser Look at Indicators of Predatory L
ending

census tract 255: east mt. Airy
The population of tract 255, East Mt Airy, declined by 4.7 percent between 1990 and 2000. African Americans are the largest racial grouping in the tract, increasing in percentage from 68.2 percent in 1990 to 73.2 percent in 2000. Hispanics, which made up 1.8 percent of the tract in 1990 are statisti-cally absent from the tract in 2000.
East Mt. Airy has both strong income and home values. The median house-hold income in the area is $50,699, well above the Philadelphia average. The median home value, at $107,700, is also well above the citywide median. Credit scores, at 2.54 on a one to five scale, are a bit lower than we might expect given East Mt. Airy’s average income and home value.
Within East Mt. Airy, 5.8 percent of properties show signs of rapid refinancing, the highest of any tracts studied. When the three lien limitation is considered, the rate climbs only to 13.8 percent, making East Mt. Airy the lowest of any of the nine areas studied. Similarly, 5.7 percent of properties had a pattern of refinances suggestive of equity loss, ranking the neighborhood second among the nine studied. However, when limited to properties with three liens, the rate only increases to 13.8 percent, ranking it seventh out of the tracts studied. Finally, 14.8 percent of properties have liens worth more than five times their assessed values. Interestingly, when properties are limited by the three lien criteria, this drops slightly, to 14.3 percent; East Mt. Airy is the only area to show a decline using this criterion.
Despite its high incomes, East Mt. Airy experienced slightly more foreclosures than the typical Philadelphia census tract. From 2000 to 2003, approximately 54 per thou-sand owner-occupied homes went into foreclosure, or fully 5.4 percent of the neigh-borhood’s owner-occupied housing stock.
SOMERSET
YL
OR
BA
ILE
Y
ST
ILL
MA
N
BA
MB
RE
Y
SELTZE
Page �� • Lost VaLues: A Study of Predatory Lending in Philadelphia

Page �� • Lost VaLues: A Study of Predatory Lending in Philadelphia
6. P
hIL
ad
eL
Ph
Ia’s
ne
Igh
Bo
rh
oo
ds
: A C
loser Look at Indicators of Predatory L
ending
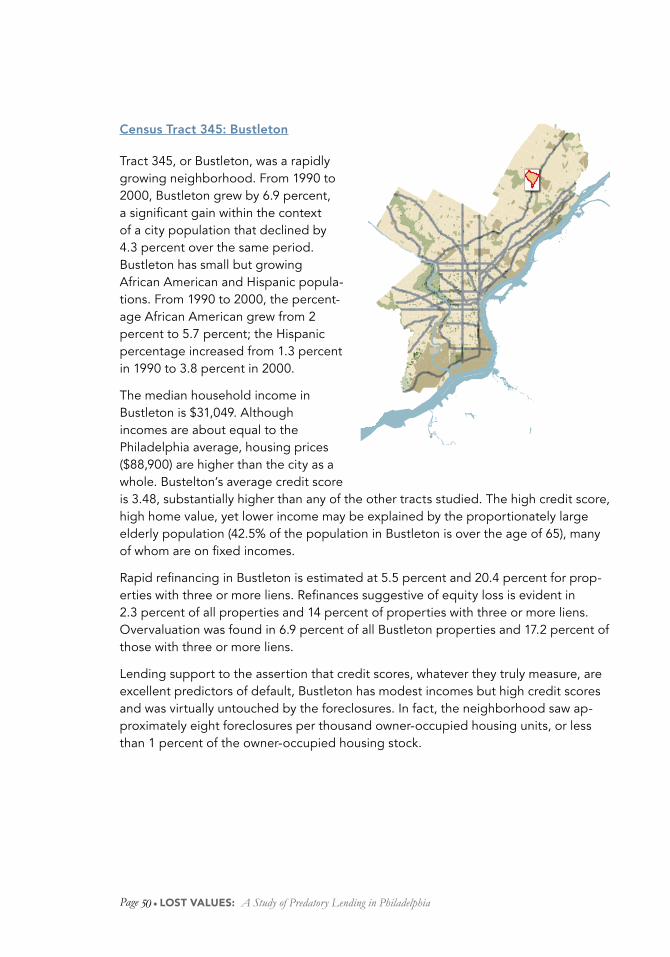
census tract 345: bustleton
Tract 345, or Bustleton, was a rapidly growing neighborhood. From 1990 to 2000, Bustleton grew by 6.9 percent, a significant gain within the context of a city population that declined by 4.3 percent over the same period. Bustleton has small but growing African American and Hispanic popula-tions. From 1990 to 2000, the percent-age African American grew from 2 percent to 5.7 percent; the Hispanic percentage increased from 1.3 percent in 1990 to 3.8 percent in 2000.
The median household income in Bustleton is $31,049. Although incomes are about equal to the Philadelphia average, housing prices ($88,900) are higher than the city as a whole. Bustelton’s average credit score is 3.48, substantially higher than any of the other tracts studied. The high credit score, high home value, yet lower income may be explained by the proportionately large elderly population (42.5% of the population in Bustleton is over the age of 65), many of whom are on fixed incomes.
Rapid refinancing in Bustleton is estimated at 5.5 percent and 20.4 percent for prop-erties with three or more liens. Refinances suggestive of equity loss is evident in 2.3 percent of all properties and 14 percent of properties with three or more liens. Overvaluation was found in 6.9 percent of all Bustleton properties and 17.2 percent of those with three or more liens.
Lending support to the assertion that credit scores, whatever they truly measure, are excellent predictors of default, Bustleton has modest incomes but high credit scores and was virtually untouched by the foreclosures. In fact, the neighborhood saw ap-proximately eight foreclosures per thousand owner-occupied housing units, or less than 1 percent of the owner-occupied housing stock.
SOMERSET
YL
OR
BA
ILE
Y
ST
ILL
MA
N
BA
MB
RE
Y
SELTZE
Page �0 • Lost VaLues: A Study of Predatory Lending in Philadelphia

Page �� • Lost VaLues: A Study of Predatory Lending in Philadelphia
6. P
hIL
ad
eL
Ph
Ia’s
ne
Igh
Bo
rh
oo
ds
: A C
loser Look at Indicators of Predatory L
ending

Figure�7.1�Foreclosures�in�Philadelphia,�2000-2003
Page �� • Lost VaLues: A Study of Predatory Lending in Philadelphia

Foreclosures and Predatory Lending: The Nexus
If predatory loans generally strip equity from low-income borrowers and saddle them with loan payments that they may not be able to afford, a logical conclusion is that many of these borrowers will be unable to meet their monthly payment obligations, leading to foreclosure and the loss of their home. Assuming that is true and that the indicators of predatory lending are reasonable, we would expect to see more frequent indication of predatory lending in the loan histories of foreclosure proper-ties. In this section, we explore how often the loan histories of properties in foreclosure manifest indicators of predatory lending.
Let us begin by reviewing basic facts about foreclosure. Legally, a foreclosure is defined as “the process by which a mortgagor of real property or personal property, or other owner of property subject to a lien, is deprived of his interest therein,” and as “a proceeding in equity whereby a mortgagee either takes title to or forces the sale of the mortgagor’s property in satisfaction of a debt” [Black, H. (1990)].
At its most basic level, the initiation of a foreclosure generally indicates that an individual has stopped making payments on a mortgage (voluntarily or involuntarily). Unless those payments begin or, in the case of Philadelphia, unless the Commonwealth intervenes, a bankruptcy is successfully filed or some other extraordinary event occurs, the individual is going to lose his or her home.46 Whether the foreclosure results from an abusive lending practice or an individual’s abuse of his or her credit, the result is the same. For the individual, the loss is personally devastating; for the investor, the loss must be absorbed financially. And for the neighborhood where the property is located, unless its property market is strong, the loss foreshadows another long-term vacant property.
How is a foreclosure initiated? In Philadelphia, a foreclosure action must be filed with the court. As noted earlier, the prothonotary (the principal Clerk of the Court of Common Pleas of Philadelphia) is responsible for accepting these filings. Foreclosures
Page �� • Lost VaLues: A Study of Predatory Lending in Philadelphia
7. f
or
ec
Lo
su
re
s a
nd
Pr
ed
at
or
y L
en
dIn
g: T
he Nexus

are not necessarily filed in the name of the originating lender; instead, a fore-closure is typically filed in the name of whatever entity is servicing the loan at the time of the foreclosure. It could also be filed in the name of the trust into which the loan has been sold, or even in the name of the attorney who filed the foreclosure action. This makes tracing the history of a foreclosure a difficult task. Since examining the initial circum-stances of the loan requires finding out its original lender, we attempted to link each of the foreclosure filings made in Philadelphia from 2000 to 2003 to a da-tabase of public record filings. In over 15,000 cases, we were able to identify the original lender and the date on which the loan in foreclosure was originated.47 The huge amount of information avail-able to us on these foreclosed loans has allowed us to paint a very detailed picture of the neighborhoods in which the foreclosures occurred, the speed at which they arrived in default and the presence or absence of predatory-lending indicators. (Figure 7.1)
Where and When do foreclosures occur?
Of all foreclosed loans in Philadelphia between 2000 and 2003, 4.8 percent occurred in areas with average housing values under $25,000, 46.6 percent occurred in areas with homes valued between $25,000 and $49,999, 45.2 percent occurred in areas with homes
valued between $50,000 and $99,999 and 3.4 percent occurred in areas with homes valued at $100,000 and over.48 These numbers reveal that Philadelphia foreclosures are disproportionately oc-curring in moderate and middle-priced areas. Among loans in foreclosure origi-nated by prime lenders, 4.2 percent were in low-priced areas, 48.2 percent were in moderate-priced areas, 44.4 percent were in middle-priced areas and 3.2 percent were in high-priced areas. Among loans in foreclosure originated by subprime lenders, 5.3 percent were in low-priced areas, 47.5 percent were in moderate-priced areas, 44.1 percent were in middle-priced areas and 3.1 percent were in high-priced areas.
While the percents in foreclosure per area are similar, subprime and prime loans do differ in the amount of time between origination and foreclosure. Subprime loans move more rapidly from origination to foreclosure49.
In Philadelphia as a whole, between 2000 and 2003, the typical (median) period of time between origination and foreclo-sure for prime loans is 6.3 years (mean = 6.9 years); the typical period between origination and foreclosure for subprime loans was 3.6 years (mean = 4.1 years). Of all foreclosure filings in those years, 15.9 percent occurred within two years of loan origination, 42.2 percent occurred between two and five years after origina-tion and 39.2 percent occurred after five
Page �� • Lost VaLues: A Study of Predatory Lending in Philadelphia

years. Among foreclosure filings by prime lenders, 6.4 percent occurred within two years; among foreclosure filings by sub-prime lenders, 20.8 percent occurred within two years.49
The typical (median) period between origination and foreclosure for subprime loans in low-priced areas between 2000 and 2003 is 3.5 years (mean = 4.5 years), while for prime loans in low-priced areas the median period was 6.3 years. In mod-erate-priced areas, the median period was 4.0 years (mean = 5.0 years); in middle-priced areas, the median period was 4.3 years (mean = 4.4 years) and in high-priced areas it was 4.4 years (mean = 5.3 years).50
Interestingly, there are dramatic differ-ences in the speed at which loans moved from origination to foreclosure amongst the four years examined. Foreclosures started in 2000 went into foreclosure in
a median time of 2.8 years (mean = 4.1) after origination. Among 2001 filings, the median time from origination to foreclosure was 3.5 years (mean = 4.7). Foreclosures started in 2002 went into foreclosure in a median time of 4.4 years (mean = 5.4), while those started in 2003 had a median time of 5.4 years (mean = 6.4). Why did the period between origina-tion and foreclosure lengthen with each passing year? One possible explanation is that, in the late 1990s, a large number of risky loans, perhaps predatory, were originated by companies that have since altered their business models, or gone out of business. The graph shows the distribu-tion of loans in foreclosure for each year, color coded to indicate the loan origina-tion date. (Figure. 7.2)
With an unchanging set of loan prod-ucts, we would assume a fairly constant time from origination to foreclosure of a loan. Therefore, in looking at four years
Figure�7.2-�Distribution�of�Foreclosure�Filings�by�Year�Loan�Originated
1984-1985
1986-1987
1988-1989
1990-1991
1992-1993
1995-1994
1996-1997
1998-1999
2000-2001
2002-2003
Distribution of Foreclosure Filings By Loan Year
0%
10%
20%
30%
40%
50%
60%
70%
80%
90%
100%
2000 2001 2002 2003
Page �� • Lost VaLues: A Study of Predatory Lending in Philadelphia
7. f
or
ec
Lo
su
re
s a
nd
Pr
ed
at
or
y L
en
dIn
g: T
he Nexus

of foreclosure filings, we would expect to see noticeable differences in the year of origination for foreclosure filings from 2000 to 2003. For example, a 2000 fore-closure filing would generally be expect-ed to be drawing from a four year older loan pool than a 2003 foreclosure and so would tend to be originated roughly three to four years earlier. As the graph reveals, the origination years of fore-closed loans between 2000 and 2003 do not differ greatly. By far the biggest two-year period of loan originations for each year of foreclosures is from 1998 to 1999.
Our next graph (figure 7.3) reveals the speed at which loans moved from origi-nation to foreclosure each year from 2000 to 2003.
One would expect that a foreclosed loan filed in 2000 would not have moved any quicker to foreclosure than a fore-closed loan filed in 2003. However, as the graph shows, there are striking dif-ferences. A loan reached foreclosure in 2000 far faster than a loan in foreclosure in 2003 did. Again, this may indicate that the current foreclosure circumstance in Philadelphia is at least partially traceable to a particular set of loans made in the mid- to late 1990s and that the effects of these loans have been continually evident over the past four years. Not only does the data support this theory, but it is corroborated by consumer advocates, who have indicated that the market of the late 1990s contained particularly harmful loans, many made by lenders who have since gone out of business.
Figure�7.3�Distribution�of�Years�to�Foreclosure�by�Year�Filed
Distribution of Years to Foreclosure By Year Of Filing
0%
10%
20%
30%
40%
50%
60%
70%
80%
90%
100%
2000 2001 2002 2003
15 and up
10-15
8-10
6-8
4-6
2-4
0-2
Page �� • Lost VaLues: A Study of Predatory Lending in Philadelphia

Page �� • Lost VaLues: A Study of Predatory Lending in Philadelphia
7. f
or
ec
Lo
su
re
s a
nd
Pr
ed
at
or
y L
en
dIn
g: T
he Nexus
diStribution of forecloSureS
In a 2005 study on foreclosures in Pennsylvania, TRF estimated the rate of foreclosure for fourteen counties across the state. Philadelphia’s aggre-gate 2000 to 2003 rate, calculated by dividing the city’s number of foreclo-sures by the number of owner-occupied housing units, was approximately 68 filings for every thousand owner-occu-pied housing units.51 While this number was higher than that of any other county in Pennsylvania except for Monroe (a county that has seen numerous allega-tions of housing fraud as well as three recent state attorney general cases),52 foreclosures in Philadelphia are by no means spread evenly around the city. For this study, rather than giving a general rate for Philadelphia, we compared fore-closure rates for each census tract in order to discover the extent to which dif-ferent neighborhoods have been affect-ed by foreclosures.53
In examining foreclosures by census tract, we noted a familiar yet striking im-balance in their distribution by neighbor-hood. Excluding tracts with fewer than a hundred housing units, seven census tracts saw only one foreclosure each over the past four years. In the largest of these tracts, this works out to fewer than two foreclosures per thousand owner-oc-cupied units, or one-fifth of one percent of the total number of owner-occupied housing units. On the other end of the
spectrum, in 29 census tracts, at least a hundred homes experienced a foreclo-sure for every thousand owner-occupied units; this amounts to at least ten percent of the tract’s housing stock. There were
a Bane amId the housIng Boom: rIsIng forecLosures
By Michael Powell Washington Post Staff Writer Monday, May 30, 2005; A01 PHILADELPHIA -- To walk Thayer Street in northeast Philadelphia is to count, door by door, the economic devastation afflicting a working-class neighborhood. On a single block, 18 of the 42 brick rowhouses have gone into foreclosure in the past three years. There’s Marciela Perez, who fell ill with cancer, lacked health insurance and stopped making mortgage payments. Barrel-chested Richard Hidalgo, who got divorced and could no longer make his monthly nut. And Mike O’Mara, a raw-boned and crew-cut truck driver who took on too much debt, lost his job and fell behind on his mortgage. “Mortgage companies convinced us to refinance, and each time our bill went up,” O’Mara said as he surveyed his narrow street from his shaded front porch. “You fall behind and they swoop down on you.” Philadelphia, its suburbs and indeed much of Pennsylvania have experienced a foreclosure epidemic as low-income homeowners take on mortgage debt they cannot afford. In 2000, the Philadelphia sheriff auctioned 300 to 400 fore-closed properties a month; now he handles more than 1,000 a month. Allegheny County, which includes Pittsburgh, had record auctions of foreclosed homes, and officials speak of a “Depression-era” problem. The foreclosures fall particularly hard on black and Latino families.

Pressure on aPPraIsers
“Give them what they want or the phone stops ringing.”
An appraiser interviewed for this study relayed why there is now a greater risk for appraisal fraud than there used to be. In the days when local banks made loans, he said, there was no incentive for a bank to put pressure on an appraiser to inflate the value of a home. To a loan officer in a traditional bank, it did not make a personal economic difference whether a loan was approved or not; the loan officer was paid the same salary either way. And, as most banks kept the mortgages they made, a bank that made question-able loans would be putting itself at unnecessary risk.However, in today’s lending environment, the salaries of brokers and loan officers are oftentimes based on the volume of loans they originate. With a much smaller personal investment by these loan salespeople in the “success” of a particular loan, a noticeable shift has occurred in the relationships between appraisers and mortgage brokers and mortgage lenders. The appraiser we interviewed noted that the dynamics have changed considerably. Now, it is not uncom-mon for a lender to call an appraiser and say, “I see you did an appraisal for Ms. Smith that valued her property at $19,000, but she needs a $25,000 loan. Can you find some additional value?” The lender is trying to direct the appraiser’s determination of the property’s value. The appraiser is then faced with a stark choice: to refuse to do the new appraisal, most likely forfeiting future work from that lender, or to accept the job and create a false appraisal.
Page �� • Lost VaLues: A Study of Predatory Lending in Philadelphia
tracts in which 16, 17 and 19 percent of the housing stock entered the foreclo-sure process. Driving around some of Philadelphia’s neighborhoods with the highest concentration of foreclosures is visually stunning; on a single small block of row homes, nine, ten or even eleven homes may have been in foreclo-sure between 2000 and 2003, and often one sees multiple foreclosed homes in a row.54
The amount of loan principal due at the time of foreclosure also varied by neighborhood. In low-priced areas, the average principal amount due dramati-cally exceeded the average estimated value of the homes in foreclosure; in
moderate-priced areas, the average prin-cipal amount was slightly less than the average estimated value; in middle-priced areas, the average principal amount was approximately 81 percent of the average estimated value; and in
Figure�7.4��Map�of��Foreclosures�on�Thayer�Street�and�Surrounding�Blocks

Number of Foreclosed Properties per 1000 Owner Occupied Units
0
50
100
150
200
250
East Mt. AiryEast Mt. AiryPennsportort
West KensingntonWest Kensingnton
GlenwoodGlenwood
WynnefieldWynnefield
HarrowgateHarrowgate
Juniata ParkJuniata Park
RoxboroughRoxborough
BustletonBustleton
high-priced areas, the average principal amount was 68 percent. These numbers differ by type of lender. Among the total number of loans in foreclosure originated by prime lenders, the average principal amount was 77 percent of the average value of homes in foreclosure, while among loans in foreclosure originated by subprime lenders, the average principal amount was 91 percent of the average value of homes in foreclosure.55
Why did so many homes in foreclosure have principal amounts due that exceeded average home values? There are two possible factors that could explain the situation: drops in home prices since the mortgages were originat-ed or initial loans made in excess of the homes’ value.56 Data on housing prices
Fig.�7.5�Number�of�Foreclosed�Properties�per�Thousand�Owner-Occupied�Units
in Philadelphia suggest that prices in lower-value areas were relatively stable in the 1990s and recently experienced a modest rise. This suggests that overvalu-ation is a stronger explanation than de-clines in home prices for the presence of so many excessive loans.
As our graph indicates, in certain areas, foreclosures are still a rarity, most likely caused by factors such as illness, divorce or job loss. However, in other neighbor-hoods, where up to 19 percent of the housing stock went into foreclosure over a four-year period, it is arguable that some lenders ignored indications that borrowers might be unable to consistent-ly repay their mortgage, making foreclo-sure a far-from-unique event.
Page �� • Lost VaLues: A Study of Predatory Lending in Philadelphia
7. f
or
ec
Lo
su
re
s a
nd
Pr
ed
at
or
y L
en
dIn
g: T
he Nexus

how often does Predatory lending in Philadelphia lead to mortgage foreclosures and Sheriff Sales?
Now we turn to the matter with which we opened this section of our report. As stated previously, if predatory lending strips equity and leaves borrowers in a financially precarious position, it is rea-sonable to assume that indicators of predatory lending will be more prevalent among properties in foreclosure than among a random sample of Philadelphia properties. To examine this question, we compared mortgage transaction histories of all properties with a foreclosure filing from 2000 to 2003 (approximately 13,500 properties had enough information to be tested) against our random sample of 2,289 Philadelphia properties. We then tested these two sets of properties for indications of rapid refinancing and over-valuation; the data did not support a test for the third measure (i.e., refinancing suggestive of equity loss).
Our findings were varied and revealing. The citywide sample and the foreclosure properties showed a similar frequency of three loans attributed to the owner in question (17.3 percent for properties in foreclosure and 16.5 percent for the city-wide sample). Thus the two sets of prop-erties, at first glance, had similar baseline lending activity, revealing that foreclo-sures are not occurring simply because of a concurrent rise in mortgage activity.
Yet the properties with foreclosure filings from 2000 through 2003 did have substantially higher incidences of our indicia of predatory lending. They mani-fest loan histories indicative of rapid re-financing 12.8 percent of the time, while the random sampling of properties in Philadelphia revealed a history of rapid refinancing 4.6 percent of the time. For those properties with three or more liens attributed to their current owners, over half of all properties in foreclo-sure, 51.9 percent, showed indications of rapid refinancing. For properties in the citywide sample, this percentage was 19.1 percent. Whether compar-ing all properties or only those with three or more liens attributed to their current owner, we found that properties with a foreclosure filing are more likely to experience rapid refinancing than Philadelphia properties in general.
When we looked at whether properties were overvalued, a less clear distinc-tion between properties in foreclosure and Philadelphia properties emerged. For our entire sample of all foreclo-sure properties, 29.8 percent had loans worth more than five times the assessed value of the home.57 For properties in the citywide sample, 18.2 percent mani-fested overvaluation. This is a substan-tial difference. But when the compari-son is restricted to properties with three liens or more, the incidence of potential overvaluation climbed slightly in fore-
Page �0 • Lost VaLues: A Study of Predatory Lending in Philadelphia

Figure�7.6
Comparison of the Frequency of Predatory LendingIndicators For A Sample of Philadelphia Properties
and Those In Foreclosure
Area RapidRefinancing
Properties with 3Liens or More toTheir Owner andRapid Refinancing
Mortgages 5 TimesAssessed Value
Properties with 3 Liens toOwner, and Mortgages 5
Times Assessed Value
Properties with Both RapidRefincing and Mortgages
Five Times Assessed Value
Properties with 3 Liens toOwner, and Both Rapid
Refinancing andMortgages 5 Times
Assessed Value
ForeclosureProperties 12.81% 51.91% 29.78% 31.74% 4.56%
All City Sample 4.62% 19.05% 18.17% 31.22% 2.09%Foreclosures inMiddle/High ValueAreas
12.63% 50.60% 14.34% 13.63% 2.14%
All City inMiddle/High ValueAreas
5.46% 18.25% 15.82% 20.07% 2.06%
Foreclosures inLow/Medium ValueAreas
12.98% 53.23% 44.60% 49.83% 6.89%
All City inLow/Medium ValueAreas
3.59% 21.15% 21.05% 60.58% 2.13%
18.00%
8.20%
7.84%
6.20%
28.15%
13.46%
comparison of the frequency of Predatory lending indicators for a Sample of Philadelphia and those in foreclosure
Page �� • Lost VaLues: A Study of Predatory Lending in Philadelphia
7. f
or
ec
Lo
su
re
s a
nd
Pr
ed
at
or
y L
en
dIn
g: T
he Nexus
closure properties to 31.7 percent and rose substantially for the citywide sample to 31.2 percent.58
A stark contrast between these two sets of properties was revealed when we ex-amined the percentage of properties with evidence of both rapid refinanc-ing and potential overvaluation. For the properties in foreclosure, 4.6 percent showed both signs of predatory lending, while 2.1 percent of citywide properties did so. When we restricted our com-parison to properties with three liens at-tributed to the current owner, we found that 18 percent of foreclosure proper-ties tested positive for both measures of predatory lending, while 8.2 percent of the citywide sample properties did so.
We also divided properties into groups based on the home values of the area in
their locations. This comparison revealed that properties in foreclosure in low- to moderate-value areas were more than twice as likely as the random sample of properties in these areas to manifest multiple indicators of predatory lending. Fully 28.2 percent of properties in fore-closure between 2000 and 2003 that are located in Philadelphia’s low- to moder-ate-value areas ended up in foreclosure after experiencing multiple indications of predatory lending.
mArket correctionS
In the past, bankers worked very hard to minimize the likelihood of a foreclosure, since they used their clients’ deposits to make loans. If a high percentage of loans went into foreclosure, a local bank would be in serious financial trouble. However, in the new world of risk-based

“seLL to your emotIon… seLL the dream”
Although we have focused much atten-tion on mortgage brokers when discussing predatory lending, it is worth noting thatmany subprime loans are made by loanofficersemployedbythemortgagecompa-niesthemselves.One former loanofficeratanational sub-prime lender stated in an interview thatloansarepushedhardoncealeadisfound.Hestated that,uponreceiving leads, loansolicitorsbegin “badgering thehell”outofpotential borrowers, calling them at leastfour timesper day.He said that loanoffi-cersaretaughtveryspecificwaystomarkettheir loans, fromalways includingacash-out provision to selling to the borrower’semotions-to“sellthedream.”This former loan officer stated that, whilecompany underwriters were supposed tobe the last line of defense against inap-propriateloans,officialsfromthismortgagecompanyexamined their loandefault rateon a regular basis; if this rate was lowerthan those of their competitors, they tookthisasanindicationthatloanofficerswerenotmakingenoughloansonthemargin.
Page �� • Lost VaLues: A Study of Predatory Lending in Philadelphia
pricing and loan packaging into sub-prime mortgage-backed securities, sub-prime lenders can tolerate a far higher rate of foreclosure, because investors in a riskier loan pool can be shielded from the added risk of those loans [Engel, K., et al. (2004)]. Still, despite the subprime lenders’ ability to charge borrowers for the increased risk of less secure loans as well as to profit, potentially, from rates and fees higher than any commensurate risk, there is a rate of default that a sub-prime lender cannot tolerate.
Here, our suggestion that many of the loans in foreclosure from 2000 to 2003 are from a similar pool of loans, many made by subprime lenders who have since gone out of business, becomes particularly relevant, and it is easily test-able. We divided subprime foreclosures into two groups: those loans made by subprime lenders who are still in business and those with loans made by subprime lenders who have left the market. The results support our assertion. Of loans originated in 1998 that were subject to a foreclosure between 2000 and 2003, for example, seven of the top twenty-five (as well as three of the top five and five of the top ten) subprime lenders with loans in foreclosure have since closed.59 Together, their loans account for 27 percent of all failed 1998 subprime loans and 21 percent of all failed 1998 loans in our sample.60 The top 25 subprime lenders with loans in foreclosure (whether
currently in or out of business), repre-sent 45 percent of filings tracked to 1998 loans.
The seven subprime lenders that have since closed represent a significant portion of 2000 to 2003 foreclosure filings. While the fact that these lenders have since closed may indicate that there was some market correction,61 the impact of their loans continues to be felt today. For example, Equicredit, which stopped making loans by 2000, had a

Figure�7.7
Status of Subprime Lenders with Highest Numbers of 1998 Loans in Foreclosure 2000-2003
Rank Lender Current Status1 Equicredit Corp/PA Closed2 Gelt Financial, Inc. Closed3 Columbia National, Inc.4 Equity One, Inc.5 Pacific T & L Closed6 Boulevard Mortgage/PA7 Central Money Mortgage Co., Inc. Closed8 United Companies Lending Corp. Closed9 WMC Mortgage Corp.
10 Eastern Mortgage Services, Inc.
Status of Subprime lenders with highest numbers of 1998 loans in foreclosure 2000-2003
bigger share of Philadelphia’s 2003 fore-closures (9.9 percent of identified loans in foreclosure) than it did of foreclosures in 2000 (8.5 percent), 2001 (4.5 percent) or 2002 (7.9 percent). In other words, al-though thinking of the demise of par-ticularly risk-taking subprime lenders as a market correction may be consistent with economic theory, the devastating
aftermath of the loans they made shows that waiting for subprime lenders to fail leaves behind many thousands of strug-gling homeowners. Many of those hom-eowners have now lost homes and few have acceptable remedies readily avail-able to them (e.g., defending a foreclo-sure action against a lender now out of business).
Page �� • Lost VaLues: A Study of Predatory Lending in Philadelphia
7. f
or
ec
Lo
su
re
s a
nd
Pr
ed
at
or
y L
en
dIn
g: T
he Nexus

Page �� • Lost VaLues: A Study of Predatory Lending in Philadelphia

Conclusions: Salient Findings and the Policy Shifts they Suggest
In this study, TRF set out to define, measure and describe the extent to which preda-tory lending exists and affects specific communities in Philadelphia. We found that predatory lending can in fact be defined and that it can be examined and viewed more precisely than is suggested by the typical equation: predatory lending = sub-prime lending. The data used to arrive at these conclusions are both quantitative and qualitative, and all of the quantitative data are available from sources that the public can, given adequate time and resources, access. The most salient findings from our research are:
• Patterns of lending suggest rapid refinancing in 4.7 percent of homes in Philadelphia. 19.0 percent of homes with three or more liens exhibit this pattern. In low- and moderate-value areas, the percentage is 3.6 percent. It rises to 9.0 percent in medium- and high-value areas.
• Refinance patterns suggestive of equity loss, when the current owner has three or more loans connected to their home, is present for 16.3 percent of properties. In low - and moderate-value areas, the percentage is 20.4. In areas with medium-value homes, the percentage drops to 16.3; it drops further to 12.8 in high value areas.
• Eighteen percent of homes in Philadelphia had loans that exceeded the estimated value of the collateral property. In low-value areas, the percent is 12.5; in moderate-value areas, it is 23 and in medium- and high-value areas, the percentages are 16.7 and 13.4 respectively. Where three or more liens are present the percentages are 50.0, 50.9, 23.1, and 15.8 respectively.
• Looking collectively at all of our three indicators of predatory lending we found that 22.9 percent of homes in Philadelphia manifest at least one of the three indicators; that percentage rises to 50.9 percent if the current owner has three or more loans tied to the house.
Page �� • Lost VaLues: A Study of Predatory Lending in Philadelphia
8. c
on
cL
us
Ion
s: Salient Findings and the Policy Shifts they Suggest

Page �� • Lost VaLues: A Study of Predatory Lending in Philadelphia
• The data show that 3.1 percent of homes have two or more indicators; that percentage is 14.1 when the current owner has three or more loans.
It is not sufficient to simply document indicators of the existence of predatory lending; the consequences are impor-tant to quantify as well. To that end, we observed one of the measurable conse-quences of predatory lending: a mort-gage foreclosure. Our findings with respect to predatory lending as a con-tributing factor in mortgage foreclosure are as follows:
• Foreclosures, like the various indicia of predatory lending, tend to occur in areas of the city with home prices in the more modest range. While 4.8 percent of foreclosures occurred in Philadelphia’s lowest-value areas, 46.6 percent occurred in moderate-value areas, 45.2 percent occurred in medium-value areas and 3.4 percent occurred in areas with the highest-value homes.
• Foreclosures, like predatory lending, occur disproportionately with homeowners whose mortgage loans are subprime. TRF found that fully 72 percent of loans in foreclosure between 2000 and 2003 in Philadelphia were originated by lenders that originate mostly or exclusively subprime loans.
• Indicators of predatory lending are more prevalent among homes in fore-closure. While the citywide sample of
homes reflected 4.6 percent of homes with evidence of rapid refinancing, 12.6 percent of homes in foreclosure manifested that pattern. Where the current owner has three or more loans, the percentages rise to 19.1 and 50.6 percent respectively.
• Among the citywide sample, 18.2 percent had mortgages that ex-ceeded the likely value of the home. That percentage among properties experiencing foreclosure was 29.8 percent. Where the current owner had three or more loans, the percentages rise to 31.2 percent and 31.7 percent respectively.
• Overall, properties in foreclosure are more likely to manifest two indica-tors of predatory lending. Where the home has three or more loans to the current owner, 18 percent of foreclosure properties compared to 8.2 percent of the random sample of Philadelphia properties exhibited a financing history consistent with prior predatory lending.
Accepted economic theory suggests that, if a lender makes loans that borrow-ers cannot afford and that subsequently go into default, that lender will either have to change its business practices or soon go out of business. Our research suggests that many of the lenders with the most substantial market share of fore-closures in Philadelphia between 2000 and 2003 have gone out of business or been purchased by another lender and closed down. The data suggests that,

Page �� • Lost VaLues: A Study of Predatory Lending in Philadelphia
8. c
on
cL
us
Ion
s: Salient Findings and the Policy Shifts they Suggest
among the lenders with most foreclo-sures, five are no longer originating loans. But their cessation of originating loans does not solve the larger problem of what each foreclosure means to the borrower, the investor and the borrower’s community. Any predatory loans originat-ed by the now-closed mortgage lenders continue on, with borrowers who contin-ue to make payments when possible or who will experience foreclosure.
What is an appropriate response to this problem? The goal of any public policy response should be to extinguish what we call predatory lending without unnec-essarily restricting the flow of capital into communities where such capital is the lifeblood62 of its housing and residents. It is reasonable also to expect that the borrower will take personal responsibility for their mortgage transactions and there are ways to help them make better loan decisions that they are more likely to be able to live with. And finally, it is reason-able to believe that a complementary set of laws and regulations at state and federal levels could govern lending ac-tivities; that kind of interconnected com-bination of laws and regulations exists now but is inadequately enforced.63 We believe that the following recommenda-tions, based on our analysis of data and interviews with subject matter experts, represent a reasonable approach to com-bating predatory lending in the mort-gage market:
Enhance the ability of consumers to make decisions.
• Recognize that consumer education is neither a quick nor a certain fix. Those who prey on individuals can do so even if people have the rudi-ments of financial literacy provided by mortgage and/or financial literacy counseling.64 However, in the long run, if education is properly designed and implemented, an informed con-sumer may be better able to protect herself.65
• Simplify and clarify the current array of notices that consumers receive during application and closing processes.
• Assign mortgage brokers a fiduciary obligation to the borrower.
• Create a legal safe harbor for closing agents who, in good faith, provide borrowers with an oral explanation of the transaction at hand when they suspect that the borrower does not fully comprehend the transaction he or she is about to complete.
• Although HUD currently certifies a group of mortgage counselors, the threshold for certification should be enhanced, with greater attention paid to the substantive capabilities of the supported agencies. In addition, a financial incentive should be added to encourage organizations to provide training that meets or exceeds the newly established quality thresholds.

Page �� • Lost VaLues: A Study of Predatory Lending in Philadelphia
Set a federal legislative threshold for predatory-lending laws that states can adopt or exceed.
• Several variants of a federal predato-ry-lending law have been (and are cur-rently) a part of the legislative debate. Several laws that have been proposed and discussed would preempt existing state law. Yet sound empirical research to date suggests that the state laws that exist have not, on balance, had the dire market effects that their critics warned against; in fact, these state laws have done a reasonable job of curtailing predatory lending without drying up mortgage credit [cf., Li, W., et al. (2006); Ho, et al. (2005); Quercia, R., et al. (2003); Burnett, et al. (2004)]. Accordingly, rather than create a federal law that preempts the state laws, utilize a strategy of setting a federal legislative threshold that the states must meet or exceed to retain the right to pass their own legislation.66 As Relman, J., et al. (2004) state, “Balancing the equities on this issue requires a true compromise. Federal legislation must contain enough of the meaningful reforms found in the most progres-sive of the new state laws to satisfy advocates, but it must at the same time guarantee a uniform floor of protection nationwide. The essence of this compromise will require using a carefully drafted preemption provision to create a national floor consisting of the most important protections, without imposing a federal ceiling on the development or implementation
of enhanced protections by more progressive state legislatures” (p.172).
Establish a suitability standard for mortgage lending.
• What becomes clear in the course of interviews with borrowers and industry people alike is that consum-ers often end up with products that are not appropriate to their given circumstance. Either they do not understand the product or do not have the financial wherewithal to deal with the mortgage as its various features unfold over time. Notices can be made better and consumers more knowledgeable through educa-tion and counseling. Those alone will not amply protect consumers. Accordingly, we encourage policy makers to revisit the concept of a suitability standard for the mortgage transaction. The mortgage is the single largest transaction most people enter into and it is the one that, if inappropriate, can be most financially disastrous.
Many have lined up on either side of this debate: lenders individually and collectively through associations such as the Mortgage Bankers’ Association of America have taken public posi-tions against a suitability standard and consumer advocates have argued in favor; federal financial regulatory agencies were careful to not even give the appearance of creating a suit-ability standard for regulated financial institutions. Yet the arguments against such a standard are not sufficient

Page �� • Lost VaLues: A Study of Predatory Lending in Philadelphia
8. c
on
cL
us
Ion
s: Salient Findings and the Policy Shifts they Suggest
to outweigh the benefits. A prop-erly crafted and enforced suitability standard will increase the likelihood that a borrower gets a product that is understandable and appropriate to their circumstance. That alone should reduce the volume of loan delinquen-cies and foreclosures that cost lenders and investors greatly.67,68
Vigorously enforce existing laws.
• While the successful passage of a law is a tangible outcome, the law’s real impact occurs not with passage but with enforcement. To date, two federal agencies have had notable success prosecuting cases of predatory lending – the Federal Trade Commission and the Department of Justice. Because of the complexity of investigating these cases, the DOJ and the FTC should be encouraged to provide investigative and pros-ecutorial assistance to state agencies investigating alleged cases of preda-tory lending.
Create competing small loan products.
• The economics of making small loans is difficult because the cost of origination exceeds what can reason-ably be charged or recovered from the borrower. It is reasonable that the true risk of a transaction can and should be charged to the borrower. However “smart subsidy” could be used to reduce the costs associated with making small-balance loans so that they can be made profitable to
the originator and affordable to the borrower. Given what we know about the effects of GSEs on the market, bringing the GSEs into the process as the bundler and securitizer of these loans should help standardize and thereby reduce their costs.
Make appropriate data more readily available.
• Studying predatory lending is a daunting task. That is partly because a workable definition of predatory lending has been elusive and also because the data to test any reasonable set of indicators of that definition has been even more difficult to obtain. Putting aside the shortcoming of HMDA data because the sequence of loan transactions on a property is not known, Congress and consumer/community activists attempted to enrich the database by including information on the loan’s lien and HOEPA statuses as well as limited information on loan pricing. Those data became publicly available for the first time with the 2004 HMDA data. There is however no information on the value of the collateral property or any credit characteristics of the borrower.
Aside from the property data TRF was able to collect, which is not available in all locales across the country, the other information that would further our understanding of predatory lending is the HUD-1 settlement sheet. The HUD-1 is important because it shows all fees the borrower

Page �0 • Lost VaLues: A Study of Predatory Lending in Philadelphia
paid to obtain their loan and it also shows what other, if any, debt the borrower included in his or her loan. Although the Real Estate Settlement Procedures Act (RESPA) requires HUD-1 retention for five years, for all practical purposes, the HUD-1 is not collected and stored in any central repository. RESPA allows the HUD-1 to follow the loan to another entity if the original lender does not have an interest in the loan or does not service the loan. At a minimum, the original lender should be required to retain and archive HUD-1s for originated loans for the full five years. If lenders did that, regulators could more ef-fectively monitor lenders and brokers for abusive lending practices.
TRF’s experience with the Pennsylvania Department of Banking made clear that even a highly mo-tivated regulatory agency was hard pressed to get these documents to address an urgent foreclosure issue in Monroe County, PA. These docu-ments are absolutely necessary and must be readily available for monitor-ing and enforcement purposes.
• Another critical piece of informa-tion is the property appraisal report. Currently, the Equal Credit Opportunity Act gives borrowers the right to their appraisal either as a matter of course or by written request; generally borrowers do not have those reports. TRF’s experience with lenders, regulators and borrow-
ers demonstrates the difficulty of obtaining these documents ex post facto. As a matter of course, lenders should be required to provide the full appraisal report to the borrower at or before closing the loan.
The implication of TRF’s extensive re-search in Philadelphia is that predatory lending – by any name – is a demonstra-ble phenomenon with verifiable nega-tive effects on people and markets. And while our estimates are just that - esti-mates – they are systematically derived using comprehensive, objectively gath-ered data and transparent methods. We did not explore systematic infor-mation related to price or to the exact circumstances under which a loan was made; those are available only to lenders and to a lesser extent, regulators. Assuming that the estimates are reason-able, what remains is the enactment of an appropriate set of properly tailored public policy responses that maximize the ability of consumers to attain sustain-able homeownership and the mortgage industry to prosper.

Page �� • Lost VaLues: A Study of Predatory Lending in Philadelphia
Appendix A: home mortgage disclosure Act Analysis, Philadelphia, 2002
The Home Mortgage Disclosure Act (HMDA) was initially enacted by the United States Congress in 1975. Over the next thirty years, Congress amended HMDA nu-merous times, typically broadening both its coverage and the depth and detail of information that lending institutions were required to report.69 In this appendix, we describe the HMDA data for calendar year 2002 – a representative year for our preda-tory lending and foreclosure analyses. The HMDA data were segmented into two groups based on the characterization of a lender as specializing in prime or subprime lending. This characterization was made by the United States Department of Housing and Urban Development.70
Subprime mortgage lending in PhiladelphiaUsing data from the 2002 HMDA reports for the city of Philadelphia, we observe that 12.3 percent of all home-purchase mortgage loans were originated by subprime lenders; 18.3 percent of refinances originated with subprime lenders. The proportions of prime and subprime vary dramatically by the average income level in census tracts. Specifically, as incomes increase, so too does the percent of loans that is prime. In the 2002 data, in low-income tracts (tracts with a median income below 50 percent of the metropolitan statistical area average), 13.4 percent of home-purchase mortgage loans are subprime; in moderate-income tracts (tracts with incomes between 50 percent and 79 percent of the MSA average), 19.0 percent of home-purchase mortgage loans is subprime; in middle-income areas (tracts with incomes between 80 percent and 119 percent of the MSA average), 10.4 percent of home-purchase mortgage loans is sub-prime and in high-income tracts (tracts with incomes greater than 120 percent of the MSA average), 5.5 percent of home-purchase mortgage loans is subprime.71
Subprime activity in Philadelphia is generally more prevalent among mortgage refi-nances. And, as with home-purchase mortgage loans, the rates of prime and sub-prime mortgage refinances vary by the income level of the city’s census tracts, with lower-income tracts having higher rates of subprime lending. In low-income tracts, 29.4 percent of refinance mortgages are subprime; in moderate-income areas, 25.3 percent are subprime; in middle-income areas, 16.1 percent are subprime and in high-income areas, 8.9 percent are subprime.
The mere presence of a subprime loan does not mean that a borrower has been sold a less-than-appropriate product. To the extent that a borrower’s credit, income and collateral justify the subprime loan, its use is entirely appropriate. When the borrow-er’s credit is not flawed or when no other adverse aspect is evident in the borrower’s
aP
Pe
nd
Ix a

Page �� • Lost VaLues: A Study of Predatory Lending in Philadelphia
application, however, the presence of a subprime loan indicates a transaction that is clearly disadvantageous to the borrower. 72,73
It is particularly important to examine HMDA data to assess the array of institutions most active in the lower- and moderate- income communities as opposed to those in the middle- and higher-income places. The substantial penetration of subprime lenders into lower- and moderate-income markets represents a double-edged sword. While lenders are making credit available, they are doing so at a price that may not be justified by a borrower’s actual financial status. Williams, et al. (2001) said it well: “As classical economic theory would predict, a deregulated marketplace has made it possible for low-income and minority groups to get credit like never before. This has helped them to achieve record rates of home ownership and to also get loans for any number of other purposes. But, as sociological network theories suggest, the new lenders are quite unlike the old ones. As a result, the gains made by underserved markets have come in very different ways than those made by the rest of American society. For better or for worse, as the old inequalities have slowly diminished, new in-equalities have replaced them” (p. 29).

Page �� • Lost VaLues: A Study of Predatory Lending in Philadelphia
AppendixB:WhoGetsWhatKindofLoaninaMortgageRefinance?
One might argue that the refinance and consolidation of various forms of debt into a mortgage gives advantages to the borrower by making the interest they pay on that debt tax deductible. However, there is research to suggest that people at lower income levels are less likely to itemize their deductions and thus may not be reaping those benefits.74 Further, it is not uncommon to find borrowers who have rolled small, short-term, unsecured debt into home mortgages. While this may lower monthly payments, it raises long-term debt and removes equity from the home. In addition, it makes the impact of any household financial stressor, even a minor one, far more serious because the borrower’s home now hangs in the balance.
Thus we see again how the type of mortgage refinance one is sold can have a tre-mendous impact on one’s financial security. While the mere existence of a subprime refinance may not indicate that the borrower has an inappropriate loan product, transitioning from a prime to a subprime loan would typically reflect conversion to a more expensive loan product. Using our sample of properties, we determined that among properties that started out with a prime loan and had that loan refinanced, 66.6 percent refinanced into a prime loan, 27.9 percent refinanced into a subprime
aP
Pe
nd
Ix B
Likelihood of a Specified Refinance Pattern By Area Housing Value
0
10
20
30
40
50
60
70
80
90
100
Low/Mod Med High
Area Housing Value
Perc
ento
fRef
inan
ces
P -> P
P = Prime S = Subprime
P -> S S -> P S -> S
LikelihoodofaSpecifiedRefinancePatternbyAreaHousingValue(P= Prime, S=Subprime)
Figure�B.1

Page �� • Lost VaLues: A Study of Predatory Lending in Philadelphia
loan and 5.6 percent refinanced with a lender that could not readily be identified as prime or subprime (i.e., these lenders did both sorts of lending).75 Among properties that started with a subprime loan and refinanced, 29.0 percent ended up with a prime lender, 66.7 percent ended up with a subprime lender and 4.3 percent ended up with a lender doing both sorts of lending.
The refinance pattern varies depending upon the location of the property; local home values have a strong effect on the likelihood of a prime to subprime refinance. In a lower-price area, that rate is 34.8 percent, substantially higher than the 12.5 percent rate seen in higher-price areas. The refinance pattern reflective of so-called credit repair (subprime to prime loan refinances) is far more prevalent in higher-value areas (42.9 percent) than in lower-value areas (20.7 percent).

Page �� • Lost VaLues: A Study of Predatory Lending in Philadelphia
aP
Pe
nd
Ix c
AppendixC:ExtentofGovernmentSponsoredEnterprise(GSE)Benefitinlower-income communities
When Congress established the Fannie Mae Corporation (and later Freddie Mac), it had several intentions. One was to create liquidity in the home mortgage market; another was to provide for standardization and market efficiencies within that market, with the understanding that those efficiencies would translate into advantageous pricing for borrowers. But because subprime loans are not generally purchased by the nation’s GSEs, although that is now changing, the logical inference is that commu-nities of lower income are less likely to derive the economic advantages that the GSEs afford to higher-income communities. Temkin, et al. (2002) and Ambrose, et al. (2002) suggest that, if GSEs were to get more actively involved in the subprime market, the price differential in rates, points and fees between prime and subprime home mort-gages would decrease.
But that has not yet occurred at great scale. Moreover where the GSEs have gotten involved in subprime lending it has tended not to involve itself with the most risky borrowers. In Philadelphia in 2002, the percent of home-purchase mortgage loans purchased by GSEs in low-income areas was 37.5; in moderate-income areas, the percent was 36.4; in middle-income areas, the percent was 43.1 and in high-income
Percent of Conventional Loans Purchased by GSEs; Philadelphia, 2002
0
5
10
15
20
25
30
35
40
45
50
Low Mod Mid Upper Total
Purchase Money Mortgages Refinance Mortgages
Percent of conventional loans Purchased by gSes; Philadelphia, 2002
Figure�C.1

Page �� • Lost VaLues: A Study of Predatory Lending in Philadelphia
areas, the percent was 39.8. The percent of home-purchase mortgage loans pur-chased by “other” purchasers (neither a FSA, a commercial bank, a savings bank or savings institution, a life insurance company or an affiliate institution) in low-income areas was 26.5; in moderate-income areas, the percent was 29.3; in middle-income areas, the percent was 26.9 and in high-income areas, the percent was 29.4.
GSEs purchased 15.3 percent of refinance mortgages in low-income areas, 20.8 percent in moderate-income areas, 28.9 percent in middle-income areas and 35.0 percent in high-income areas. The percent of refinance mortgages purchased by “other” purchasers in low-income areas was 23.2; the figure was 21.3 percent in mod-erate-income areas, 18.4 percent in middle-income areas and 24.5 percent in high-income areas. (Figure C.1)
These data, deriving from the 2002 HMDA reports, reflects only GSE purchases of loans reported into HMDA. An untold number of the subprime loans are not record-ed in the HMDA database and so the figures reported likely overstate GSE activity in the low-income areas.

Page �� • Lost VaLues: A Study of Predatory Lending in Philadelphia
en
dn
ot
es
endnotes
1 http://www.gop.com/media/2004platform.pdf
2 The statement in the Republican Platform (“For the first time, more than half of all minorities own their home.”) is not supported by the data. While there have been marked improvements in the minority homeownership rate, census data for the year 2000 show that approximately 46 percent of all minorities owned their homes, while American Community Survey estimates (2005) show that approximately 48 percent of all minorities (45.8 percent of African Americans and 48.3 percent of Hispanics) own their homes. The per-centage of Whites owning their homes exceeded 71 percent in both 2000 and 2005.
3 http://www.democrats.org/pdfs/2004platform.pdf
4 See McCarthy, G., et al. (2001) for a comprehensive review of the literature on the economic costs and benefits of homeownership and how they differ across racial and economic lines. See Rohe, W., et al. (2000) for a similarly comprehesive review of the literature on the social effects of homeownership.
5 The presence/absence of assets was derived by TRF through the identifi-cation of households (via the Census Public Use Microdata Sample, 2000) declaring that at least one source of income was interest/dividends. For the purposes of this estimation, a house-hold was categorized as having assets if members stated that they received over $100 per year in interest or dividends. This is thus a very conservative estimate of the presence/absence of assets.
6 See, for example: Calem, P., et al. (2004); Massachusetts Community and Banking Council (2005); Bradford
(2002); ACORN (2002); and Canner, et al., 1999. More recent publica-tions have elaborated upon the basic HMDA analysis by taking account in-formation related to Home Ownership and Equity Protection Act of 1994 (“HOEPA”) and lien status and pricing. See, for example: Avery, R., et al. (2005); Fishbein, A. (2005); and National Community Reinvestment Coalition (2005).
7 See U.S. Department of Commerce, Bureau of the Census (2005) and U.S. Department of Commerce, Bureau of the Census (2000).
8 Census data indicate that approxi-mately 58 percent of the city’s 660,000 housing units were built prior to 1950. In the last decade, rental housing con-struction outpaced owner-occupied housing more than two to one. Much of that construction was subsidized by one or another form of governmental housing subsidy.
9 http://www.centercityphila.org/docs/socc05_Residential.pdf
10 Philadelphia City Planning Commission, (2005), “City Stats: General Demographic and Economic Data.”
11 The Index of Dissimilarity (“D”) is a widely used measure of segregation. The D value itself measures the per-centage of a specific racial group that would need to move from its current residential location to another in order to achieve racial uniformity across the entire area. In the case of Philadelphia, the calculated D value implies that 76.4 percent of African Americans would need to move in order for the city to achieve uniformity in racial composi-tion. See, for example, U.S. Department of Commerce, Bureau of the Census (2004) for an explanation of some more

Page �� • Lost VaLues: A Study of Predatory Lending in Philadelphia
commonly used measures of segrega-tion. A large region is defined in this Census analysis as having more than 1 million residents in 1980.
12 Although the exact makeup and weight-ing of components of the FICO® scores is not publicly disclosed, the elements of the score are generally understood to include previous credit performance (including mortgage and other credit account types), current level of debt, type and number of credit accounts and length of credit history (Douglas, M., et al., 1998).
13 For this definition, we are assuming that the appraisal fairly represents the market value of the collateral property (although it may not).
14 Standard and Poor’s (2000) estimates that loans with LTV ratios of 95 percent are three times riskier than loans with LTV ratios of 80 percent; loans with LTV ratios of 100 percent are four times riskier than loans with 80 percent LTV ratios.
15 See, for example, Temkin, et al. (2002) or Weicher (1997).
16 See Collins, et al. (2004) for a compre-hensive review of the potential adverse effects attributable to the risk-based pricing typical of the subprime mort-gage market.
17 Albeit imperfect, these computations relied upon the list of lenders that HUD has identified as engaged in the subprime and manufactured housing market (www.huduser.org/datasets/manu.html)
18 Using 2000 HMDA data, the Center for Community Change (2002) reports that the following percentages of refinance loans were subprime in metropolitan areas of Pennsylvania: Sharon, 32.08 percent; Pittsburgh, 31.75 percent; Altoona, 30.36 percent; Philadelphia,
30.11 percent; Scranton—Wilkes-Barre—Hazelton, 25.63 percent; Johnstown, 23.29 percent; Erie, 22.84 percent; Reading, 21.49 percent; Williamsport, 20.90 percent; State College, 19.40 percent; Harrisburg-Lebanon-Carlisle, 18.85 percent; York, 18.65 percent; Allentown-Bethlehem-Easton, 18.30 percent and Lancaster, 17.09 percent. They report the national average as 25.31 percent.
19 See, as representative examples of defi-nitions of predatory lending: Carr, J., et al. (2001); Engels, K., et al. (2002); Ernst, K., et al. (2004) or McCoy (2004).
20 Rent seeking in this context can be un-derstood as predatory lenders using their market strength in certain com-munities (or with certain borrowers) to charge higher interest rates and fees than would be available if a competitive marketplace existed for such transac-tions in these communities.
21 For example, in the conventional prime market, “points” are of two basic types: origination points, which are fees that the lender charges the borrower to make the transaction, and discount points, which are fees that reduce the interest rate. In the subprime preda-tory market, there is generally no such distinction; points are fees that lenders exact from borrowers simply because they can.
22 As Carr, J., et al. (2001) state, “Predatory lenders use target market-ing not to meet the needs of their cus-tomers, but rather to identify house-holds most vulnerable to the lenders’ aggressive or fraudulent behavior.”
23 See, for example, Federal Trade Commission (1999).
24 National Association of Securities Dealers (“NASD”) Conduct Rule 2310, is titled “Recommendations to Customers (Suitability)” and states the following:

Page �� • Lost VaLues: A Study of Predatory Lending in Philadelphia
en
dn
ot
es
(a) In recommending to a customer the purchase, sale or exchange of any security, a member shall have rea-sonable grounds for believing that the recommendation is suitable for such customer upon the basis of the facts, if any, disclosed by such customer as to his [sic] other secu-rity holdings and as to his financial situation and needs.
(b) Prior to the execution of a transac-tion recommended to a non-in-stitutional customer, other than transactions with customers where investments are limited to money market mutual funds, a member shall make reasonable efforts to obtain information concerning:
(1) the customer’s financial status;
(2) the customer’s tax status;
(3) the customer’s investment objec-tives; and
(4) such other information used or con-sidered to be reasonable by such member or registered representa-tive in making recommendations to the customer.
25 See http://www.nationalfairhousing.org/html/Articles/Commonwealth%20of%20Pennsylvania.pdf for a copy of the Findings of Fact.
26 Mendez, et al. (2002) report in Stanford’s Law & Policy Review that there is serious question concerning the ability of millions of Americans to read and fully comprehend the docu-ments they sign as part of the mortgage lending process.
27 Courchane, et al. (2003) state, “We find that subprime borrowers are less knowledgeable about the mortgage process, are less likely to search for the best mortgage rates and are less likely to be offered a choice among alterna-tive mortgage terms and instruments,
possibly making them more vulnerable to unfavorable mortgage terms.”
28 Brokers interviewed typically re-ported having agreements with three to five lenders. With such a crowded mortgage-lending market, it is hard to believe that borrowers are getting access to the best available products with so few choices.
29 One interviewee securitized loans for one of the largest securities firms in the world. When TRF showed him a sample property history displaying a set of loans culminating in one that far exceeds the value of the collateral property, he suggested that the prop-erty owner should just “give up the keys” and subject the lender to the loss it deserves for making that irrational loan. While that sort of “ruthless put” (defaulting immediately when the mort-gage balance exceeds the property value) would indeed make purely eco-nomic sense [c.f., Foster, C., et al. (1985) or Vandell, K. (1995)], the homeowner was more than 75 years old and would have no place to go while exercising that abstract economic option.
30 See, for example, Mansfield, C. (2000).31 Data from the 1998 Survey of
Consumer Finances, as reported by Montalto, C. (2002) to the Consumer Federation of America and the National Credit Union Foundation, demon-strate that households with no or little net asset value were disproportion-ately low income. Montalto reports, “Householders in households with low net assets were younger, less educated, less likely to be White NonHispanic, less likely to be married, and less likely to own their homes, compared to the total population of householders” (p. 2).
32 One interviewee reported that she was referred to one of the nation’s largest subprime lenders over the telephone by

Page �0 • Lost VaLues: A Study of Predatory Lending in Philadelphia
a person attempting to collect a delin-quent credit card bill.
33 Although most states have some sort of licensure or registration process, most do not require the registration of employee originators, nor do most have a continuing education requirement. [National Association of Mortgage Brokers, Model State Initiative (2002)].
34 One broker, a former official of the mortgage broker trade association, stated during an interview that brokers sometimes get customers started with an especially disadvantageous loan product and then offer to help with its refinancing soon after origination with a slightly better (though still bad) loan.
35 The confusion experienced by bor-rowers is certainly reasonable given the dual roles and allegiances of mort-gage brokers. In fact, brokers them-selves can seem confused as to their actual allegiances. In a deposition of mortgage broker Jules Clearfield by Irv Ackelsberg, Esq. (Plaintiff Attorney) in the case Priscilla Fountain v. United Companies Lending Corporation, we observe the following:
BY MR. ACKELSBERG:
Q. Mr. Clearfield, I do have some other questions of a general nature but -
A. Before we get to that, you know, there’s one point I wanted to bring up when you were hassling me about customers and you got me confused who my cus-tomers were.
Q. Mr. Clearfield, it certainly wasn’t - there was no intent to be hassling or meddling.
A.You were hassling me. You kept who are your customers. And I just want to bring out the contractors, I consider them my clients. The customer who gets the loan, I consider them my customers. I just want to separate the two.
Q. Well, now you have me completely con-fused. What’s the difference between your client and your customer?
A. The clients are people I have dealt with up through the years that I went along with to service them and help them in their field just like a doctor or an at-torney has clients. They would be my clients. The customers would be the people who needed the money who are actually the lending sources who needed the money to do whatever purpose it was, whether it was financ-ing, home improvement. They’re the customers.
Civil Action 96-8095 in the United States District Court for the Eastern District of Pennsylvania.
36 Many other American cities and coun-ties are covered in the RealQuest data-base. For a comprehensive listing, see www.realquest.com.
37 See www.huduser.org/datasets/manu.html.
38 See, for example, U.S. Department of Housing and Urban Development (2000).
39 The spatial distribution of the sample properties is as follows: 7.7 percent are in low-priced areas, 35.0 percent in moderate-priced areas, 46.7 percent in middle-priced areas and 10.0 percent in high-priced areas. These figures and other sample-property characteristics are sufficiently comparable to the distri-bution of properties and other property characteristics in the city as a whole as to allow TRF to believe that our analy-sis of our random sample produced results representative of the city of Philadelphia.
40 Among those properties, 24.6 percent had a refinance mortgage in the record-ed mortgage history. Seven percent of the sample properties had a sheriff sale recorded. The likelihood of a sheriff

Page �� • Lost VaLues: A Study of Predatory Lending in Philadelphia
en
dn
ot
es
sale is higher in lower-priced areas (i.e., areas with median home values under $25,000). The percent of properties in low-priced areas with a sheriff sale in its history is 13.6; in moderate-priced areas (i.e., median home values between $25,000 and $50,000), 10.5; in middle-priced areas (i.e., median home values between $50,000 and $99,999), 4.3 and in high-priced areas (i.e., median home values exceeding $100,000), 2.1.
41 Research has shown that one of the most consistent predictors of foreclo-sure is the LTV ratio [(c.f., Quercia, et al. (1992)]; properties with a higher LTV ratio are more likely to go into foreclo-sure. When the loan exceeds a reason-able property value, one must ques-tion the veracity of the appraisal. Why this scenario is so prominent in areas of below-average property values is an im-portant question.
42 When analyzing lenders who are HMDA reporters, we are able to use the HUD list of reputed subprime lenders. However, for this analysis (and our analysis of mortgage foreclosures), a large number of lenders represented are not (or were not) HMDA reporters. Therefore, we needed to augment the HUD list to include the other lenders. To do so, we reviewed a lender’s ad-vertising, website, corporate filings, and where possible, descriptions of loans within a pool of mortgages. Additionally, we conferred with subject-matter experts who could confirm our designation and/or provide supplemen-tal information on lenders we were oth-erwise unable to locate.
43 See, for example, U.S. Department of Housing and Urban Development and U.S. Treasury Department (2000).
44 For this analysis, the sample is restrict-ed to properties with three or more liens with their current owners.
45 Credit scores depicted here are an adaptation of Experian credit score in-formation for 1999, as reported through PCI Corporation’s CRA Wiz (“the Wiz”). Data reported in the Wiz denoted, by census tract, the number of credit reports categorized as very low risk, low risk, moderate risk, high risk and very high risk. In order to achieve a gross summary measure of the average credit score per tract, we created a weighted average. Each credit report categorized as very low risk was given a 5, each cat-egorized as low risk received a 4, and each categorized as moderate risk, high risk and very high risk received a 3, 2, or 1, respectively. The typical (median) census tract in Philadelphia had a weighted average of 2.55; the weighted average of the highest risk tract (the census tract with the lowest score) was 1.51 and the weighted average of the lowest risk tract (the census tract with the highest score) was 3.89.
46 Data for Philadelphia suggest that, among properties in foreclosure, the median time lapsed between the origi-nal purchase of the property and the foreclosure filing is just under seven years. From loan origination to foreclo-sure filing is approximately four years.
47 Most research to date on this topic has simply coded the “plaintiff” as a prime or subprime entity [cf., Gruenstein, D., et al. (2000[a]); Gruenstein, D., et al. (2000[b]); Burnett, K., et al. (2002); U.S. Department of Housing and Urban Development (2000); U.S. Department of Housing and Urban Development and U.S. Treasury Department (2000)].
48 Census data for Philadelphia indicate that 11.0 percent of homes are valued under $25,000, 26.3 percent are valued between $25,000 and $49,999, 46.2 percent are valued between $50,000 and $99,999 and 16.5 percent are valued at $100,000 and over.

Page �� • Lost VaLues: A Study of Predatory Lending in Philadelphia
49 The estimation of time to foreclosure is significantly longer than the period es-timated by random sample for foreclo-sures from 2000 to 2002 in a previous paper (Goldstein, 2004). In fact, when the data examined is broken up by the year each loan went into foreclosure, it becomes clear that 2003, which was not included in that previous work, is signifi-cantly different from earlier years.
50 Although our methodology differed somewhat and our data allowed us to trace back in most cases to the origi-nating lender, these results do not vary markedly from those reported by Bunce, H., et al. (2001).
51 In the study the “rate” is given for each year separately, not aggregated.
52 See The Reinvestment Fund (2004). 53 Because we were trying to discover
what percentage of each tract’s housing stock had gone into foreclosure, we did two things that may have led us to un-derestimate the extent of the problem. We only counted foreclosures that we could geocode and place on the map, and we only let a single property count once, no matter how many times it had gone into foreclosure. Therefore, the actual rate of foreclosure per tract is likely to be higher than our estimates.
54 See Powell, M. (2005). 55 For a loan amortizing over a thirty-
year period, one would expect that approximately 2 percent of the princi-pal amount would be paid at the end of two years; approximately 5 percent would be paid at the end of five years.
56 One interviewee, a licensed appraiser in Philadelphia, reports that brokers and lenders try to “direct the value of the appraisal.” Appraisers are then confronted with a conflict: should they remain true to their estimates of the property’s value or should they alter
values to give brokers and lenders what they are seeking?
57 Another indicator of potential overvalu-ation is that 27.4 percent of properties in foreclosure between 2000 and 2003 in Philadelphia had a principal amount due at the time of filing, as opposed to the original loan amount, that was over five times the home’s assessed value.
58 The fact that the incidence of potential overvaluation does not rise on foreclo-sure properties when restricted to those properties with three or more liens is not surprising. Because these homes have gone into foreclosure, the particu-lar loan that went into foreclosure and that may have resulted from overvalu-ation is present for all properties, not just for those with three or more liens.
59 In order of numbers of 1998 loans in foreclosure from 2000 to 2003, the out-of-business lenders are Equicredit, Gelt Financial, Pacific Thrift & Loan, Central Money Mortgage, United Companies Lending, the Money Store and Contimortgage.
60 It is important to note that this calcu-lation only looks at market corrections among the top twenty-five foreclos-ing lenders. If lenders other than the foreclosure market leaders have also shut down, the actual figure would be higher.
61 In the equities market, the concept of a market correction is understood to be a reduction in a stock price when the price reflects an overvaluation of the company’s true value. Market cor-rections can be short-term or longer term and mild to severe in result. The analogy here is that the market cor-rected by putting the lenders out of business.
62 Bradford (1979) talked about disinvest-ment and the resulting “…chronic cases of mortgage deficiency anemia infect-

Page �� • Lost VaLues: A Study of Predatory Lending in Philadelphia
en
dn
ot
es
ing the lifeblood of the housing itself.” (p. 325)
63 For example, when Congress amended the Federal Fair Housing Act, it con-templated the fact that state and local governments could pass laws that were “substantially equivalent” to the federal law. When such laws are passed (and they can be more stringent than the federal law – in fact, many state laws do provide greater coverage than the federal law), the federal government refers cases of alleged discrimination in housing to state and local agencies for processing under state/local law.
64 See, for example, U.S. GAO (2004).65 Hirad, et al. (2001) demonstrate the
efficacy of certain prepurchase coun-seling strategies in reducing the likeli-hood of mortgage delinquency. Mallach (2001) concludes that the demonstrable results of such counseling are, at best, ambiguous.
66 Although Cisneros, et al., (2004), in true bipartisan spirit, call for the enactment of a federal law, our proposal is not entirely inconsistent with the reasons they set forth for their proposal for that federal law. They are legitimately con-cerned that a series of state and local legislative responses would inhibit the flow of capital to people and commu-nities who need legitimate subprime lending. Our proposal allows states to tailor their own anti-predatory lending legislation, should they chose to, so that they may both reflect federal law and respond to any unique issues or prac-tices in their housing finance market.
67 The Mortgage Bankers Association of American reports that at the close of the 4th quarter of 2005, fully 5.06 percent of all loans are delinquent; 1.09 percent are 90-days delinquent. Additionally, 0.99 percent of loans are in foreclosure nationally. Pennsylvania’s
numbers are substantially above the national average. The MBAA reports that 5.97 percent of Pennsylvania’s loans are delinquent and 1.35 percent are 90-days past due. The foreclosure percentage is, like the delinquency percentages, above the national rate at 1.59 percent.
68 See Kane (2006) for a review of the arguments for and against a federal suitability standard. Kane’s article is the result of a forum sponsored by the Northeast-Midwest Institute for con-gressional staff, local officials, consumer advocates and representatives of the mortgage lending industry.
69 See http://ffiec.gov/hmda/history2.htm for a legislative and regulatory history of the HMDA.
70 See http://www.huduser.org/datasets/manu.html.
71 The 2000 census reports the median family income for the Philadelphia PA-NJ MSA in 1999 as $58,395.
72 Barr (2004) points out that lower-income people often do not have well-established credit histories and that, as a result, their profiles gener-ally make them difficult to underwrite and thus subject to “alternative financial services.”
73 Carr, J., et al. (2001) report survey results indicating that anywhere from 35 to 50 percent of individuals with subprime loans could have qualified for prime loans.
74 See, for example, Glaeser, E., et al. (2002).
75 These lenders include but are not limited to GMAC, Cendant, and Bank of America, FSB.

Page �� • Lost VaLues: A Study of Predatory Lending in Philadelphia

Page �� • Lost VaLues: A Study of Predatory Lending in Philadelphia
re
fe
re
nc
es
Adams, C, Bartelt, D., Elesh, D., Goldstein, I., Kleniewski, N., & Yancey, W. (1991). Philadelphia: Neighborhoods, Division, and Conflict in a Postindustrial City. Philadelphia: Temple University Press.
Ambrose, B., Thibodeau, T., & Temkin, K. (2002). An Analysis of the Effects of the GSE Affordable Goals on Low- and Moderate-Income Families. U.S. Department of Housing and Urban Development, Office of Policy Development and Research. Retrieved from www.huduser.org.
Association of Community Organizations for Reform Now, Inc. (2004). Separate and Unequal 2004: Subprime Lending in America. Retrieved from www.acorn.org/fileadmin/Community_Reinvestment/Reports/S_and_E_2004/separate_and_unequal_2004.pdf.
Avery, R., Canner, G., & Cook, R. (2005). New Information Reported Under HMDA and Its Application in Fair Lending Enforcement. Federal Reserve Bulletin, Summer 2005, 344-394.
Barr, Michael. (2004). Banking the Poor. Yale Journal on Regulation, 21(1), 121-237.
Baxter, V., & Lauria, M. (2000). Residential Mortgage Foreclosure and Neighborhood Change. Housing Policy Debate, 11(3), 675-699.
Black, H. (1990). Black’s Law Dictionary. Minn:West Publishing Co.
Boehm, T., & Alan Schlottmann. (2004). Wealth Accumulation and Homeownership: Evidence for Low Income Households. Washington, DC:US Department of Housing and Urban Development.
Bradford, C. (2002). Risk or Race? Racial Disparities and the Subprime Refinance Market. Report issued by the Center for Community Change. Retrieved from www.communi-tychange.org.
Bradford, C. (1979). Financing Home Ownership: The Federal Role in Neighborhood Decline. Urban Affairs Quarterly, 14(3), 313-335.
Bunce, H., Gruenstein, D., Herbert, C., & Scheessele, R. (2001). Subprime Foreclosures: The Smoking Gun of Predatory Lending? Washington, DC: U.S. Department of Housing and Urban Development.
Burnett, K., Herbert, C., & Kaul, B. (2002). Subprime Originations and Foreclosures in New York State: A Case Study of Nassau, Suffolk, and Westchester Counties. Cambridge, MA: Abt Associates, Inc.
Calem, P., Gillen, K., & Wachter, S. (2004). The Neighborhood Distribution of Subprime Mortgage Lending. Journal of Real Estate Finance and Economics, 29(4).
Campen, J. (2005). Borrowing Trouble V:Subprime Mortgage Lending in Greater Boston, 2000-2003. Report prepared for the Massachusetts Community and Banking Council. Retrieved from www.masscommunityandbanking.org/mortgage_lending.htm.
Canner, G., Passmore, W., & Laderman, E. (1999). The Role of Specialized Lenders in Extending Mortgage to Lower-Income and Minority Homebuyers. Federal Reserve Bulletin, 85(11), 709-726.
references

Page �� • Lost VaLues: A Study of Predatory Lending in Philadelphia
Carr, J., & Kolluri, L. (2001). Predatory Lending: An Overview. Washington, DC:Fannie Mae Foundation.
Carr, J., & Schuetz, J. (2001). Financial Services in Distressed Communities: Framing the Issue, Finding Solutions. Washington, DC:Fannie Mae Foundation.
Carroll, R., Clauretie, T., & Neill, H. (1997). Effect of Foreclosure Status on Residential Selling Price: Comment. Journal of Real Estate Research, 13(1), 95-102.
Caskey, J. (1994). Fringe Banking; Check-Cashing Outlets, Pawnshops, and the Poor. New York:Russell Sage Foundation.
Center City District & Central Philadelphia Development Corporation. (2005). State of Center City 2005. Retrieved from www.centercityphila.org/docs/socc2005.pdf.
Cisneros, H., Kemp, J., Retsinas, N., and Colton, K. (2004). Opportunity and Progress; A Bipartisan Platform for National Housing Policy. MA:Joint Center for Housing Studies of Harvard University.
City of Philadelphia. (2001). Neighborhood Transformation Initiative (NTI): Why It’s Needed Now. Retrieved from www.phila.gov/mayor/jfs/mayorsnit/pdfs/nti_rationale.pdf.
City of Philadelphia, Philadelphia City Planning Commission. (2005). City Stats; General Demographic and Economic Data. Retrieved from www.philaplanning.org/data/citystats.html.
Courchane, M., Surette, B., & Zorn, P. (2004). Subprime Borrowers: Mortgage Transitions and Outcomes. Journal of Real Estate Finance and Economics, 29(4).
Cutts, A., & Van Order, R. (2003). On the Economics of Subprime Lending. Freddie Mac Working Paper #04-01. Retrieved from www.freddiemac.com/news/pdf/subprime_012704.pdf.
Danis, M., & Pennington-Cross, A. (2005). A Dynamic Look at Subprime Loan Performance. St. Louis:Federal Reserve Bank of St. Louis Working Paper 2005-029A. Retrieved from http://research.stlouisfed.org/wp/2005/2005-029.pdf.
Democratic National Committee. (2004). Strong At Home, Respected in the World. Retrieved from www.democrats.org/pdfs/2004platform.pdf.
Engel, K., & McCoy, P. (2002). A Tale of Three Markets: The Law and Economics of Predatory Lending. Texas Law Review, 80(6), 1255-1381.
Engel, K., & McCoy, P. (2004). Predatory Lending: What Does Wall Street Have To Do With It? Housing Policy Debate, 15(3), 715-751.
Fannie Mae. (2003). The Growing Demand For Housing; 2002 Fannie Mae National Housing Survey. Retrieved from www.glensold.com/fnmasurvey2002.pdf.
Fannie Mae. (2004). Understanding America’s Homeownership Gaps; 2003 Fannie Mae National Housing Survey. Retrieved from www.fanniemae.com/global/pdf/media/survey/survey2003.pdf.
Federal Financial Institutions Examination Council. About HMDA. Retrieved from www.ffiec.gov/hmda.about.htm.

Page �� • Lost VaLues: A Study of Predatory Lending in Philadelphia
re
fe
re
nc
es
Federal Trade Commission. (1999). Self-Regulation in the Alcohol Industry; A Review of Industry Efforts to Avoid Promoting Alcohol to Underage Consumers. Retrieved from www.ftc.gov/reports/alcohol/alcoholreport.htm#EXECUTIVE%20Summary.
Fishbein, A. & Bunce, H. (2001). Subprime Market Growth and Predatory Lending. Washington, DC: U.S. Department of Housing and Urban Development.
Forgey, F., Rutherford, r., & VanBuskirk, M. (1994). Effect of Foreclosure Status on Residential Selling Price. Journal of Real Estate Research, 9(3), 313-318.
Freddie Mac. 1996. Automated Underwriting: Making Mortgage Lending Simpler and Fairer for America’s Families. Retrieved from www.freddiemac.com/corporate/reports.
Glaeser, E., & Shapiro, J. (2002). The Benefits of the Home Mortgage Interest Deduction. National Bureau of Economic Research Working Paper W9284.
Goldstein, I. (2004). Bringing Subprime Mortgages To Market and the Effects On Lower-Income Borrowers.” Joint Center for Housing Studies of Harvard University, Building Assets, Building Credit Working Paper BABC 04-7. Retrieved from http://www.jchs.harvard.edu/publications/finance/babc/babc_04-7.pdf.
Gramlich, E. Remarks at the Financial Services Roundtable Annual Housing Policy Meeting. Retrieved from www.federalreserve.gov/boarddocs/speeches/2004/20040521.default.htm.
Gruenstein, D. & Herbert, C. (2000a). Analyzing Trends in Subprime Originations and Foreclosures: A Case Study of the Boston Metro Area. Cambridge, MA: Abt Associates, Inc.
Gruenstein, D., & Herbert, C. (2000b). Analyzing Trends in Subprime Originations and Foreclosures: A Case Study of the Atlanta Metro Area. Cambridge, MA: Abt Associates, Inc.
Hirad, A., & Zorn, P. (2001). A Little Knowledge Is A Good Thing: Empirical Evidence of the Effectiveness of Pre-Purchase Homeownership Counseling. Joint Center for Housing Studies of Harvard University, Low-Income Homeownership Working Paper LIHO.01-4. Retrieved from http://www.jchs.harvard.edu/publications/homeownership/liho01-4.pdf.
Ho, G., & Pennington-Cross, A. (2005). The Impact of Local Predatory Lending Laws. St. Louis:Federal Reserve Bank of St. Louis Working Paper 2005-049A. Retrieved from http://research.stlouisfed.org/wp/2005/2005-049.pdf.
Hudson, Michael (ed.). (1996). Merchants of Misery; How Corporate America Profits From Poverty. ME:Common Courage Press.
Kane, M. (2006). A Federal Suitability Requirement for Home Loans. Northeast-Midwest Institute Issue Brief. Retrieved from http://www.nemw.org/documents/Suitability_NEMWIssueBrief1106.pdf.
Lehman, H. (1995, May 27). Clinton to Seek Higher Level of Homeownership; Private Housing Groups Pledge Support for HUD-Led Program. Washington Post, p. E1.
Li, W., & Ernst, K. (2006). The Best Value in the Subprime Market; State Predatory Lending Reforms. Report issued by the Center for Responsible Lending. Retrieved from www.re-sponsiblelending.org/pdfs/rr010-State_Effects-0206.pdf.

Page �� • Lost VaLues: A Study of Predatory Lending in Philadelphia
Listokin, D., & Wyly, E. (2000). Making New Mortgage Markets: Case Studies of Institutions, Home Buyers, and Communities. Housing Policy Debate, 11(3), 575-644.
Listokin, D., Wyly, E., Keating, L., Rengert, K., & Listokin, B. (2000). Case Study: Delaware Valley Mortgage Plan. From Making New Mortgage markets: Case Studies of Institutions, Home Buyers, and Communities. Washington, DC:Fannie Mae Foundation. Retrieved from www.fanniemaefoundation.org/programs/pdf/rep_newmortmkts_dvmp.pdf.
Mallach, A. (2001). Home Ownership Education and Counseling: Issues in Research and Definition. Federal Reserve Bank of Philadelphia. Retrieved from http://www.philadelphi-afed.org/cca/capubs/homeowner.pdf.
Mansfield, C. (2000). The Road to Subprime “HEL” Was Paved With Good Congressional Intentions: Usury Deregulation and the Subprime Home Equity Market. South Carolina Law Review, 51(3), 47-594.
Montalto, C. (2002). Wealth-Poor Households in the U.S. Report prepared for the Consumer Federation of America and National Credit Union Foundation. Retrieved from www.consumerfed.org/pdf/cfa5_wealth_poor_final_report.pdf.
Mortgage Bankers Association of America. (2003). National Delinquency Survey. [Data as of December 31, 2002 for 4th Quarter 2002]
NASD. NASD Manual. Retrieved from http://nasd.complinet.com/display/index.hrml.
National Association of Mortgage Brokers. (2002). Model State Statute Initiative; Licensing, Pre-licensure Education and Continuing Education Requirements for All Originators. Retrieved from http://www.namb.org/government_affairs/state_licensing/model_state_statute.pdf.
Pennington-Cross, A. (2003). Subprime and Prime Mortgages: Loss Distributions. Washington, DC: Office of Federal Housing Enterprise Oversight Working Paper 03-1.
Powell, M. (2005, May 30). A Bane Amid the Housing Boom: Rising Foreclosures. Washington Post, p. A1.
Quercia, R., & Stegman, M. (1992). Residential Mortgage Default: A Review of the Literature. Journal of Housing Research, 3(2), 341-379.
Quercia, R., Stegman, M., & Davis, R. (2003). The Impact of North Carolina’s Anti-pred-atory Lending Law: A Descriptive Assessment. Durham, NC:Center for Community Capitalism, University of North Carolina at Chapel Hill.
Republican National Committee. (2004). 2004 Republican Party Platform: A Safer World and a More Hopeful America. Retrieved from www.gop.com/media/2004platform.pdf.
Scheessele, R. HUD Subprime and Manufactured Home Lender List. Retrieved from http://www.huduser.org/datasets/manu.html [machine readable data file].
Simon, R., & Hagerty, J. (2006, December 6). More Borrowers With Risky Loans Are Falling Behind. Wall Street Journal, p. A1.
Temkin, K., Johnson, J., & Levy, D. (2002). Subprime Markets, the Role of GSEs, and Risk-Based Pricing. Prepared for the U.S. Department of Housing and Urban Development, Office of Policy Development and Research. Retrieved from www.huduser.org.

Page �� • Lost VaLues: A Study of Predatory Lending in Philadelphia
re
fe
re
nc
es
Temple University Center for Public Policy and Eastern Pennsylvania Organizing Project. 2001. Blight Free Philadelphia: A Public-Private Strategy to Create and Enhance Neighborhood Value. Report prepared for Research for Democracy. Retrieved from http://www.temple.edu/rfd/content/BlightFreePhiladelphia.pdf.
The Reinvestment Fund. (2004). A Study of Mortgage Foreclosures in Monroe County. Report prepared for the Commonwealth of Pennsylvania, Department of Banking.
The Reinvestment Fund. (2005). Mortgage Foreclosure Filings in Pennsylvania. Report prepared for the Commonwealth of Pennsylvania, Department of Banking. Retrieved from www.trfund.com/about/publications/pa%20foreclosures/Mortgage%20Foreclosure%20Fililngs.pdf.
U.S. Department of Commerce, Bureau of the Census. (2003). American Community Survey. [machine readable data file]
U.S. Department of Commerce, Bureau of the Census. Building Permit Estimates. (2000-2005) Retrieved from http://censtats.census.gov/cgi-bin/bldgprmt/bldgdisp.pl
U.S. Department of Commerce, Bureau of the Census. (2000). U.S. Census of Population and Housing, Summary File 3. [machine readable data file]
U.S. Department of Commerce, Bureau of the Census. (2000). 5-Percent Public Use Microdata Sample (PUMS) File. [machine readable data file]
U.S. Department of Commerce, Bureau of the Census. (2005). Housing Vacancies and Homeownership (CPS/HVS). Retrieved from www.census.gov/hhes/www/housing/hvs/his-toric/hist14.html.
U.S. Department of Commerce, Bureau of the Census & U.S. Department of Housing and Urban Development. (1995). American Housing Survey for the United States in 1993. Retrieved from www.census.gov/prod/1/constr/h150/h150-93m.pdf.
U.S. Department of Housing and Urban Development. (2000). Unequal Burden: Income and Racial Disparities in Subprime Lending in America. Retrieved from www.huduser.org/publications/fairhsg/unequal.html.
U.S. Department of Housing and Urban Development & U.S. Department of Commerce, Bureau of the Census. (2006). American Housing Survey for the United States: 2005. Retrieved from www.census.gov/prod/2004pubs/h150-03.pdf.
U.S. Department of Housing and Urban Development & U.S. Department of Commerce, Bureau of the Census. (2004). American Housing Survey for the United States: 2003. Retrieved from www.census.gov/prod/2006pubs/h150-05.pdf.
U.S. Department of Housing and Urban Development & U.S. Department of the Treasury. (2000). Curbing Predatory Home Mortgage Lending. Washington, DC: U.S. Department of Housing and Urban Development and U.S. Department of the Treasury.
U.S. General Accounting Office. 2004. Federal and State Agencies Face Challenges in Combating Predatory Lending. Report GAO-04-280. Retrieved from http://www.gao.gov/new.items/d04280.pdf.
Weicher, J. (1997). The Home Equity Lending Industry: Refinancing Mortgages for Borrowers With Impaired Credit. Indianapolis:Hudson Institute.

Page �0 • Lost VaLues: A Study of Predatory Lending in Philadelphia
White, A. (2003). Risk-Based Mortgage Pricing – Present and Future Research. Paper pre-sented at the John Marshall Law School.
White, A. & Mansfield, C. (2002). Literacy and Contract. Stanford Law and Policy Review, 13(2), 233-266.
Williams, R., Nesiba, R., & McConnell, E. (2001). The Changing Face of Inequality in Home Mortgage Lending. University of Notre Dame, Department of Sociology, Working Paper 2000-11 (revised July ’01).
Woodward, Susan E. 2003. Consumer Confusion in the Mortgage Market. Sand Hill Econometrics. Retrieved from http://www.sandhillecon.com/pdf/consumer_confusion.pdf

THE�REINVESTMENT�FUND�
Board of Directors
Robert E. Keith, Jr., Chair TL Ventures
John S. Summers, Esq., Vice Chair Hangley Aronchick Segal & Pudlin
Sharmain Matlock-Turner, Secretary Greater Philadelphia Urban Affairs Coalition
Andrea R. Allon Greater Philadelphia Chamber of Commerce
John K. Ball Shoemaker Construction Co.
Catherine C. Carr Community Legal Services, Inc.
Lee Casper Sukonik and Casper
Scott Jenkins S.M. Jenkins & Co
James Lynch Sovereign Bank Mid-Atlantic
Lewis Milford Clean Energy Group
Jeremy Nowak The Reinvestment Fund
Clayton Rose J.P. Morgan & Co. (retired)
William J.T. Strahan Comcast Cable
Mark Thompson Citizens Bank of Pennsylvania
th
e r
eIn
Ve
st
me
nt
fu
nd
Board of Directors

email: [email protected]
web: www.trfund.com
718 Arch Street, Suite 300 North Philadelphia, PA 19106-1591tel: 215-574-5800
1120 North Charles StreetBaltimore, MD 21201tel: 410-637-8268
1025 Connecticut Avenue, NW, Suite 900Washington, DC 20036tel: 202-223-3361
Copies of this study may be downloaded at www.trfund.com. For a printed copy, contact our Philadelphia office.Copyright © 2007 The Reinvestment Fund. All rights reserved. Printed on recycled paper with environmentally friendly inks.


