Lost River WBP - WV Department of Environmental Protection€¦ · 2 Introduction The Lost River...
27
The Lost River Watershed Based Plan February 2005 Prepared by: Gretchen Cremann, WV Conservation Agency Alana Hartman, WV Department of Environmental Protection Neil Gillies, Cacapon Institute
Transcript of Lost River WBP - WV Department of Environmental Protection€¦ · 2 Introduction The Lost River...

The Lost River Watershed Based Plan
February 2005
Prepared by: Gretchen Cremann, WV Conservation Agency
Alana Hartman, WV Department of Environmental Protection Neil Gillies, Cacapon Institute

2
Introduction The Lost River Watershed lies within the Potomac Headwaters of Hardy County, West Virginia. The watershed is 28.3 miles long, flowing through Mathias, Lost City, and Baker. The Lost River Watershed is predominately agriculture and forest. There is presently little development; however, with the construction of Corridor-H, the watershed has the potential for substantial growth in population. The Lost River was placed on the 303(d) list in 1996 due to fecal coliform bacteria contamination due to undetermined sources. A Total Maximum Daily Load (TMDL) study was developed for the river in 1998, which allocated fecal coliform loads to various land uses, and recommended reductions in fecal coliform loadings from each of those land uses so that the Lost River would meet water quality standards. The main focus of this watershed based plan is the main stem of the Lost River, where a majority of the resource concerns are located. However, all tributaries will be considered in this document, as well as in the planning and implementation phase of this watershed based plan. Geographical Extent The Lost River originates in Hardy County, West Virginia. The river flows northeast to become the Cacapon River, which drains into the Potomac River, and then to the Chesapeake Bay. The Lost River is located entirely within Hardy County. The watershed is approximately 116,600 acres The Lost River watershed has a drainage area of 178 square miles. Forest and agriculture are the primary land uses with 18.7% of the land use in active agriculture. The watershed is very rural, with three small
communities: Baker, Lost City, and Mathias, located on Rt. 259 and Rt. 55. There are three permitted point sources: East Hardy High School, East Hardy Early Middle School, and E.A. Hawse Nursing Home (AMFM of Hardy County, Inc). The construction of Corridor-H (a four-lane highway) across the northern quarter of the watershed, which began in 2001, has increased concerns of sedimentation in the river, as well as increased the potential for development. Landowners within the watershed have noted increased erosion of stream banks.

3
The Lost River Eroding Stream Banks
a. Measurable Water Quality Goals The Total Maximum Daily Load for fecal coliform for the Lost River (EPA, 1998) states that reductions in fecal coliform loadings must be met to achieve the river’s designated uses: the propagation and maintenance of fish and other aquatic life; water contact recreation; and trout water. To meet the standards set for the river’s designation, the fecal coliform level is not to exceed 400 cfu/100ml for an instantaneous sample or 200 cfu/100ml for a 30-day gm of five or more samples. The TMDL for Fecal Coliform for the Lost River (EPA, 1998) states an overall 33.4% reduction in the fecal coliform bacteria load must be met to support the designated uses. The TMDL (EPA, 1998) states the load reduction needed for the non-point source pollutants are stated in chart below.
Load reduction required for non-point sources of fecal coliform bacteria (EPA, 1998) Source Allocation (cfu/day) % Reduction Cropland 1.27x10¹⁷ 37.7 Forest 2.54x10¹⁸ 12.8 Pasture 7.39x10¹⁸ 38.3 Total Load Allocation 1.01x10¹⁹ 33.4% The TMDL did not consider fecal coliform bacteria from failing septic systems to be a significant contributor to the river’s fecal contamination problem, nor did it consider sediment as a pollutant. However, the watershed based plan for the Lost River will address both of these non-point sources issues. a. Causes and Sources of Impairment
In 1998 a TMLD for fecal coliform was written for the Lost River citing three major non-point source categories: forestland, pastureland, and cropland. Beginning in 1996, significant funding has been dedicated to the Lost River watershed to address water quality concerns. The USDA-NRCS PL-534 project was able to provide $1,763,906, with 40% of this cost, $705,562, coming from the landowner. This funding has gone towards the installation of manure storage for the agriculture producers as well as the relocation of feedlots and installation of alternative watering sources. This effort has been of tremendous assistance to the agricultural producers in the watershed. Though substantial effort has been taken to improve the water quality of the Lost River, there are still many landowners who need additional assistance to reduce agricultural

4
Lost River Watershed: Land Use in Floodplain
41%
59%
Farm
Hay/Pasture 75%Forest/Other
Row Crop 25%
runoff, keep livestock out of the river and stabilize the river’s banks. The TMDL does not identify sediment as a non-point source contributor to decreased water quality. However, the construction of Corridor-H as well as the unstable stream banks along the Lost River has made sediment a water quality concern for the working group as well as the residents of the Lost River Watershed. In November 2004 a fly over survey of the Watershed was performed to quantify the extent of impaired stream banks. From this survey 32,773 ft. of stream bank were estimated to be severely eroded, as well as 6, 801 ft. which were impaired from bulldozer activity. The sediment load from these failing banks is significantly impacting the Lost River. The Lost River Watershed is rural, with approximately 1,675 residents. Due to the rural nature of the watershed, many of the residents use septic systems for sewage disposal; a much smaller number of straight pipes also exist. Failing septic systems and straight pipes discharge fecal contamination into water bodies and contribute to fecal coliform loads. However, straight pipe discharge is not considered a significant threat to the Lost River as most residences are not located adjacent to the river. The TMDL (EPA, 1998) estimated 14 failing septic systems. The Lost River Watershed is home to abundant wildlife. Due to the low human population within the watershed and the large amount of forestland, wildlife is abundant. The TMDL states wildlife contribute to the fecal coliform entering into the Lost River. From the TMDL document the estimated numbers of wildlife living in the watershed are: Deer- 11,900, Geese- 71, and Wild Turkey 1089, along with a small number of Bear. The TMDL (EPA, 1998) documents the number and type of cattle and poultry production. The Potomac Headwaters Land Treatment Watershed Project Plan (December 1995) states there are 15 livestock confinement area and improvements that were needed in Lost River. By 2004 five (5) feedlots have been relocated, and four (4) have been improved. Within the Lost River Watershed there are 104 Broiler Houses, 42 Breeder Houses, and 50 Turkey Houses. The estimated number of cattle feedlots is 35, with an estimated 8,000 cattle in the watershed distributed between pasture and feedlots. In the watershed there are small winter feeding areas that will need to be addressed, as well as the larger feeding areas. The density of cattle was assumed at 1 cow per 4 acres. USDA-Natural Resource Conservation Service, USDA-NRCS, estimated litter production from the poultry houses as: 165 tons/year/broiler house, 100 tons/year/breeder house, and 120 tons/year/turkey house (NRCS, 1998).

5
b. Estimate of Load Reductions Load reductions were estimated using a simple accounting spreadsheet, with pollution reduction efficiencies based on those in the Chesapeake Bay Tributary Strategy (where applicable). A detailed description of the load reduction calculations can be found in Appendix B. Using this spreadsheet, the work group estimated that the reductions found in the following table would be achieved through the installations of various Best Management Practices. BMP New Units Nitrogen
Reduction (lbs/yr)
Phosphorus Reduction (lbs/yr)
Sediment Reduction (lbs/yr)
Fecal Coliform Reduction (cfu/day)
Stream Bank Stabilization
9acres 546.17 55.92 10.14 2.2x 10¹⁵
Re-location of Feedlots
6
New Barnyard Runoff Control
7
Riparian Woody Buffers
11acres 706.04 68.18 14.65 1.6x10¹⁵
Riparian Vegetative Buffers
90 acres 5097.18 499.38 107.22 1.2x10¹⁶
Alternative Water Sources w/ fencing
10 149.6 14 2.56 8.5x10¹⁴
Alternative Water Sources w/out fencing
50 374 35.17 6.49 2.3x10¹⁵
Alternative Water Sources w/fencing &flash grazing
20 224.45 21.11 3.86 1.2x10¹⁵
Wetland Restoration
10 361.01 30.41 8.14 4.5x10¹³
Land Retirement
500acres 18050.6 1520.65 407.1 2.2x10¹⁵
Tree Planting 50acres 1805.05 152.06 40.71 2.2x10¹⁴
According to the model calculations, if the above listed BMPs are installed at the projected numbers, the percent fecal reductions will be 23.7%. Please refer to Appendix A for the complete calculations of the load reduction model. c. Nonpoint source management measures The working group recommends use of the following nonpoint source (NPS) management measures to reduce bank erosion and the amount of sediment, nutrients, and fecal coliform entering the Lost River. Where USDA/NRCS standards apply, they should be followed.

6
• Re-location of feedlots - 5 feedlots in this watershed were relocated under PL-534 Land Treatment Program since 1996. This involves moving the feeding area further away from the river so that the waste deposited on the fields is further removed from the river. Additional feeding areas have been identified for relocation.
• Riparian Woody Buffers– Trees planted along the stream banks filter bacteria,
nutrients, sediments, and other pollutants from runoff as well as remove nutrients from groundwater (Strategy, Appendix 6). During high water and flooding events, tree roots keep soil from washing away. A 35-foot minimum width is necessary to achieve significant benefit from this measure (Strategy, Appendix 6). This practice is one of the most effective for reducing sediment entering a waterway, but it is very difficult to establish because of the current high density of white-tailed deer in the region (estimated at 75 deer per square forested mile, using figures from the TMDL). All attempts to establish this type of buffer should include use of 6-foot translucent tubes to protect young trees from damage. In areas of low deer density, un-maintained vegetative buffers could eventually grow into woody buffers.
• Riparian Vegetative buffers – Linear strips of grass or other non-woody
vegetation maintained along stream banks help filter bacteria, nutrients, sediment and other pollution from runoff. During high water and flooding events, vegetation holds soil in place and can trap some excess nutrients from upstream waters flowing over it. A 35-foot minimum width is necessary to achieve significant benefit from this measure (Strategy, Appendix 6). A non-woody buffer can be maintained at minimal cost by mechanical methods or flash-grazing. However, flash-grazing should be performed according to the NRCS Standards (approved protocol October 2000).
• Alternative watering sources
o With fencing: To eliminate instances of cattle coming into direct contact with a stream, a narrow strip of land along the stream bank can be fenced off. Alternative watering sources, such as troughs or tanks, must then be provided for the cattle. Cattle are thus prevented from physically disturbing the river banks, thus decreasing sediment entering the river, and decreasing bank erosion. They are also prevented from defecating in or close to the river.
o Without fencing: Instances of cattle in the river can be reduced by providing alternative sources of water (as described above) and shade that are removed from the river. The benefits mentioned above (with fencing) would still apply to a lesser degree.
o Alternative watering sources with fencing and rotational grazing: This practice combines riverbank fencing and alternative watering with cross fencing systems to create paddocks to enable flash rotational grazing (according to NRCS standards) of small areas in sequence. Flash grazing in riparian areas can be allowed under tightly controlled circumstances,

7
allowing agronomic benefit to the farmer while also maintaining much of the value of that riparian land as a buffer. It is beneficial in restricting access of animals from the river, but increases animal stocking rate and manure concentration per acre, which may adversely impact the quality of surface water runoff (Strategy, Appendix 6).
• Nutrient Management Plans - Farm operators develop a comprehensive plan that
describes the optimum use of nutrients to minimize nutrient loss while maintaining yield (Strategy, Appendix 6).
• Animal Waste Management Systems - Poultry and livestock operators design
practices for proper storage, handling, and use of wastes generated from confined animal operations. This includes a means of collecting, scraping, or washing wastes and contaminated runoff from confinement areas into appropriate waste storage structures (Strategy, Appendix 6). For poultry operations, litter sheds are typically used. For livestock, moving feedlots away from the streamside is an effective strategy.
• Stream bank stabilization using natural stream bank restoration techniques –
Conservation structures are used to stabilize the channel of a stream, but other measures to control aggradations or degradation in a stream channel, such as clearing obstructions, establishing vegetation, or installing upstream water control structures, should be attempted first. The following should be considered as a minimum: effects of changing stream volume and/or velocity with the planned structures, temporary and long-term effects on erosion and sedimentation, effects on wildlife that may occur due to changes in the water temperature, turbidity, bottom geologic material, etc., and effects on the visual quality of the stream (NRCS/WVCA guidelines).
• Alternative uses of Manure/ Manure Transport –Manure may be transported
outside of the Lost River watershed or an alternative use should be found, such as new fuel technologies (Potomac Tributary Strategy Appendix 6).
• Dirt and Gravel Roadway Erosion Controls – Environmentally sensitive
maintenance practices are used to stabilize unpaved roadway sections that have been identified as sources of dust and sediment pollution. Some aspects of roads may be re-designed, and an effective mixture of materials called Driving Surface Aggregate is often used as a surface. These roads can be designed to minimize cost and reduce future maintenance demands (“Dirt and Gravel Gazette,” Vol. 4 Issue 3, Fall 2004, Dirt and Gravel Roads Studies, Penn State University/Pennsylvania State Conservation Commission).
• Sediment Ponds – These structures intercept surface runoff and treat it through
settling, then discharge it at a controlled rate to minimize the environmental and physical impacts on receiving waters. Less expensive runoff filtration practices such as vegetated swales may also be used (Tributary Strategy pp. 24-25, 28,).

8
These practices can be installed not only on bare ground, but also on winter feedlots and at the lower end of poultry houses.
• Conservation Tillage – Planting and growing crops with minimal disturbance of
the surface soil. Includes no-till and minimum-till farming (Potomac Tributary Strategy Appendix 6)
• Wetland Restoration – Re-establish the natural hydraulic condition in a field that
existed prior to the installation of subsurface or surface drainage. Any wetland classification including forested, scrub-shrub or emergent marsh (Potomac Tributary Strategy Appendix 6).
• Land Retirement – Takes marginal and highly erosive cropland out of production
by planting permanent vegetative cover such as shrubs, grasses, and/or trees (Potomac Tributary Strategy Appendix 6).
• Tree Planting – Growing trees and converting the land use from agricultural to
forest, targeting lands that are highly erodable or identified as critical resource areas. Does not include forested riparian buffers (Potomac Tributary Strategy Appendix 6).
• Cereal Cover Crops – Planting and growing of cereal crops (non-harvested) with
minimal disturbance of the surface soil; reduces erosion and the leaching of nutrients to groundwater, captures nitrogen in plant tissues (Potomac Tributary Strategy Appendix 6.
• Commodity Cover Crops – Modify normal small grain production practices by
eliminating fall and winter fertilization so that crops function similarly to cereal cover crops; may be harvested for grain, hay or silage; may receive nutrient applications after March 1; captures nitrogen in plant tissues (Potomac Tributary Strategy Appendix 6).
• Conservation Plans – A combination of agronomic, management and engineered
practices that protect and improve soil productivity and water quality; the plan must meet agency technical standards (Potomac Tributary Strategy Appendix 6).
• Phytase Feed Additives – This enzyme is added to reduce phosphorus needs in
poultry feeds. A reduction of 30% in resulting manure phosphorus may be possible (Potomac Tributary Strategy Appendix 6).
• Yield Reserve – A reduction in nitrogen applied to cropland below the nutrient
management recommendation, currently defined at 15% in nitrogen. An incentive or crop insurance is used to cover the risk of yield loss (Potomac Tributary Strategy Appendix 6).

9
d. Technical and Financial Assistance The financial assistance for this watershed based plan is estimated to be $1,312,180. Below is the budget for the implementation of the best management practices and the technical support for 2005 through completion in 2011. Best Management Practices Planned Units Cost/Unit Total Land Retirement 500 Acres $0 $0 Animal Waste Management 13 $40,000 $520,000 facilities/re-location of feedlots Tree Planting 50 Acres $650 $32,500 Nutrient Management 500 Acres $10 $5,000 Off-Stream Watering w/Fencing 10 $108 $1,080 Off-Stream Watering w/Fencing 20 $120 $2,400 and rotational grazing Riparian Buffer establishment 100 acres $1,517 $151,700 Natural Stream Restoration 10,000 linear feet $55 $550,000 Sediment Monitoring per year x 5yrs $8,900 $44,500 Administrative Expenses per year x 5ys $1,000 $5,000
Total $1,312,180 The West Virginia Conservation Agency (WVCA) will be the state agency coordinating the implementation of BMPs, reporting, and the management of the 319-Incremental Grant. The West Virginia Department of Environmental Protection (DEP) will coordinate the water quality monitoring of the Lost River. Cacapon Institute will assist in educational and outreach, as well as implement a sediment monitoring program. The West Virginia Department of Agriculture will assist in monitoring of the Lost River. The Potomac Valley Conservation District will administer funding for this Watershed Based Plan, and sequential 319-Incremental Grants. The WVCA, DEP, Cacapon Institute, and the Potomac Valley Conservation District will implement education outreach within the watershed. e. Education Education and outreach efforts in regards to non-point source pollution as well as watershed awareness have been prominent in the Lost River Watershed. Through the efforts of the Cacapon Institute, the WVU Extension Service, USDA-NRCS, the Potomac Valley Conservation District and the West Virginia Conservation Agency, educational opportunities have been available for youth and adults within the watershed. The Cacapon Institute has organized a Watershed Celebration Stewardship Fair in the East Hardy Early Middle School for over three years. This educational day has brought youth and professionals together to discuss and learn about how each affect their watershed while providing an opportunity for the youth to learn about Natural Resource Careers. The Cacapon Institute also sponsors a summer Science Camp for the students of East Hardy Early Middle School. This educational opportunity is held on the school

10
campus, in the heart of the Lost River Watershed. The students have the opportunity to explore the watershed in a hands on environment. The Baker’s Run Conservation Society is a school based watershed association. The Baker’s Run Conservation Society has been instrumental in teaching their members the benefits of being good stewards to the land. The Conservation Society has sponsored several field days to teach their fellow students and teachers the benefits of conservation. The watershed association also sponsors a yearly stream clean up of Baker’s Run, which runs through the school campus. The Conservation Society is instrumental in spear-heading the school recycling program. The involvement of the school community will allow for further educational opportunities within the watershed. The school staff encourage the youth to learn about conservation and environmental topics. Through the increased involvement with the East Hardy Schools, environmental field days and educational programming in the schools, the residents of the Lost River Watershed will become aware of the resource concerns that affect their lives. Youth are not the only ones who will be affected through education and outreach activities. Through public nutrient management workshops, articles in the local newspapers, and one-on-one contact, the general public will continue to gain understanding an awareness of the resource issues that challenge their community. The public outreach activities will inform the Lost River Watershed residents on cost-share opportunities, and ways in which they are able to reduce the non-point source pollutants from their property. The watershed is very rural. One of the main avenues to provide the residents of the Lost River Watershed with information will be through the local newspapers, radio stations, the USDA-NRCS office, the WV Conservation Agency, and the West Virginia Extension Service Office. These avenues have proven effective in past as outreach measures. Educational meetings will also be scheduled to encourage residents and landowners of the watershed to participate in the proposed activities, as well as provide a means of sharing resource concerns which funding through an incremental project could provide assistance. f, g, h Schedule for implementing NPS management measures Submit plan to WV DEP and US EPA February 2005
Identification of severely eroding stream banks February-April 2005
Identification of feedlots/feeding area in need of assistance April-August 2005
Develop proposal for Natural Stream Restoration along September- Dec.2005
severely eroding banks
Develop proposal for agricultural NPS management measures September-Dec.2005

11
Submit proposals for erosion and agricultural NPS January 2006
Management measures
Public education of projects & funding available March 2006
Accept applications for agricultural NPS management measures March-Aug. 2006
and severely eroding banks projects
Implementation of severely eroding banks projects August 2006
Implementation of agricultural NPS management measures September 2006
Contracts with 5 landowners to install NPS management measures September 2007
NPS management measures will reduce fecal coliform 7% September 2007
Contract with 5 landowners to address severely eroding banks September 2007
Reduce erosion from contracted landowners by 109lbs September 2007
Assessment of severely eroding bank & agricultural projects September 2007
Provide 6 public educational opportunities on NPS December 2007
management measures
Contract with 5 landowners to install NPS management measures September 2008
NPS management measures will reduce fecal coliform 7% September 2008
Contract with 5 landowners to address severely eroding banks September 2008
Reduce erosion from contracted landowners by 218lbs September 2008
Assessment of severely eroding bank & agricultural projects September 2008
Provide 6 public educational opportunities on NPS December 2008
management measures
Contracts with 5 landowners to install NPS management measures September 2009
NPS management measures will reduce fecal coliform 7% September 2009
Contract with 5 landowners to address severely eroding banks September 2009
Reduce erosion from contracted landowners by 327lbs September 2009

12
Assessment of severely eroding bank & agricultural projects September 2009
Provide 6 public educational opportunities on NPS December 2009
Management measures
NPS management measures will reduce fecal coliform 7% September 2010
Reduce erosion from contracted landowners by 436 lbs September 2010
Provide 6 public educational opportunities on NPS December 2010
management measures
Assessment of severely eroding bank & agricultural projects September 2010
NPS management measures will reduce fecal coliform 7% September 2011
Reduce erosion from contracted landowners by 545lbs September 2011
Provide 6 public educational opportunities on NPS December 2011
Management measures
Assessment of severely eroding bank & agricultural projects September 2011
The milestones are projected for a five year time period. West Virginia Department of Environmental Protection has not set a revision schedule for the Lost River TMDL. The goal of this plan is to reduce the fecal coliform bacteria concentrations to the levels the 1998 TMDL projected in a five year time span. Monitoring by the West Virginia Department of Agriculture, and Cacapon Institute will determine the results of the NPS management measures that have been installed. The TMDL has set a fecal coliform reduction goal of 33.4%. According to the model used by the Watershed Planning Committee, a reduction of 23.7% is a more realistic goal. It is recommended by the planning committee for the TMDL to be revised to reflect the current water concentrations of fecal coliform within the Lost River. i. Monitoring Component The Lost River has had extensive water quality monitoring in the past. The West Virginia Department of Agriculture (WVDA) has sampled the waters for nitrogen, phosphorus, sediment, and fecal coliform, and has committed to continuing their sampling program. The Cacapon Institute, a non-profit science and education and environmental monitoring organization, has monitored the Lost River since the mid-1990. Cacapon Institute has committed to sharing their water quality data, as well as continues to monitor the Lost River's water quality. The data collected from these sampling programs will be used to evaluate the effectiveness of the NPS management measures. The evaluation of the water quality data will be performed once a year until it

13
is deemed the water quality has improved. If the water quality data does not show an improvement by minimum of 2 years after NPS management measures have been installed, a revision of the milestones and the project will be made. Monitoring will also be done through the use of Save Our Streams. The Baker’s Run Conservation Society local science and watershed organization performs a Save Our Streams survey a minimum of once a year in a tributary of the Lost River. This along with local civic organizations participation on the Save Our Streams program will provide water quality data. Acknowledgements A special thanks to pilot and consulting forester David Warner. Mr. Warner flew the authors of this report over the Lost River watershed in November 2004 for the purpose of conducting an aerial survey of failing stream banks. References: Total Maximum Daily Load for Fecal Coliform, Lost River, West Virginia. Environmental Protection Agency, Region III. September 1998.

14

Appendix A
Table 1. Agricultural BMPs that could be implemented in the Lost River watershed
BMP already widely used in L.R. watershed?
units in which it is measured
proposed # of new units
N reduction per unit
P reduction per unit
Sed reduction per unit
Fecal Coliform reduction per unit
BMPs
Nutrient Management Plans YES
Litter Sheds YES
Streambank Stabilization using Nat. Streambank Restoration techniques (Note 1)
linear ft + acres of buffer and upland protection
9 0.43 0.53 0.53 0.48
Re-location of Feedlots manure acre 6 0.75 0.75
NEW Barnyard Runoff Control manure acre 7 0.1 0.1 0.4 0.3
Litter Transport YES Dirt and Gravel Roadway Erosion Controls (under consideration for CBP model)
Riparian Woody Buffers acre of buffer + 2 acres upland protection
11 0.55 0.65 0.65 0.6
Riparian Vegetative Buffers acre of buffer + 2 acres upland protection
90 0.43 0.53 0.53 0.48
CHANGE Pasture: Alternative watering sources
a.) with fencing acres/ft 10 0.6 0.6 0.75 0.6
b.) without fencing YES acres 50 0.3 0.3 0.38 0.3
c.) with fencing and flash rotational grazing in riparian zone acres 20 0.45 0.45 0.565 0.39

16
total N reduction (lbs/yr)
total P reduction (lbs/yr)
Sediment reduction (tons/yr)
Fecal Coliform reduction (cfu/day)
total N reduction (lbs/yr)
total P reduction (lbs/yr)
Sediment reduction (tons/yr)
Fecal Coliform reduction (cfu/day)
percent reductions
546.1673141 55.92304554 10.1442071 2.21152E+15 0.1276% 0.2046% 0.1087% 0.2190%
706.0392019 68.17663846 14.65366676 1.68195E+15 0.1649% 0.2494% 0.1570% 0.1665%
5097.170971 499.3824313 107.2212749 1.26095E+16 1.1906% 1.8270% 1.1491% 1.2485%
149.6299477 14.0705311 2.564671399 8.5127E+14 0.0350% 0.0515% 0.0275% 0.0843%
374.0748692 35.17632776 6.497167544 2.31595E+15 0.0874% 0.1287% 0.0696% 0.2293%
224.4449215 21.10579666 3.864104908 1.25137E+15 0.0524% 0.0772% 0.0414% 0.1239%
17
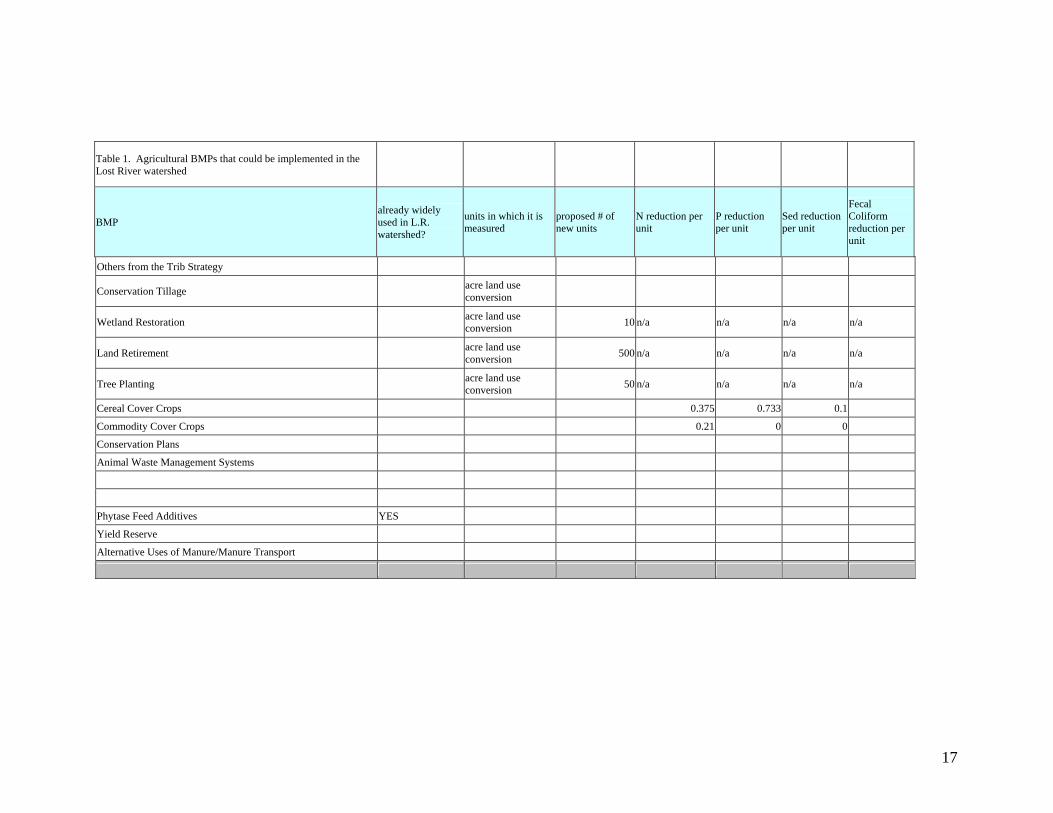
Table 1. Agricultural BMPs that could be implemented in the Lost River watershed
BMP already widely used in L.R. watershed?
units in which it is measured
proposed # of new units
N reduction per unit
P reduction per unit
Sed reduction per unit
Fecal Coliform reduction per unit
Others from the Trib Strategy
Conservation Tillage acre land use conversion
Wetland Restoration acre land use conversion 10 n/a n/a n/a n/a
Land Retirement acre land use conversion 500 n/a n/a n/a n/a
Tree Planting acre land use conversion 50 n/a n/a n/a n/a
Cereal Cover Crops 0.375 0.733 0.1
Commodity Cover Crops 0.21 0 0
Conservation Plans
Animal Waste Management Systems
Phytase Feed Additives YES
Yield Reserve
Alternative Uses of Manure/Manure Transport

18
total N reduction (lbs/yr)
total P reduction (lbs/yr)
Sediment reduction (tons/yr)
Fecal Coliform reduction (cfu/day)
total N reduction (lbs/yr)
total P reduction (lbs/yr)
Sediment reduction (tons/yr)
Fecal Coliform reduction (cfu/day)
361.0116197 30.41309528 8.141903068 4.53365E+13 0.0843% 0.1113% 0.0873% 0.0045%
18050.58098 1520.654764 407.0951534 2.26683E+15 4.2164% 5.5633% 4.3628% 0.2244%
1805.058098 152.0654764 40.70951534 2.26683E+14 0.4216% 0.5563% 0.4363% 0.0224%

19
Table 1. Agricultural BMPs that could be implemented in the Lost River watershed
BMP already widely used in L.R. watershed?
units in which it is measured
proposed # of new units
N reduction per unit
P reduction per unit
Sed reduction per unit
Fecal Coliform reduction per unit
"New BMPs Under Consideration Not Currently Credited in the CBP Watershed Model (12/22/03)"
Manure Additives
Carbon Sequestration
Mortality Composters (diff between #25 and #28??) YES
Ammonia Emission Controls in Animal Agriculture
Precision Feeding for Dairy?? (do we have any dairy operators???)
Poultry Composters (diff between #28 and #25?) YES
Other (discussed with Neil 09/30/04)
Sediment Ponds - using urban/mixed open efficiencies and applying to LR floodplain land use percentages protected acres 100 0.3 0.5 0.8 0.4

20
total N reduction (lbs/yr)
total P reduction (lbs/yr)
Sediment reduction (tons/yr)
Fecal Coliform reduction (cfu/day)
total N reduction (lbs/yr)
total P reduction (lbs/yr)
Sediment reduction (tons/yr)
Fecal Coliform reduction (cfu/day)
2639.4462 302.6490996 72.50277181 1.02606E+16

21
SUMMARY DATA TN (LBS/YR) TP (LBS/YR) SED (TONS/YR) FCB (cfu/day)
Starting Loads (from "Lost River Estimates" worksheet) 428100.6636 27333.55084 9331.120719 1.01E+18
Fecal load % reductions due to Post-TMDL but pre-Watershed Plan management changes (I.e.: increased manure storage). See Fecal Reduction Due to Storage spreadsheet
0 0 0 0.20364
Fecal load numeric reductions due to Post-TMDL but pre-Watershed Plan management changes (I.e.: increased manure storage)
0 0 0 2.05676E+17
Load reductions from this spreadsheet 29953.62413 2699.617206 673.3944363 3.3721E+16 Total Load reductions 29953.62413 2699.617206 673.3944363 2.39397E+17 Current Load 398147.0395 24633.93364 8657.726283 7.70603E+17 Percent Load Reduction 6.9969% 9.8766% 7.2167% 23.7027% Linear feet of lands suitable for buffers 138756.223 Linear feet of forested buffers installed 13695 Linear feet of grassy/shrub buffers installed 123255 Remaining linear feet of lands suitable for buffers 1806.223
Total land use conversion from producing agriculture (acres) 680
Summary Table note: buffers assumed to be 35 ft wide.
Table 1 Note 1. Buffer strips with fencing are a required component of the streambank restoration practices. This table assumes that grassy buffers will be installed, rather than forested buffers. Reductions for nutrients and sediment associated with t
Table 1 Note 2. Fecal coliform reductions are the average of TN and TP reduction efficiencies. Reasoning: Fecal coliform are transported to streams, in most circumstances, across the surface of the ground with surface runoff. They are particulate in n
Table 1 Note 3. I think the low numbers the CBP offers for nutrient reductions associated with pasture with offstream watering, fencing and flash rotational grazing in riparian zone reflect a lack of undersatnding of how this is done when managed correct
Table 1 Note 4. Practices where pollution reductions are solely due to land use conversion assume the change is from row crop to a buffer condition - either forested or grassy/shrub


Appendix B
Load Reductions Were Calculated Prepared by Neil Gillies, Cacapon Institute
A large amount of water quality data has been collected in the Lost River watershed, beginning in 1997. However, this data was not collected for the purpose of estimating loads, and is not directly suitable for load analysis. In its place, two sources of modeled loads will be used. The first is the Lost River Total Maximum Daily Load document (September 1998), which estimated overall fecal coliform bacteria loadings and allocated those loads among land uses. The second source of modeled loads is the Chesapeake Bay Program’s (CBP) nutrient and sediment edge of stream load analysis for the Cacapon River (State Segment 6175), as provided to the WV Potomac Tributary Strategy working group in an Excel spreadsheet (2002_Loads-BMPs-Landuses_121803.xls). The CBP modeled data incorporated the effects of existing BMPs on reducing nutrient and sediment losses in the watershed. The TMDL did not incorporate this information; rather, it was a “snapshot” of water quality conditions based on the data used to develop the TMDL model. Numeric loads of nitrogen, phosphorus, sediment, and fecal coliform bacteria were calculated per land use category and acres of land use in each category as follows: 1. Modeled load data provided overall numeric loads per land use category. Loads per
acre in each land use category were calculated by dividing the total load allocation by the number of acres in each land use, based on the land use data in each modeling method.
2. This load/acre/land use was then applied to ground verified land use data developed by Cacapon Institute for the Lost River watershed.
3. Additional steps were required to apply nutrient and fecal loads to the watershed’s hay and pastureland: • The TMDL assumed that manure and poultry litter were applied on 100% of the
cropland, but only on 75% of the pasture/hay lands. For this reason, the total acreage of pasture/hay land (19,016 acres) considered for our calculations was reduced by 25% (to 14,262 acres).
• Mark Hedrick (Pilgrims Pride, Nutrient Management Specialist, personal communication) indicated that the rates of application of poultry litter and manure differed between pasture and prime hay land, with typically two tons/acre/every two years on pasture, and three tons/acre/year applied to prime hay land.
• The working group assumed that 100% of the hay/pasture land in the floodplain (2,862 acres) received the three tons/acre/year manure/litter application, and that the remaining hay/pasture land (11,400 acres) received the two tons/acre/every two years manure/litter application. This resulted in 43% of the Nitrogen, Phosphorus and fecal coliform loads being allocated to pasture and hay land in the floodplain, and 57% allocated to pasture and hay land outside of the floodplain.
4. This data was used to develop a delivered loads of fecal coliforms, nutrients, and sediment per acre of land for each land use category (such as forest, tilled land, etc.), with a breakout loading for pasture and hay in the floodplain – which became important in considering load reductions from BMPs installed in the floodplain, as

24
noted below. This provided the “starting loads” for nutrients, sediment and fecal coliform bacteria.
Load reductions were calculated using an Excel spreadsheet using BMP efficiencies for nutrients and sediment as documented in “Chesapeake Bay Program Phase 4.3 Watershed Model Nonpoint Source BMPs (12/22/03).” To the best of the working groups knowledge, a similar “consensus opinion” on BMP efficiencies related to fecal coliform bacteria does not currently exist. The literature is somewhat equivocal on this subject. Some papers indicate reductions from 70% to 100% in narrow filter strips (Edwards, 1997; Klapproth et. al., 2000), while others found that “fecal coliform numbers in the pulse of applied wastewater did not decline as water moved down slope regardless of vegetation type or season of the year” (Entry et. al., 2000). However, the Entry (2000) paper also noted a 10-fold decrease in bacteria numbers between the source and their first sampling point, which may have been caused by removal of bacteria in the first several meters of the filter strip - Dr. Entry confirmed this may have been the case via email. For the purposes of the LRWP fecal coliform load reduction analysis, and subject to revision, we used the average of BMP reduction efficiencies for TN and TP as the provisional efficiency for fecal coliform removal. The reasoning was as follows:
• Non point source contributions of fecal coliform bacteria from agriculture are transported to streams, in most circumstances, in surface runoff. In that sense, they move in the same manner as the majority of phosphorus, which is mostly found in particulate form and transported to the stream across the surface of the ground.
• Bacteria are also particulate in nature, but water quality testing experience in the watershed (Cacapon Institute) indicates that bacteria concentrations generally rise more quickly and remain relatively high longer in response to runoff producing storms than does phosphorus. The same experience indicates that bacteria concentrations rise less quickly and remain relatively high for shorter periods of time in response to runoff producing storms than does nitrate-N, which moves in dissolved form both overland and through the soils.
• This difference in “resistance to being transported” indicates that fecal bacteria may move a bit more readily than phosphorus and a bit less so than nitrate-N, and that BMPs that are put in place to inhibit the movement of bacteria may have removal efficiencies somewhere between that for P and N.
• In a practical sense, this approach seems to provide a conservative estimate of BMP fecal removal potential sufficient for the needs of the LRWP. For example, the CBP efficiencies for total phosphorus (TP) and total nitrogen (TN) removal by Vegetative Buffers are 53% and 43%, respectively. The average of the two yields a 48% efficiency for removal of fecal coliform bacteria by Vegetative Buffers, considerably lower than the 70-100% fecal coliform removal noted above for experimental test plots – which always tend to exceed results on real farms.
• Fecal reductions associated with off stream watering with stream fencing, without stream fencing, and off stream watering with flash rotational grazing in the riparian zone are somewhat more complicated. The CBP efficiencies for TP and TN are the same for each of the above options. However, the delivered fecal load from pasture is probably not equally spread across the pasture landscape. The TMDL for Naked Creek, VA assigned 67% of their total fecal load to direct

25
deposition in streams from pastured cattle and other livestock (VA DEQ, 2002). The working group took a much more conservative approach, and weighted the delivered fecal load from an acre of pasture as 20% direct deposition and 80% landscape fecal load that is delivered in runoff. The stream fencing option assumes the fecal coliform load associated with direct deposition (20% of the total delivered load) is eliminated, with the buffer efficiency applied to remaining 80% of the total pasture load; this same logic was applied to the pasture portion of each of the buffer options. The off-stream watering without fencing assumes that 50% of the direct deposition is eliminated. The “off stream watering with flash rotational grazing in the riparian zone” option assumes that 90% of the direct deposition is eliminated (or 18% of the total delivered load).
The LRWP load reduction analysis focuses on land in the floodplain of the Lost River and its tributaries, on the assumption that most of the deliverable load of the nutrients, sediment and fecal coliform bacteria will be generated in that area. Land use in the Lost River floodplain area (based on digitized land use data developed by Cacapon Institute) is presented in the table below. Land Use in the Lost River Floodplain
Farm breakdown
Forest/ Other
Farm Pasture/ Hay
Row crop
2622.68 3816.51 2862.22 954.29 41% 59% 75% 25%
Load Reduction Calculations Load reductions were calculated by multiplying the acreage of land involved, the pollution load generated on that land, and the efficiency of pollution removal by the BMP being used. Load reductions for practices where reductions are solely due to land use conversion (such as tree planting or land retirement) assume the change is from row crop to a buffer condition - either forested or grassy/shrub. The load reduction is then the difference between theoretical loads generated by the agricultural land use and the buffer. Load reduction for BMP buffers have two components: land conversion for the land area where the buffer is installed, and a reduction in pollution from upland acreage due to filtering and biological processes that occur in the buffer. The load reduction method for Standalone Buffers was as follows:
• Percentages of agricultural land in floodplain are 75% hay/pasture and 25% cropland. The method assumes buffers are equally likely to be installed bordering row crop and hay/pasture.
• Acre of Buffer The reduction associated with this land is the difference in pollution loads generated by current use (50% crop + 50% pasture) and pollution loads generated by the buffer. We assumed a grassy/shrub buffer is managed without access by large farm animals and without application of fertilizer, and applied the same pollution loads as for forest.

26
• Acre of Upland Hay/Pasture Reduction in edge-of-stream delivered pollution based on load reduction efficiency of buffer chosen.
• Acre of Upland Row Crop Reduction in delivered nutrients and sediment based on load reduction efficiency of buffer chosen
• Stream Edge of stream load reductions = change in land use for acre with buffer + buffer mediated reductions pollutants from 1 acre of row crop and one acre of hay/pasture.
Pollution reduction method for Buffers Associated with Natural Stream Restoration Buffer strips with fencing are a required component of stream bank restoration practices. This method assumes that grassy buffers will be installed, rather than forested buffers, and that reductions for nutrients, sediment and fecal bacteria associated with this practice are those of the associated buffers. No allowance is currently made for reductions in sediment and phosphorus loads associated with correcting failing stream banks. The reductions are likely to be considerable, but we have no basis at present to form an estimate.
• Percentages of total land in floodplain are 40% forest, 45% hay/pasture and 15% crop land. This method above assumes that stream restoration will occur along stream frontage based on those percentages.
• 1 Acre of Buffer Reduction associated with this land is the difference in pollution loads generated by current use (40% forest, 45% hay/pasture and 15% cropland) and pollution loads generated by forest. For this calculation, a grassy/shrub buffer is assumed to deliver the same background pollution as forest.
• 0.8 acre of forest No change in pollution load • 0.9 Acre of Hay/Pasture Reduction in delivered pollution based on load reduction
efficiency of buffer chosen. • 0.3 Acre of Row Crop Reduction in delivered pollution based on load reduction
efficiency of buffer chosen. • Stream Edge of stream load reductions = change in land use for acre with buffer
+ buffer mediated reductions of pollution from 0.3 acre of row crop and 0.9 acre of hay/pasture.
The low numbers the CBP assigned for nutrient and sediment reductions associated the BMP for pasture with off stream watering, fencing and flash rotational grazing in riparian zone appear inconsistent with this BMP as it is used in West Virginia. We assigned nutrient and sediment reductions for this practice as the average of 1- alternative watering sources plus stream fencing, and 2 – alternative watering sources without stream fencing. Fecal reductions associated with stream fencing, off stream watering, and flash rotational grazing are somewhat more complicated.

27
References Edwards, Dwayne. 1997. The effects of grazing practices on runoff quality. Department of Biosystems and Agricultural Engineering, University of Kentucky. December 1997. http://www.uky.edu/WaterResources/WORKS19.HTML Entry, James, Robert Hubbard, Janice Thies, Jeffry Fuhrmann. 2000. Influence of Vegetation in Riparian Filterstrips on Coliform Bacteria: I. Movement and Survival in Surface Flow and Groundwater. USDA-ARS NWISRL, Kimberly, Idaho. Journal of Environmental Quality, 29(4), July-August 2000. Klapproth, Julia C., James E. Johnson. 2000. Understanding the Science Behind Riparian Forest Buffers: Effects on Water Quality. Virginia Tech Publication Number 420- 151, Posted October 2000. Fecal Coliform TMDL for Naked Creek in Augusta and Rockingham Counties, Virginia. VA DEQ, 2002. http://www.ext.vt.edu/pubs/forestry/420-151/420- 151.html#L4