
Loss of p63 and its microRNA-205 target results in ... · Loss of p63 and its microRNA-205 target...
8
Corrections CELL BIOLOGY Correction for “Role of p63 and the Notch pathway in cochlea development and sensorineural deafness,” by Alessandro Terrinoni, Valeria Serra, Ernesto Bruno, Andreas Strasser, Elizabeth Valente, Elsa R. Flores, Hans van Bokhoven, Xin Lu, Richard A. Knight, and Gerry Melino, which appeared in issue 18, April 30, 2013, of Proc Natl Acad Sci USA (110:7300–7305; first published April 15, 2013; 10.1073/pnas.1214498110). The authors note that “Thanks to an alert reader, we no- ticed that in Fig. 3D, the control ChIP for MDM2 errone- ously duplicated a p53-RE-III panel from an earlier paper (1). We thank the reader for bringing this issue to our at- tention, and we deeply apologize to the scientific community for the error.” The corrected figure and its corrected legend appear below. 1. Tucci P, et al. (2012) Loss of p63 and its microRNA-205 target results in enhanced cell migration and metastasis in prostate cancer. Proc Natl Acad Sci USA 109(38): 15312–15317. www.pnas.org/cgi/doi/10.1073/pnas.1324224111 200 1000 2000 2200 2400 2600 2800 3000 3200 3400 RE Promoter A Input HA IgG MDM2 Hes5 SaOs-2 TAp63α D Hes5 gene Input HA IgG SaOs-2 TAp63α F Doxy HA Tub SaOs-2 HA-TAp63α G Atoh1 p21 H HA Actin p21 C E 3000 4200 7200 Enhancer A Enhancer B RE II 3’ Promoter RE I 5’ Atoh1 mRNA transcript 0 1 2 3 4 5 6 7 Luciferase activity Fold over control pcDNA-HA TAp63a Wt G530V I537T Q634X R279H R280C R304W S272N Q566fsX94 SAM DBD TID B Luciferase activity SAM DBD TID 35 30 25 20 15 10 5 0 Fold over control 40 45 pcDNA-HA TAp63a Wt G530V I537T Q634X R279H R280C R304W S272N Q566fsX94 Q536L - + Doxy SaOs-2 HA-TAp63α - + Fig. 3. p63 drives Hes5 and Atoh1 promoters. (A) The Hes5 gene structure shows the presence of a putative p53/p63 RE localized at −988, −966 from the TSS, in the promoter sequence. All promoters analyses were performed by MathInspector professional release 8.0.5, March 2011; Matrix Family Library Version 8.3, October 2010. (B) SaOs2 cells were transiently cotransfected with expression constructs for WT TAp63α-HA or TAp63α-HA mutant (G530V, I537T, Q536L, R280C, R304W, S272N, R279H, Q566fsX94, and Q634X) plus the hHes5-luc reporter vector. There was an increase in luciferase activity in cells transfected with TAp63α-HA WT, more pronounced with the TAp63α-Q634X-HA mutant, but not in cells transduced with the vectors encoding mutants for the DBD (mean ± SD, n = 3). (C ) Western blot analysis was performed to verify TAp63a protein expression. (D) ChIP analysis shows the binding of TAp63α to the p53/p63-RE in the Hes5 promoter. In the Lower panel, the ChIP on the MDM2 promoter used as positive control. (E ) The Atoh1 gene structure shows the presence of two p53 RE: RE-I5′ localized at −1,682, −1,660 from the TSS; and RE-II3′ in the Enhancer-A. (F ) ChIP analysis of the Atoh1 p53-Res. TAp63α binds only to the p53-RE Atoh1 enhancer sequence; the MDM2 promoter was used as a positive control. (G) Western blot showing TAp63α protein expression. (H) Luciferase activity was increased by TAp63α-HA and TAp63α Q634X plasmids. SaOs2 cells were transiently cotransfected with an hAtoh1-luc expression vector, TAp63α-HA, and TAp63α-HA mutants (G530V, I537T, R280C, R304W, S272N, R279H, Q566fsX94, and Q634X) (mean ± SD, n = 3). 2854–2855 | PNAS | February 18, 2014 | vol. 111 | no. 7 www.pnas.org
-
Upload
nguyenhanh -
Category
Documents
-
view
214 -
download
0
Transcript of Loss of p63 and its microRNA-205 target results in ... · Loss of p63 and its microRNA-205 target...

Corrections
CELL BIOLOGYCorrection for “Role of p63 and the Notch pathway in cochleadevelopment and sensorineural deafness,” by Alessandro Terrinoni,Valeria Serra, Ernesto Bruno, Andreas Strasser, Elizabeth Valente,Elsa R. Flores, Hans van Bokhoven, Xin Lu, Richard A. Knight,and Gerry Melino, which appeared in issue 18, April 30, 2013, ofProc Natl Acad Sci USA (110:7300–7305; first published April 15,2013; 10.1073/pnas.1214498110).The authors note that “Thanks to an alert reader, we no-
ticed that in Fig. 3D, the control ChIP for MDM2 errone-
ously duplicated a p53-RE-III panel from an earlier paper(1). We thank the reader for bringing this issue to our at-tention, and we deeply apologize to the scientific community forthe error.”The corrected figure and its corrected legend appear below.
1. Tucci P, et al. (2012) Loss of p63 and its microRNA-205 target results in enhancedcell migration and metastasis in prostate cancer. Proc Natl Acad Sci USA 109(38):15312–15317.
www.pnas.org/cgi/doi/10.1073/pnas.1324224111
200 1000 2000 2200 2400 2600 2800 3000 3200 3400
RE PromoterA
Input HA IgG
MDM2
Hes5
SaOs-2 TAp63αD
Hes5 gene
Input HA IgGSaOs-2 TAp63α
F
Doxy
HA
Tub
SaOs-2 HA-TAp63αG
Atoh1
p21
H
HA
Actin
p21
C
E
3000 4200 7200 Enhancer A Enhancer B
RE II 3’Promoter RE I 5’
Atoh1 mRNA transcript
0
1
2
3
4
5
6
7 Luciferase activity
Fold
ove
r con
trol
pcDNA-H
A
TAp6
3a W
t
G530V
I537T
Q634X
R279H
R280C
R304W
S272N
Q566fs
X94
SAM DBD
TID
B Luciferase activity
SAM DBD
TID
35
30
25
20
15
10
5
0
Fold
over
contr
ol
40
45
pcDNA-H
A
TAp6
3a W
t
G530V
I537T
Q634X
R279H
R280C
R304W
S272N
Q566fs
X94
Q536L
- +
DoxySaOs-2 HA-TAp63α
- +
Fig. 3. p63 drives Hes5 and Atoh1 promoters. (A) The Hes5 gene structure shows the presence of a putative p53/p63 RE localized at −988, −966 from the TSS,in the promoter sequence. All promoters analyses were performed by MathInspector professional release 8.0.5, March 2011; Matrix Family Library Version 8.3,October 2010. (B) SaOs2 cells were transiently cotransfected with expression constructs for WT TAp63α-HA or TAp63α-HA mutant (G530V, I537T, Q536L,R280C, R304W, S272N, R279H, Q566fsX94, and Q634X) plus the hHes5-luc reporter vector. There was an increase in luciferase activity in cells transfected withTAp63α-HA WT, more pronounced with the TAp63α-Q634X-HA mutant, but not in cells transduced with the vectors encoding mutants for the DBD (mean ±SD, n = 3). (C) Western blot analysis was performed to verify TAp63a protein expression. (D) ChIP analysis shows the binding of TAp63α to the p53/p63-RE inthe Hes5 promoter. In the Lower panel, the ChIP on the MDM2 promoter used as positive control. (E) The Atoh1 gene structure shows the presence of two p53RE: RE-I5′ localized at −1,682, −1,660 from the TSS; and RE-II3′ in the Enhancer-A. (F) ChIP analysis of the Atoh1 p53-Res. TAp63α binds only to the p53-REAtoh1 enhancer sequence; the MDM2 promoter was used as a positive control. (G) Western blot showing TAp63α protein expression. (H) Luciferase activitywas increased by TAp63α-HA and TAp63α Q634X plasmids. SaOs2 cells were transiently cotransfected with an hAtoh1-luc expression vector, TAp63α-HA, andTAp63α-HA mutants (G530V, I537T, R280C, R304W, S272N, R279H, Q566fsX94, and Q634X) (mean ± SD, n = 3).
2854–2855 | PNAS | February 18, 2014 | vol. 111 | no. 7 www.pnas.org

CELL BIOLOGYCorrection for “Loss of p63 and its microRNA-205 target resultsin enhanced cell migration and metastasis in prostate cancer,” byPaola Tucci, Massimiliano Agostini, Francesca Grespi, Elke K.Markert, Alessandro Terrinoni, Karen H. Vousden, Patricia A. J.Muller, Volker Dötsch, Sebastian Kehrloesser, Berna S. Sayan,Giuseppe Giaccone, Scott W. Lowe, Nozomi Takahashi, PeterVandenabeele, Richard A. Knight, Arnold J. Levine, and Gerry
Melino, which appeared in issue 38, September 18, 2012, ofProc Natl Acad Sci USA (109:15312–15317; first publishedSeptember 4, 2012; 10.1073/pnas.1110977109).The authors note that “The y-axis label of Fig. 5C is incorrect.
Instead of ‘Biochemical Recurrence,’ it should read ‘Biochemical-Free Recurrence.’ We apologize to readers for the erroneous la-beling.” The corrected figure and its corrected legend appear below.
www.pnas.org/cgi/doi/10.1073/pnas.1324223111
Ctrl Scr miR-205 Np630
20
40
60
Num
ber o
f met
asta
sis
*** ***
TIME (months)
D
TIME (months)
C
PR
OB
AB
ILIT
Y
(Bio
chem
ical
-Fre
e R
ecur
renc
e, c
enso
red)
Np63/miR205 function Np63/miR205 intermediate Np63/miR205 loss
PR
OB
AB
ILIT
Y (O
vera
ll Fo
llow
-up
time)
A
B E
Fig. 5. In human prostate cancer, loss of ΔNp63 and miR-205 associates with invasive phenotype and poor clinical outcome. Tumor and normal prostatesamples clustered into three groups reflect the activity of the ΔNp63–miR-205 complex. Groups were indicative of metastatic and invasive behavior as well asclinical prognosis. (C) Time to biochemical-free recurrence for the three groups. (D) Clinical follow-up in the cohort was recorded over 5 y; all data arecensored for survival. Kaplan–Meier analysis with suppressed censoring shows a significant trend within this follow-up time toward poor survival in theΔNp63–miR-205 loss group. (A) miR-205/ΔNp63 relationship. Average expression of ΔNp63 was calculated from ΔNp63-specific probes and compared with miR-205 expression. Metastatic tumor samples are indicated in red diamonds, primary tumors in black squares, and normal samples in blue circles. Pearsoncorrelation was calculated together with the significance of the correlation. Notable is the clean separation between metastatic and normal samples. (B)Heatmap illustrating miR-205 and ΔNp63 expression in prostate cancer. Data show (i) clustering of samples by their ΔNp63/miR-205 expression, Middle bars;(ii) association between normal and ΔNp63/miR-205 expression as well as metastasis and ΔNp63/miR-205 loss, Top bars; and (iii) association between the EMTsignature and the expression of the ΔNp63/miR-205 axis, Bottom bars. Middle bars (clustering): Samples were clustered by their miR-205/ΔNp63 expression(red indicates significant overexpression and blue, significant underexpression of the gene/miR, true color: P ≤ 1.0E-05). This determined one group of sampleswith an active miR-205/ΔNp63 axis (“function”), one group with a clear loss of expression (“loss”), and one intermediate group (“intermediate”) as indicatedin the clustering bar. Top bars (primary, metastasis, normal): The group exhibiting loss of miR-205/ΔNp63 expression was enriched in metastatic samples,whereas the miR-205/ΔNp63 function group was enriched in normal tissue samples (P < 1.0E-06; compare also Fig. S8 A–C). Bottom bars: The miR-205/ΔNp63-loss group was also associated with an EMT transcriptional profile (P < 0.01, compare also Fig. S8D). Signature scores (Sarrio bars) for experimentally derivedsignatures according to Sarrio et al. (27) characterizing EMT are shown. Red indicates significant positive, and blue indicates significant negative association ofa sample with a signature. P value for enrichment of the cluster loss with the signature EMT_up is 0.0014. Full statistics are in Fig. S8D. (E) Lung metastasis innude mice. A total of 1.5 × 10⁶ scrambled control–PC3–Tet–On (12 mice), ΔNp63α–PC3–Tet–On (10 mice), or miR-205–PC3–Tet–On (10 mice) cells were injectedthrough the tail vein of BALB/c nude male mice. ΔNp63α and miR-205 expression was induced with doxycycline through their drinking water. Animals werekilled after 3 wk and total number of lung metastases was counted using a stereomicroscope. ***P < 0.001. See also Fig. S9.
PNAS | February 18, 2014 | vol. 111 | no. 7 | 2855
CORR
ECTIONS

Loss of p63 and its microRNA-205 target results inenhanced cell migration and metastasis inprostate cancerPaola Tuccia,b,1, Massimiliano Agostinia,1, Francesca Grespia,c,d,1, Elke K. Markerte, Alessandro Terrinonif,Karen H. Vousdeng, Patricia A. J. Mullerg, Volker Dötschh, Sebastian Kehrloesserh, Berna S. Sayani, Giuseppe Giacconej,Scott W. Lowek, Nozomi Takahashic,d, Peter Vandenabeelec,d, Richard A. Knighta, Arnold J. Levinee,and Gerry Melinoa,c,f,2
aMedical Research Council, Toxicology Unit, Leicester University, Leicester LE1 9HN, United Kingdom; bDepartment of Pharmaco-Biology, University ofCalabria, 87036 Rende (Cosenza), Italy; cDepartment of Molecular Biomedical Research, Flanders Institute for Biotechnology, B-9052 Ghent, Belgium;dDepartment of Biomedical Molecular Biology, Ghent University, B-9000 Ghent, Belgium; eInstitute for Advanced Study, Princeton, NJ 08540; fBiochemistryLaboratory, Istituto Dermopatico dell’Immacolata, Istituto di Ricovero e Cura a Carattere Scientifico and University of Rome “Tor Vergata,” 00133 Rome, Italy;gThe Beatson Institute for Cancer Research, Glasgow G61 1BD, United Kingdom; hInstitute of Biophysical Chemistry and Center for Biomolecular MagneticResonance, Goethe University, 60438 Frankfurt, Germany; iUniversity of Southampton, Faculty of Medicine, Cancer Sciences Unit, Somers Cancer ResearchBuilding, Southampton SO16 6YD, United Kingdom; jMedical Oncology Branch, National Cancer Institute, National Institutes of Health, Bethesda, MD20892; and kMemorial Sloan-Kettering Cancer Center, New York, NY 10065
Edited by Carol Prives, Columbia University, New York, NY, and approved August 2, 2012 (received for review July 8, 2011)
p63 inhibits metastasis. Here, we show that p63 (both TAp63 andΔNp63 isoforms) regulates expression of miR-205 in prostate can-cer (PCa) cells, and miR-205 is essential for the inhibitory effects ofp63 on markers of epithelial–mesenchymal transition (EMT), suchas ZEB1 and vimentin. Correspondingly, the inhibitory effect ofp63 on EMT markers and cell migration is reverted by anti–miR-205. p53 mutants inhibit expression of both p63 and miR-205, andthe cell migration, in a cell line expressing endogenous mutatedp53, can be abrogated by pre–miR-205 or silencing of mutated p53.In accordance with this in vitro data, ΔNp63 or miR-205 signifi-cantly inhibits the incidence of lung metastasis in vivo in a mousetail vein model. Similarly, one or both components of the p63/miR-205 axis were absent in metastases or colonized lymph nodes in aset of 218 human prostate cancer samples. This was confirmed inan independent clinical data set of 281 patients. Loss of this axiswas associated with higher Gleason scores, an increased likelihoodof metastatic and infiltration events, and worse prognosis. Thesedata suggest that p63/miR-205 may be a useful clinical predictor ofmetastatic behavior in prostate cancer.
tumorigenesis | apoptosis | E-cadherin | PC3 cell | DU145 cell
The p63 protein is a homolog of the p53 tumor suppressorgene and the linear descendant of the most ancient member
of the p53 family (1, 2). Because of the presence of two pro-moters, p63 encodes two major classes of proteins: those con-taining (TAp63) and those lacking (ΔNp63) an N-terminaltransactivating (TA) domain homologous to that present in p53(1). ΔNp63 isoforms can inhibit the transcriptional activity of theTA isoforms, both by competing for consensus promoter ele-ments or by heterodimerization. In addition, alternative splicingat the C terminus generates at least three further isoforms (α, β,and γ) of both TAp63 and ΔNp63. ΔNp63α via a second C-ter-minal TA domain can transactivate a spectrum of genes distinctfrom that recognized by the N-terminal TA domain. Here, weinvestigated the possibility that this transcription factor exerts atleast part of its cancer-related effects (3) by also activating ex-pression of small noncoding RNA sequences such as microRNAs(miRs) (4, 5).A major problem of human cancer is the occurrence of met-
astatic spread. Cells within the primary lesion undergo epithe-lial–mesenchymal transition (EMT), which results in increasedcell motility and migration, and which is associated with in-creased expression of ZEB1, SIP1, and N-cadherin and withreduced expression of E-cadherin. Recently, some of these EMTproteins have been shown to be targeted by miRs, and miRs may
thus play a role in EMT and metastasis (6). For example, ex-pression of the miR-200 family, and miR-205, have been shownto be reduced in models of EMT (7) and act, at least partially, bydirectly targeting the 3′ UTRs of ZEB1 and SIP1. MiR expres-sion profiling has also identified the miR-200 family and miR-205, as well as others, whose expression is selectively reduced inbreast cancer metastases, but not in those of colon, bladder, orlung (8). MiR-205 has also been shown to suppress clonogenicityof MCF-7 breast cancer cells and, importantly, to suppressmetastatic spread of a human breast cancer xenograft in nudemice (9). MiRs, including a reduction in miR-205, have also beenimplicated in prostate cancer (PCa) (10), and their expressionlevels correlated with staging, metastasis, and androgen de-pendence. In addition to its function in the regulation of EMT,the loss of miR-205 in prostate cancer has also been related toreduced expression of the tumor suppressor genes, IL24 andIL32 (11).In the present study, we show that miR-205 expression is regu-
lated by both TAp63 and ΔNp63, and that both p63 and miR-205are lost in human prostate cancer metastasis. The effects of p63on ZEB1 and on the expression of epithelial and mesenchymalmarkers are mediated through miR-205 and p53 mutations, be-cause mutant p53 can suppress the actions of p63. The significanceof this p63/miR-205 axis has been confirmed in mouse metastasismodels and in human clinical samples. These data suggest thatboth p63 and miR-205 may both have diagnostic potential asbiomarkers of metastasis in prostate cancer and provide uniquetherapeutic targets in this common malignancy.
ResultsTAp63 and ΔNp63 Drive the Expression of miR-205. Although p63,and particularly the ΔNp63α isoform, is highly expressed in thebasal layer of normal prostatic epithelium, and is required for thedevelopment of secretory cells, p63 is undetectable in the vast
Author contributions: P.T., R.A.K., and G.M. designed research; P.T., M.A., F.G., E.K.M.,A.T., S.K., B.S.S., and N.T. performed research; K.H.V., P.A.J.M., and S.W.L. contributednew reagents/analytic tools; E.K.M., V.D., G.G., P.V., and A.J.L. analyzed data; and P.T.,R.A.K., and G.M. wrote the paper.
The authors declare no conflict of interest.
This article is a PNAS Direct Submission.1P.T., M.A., and F.G. contributed equally to this work.2To whom correspondence should be addressed. E-mail: [email protected].
This article contains supporting information online at www.pnas.org/lookup/suppl/doi:10.1073/pnas.1110977109/-/DCSupplemental.
15312–15317 | PNAS | September 18, 2012 | vol. 109 | no. 38 www.pnas.org/cgi/doi/10.1073/pnas.1110977109
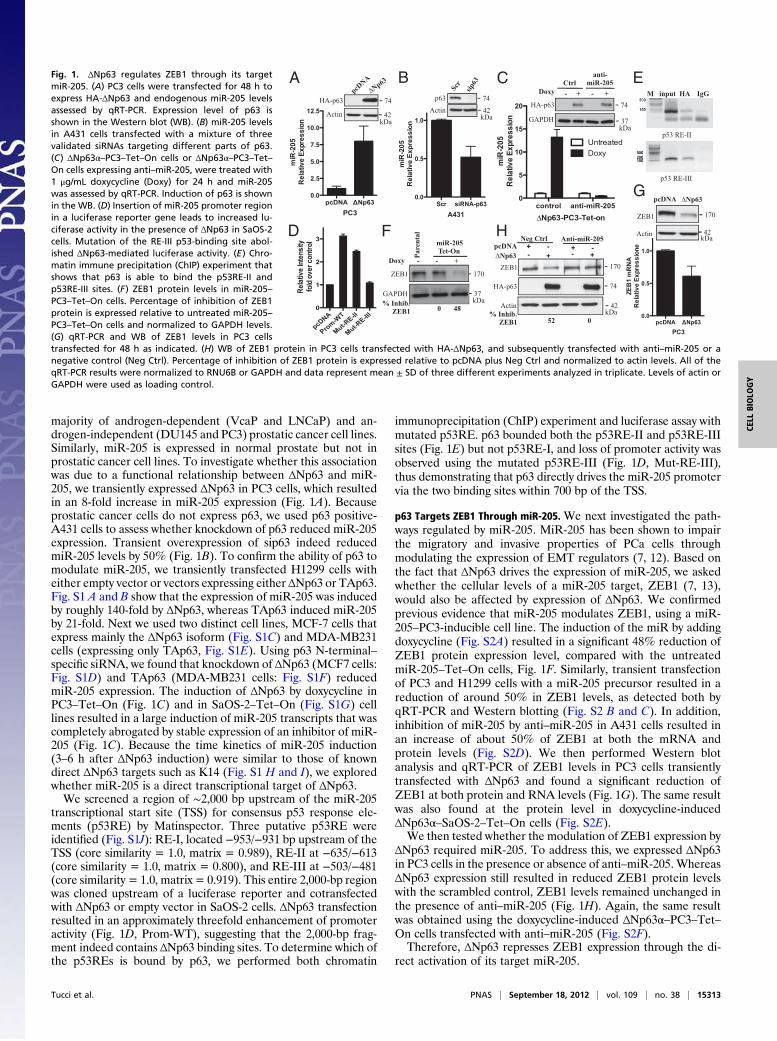
majority of androgen-dependent (VcaP and LNCaP) and an-drogen-independent (DU145 and PC3) prostatic cancer cell lines.Similarly, miR-205 is expressed in normal prostate but not inprostatic cancer cell lines. To investigate whether this associationwas due to a functional relationship between ΔNp63 and miR-205, we transiently expressed ΔNp63 in PC3 cells, which resultedin an 8-fold increase in miR-205 expression (Fig. 1A). Becauseprostatic cancer cells do not express p63, we used p63 positive-A431 cells to assess whether knockdown of p63 reduced miR-205expression. Transient overexpression of sip63 indeed reducedmiR-205 levels by 50% (Fig. 1B). To confirm the ability of p63 tomodulate miR-205, we transiently transfected H1299 cells witheither empty vector or vectors expressing either ΔNp63 or TAp63.Fig. S1 A and B show that the expression of miR-205 was inducedby roughly 140-fold by ΔNp63, whereas TAp63 induced miR-205by 21-fold. Next we used two distinct cell lines, MCF-7 cells thatexpress mainly the ΔNp63 isoform (Fig. S1C) and MDA-MB231cells (expressing only TAp63, Fig. S1E). Using p63 N-terminal–specific siRNA, we found that knockdown of ΔNp63 (MCF7 cells:Fig. S1D) and TAp63 (MDA-MB231 cells: Fig. S1F) reducedmiR-205 expression. The induction of ΔNp63 by doxycycline inPC3–Tet–On (Fig. 1C) and in SaOS-2–Tet–On (Fig. S1G) celllines resulted in a large induction of miR-205 transcripts that wascompletely abrogated by stable expression of an inhibitor of miR-205 (Fig. 1C). Because the time kinetics of miR-205 induction(3–6 h after ΔNp63 induction) were similar to those of knowndirect ΔNp63 targets such as K14 (Fig. S1 H and I), we exploredwhether miR-205 is a direct transcriptional target of ΔNp63.We screened a region of ∼2,000 bp upstream of the miR-205
transcriptional start site (TSS) for consensus p53 response ele-ments (p53RE) by Matinspector. Three putative p53RE wereidentified (Fig. S1J): RE-I, located −953/−931 bp upstream of theTSS (core similarity = 1.0, matrix = 0.989), RE-II at −635/−613(core similarity = 1.0, matrix = 0.800), and RE-III at −503/−481(core similarity = 1.0, matrix = 0.919). This entire 2,000-bp regionwas cloned upstream of a luciferase reporter and cotransfectedwith ΔNp63 or empty vector in SaOS-2 cells. ΔNp63 transfectionresulted in an approximately threefold enhancement of promoteractivity (Fig. 1D, Prom-WT), suggesting that the 2,000-bp frag-ment indeed contains ΔNp63 binding sites. To determine which ofthe p53REs is bound by p63, we performed both chromatin
immunoprecipitation (ChIP) experiment and luciferase assay withmutated p53RE. p63 bounded both the p53RE-II and p53RE-IIIsites (Fig. 1E) but not p53RE-I, and loss of promoter activity wasobserved using the mutated p53RE-III (Fig. 1D, Mut-RE-III),thus demonstrating that p63 directly drives the miR-205 promotervia the two binding sites within 700 bp of the TSS.
p63 Targets ZEB1 Through miR-205. We next investigated the path-ways regulated by miR-205. MiR-205 has been shown to impairthe migratory and invasive properties of PCa cells throughmodulating the expression of EMT regulators (7, 12). Based onthe fact that ΔNp63 drives the expression of miR-205, we askedwhether the cellular levels of a miR-205 target, ZEB1 (7, 13),would also be affected by expression of ΔNp63. We confirmedprevious evidence that miR-205 modulates ZEB1, using a miR-205–PC3-inducible cell line. The induction of the miR by addingdoxycycline (Fig. S2A) resulted in a significant 48% reduction ofZEB1 protein expression level, compared with the untreatedmiR-205–Tet–On cells, Fig. 1F. Similarly, transient transfectionof PC3 and H1299 cells with a miR-205 precursor resulted in areduction of around 50% in ZEB1 levels, as detected both byqRT-PCR and Western blotting (Fig. S2 B and C). In addition,inhibition of miR-205 by anti–miR-205 in A431 cells resulted inan increase of about 50% of ZEB1 at both the mRNA andprotein levels (Fig. S2D). We then performed Western blotanalysis and qRT-PCR of ZEB1 levels in PC3 cells transientlytransfected with ΔNp63 and found a significant reduction ofZEB1 at both protein and RNA levels (Fig. 1G). The same resultwas also found at the protein level in doxycycline-inducedΔNp63α–SaOS-2–Tet–On cells (Fig. S2E).We then tested whether the modulation of ZEB1 expression by
ΔNp63 required miR-205. To address this, we expressed ΔNp63in PC3 cells in the presence or absence of anti–miR-205. WhereasΔNp63 expression still resulted in reduced ZEB1 protein levelswith the scrambled control, ZEB1 levels remained unchanged inthe presence of anti–miR-205 (Fig. 1H). Again, the same resultwas obtained using the doxycycline-induced ΔNp63α–PC3–Tet–On cells transfected with anti–miR-205 (Fig. S2F).Therefore, ΔNp63 represses ZEB1 expression through the di-
rect activation of its target miR-205.
pcDNA
Pro
m-W
T
Mut-RE-II
Mut-RE-III
0
1
2
3
Re
lativ
e In
te
ns
ity
fo
ld o
ve
r c
on
tro
l
Scr siRNA-p63
0.0
0.5
1.0
A431
miR
-2
05
Re
lativ
e E
xp
re
ss
ion
control anti-miR-205
0
5
10
15
20
Untreated Doxy
Np63-PC3-Tet-on
miR
-2
05
Re
lativ
e E
xp
re
ss
ion
pcDNA Np63
0.0
2.5
5.0
7.5
10.0
12.5
PC3
miR
-2
05
Re
lativ
e E
xp
re
ss
ion
HA-p63
Actin
- 74
- 42
A
kDa
p63
Actin
- 74
- 42
B
kDa
C
- 74
GAPDH - 37
HA-p63
anti- miR-205
- + - + Doxy Ctrl
M input HA IgG
p53 RE-II
p53 RE-III
E
D
pcDNA Np63
0.0
0.5
1.0
PC3
ZE
B1
mR
NA
Re
lativ
eE
xp
re
ss
ion
e
G
- 42
- 170
pcDNA Np63
ZEB1
Actin kDa
kDa
F
GAPDH - 37
miR-205 Tet-On
- - + Doxy Pare
ntal
ZEB1 - 170
0 48 % Inhib.
ZEB1 kDa
H Neg Ctrl Anti-miR-205
pcDNA Np63
- 170 ZEB1
Actin
HA-p63
- 42
- 74
% Inhib. ZEB1
+ - + -
+ -
52 0 kDa
+ -
Fig. 1. ΔNp63 regulates ZEB1 through its targetmiR-205. (A) PC3 cells were transfected for 48 h toexpress HA-ΔNp63 and endogenous miR-205 levelsassessed by qRT-PCR. Expression level of p63 isshown in the Western blot (WB). (B) miR-205 levelsin A431 cells transfected with a mixture of threevalidated siRNAs targeting different parts of p63.(C) ΔNp63α–PC3–Tet–On cells or ΔNp63α–PC3–Tet–On cells expressing anti–miR-205, were treated with1 μg/mL doxycycline (Doxy) for 24 h and miR-205was assessed by qRT-PCR. Induction of p63 is shownin the WB. (D) Insertion of miR-205 promoter regionin a luciferase reporter gene leads to increased lu-ciferase activity in the presence of ΔNp63 in SaOS-2cells. Mutation of the RE-III p53-binding site abol-ished ΔNp63-mediated luciferase activity. (E) Chro-matin immune precipitation (ChIP) experiment thatshows that p63 is able to bind the p53RE-II andp53RE-III sites. (F) ZEB1 protein levels in miR-205–PC3–Tet–On cells. Percentage of inhibition of ZEB1protein is expressed relative to untreated miR-205–PC3–Tet–On cells and normalized to GAPDH levels.(G) qRT-PCR and WB of ZEB1 levels in PC3 cellstransfected for 48 h as indicated. (H) WB of ZEB1 protein in PC3 cells transfected with HA-ΔNp63, and subsequently transfected with anti–miR-205 or anegative control (Neg Ctrl). Percentage of inhibition of ZEB1 protein is expressed relative to pcDNA plus Neg Ctrl and normalized to actin levels. All of theqRT-PCR results were normalized to RNU6B or GAPDH and data represent mean ± SD of three different experiments analyzed in triplicate. Levels of actin orGAPDH were used as loading control.
Tucci et al. PNAS | September 18, 2012 | vol. 109 | no. 38 | 15313
CELL
BIOLO
GY
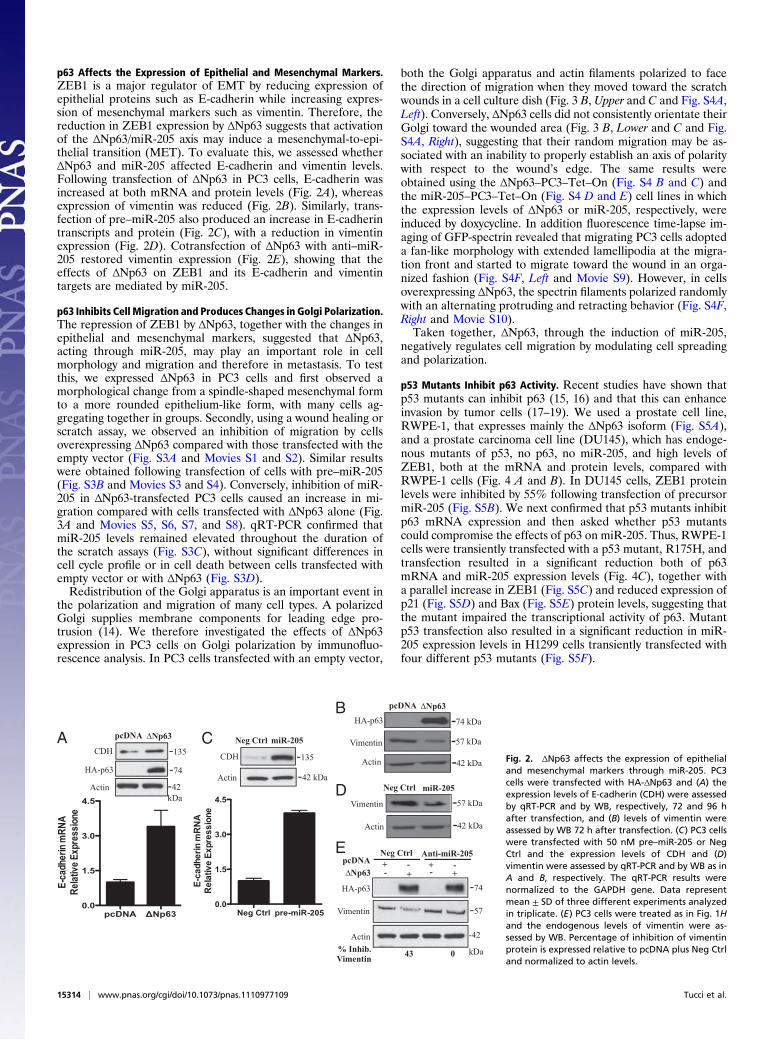
p63 Affects the Expression of Epithelial and Mesenchymal Markers.ZEB1 is a major regulator of EMT by reducing expression ofepithelial proteins such as E-cadherin while increasing expres-sion of mesenchymal markers such as vimentin. Therefore, thereduction in ZEB1 expression by ΔNp63 suggests that activationof the ΔNp63/miR-205 axis may induce a mesenchymal-to-epi-thelial transition (MET). To evaluate this, we assessed whetherΔNp63 and miR-205 affected E-cadherin and vimentin levels.Following transfection of ΔNp63 in PC3 cells, E-cadherin wasincreased at both mRNA and protein levels (Fig. 2A), whereasexpression of vimentin was reduced (Fig. 2B). Similarly, trans-fection of pre–miR-205 also produced an increase in E-cadherintranscripts and protein (Fig. 2C), with a reduction in vimentinexpression (Fig. 2D). Cotransfection of ΔNp63 with anti–miR-205 restored vimentin expression (Fig. 2E), showing that theeffects of ΔNp63 on ZEB1 and its E-cadherin and vimentintargets are mediated by miR-205.
p63 Inhibits Cell Migration and Produces Changes in Golgi Polarization.The repression of ZEB1 by ΔNp63, together with the changes inepithelial and mesenchymal markers, suggested that ΔNp63,acting through miR-205, may play an important role in cellmorphology and migration and therefore in metastasis. To testthis, we expressed ΔNp63 in PC3 cells and first observed amorphological change from a spindle-shaped mesenchymal formto a more rounded epithelium-like form, with many cells ag-gregating together in groups. Secondly, using a wound healing orscratch assay, we observed an inhibition of migration by cellsoverexpressing ΔNp63 compared with those transfected with theempty vector (Fig. S3A and Movies S1 and S2). Similar resultswere obtained following transfection of cells with pre–miR-205(Fig. S3B and Movies S3 and S4). Conversely, inhibition of miR-205 in ΔNp63-transfected PC3 cells caused an increase in mi-gration compared with cells transfected with ΔNp63 alone (Fig.3A and Movies S5, S6, S7, and S8). qRT-PCR confirmed thatmiR-205 levels remained elevated throughout the duration ofthe scratch assays (Fig. S3C), without significant differences incell cycle profile or in cell death between cells transfected withempty vector or with ΔNp63 (Fig. S3D).Redistribution of the Golgi apparatus is an important event in
the polarization and migration of many cell types. A polarizedGolgi supplies membrane components for leading edge pro-trusion (14). We therefore investigated the effects of ΔNp63expression in PC3 cells on Golgi polarization by immunofluo-rescence analysis. In PC3 cells transfected with an empty vector,
both the Golgi apparatus and actin filaments polarized to facethe direction of migration when they moved toward the scratchwounds in a cell culture dish (Fig. 3 B, Upper and C and Fig. S4A,Left). Conversely, ΔNp63 cells did not consistently orientate theirGolgi toward the wounded area (Fig. 3 B, Lower and C and Fig.S4A, Right), suggesting that their random migration may be as-sociated with an inability to properly establish an axis of polaritywith respect to the wound’s edge. The same results wereobtained using the ΔNp63–PC3–Tet–On (Fig. S4 B and C) andthe miR-205–PC3–Tet–On (Fig. S4 D and E) cell lines in whichthe expression levels of ΔNp63 or miR-205, respectively, wereinduced by doxycycline. In addition fluorescence time-lapse im-aging of GFP-spectrin revealed that migrating PC3 cells adopteda fan-like morphology with extended lamellipodia at the migra-tion front and started to migrate toward the wound in an orga-nized fashion (Fig. S4F, Left and Movie S9). However, in cellsoverexpressing ΔNp63, the spectrin filaments polarized randomlywith an alternating protruding and retracting behavior (Fig. S4F,Right and Movie S10).Taken together, ΔNp63, through the induction of miR-205,
negatively regulates cell migration by modulating cell spreadingand polarization.
p53 Mutants Inhibit p63 Activity. Recent studies have shown thatp53 mutants can inhibit p63 (15, 16) and that this can enhanceinvasion by tumor cells (17–19). We used a prostate cell line,RWPE-1, that expresses mainly the ΔNp63 isoform (Fig. S5A),and a prostate carcinoma cell line (DU145), which has endoge-nous mutants of p53, no p63, no miR-205, and high levels ofZEB1, both at the mRNA and protein levels, compared withRWPE-1 cells (Fig. 4 A and B). In DU145 cells, ZEB1 proteinlevels were inhibited by 55% following transfection of precursormiR-205 (Fig. S5B). We next confirmed that p53 mutants inhibitp63 mRNA expression and then asked whether p53 mutantscould compromise the effects of p63 on miR-205. Thus, RWPE-1cells were transiently transfected with a p53 mutant, R175H, andtransfection resulted in a significant reduction both of p63mRNA and miR-205 expression levels (Fig. 4C), together witha parallel increase in ZEB1 (Fig. S5C) and reduced expression ofp21 (Fig. S5D) and Bax (Fig. S5E) protein levels, suggesting thatthe mutant impaired the transcriptional activity of p63. Mutantp53 transfection also resulted in a significant reduction in miR-205 expression levels in H1299 cells transiently transfected withfour different p53 mutants (Fig. S5F).
pcDNA Np63
0.0
1.5
3.0
4.5
E-c
ad
he
rin
mR
NA
Re
lativ
e E
xp
re
ss
ion
e
CDH -135
Actin
pcDNA Np63
HA-p63 -74
-42 kDa
A Vimentin -57 kDa
Actin -42 kDa
pcDNA Np63 HA-p63 -74 kDa
B
Vimentin -57 kDa
Actin -42 kDa
Neg Ctrl miR-205 D
Neg Ctrl pre-miR-205
0.0
1.5
3.0
4.5
E-c
ad
he
rin
mR
NA
Re
lativ
e E
xp
re
ss
ion
e
CDH -135
Actin -42 kDa
Neg Ctrl miR-205 C
Neg Ctrl Anti-miR-205 pcDNA
Np63
Actin
HA-p63
-42
-74
+ -
Vimentin -57
% Inhib. Vimentin 43 0
+ - + - + -
E
kDa
Fig. 2. ΔNp63 affects the expression of epithelialand mesenchymal markers through miR-205. PC3cells were transfected with HA-ΔNp63 and (A) theexpression levels of E-cadherin (CDH) were assessedby qRT-PCR and by WB, respectively, 72 and 96 hafter transfection, and (B) levels of vimentin wereassessed by WB 72 h after transfection. (C) PC3 cellswere transfected with 50 nM pre–miR-205 or NegCtrl and the expression levels of CDH and (D)vimentin were assessed by qRT-PCR and by WB as inA and B, respectively. The qRT-PCR results werenormalized to the GAPDH gene. Data representmean ± SD of three different experiments analyzedin triplicate. (E) PC3 cells were treated as in Fig. 1Hand the endogenous levels of vimentin were as-sessed by WB. Percentage of inhibition of vimentinprotein is expressed relative to pcDNA plus Neg Ctrland normalized to actin levels.
15314 | www.pnas.org/cgi/doi/10.1073/pnas.1110977109 Tucci et al.

To assess whether the reduction in expression of p63 targetswas secondary to a reduction in the steady-state protein levels ofp63 itself, we performed a cycloheximide blocking experimentmeasuring p63 stability. As shown in Fig. S5H and I, p53–R175Htransfection in PC3 and H1299 cells reduced p63 half-life com-pared with p53 WT. Conversely, knockdown of the endogenousp53 mutant in DU145 cells increased p63 stability (Fig. 4D,quantified in Fig. S5G), with an increase both of p63 protein andof its target p21 (Fig. 4E).To identify a direct interaction between p53 and p63, we
coimmunoprecipitated p63 and mutant p53 both in PC3 reex-pressing p53-WT (Fig. 4F and Fig. S6A andB) and inDU145 (Fig.S6C). A significant interaction was detected with all mutants, es-pecially the DNA binding domain (DBD) unfolded R175H,a mutant known to have a destabilized DNA binding domain andbeing prone to aggregation (Fig. S6D). Coexpression in cells seems
to be necessary to establish aggregation-based interaction,whereas the more transient interaction in pull-down assays withthe isolated p63 DBD is not sufficient to form stable aggregates(Fig. S6 E and F).P53 mutant DU145 cells showed enhanced migration in the
scratch assay compared with the p53 wild-type RWPE-1 cells,and this could be at least partially reversed by transfection ofDU145 with pre–miR-205, and pre–miR-205 transfection inthese cells had no effects on cell cycle or apoptosis (Fig. S7 A–Cand Movies S11, S12, and S13). To further investigate the be-havior of p53 mutant-expressing cells, we examined their mi-gration in a scratch-wound assay obtained after plating DU145cells and DU145 cells transiently transfected with a human miR-205 GFP construct (Fig. S7D). This confirmed that the migrationof cells expressing miR-205 was inhibited. Moreover, transfectedcells moved erratically into the wound (tortuosity; Fig. S7E),
pcDNA Np63 pcDNA Np63 pcDNA Np63
0
20
40
60
80 FrontMiddleBack
0 hours 2 hours 6 hours
%T
ota
lc
ells
(G
FP
po
sitiv
e)
****C B
pcD
NA
Neg Ctrl
0 h
36 h
pcDNA Np63 A anti-miR-205
pcDNA Np63
Np6
3
GFP-phalloidin
Golgi
DAPI
Fig. 3. ΔNp63 inhibits cell migration and polariza-tion through miR-205. (A) Wound healing assays ofPC3 cells transfected with HA-ΔNp63 and sub-sequently transfected with 100 nM anti–miR-205 orNeg Ctrl. Monolayers were scratch wounded witha p10 tip and filmed for 36 h under light time-lapsemicroscopy. The wound closure is illustrated byshowing the wound immediately (0 h) and 36 hafter the scratch. Images are representative of ninefields from three independent experiments. Seealso Movies S5, S6, S7, and S8. (B) PC3 cells, trans-fected with an empty vector (Upper) or with ΔNp63(Lower) along with GFP-phalloidin (green), weregrown in monolayers and wounded. Localization ofthe Golgi (red) was determined using immunoflu-orescence and cells were counterstained with DAPI(blue). Stills taken from confocal imaging and rep-resentative of three or more independent experi-ments are shown. (C) Localization of the Golgicomplex in >100 GFP+ cells around the edge of thewound at 0, 2, and 6 h after scratch. Data representmean ± SEM of three different experiments ana-lyzed in triplicate. *P < 0.05, ***P < 0.001.
p63 miR-205
0.0
0.5
1.0
1.5 pcDNAR175H
RWPE-1
Re
lativ
eE
xp
re
ss
ion
p63
Actin -42 KDa
-74
ZEB1 -170
p53 -53
B C
ND
ND
A
p63 miR-205 ZEB1
0
1
2
3
RWPE-1DU145
Re
lativ
eE
xp
re
ss
ion
GAPDH
p21
DU145
-37 kDa
-21
Scr
GAPDH
si-p53
p53
p63
E
-53
-74
-37
F
WT
p53
EV
R17
5H
R27
3H
R24
8W
R24
9S
75 - - p63
IP:p53
3 84 52 54 59 % of input
- p IP:p63
50 -
1 98 91 66 46 % of input
PC3
D
-37 kDa
-74
-53
0h 2h 4h 6h 8h 0h 2h 4h 6h 8h Scrambled si-p53
p63
p53
GAPDH
DU145
CHX
Fig. 4. Mutant p53 correlates with the loss of p63.(A) Expression levels of p63, miR-205, and ZEB1 inDU145 cells relative to the RWPE-1 cells. (B) WB ofZEB1, p63, and p53 proteins in RWPE-1 and inDU145 cell. (C) RWPE-1 cells were transfected witha p53 mutant, R175H, and levels of p63 and miR-205were assessed by qRT-PCR. (D) Silencing of endog-enous mutant p53 stabilizes p63 half-life in thepresence of cycloheximide (CHX). (E) Reactivationof p63 protein and WB of p21 in p53-silencedDU145 cells. (F) p63 interacts with p53 mutants. PC3cells were cotransfected with Myc-ΔNp63, p53 WT,or with the indicated p53 mutants and coimmuno-precipitated with the indicated antibody. Full con-trols are shown in Fig. S6 A and B. Percentage ofpull-down over input is indicated. One of three in-dependent experiments is shown.
Tucci et al. PNAS | September 18, 2012 | vol. 109 | no. 38 | 15315
CELL
BIOLO
GY
displayed a marked loss of straight distance (Fig. S7F), meanvelocity (Fig. S7G), and total distance migrated (Fig. S7H).Conversely, silencing of endogenous mutant p53 resulted in aninhibition of cell migration compared with the parental DU145cells, again without affecting cell cycle profile or apoptosis (Fig.S7 I and J and Movies S14 and S15).
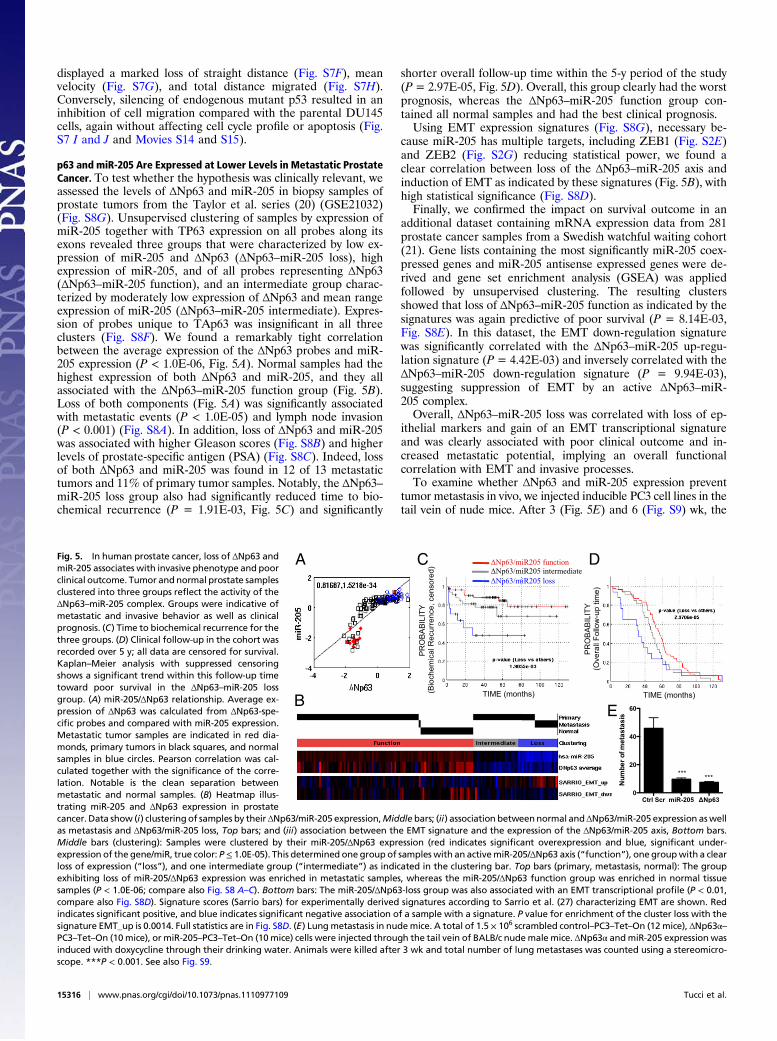
p63 and miR-205 Are Expressed at Lower Levels in Metastatic ProstateCancer. To test whether the hypothesis was clinically relevant, weassessed the levels of ΔNp63 and miR-205 in biopsy samples ofprostate tumors from the Taylor et al. series (20) (GSE21032)(Fig. S8G). Unsupervised clustering of samples by expression ofmiR-205 together with TP63 expression on all probes along itsexons revealed three groups that were characterized by low ex-pression of miR-205 and ΔNp63 (ΔNp63–miR-205 loss), highexpression of miR-205, and of all probes representing ΔNp63(ΔNp63–miR-205 function), and an intermediate group charac-terized by moderately low expression of ΔNp63 and mean rangeexpression of miR-205 (ΔNp63–miR-205 intermediate). Expres-sion of probes unique to TAp63 was insignificant in all threeclusters (Fig. S8F). We found a remarkably tight correlationbetween the average expression of the ΔNp63 probes and miR-205 expression (P < 1.0E-06, Fig. 5A). Normal samples had thehighest expression of both ΔNp63 and miR-205, and they allassociated with the ΔNp63–miR-205 function group (Fig. 5B).Loss of both components (Fig. 5A) was significantly associatedwith metastatic events (P < 1.0E-05) and lymph node invasion(P < 0.001) (Fig. S8A). In addition, loss of ΔNp63 and miR-205was associated with higher Gleason scores (Fig. S8B) and higherlevels of prostate-specific antigen (PSA) (Fig. S8C). Indeed, lossof both ΔNp63 and miR-205 was found in 12 of 13 metastatictumors and 11% of primary tumor samples. Notably, the ΔNp63–miR-205 loss group also had significantly reduced time to bio-chemical recurrence (P = 1.91E-03, Fig. 5C) and significantly
shorter overall follow-up time within the 5-y period of the study(P = 2.97E-05, Fig. 5D). Overall, this group clearly had the worstprognosis, whereas the ΔNp63–miR-205 function group con-tained all normal samples and had the best clinical prognosis.Using EMT expression signatures (Fig. S8G), necessary be-
cause miR-205 has multiple targets, including ZEB1 (Fig. S2E)and ZEB2 (Fig. S2G) reducing statistical power, we found aclear correlation between loss of the ΔNp63–miR-205 axis andinduction of EMT as indicated by these signatures (Fig. 5B), withhigh statistical significance (Fig. S8D).Finally, we confirmed the impact on survival outcome in an
additional dataset containing mRNA expression data from 281prostate cancer samples from a Swedish watchful waiting cohort(21). Gene lists containing the most significantly miR-205 coex-pressed genes and miR-205 antisense expressed genes were de-rived and gene set enrichment analysis (GSEA) was appliedfollowed by unsupervised clustering. The resulting clustersshowed that loss of ΔNp63–miR-205 function as indicated by thesignatures was again predictive of poor survival (P = 8.14E-03,Fig. S8E). In this dataset, the EMT down-regulation signaturewas significantly correlated with the ΔNp63–miR-205 up-regu-lation signature (P = 4.42E-03) and inversely correlated with theΔNp63–miR-205 down-regulation signature (P = 9.94E-03),suggesting suppression of EMT by an active ΔNp63–miR-205 complex.Overall, ΔNp63–miR-205 loss was correlated with loss of ep-
ithelial markers and gain of an EMT transcriptional signatureand was clearly associated with poor clinical outcome and in-creased metastatic potential, implying an overall functionalcorrelation with EMT and invasive processes.To examine whether ΔNp63 and miR-205 expression prevent
tumor metastasis in vivo, we injected inducible PC3 cell lines in thetail vein of nude mice. After 3 (Fig. 5E) and 6 (Fig. S9) wk, the
Ctrl Scr miR-205 Np63
0
20
40
60
Nu
mb
er o
f m
eta
sta
sis
*** ***
TIME (months)
D
TIME (months)
C
PR
OB
AB
ILIT
Y
(Bio
chem
ical
Rec
urre
nce,
cen
sore
d) Np63/miR205 function
Np63/miR205 intermediate Np63/miR205 loss
PR
OB
AB
ILIT
Y (O
vera
ll Fo
llow
-up
time)
A
B E
Fig. 5. In human prostate cancer, loss of ΔNp63 andmiR-205 associates with invasive phenotype and poorclinical outcome. Tumor andnormal prostate samplesclustered into three groups reflect the activity of theΔNp63–miR-205 complex. Groups were indicative ofmetastatic and invasive behavior as well as clinicalprognosis. (C) Time to biochemical recurrence for thethree groups. (D) Clinical follow-up in the cohort wasrecorded over 5 y; all data are censored for survival.Kaplan–Meier analysis with suppressed censoringshows a significant trend within this follow-up timetoward poor survival in the ΔNp63–miR-205 lossgroup. (A) miR-205/ΔNp63 relationship. Average ex-pression of ΔNp63 was calculated from ΔNp63-spe-cific probes and compared with miR-205 expression.Metastatic tumor samples are indicated in red dia-monds, primary tumors in black squares, and normalsamples in blue circles. Pearson correlation was cal-culated together with the significance of the corre-lation. Notable is the clean separation betweenmetastatic and normal samples. (B) Heatmap illus-trating miR-205 and ΔNp63 expression in prostatecancer. Data show (i) clustering of samples by their ΔNp63/miR-205 expression,Middlebars; (ii) association betweennormal andΔNp63/miR-205 expression aswellas metastasis and ΔNp63/miR-205 loss, Top bars; and (iii) association between the EMT signature and the expression of the ΔNp63/miR-205 axis, Bottom bars.Middle bars (clustering): Samples were clustered by their miR-205/ΔNp63 expression (red indicates significant overexpression and blue, significant under-expression of the gene/miR, true color: P≤ 1.0E-05). This determined one group of samples with an activemiR-205/ΔNp63 axis (“function”), one groupwith a clearloss of expression (“loss”), and one intermediate group (“intermediate”) as indicated in the clustering bar. Top bars (primary, metastasis, normal): The groupexhibiting loss of miR-205/ΔNp63 expression was enriched in metastatic samples, whereas the miR-205/ΔNp63 function group was enriched in normal tissuesamples (P < 1.0E-06; compare also Fig. S8 A–C). Bottom bars: The miR-205/ΔNp63-loss group was also associated with an EMT transcriptional profile (P < 0.01,compare also Fig. S8D). Signature scores (Sarrio bars) for experimentally derived signatures according to Sarrio et al. (27) characterizing EMT are shown. Redindicates significant positive, and blue indicates significant negative association of a sample with a signature. P value for enrichment of the cluster loss with thesignature EMT_up is 0.0014. Full statistics are in Fig. S8D. (E) Lungmetastasis in nudemice. A total of 1.5 × 10⁶ scrambled control–PC3–Tet–On (12mice), ΔNp63α–PC3–Tet–On (10mice), or miR-205–PC3–Tet–On (10mice) cells were injected through the tail vein of BALB/c nudemale mice. ΔNp63α andmiR-205 expression wasinduced with doxycycline through their drinking water. Animals were killed after 3 wk and total number of lung metastases was counted using a stereomicro-scope. ***P < 0.001. See also Fig. S9.
15316 | www.pnas.org/cgi/doi/10.1073/pnas.1110977109 Tucci et al.

mice were killed and the lungs removed for analysis. The lungsderived from control mice injected with scrambled expressing PC3cells had the highest number of metastases. A significant reductionin the incidence of lung metastasis was detected in mice injectedwith cells expressing miR-205 or ΔNp63 (Fig. 5E and Fig. S9).These results clearly show that both ΔNp63 and miR-205 expres-sion significantly inhibit the in vivo incidence of lung metastasis.
DiscussionΔNp63 is frequently overexpressed in epithelial cancers, being cor-related with poor prognosis (22). In contrast, TAp63 has beenreported to suppress metastasis through the regulation of Dicer, anenzyme important for miR maturation, and through a number ofspecificmiRs, includingmiR-130b (23). In the present study, we showthatmiR-205 expression is regulated by both TAp63 andΔNp63, andthat both p63 and miR-205 are lost in human prostate cancer me-tastasis. Thus, the loss of ΔNp63 in prostate cancer is associated withmetastatic spread and worse prognosis due to the indirect regulationby ΔNp63 of ZEB1, an important modulator of EMT.Previous studies have shown that miR-205 regulates both
ZEB1 and SIP1 and that inhibition of miR-205 reduces expres-sion of E-cadherin while increasing the levels of mesenchymalmarkers (7). As a consequence of its involvement in the regu-lation of EMT, loss of miR-205 is associated with enhancedmetastatic potential in both model tumor systems and in humancancers, particularly of the breast (7, 9). Several additional miR-205 targets, which may influence tumor behavior, have also beenidentified, including ErbB3 and VEGF-A (9), LDL receptor-related protein 1 (24), and PKC«́ (12). In the present study, wedemonstrate that miR-205 is a direct target of ΔNp63, and theeffects of ΔNp63 on EMT markers, such as ZEB1, are abrogatedby anti–miR-205. Similarly, the inhibition of cell migration re-sulting from ΔNp63 expression is reversed by anti–miR-205. Inhuman prostate cancer samples, partial, and more strikingly,complete loss of the ΔNp63/miR-205 axis is correlated with EMTexpression patterns and is a predictor of metastatic spread,lymph node involvement, and overall poor prognosis.p53 mutants have been shown to physically interact with p63
isoforms (25, 26). TAp63 and ΔNp63 activity can also be inhibitedwhen they are incorporated into a complex with mutant p53 and
TGFβ activated Smads, with dysregulation of two metastasis-re-lated genes, Sharp-1 and cyclin G2 (15). In the present study, weshow that p53 mutants reduce ΔNp63 and miR-205 expression incells, with a corresponding increase in cell migration. This is at leastpartially rescued by transfection with pre–miR-205. We furtherdemonstrate that several p53 mutants, reduce p63 stability, and thereduction in p63 levels may contribute to the reduced expression ofits transcriptional targets such as miR-205. However, we cannotexclude the possibility that mutant p53 also inhibits p63 activity bycompetition for consensus binding sites in the promoters of targetgenes or by sequestration into aggregates. Thus, in cancers in whichp53 mutations tend to occur in late stages, cell migration, EMT,and metastasis could all be potentially enhanced, even when p63remains expressed, due to its functional inhibition by mutant p53.These data show that the p63/miR-205 axis provides a linked
molecular footprint, which is predictive of the metastatic po-tential of prostate cancer, and which may be a useful clinicalbiomarker. In addition, studies aimed at identifying the mecha-nisms that lead to ΔNp63 down-regulation in the prostate, suchas miR-203, may reveal new therapeutic targets to contain thespread of this common cancer.
Materials and MethodsDetails are provided in SI Materials and Methods for cell culture and trans-fection, generation of stable cell lines, Western blotting, coimmunoprecipi-tation, RNA extraction, qRT-PCR, Luc assay, chromatin immunoprecipitation,wound healing assay, immunofluorescence microscopy, flow cytometry anal-ysis, gene expression and clustering analysis, and tumor metastasis in vivo.
Data are reported as mean values ± SD or ± SEM of at least three in-dependent experiments. Unpaired Student t test was used to generate sta-tistical analysis. P values <0.05 were considered statistically significant.
ACKNOWLEDGMENTS. We thank David Read for technical assistance withtime-lapse microscopy. This work has been supported by the Medical ResearchCouncil, United Kingdom; Grants from “Alleanza contro il Cancro” (ACC12-ACC6), Ministero Istruzione Università Ricerca/Progetti di Ricerca di InteresseNazionale (RBIP06LCA9_0023), Associazione Italiana per la Ricerca sul Cancro(2008-2010_33-08), Italian Human ProteomeNet RBRN07BMCT, Ministero dellaSalute (Ricerca Oncologica 26/07), IDI-IRCCS RF06 (convenzione 73), RF07 (con-venzione 57) (to G.M.), Odysseus Grant (G.0017.12) from the Flemish govern-ment and Flanders Institute for Biotechnology, Belgium (to G.M.), and GrantPo1CA87497 from the National Cancer Institute (to A.J.L. and S.W.L.).
1. Yang A, et al. (1998) p63, a p53 homolog at 3q27-29, encodes multiple products
with transactivating, death-inducing, and dominant-negative activities. Mol Cell 2:
305–316.2. Levine AJ, Tomasini R, McKeon FD, Mak TW, Melino G (2011) The p53 family:
Guardians of maternal reproduction. Nat Rev Mol Cell Biol 12:259–265.3. Melino G (2011) p63 is a suppressor of tumorigenesis and metastasis interacting with
mutant p53. Cell Death Differ 18:1487–1499.4. Antonini D, et al. (2010) Transcriptional repression of miR-34 family contributes to
p63-mediated cell cycle progression in epidermal cells. J Invest Dermatol 130:
1249–1257.5. Rivetti di Val Cervo P, et al. (2012) p63-microRNA feedback in keratinocyte senes-
cence. Proc Natl Acad Sci USA 109:1133–1138.6. Gregory PA, Bracken CP, Bert AG, Goodall GJ (2008) MicroRNAs as regulators of ep-
ithelial-mesenchymal transition. Cell Cycle 7:3112–3118.7. Gregory PA, et al. (2008) The miR-200 family and miR-205 regulate epithelial to
mesenchymal transition by targeting ZEB1 and SIP1. Nat Cell Biol 10:593–601.8. Baffa R, et al. (2009) MicroRNA expression profiling of human metastatic cancers
identifies cancer gene targets. J Pathol 219:214–221.9. Wu H, Zhu S, Mo YY (2009) Suppression of cell growth and invasion by miR-205 in
breast cancer. Cell Res 19:439–448.10. Coppola V, De Maria R, Bonci D (2010) MicroRNAs and prostate cancer. Endocr Relat
Cancer 17:F1–F17.11. Majid S, et al. (2010) MicroRNA-205-directed transcriptional activation of tumor
suppressor genes in prostate cancer. Cancer 116:5637–5649.12. Gandellini P, et al. (2009) miR-205 Exerts tumor-suppressive functions in human
prostate through down-regulation of protein kinase Cepsilon. Cancer Res 69:
2287–2295.13. Graham TR, et al. (2008) Insulin-like growth factor-I-dependent up-regulation of ZEB1
drives epithelial-to-mesenchymal transition in human prostate cancer cells. Cancer
Res 68:2479–2488.
14. Kupfer A, Louvard D, Singer SJ (1982) Polarization of the Golgi apparatus and themicrotubule-organizing center in cultured fibroblasts at the edge of an experimentalwound. Proc Natl Acad Sci USA 79:2603–2607.
15. Adorno M, et al. (2009) A Mutant-p53/Smad complex opposes p63 to empowerTGFbeta-induced metastasis. Cell 137:87–98.
16. Muller PAJ, et al. (2009) Mutant p53 drives invasion by promoting integrin recycling.Cell 139:1327–1341.
17. Lang GA, et al. (2004) Gain of function of a p53 hot spot mutation in a mouse modelof Li-Fraumeni syndrome. Cell 119:861–872.
18. Flores ER, et al. (2005) Tumor predisposition in mice mutant for p63 and p73: Evidencefor broader tumor suppressor functions for the p53 family. Cancer Cell 7:363–373.
19. Muller PA, et al. (2012) Mutant p53 enhances MET trafficking and signalling to drivecell scattering and invasion. Oncogene, 10.1038/onc.2012.148.
20. Taylor BS, et al. (2010) Integrative genomic profiling of human prostate cancer.Cancer Cell 18:11–22.
21. Sboner A, et al. (2010) Molecular sampling of prostate cancer: A dilemma for pre-dicting disease progression. BMC Med Genomics 16:3–8.
22. Chiang CT, Chu WK, Chow SE, Chen JK (2009) Overexpression of delta Np63 in a hu-man nasopharyngeal carcinoma cell line downregulates CKIs and enhances cell pro-liferation. J Cell Physiol 219:117–122.
23. Su X, et al. (2010) TAp63 suppresses metastasis through coordinate regulation ofDicer and miRNAs. Nature 467:986–990.
24. Song H, Bu G (2009) MicroRNA-205 inhibits tumor cell migration through down-regulating the expression of the LDL receptor-related protein 1. Biochem Biophys ResCommun 388:400–405.
25. Strano S, et al. (2002) Physical interaction with human tumor-derived p53 mutantsinhibits p63 activities. J Biol Chem 277:18817–18826.
26. Gaiddon C, Lokshin M, Ahn J, Zhang T, Prives C (2001) A subset of tumor-derivedmutant forms of p53 down-regulate p63 and p73 through a direct interaction withthe p53 core domain. Mol Cell Biol 21:1874–1887.
27. Sarrió D, et al. (2008) Epithelial-mesenchymal transition in breast cancer relates to thebasal-like phenotype. Cancer Res 68:989–997.
Tucci et al. PNAS | September 18, 2012 | vol. 109 | no. 38 | 15317
CELL
BIOLO
GY


