losing the Caital a
52
Fueling the Promise of Latino-owned Businesses Closing the Capital Gap
Transcript of losing the Caital a

Fueling the Promise of Latino-owned Businesses
Closing the Capital Gap

Copyright © 2021 Bain & Company, Inc. All rights reserved.
Authors
Hernan Saenz is a partner and leads Bain’s Performance Improvement practice
Tevia Segovia is a partner in Bain’s Financial Services practice
Alex Noether is an expert associate partner in Bain’s Diversity, Equity, and Inclusion practice
Brenen Blair is an associate partner in Bain’s Diversity, Equity, and Inclusion practice
Acknowledgments
Bain & Company gratefully acknowledges the substantial assistance of the Stanford Latino Entrepreneurship Initiative in the research for this report. We also appreciate the collaboration with the Latino Donor Collaborative and are pleased that this report will feature among the LDC 2021 reports on Latinos in the US economy.

Bain & Company, Inc. | Closing the Capital Gap: Fueling the Promise of Latino-owned Businesses | 1
At a Glance
Latinos are a growing, youthful, and highly productive cohort that will drive future US economic and population growth—and Latino-owned businesses (LOBs) are an overlooked investment opportunity.
Despite their enormous importance to the economy, LOBs are under-funded across all sources of capital.
This is a clear opportunity for equity investors and LOBs. LOBs need equity investment so that they can direct cash flow to growth. Angels, venture capital, private equity, and other equity sources can serve this unmet need with an expectation of high returns.
LOBs appear to struggle with a “scale wall” at around $1 million in revenue, at which point high-cost debt and a lack of equity investments may pose significant challenges in reinvesting cash to scale.
LOBs are not monolithic: Six distinct segments need equitable evaluations, new products, and enhanced awareness of funding options, offering opportunities for institutional investors of all types.
Of all net new small businesses created
from 2007 to 2017 are Latino owned
50%Share of investments to
Latino-owned businesses from top 25 venture capital
and private equity firms
1%

2 | Closing the Capital Gap: Fueling the Promise of Latino-owned Businesses | Bain & Company, Inc.

Bain & Company, Inc. | Closing the Capital Gap: Fueling the Promise of Latino-owned Businesses | 3
Latino-owned businesses (LOBs) are an overlooked opportunity in the current US economy.
The total economic output of US Latinos was $2.6 trillion in 2018, making US Latinos the equivalent of the eighth-largest economy in the world. Latinos are a rapidly growing cohort, with the US Latino popu-lation surpassing 60 million in 2019 and set to double over the next four decades. This growth is driven, in part, by their younger age structure. Latinos have a median age of 30, compared with the white popu-lation’s median age of 44. Latinos accounted for 82% of growth in US labor force participation from 2010 to 2017 despite representing less than 19% of the total US population. And this growing, young, and productive Latino cohort is funding an increasing share of our financial system, with the median Latino retirement account achieving a compound annual growth rate (CAGR) of 9% between 2013 and 2019, compared with zero growth for all families in the US, according to the US Survey of Consumer Finances.
Latino entrepreneurs fuel the US economic engine in many ways. They have been responsible for approximately 50% of net new small business growth over the past decade (2007–2017). According to the latest data from the Stanford Latino Entrepreneurship Initiative (SLEI), Latino-owned businesses are high-quality businesses and highly worthy of investment. LOBs are growing in annual revenue faster than white-owned businesses (WOBs), at 10% compared with 7% for WOBs, and they are 11 percentage points more likely to have a healthy business credit score above 680.
Revenue growth unlocked if Latino-owned businesses
achieved revenue parity with white-owned businesses
$1.4TAnnual contribution to the
US economy by Latinos (as of 2018)
$2.6T

4 | Closing the Capital Gap: Fueling the Promise of Latino-owned Businesses | Bain & Company, Inc.
And these LOBs are creating jobs in the process. Employment among LOBs grew two times faster than non-LOBs between 2014 and 2016. By 2026, 13% of employer LOBs expect to have 100 or more employees compared with just 8% of employer WOBs, according to the SLEI annual survey of employer businesses.
And yet there is a serious problem that prevents LOBs from reaching their full potential. In spite of their rapid growth, Latino-owned businesses are not getting their fair share of capital from the invest-ment community. Without the ability to seek equity for growth or affordably priced debt from banks, LOBs remain significantly underfunded compared with similar WOBs, limiting their ability to scale. But if today’s LOB population were equitably funded with non-Latino WOBs, they could generate $1.4 trillion in additional revenue today and $3.3 trillion in additional revenue by 2030, according to Bain research, and corroborated by SLEI.
The root of the problem isn’t the investment potential of LOBs. Compared with their white-owned peers, LOBs outpace WOB revenue growth at every business size. Instead, the structures that exist today appear to systemically underfund these businesses. In fact, according to our research, less than 1% of funds from today’s top VC and PE investors wind up in the hands of Latino-owned businesses. In addition, the data suggests that LOBs need to enroll twice as many investors as WOBs to get the same level of funding, and mature employer LOBs are 30 to 50 percentage points less likely to have funding needs fully met by angel investors.
Equity investment from angels, small private investors, VC, and PE is a critical enabler of growth for businesses—but Latinos are significantly underrepresented in today’s equity investment landscape. By selling a portion of the business, owners get capital to address immediate needs and scale. Unlike debt, equity investments do not require using immediate cash flow for repayments, so cash can be directed toward growth. Access to equity investment enables business owners to reinvest cash into business growth, as well as to tap into expertise and connections that can help them succeed.
Latinos are playing an important role in providing the funding that eventually reaches VC and PE in the financial landscape, but they are largely absent on the receiving end of the supply chain. The pension funds the Latino community pays into are allocating increasing amounts to VC and PE, growing alternative investments from 11% of allocations in 2006 to 26% of allocations in 2016. Roughly 46% of PE funds came from pension funds in 2020—but these funds do not make their way back to Latino-owned businesses.
This broken flow of capital results in a persistent underfunding of LOBs, which can be seen most clearly as LOBs approach the $1 million revenue mark. At this stage, these businesses appear to start to struggle with profitability and cash flow, which makes it harder to scale. In this critical window, LOB growth decelerates while WOB growth accelerates, closing the gap in annual growth to just 1 percentage point (see Figure 1). If they manage to push through that barrier, the few LOBs that do break through the $5 million revenue mark grow at a rate almost double the rate of WOBs.

Bain & Company, Inc. | Closing the Capital Gap: Fueling the Promise of Latino-owned Businesses | 5
LOBs at this threshold need access to affordable capital and equity investments; they need a pathway to sustainable growth that unlocks scale and real wealth creation. But that pathway is not available to most LOBs right now.
The seeds for this $1 million barrier are planted early for most LOBs. Even though these businesses grow revenue faster than their white-owned peers, they struggle to get capital from traditional sources from their earliest stages of growth. They don’t have easy access to early-stage equity investments, and they face lower rates of approval and funding from banks. This sets a vicious cycle in motion, forcing LOBs to turn to expensive forms of debt, including hard-money lending, and creating challenges with cash flow, profitability, and obtaining later equity investments as these businesses seek to scale.
The traditional supply chain of capitalism, in which promising growth opportunities are nourished by access to capital, is broken for LOBs. At the $1 million revenue mark, just as businesses need a capital infusion to scale, LOBs face a Darwinian survival test that their white-owned peers do not face nearly as often. Do they go for aggressive growth by taking on high-interest funding, given lack of access to equity investments, in order to scale? Or should they settle for what they have already achieved over losing what they have worked so hard to build? The choice may be even more difficult considering that so many LOB entrepreneurs have bootstrapped businesses from lower socioeconomic backgrounds, risking person-al assets to reach this point. Those few LOBs who make it to the $5 million mark are strong businesses with strong average growth trajectories, but too many high-potential businesses are forced to manage for cash and settle.
Figure 1: Latino-owned business revenue growth outpaces that of white-owned businesses, but the gap narrows at $1 million
Notes: Around 10 outliers were removed because of errors in data entry; all business financial information is self-reported on annual survey; average of five-yearcompound annual revenue growth rates based on self-reported revenue for each businessSource: Stanford Latino Entrepreneurship Initiative annual survey, 2021
−10
10
60
70
80
90
100%
Average five-year compound annual revenue growth rate (2016–2021), by annual revenue category
Grand total
107
$10,000–$49,999
2
−1
$50,000–$99,999
5 2
$100,000–$499,999
3 2
$500,000–$999,999
127
$1 million–$4,999,999
15 14
More than$5 million
94
52
As LOBs reach the $1 millionmark, they face funding barriersand their growth begins to slow
Those LOBs that break throughthe $5 million mark, however,are achieving growth
0
Latino-owned businesses (LOBs) White-owned businesses (WOBs)

6 | Closing the Capital Gap: Fueling the Promise of Latino-owned Businesses | Bain & Company, Inc.
There are clear solutions to the funding challenges LOBs face, and the time has come for both equity and debt investors to take action. Given that around 70% of actively managed funds are held by the top 25 players, these firms will be critical to the solution. These players can either directly invest in LOBs through their own funds, or they can help cultivate funds to specifically target LOBs. But all providers of capital have a role to play. Banks, for example, can make it easier for LOBs to be approved for loans with more equitable criteria that take into account how LOBs typically grow. Banks can also establish relay partnerships with community development financial institutions (CDFIs) to help LOBs profession-alize to become more worthy creditors while simultaneously raising LOB awareness of funding availability. Both banks and CDFIs can provide wraparound services, including training, consulting, and software support to help LOBs learn the ropes faster and to make it easier to assess and partner on funding.
A growing community of LOB-focused investors has already seen the opportunity and the challenge. Camino Financial, Founders First, LiftFund, and other players focus their investments on LOBs of all sizes. This group encompasses both debt and equity, as well as CDFIs and for-profit investors, which see strong potential in LOBs to realize returns and drive impact in parallel. But today’s efforts are not at the scale needed to match the growing role Latinos play in our financial system. LOBs need greater access to low-cost capital, particularly in the form of early equity investments, to give these businesses a fair shot at growth.
No single approach to solving this problem will work, however. LOBs aren’t all the same. Size is the most important variable for understanding LOB capital needs, but across sizes, there are distinct needs, behaviors, and levels of awareness. So Bain has collaborated with SLEI to better understand the current topography of LOBs in the US to help drive awareness of distinct LOB segment characteristics and funding needs. It is our hope that this segmentation will help financial institutions and other investors develop appropriate products and strategies—and raise awareness among LOBs—to help close the funding gap and finally unleash the full potential of LOB growth in the economy.
Employment among Latino- owned businesses grew 2x
faster than non-Latino- owned businesses (from 2014 to 2016)
2xLatinos are 1.7x more
likely to start businesses than any other racial
group (as of 2019)
1.7x

8 | Closing the Capital Gap: Fueling the Promise of Latino-owned Businesses | Bain & Company, Inc.

Bain & Company, Inc. | Closing the Capital Gap: Fueling the Promise of Latino-owned Businesses | 9
Latinos are growing quickly in population size—and economic output
It’s no secret that the Latino population is growing rapidly in the US, surpassing 60 million in 2019. The Latino population is projected to nearly double over the next four decades. As the white population ages (median age: 44), the growing, younger Latino population (median age: 30) will comprise a larger share of total population and have an outsized influence on the labor market. One million Latinos will turn 18 this year—and every year for the next 20. The Latino population already has an above-average labor force participation rate compared with non-Latino groups, and Latinos are projected to account for 80% of the total growth in the US labor force between 2010 and 2050.
But what often goes less noticed is just how significant the Latino population has become to the US economy. Among the largest fully developed economies in the world, US Latino gross domestic prod-uct (GDP) is the fastest-growing “economy,” and grew 28% faster than the rest of the US economy from 2010 to 2017.
These data points only begin to tell the story of the influence of Latinos on the US economy. Latinos are a uniquely productive, growing, and young cohort in the US. At a time when the number of business start-ups is decreasing among white males, entrepreneurship among Latinos is on the rise, according to the 2015 Kauffman Index of Startup Activity National Trends. That makes the contribution of Latinos to the US more significant than ever before. While Latinos currently represent less than 19% of the
Of all US small businesses are Latino
owned (as of 2017)
~13%Of all net new US small businesses are Latino
owned (as of 2017)
~50%

10 | Closing the Capital Gap: Fueling the Promise of Latino-owned Businesses | Bain & Company, Inc.
total US population (according to the 2020 US Census), they are punching above their weight in starting and growing small businesses.
Small businesses are the engine of the US economy, collectively accounting for approximately 44% of GDP and approximately 67% of US jobs. LOBs represent an extraordinarily entrepreneurial segment of the US population; approximately 50% of net new small businesses are started by Latinos. They are not only starting but also sustaining new employer businesses, with an average self-reported CAGR of 10% over the past five years (compared with just 7% from their white-owned peers), according to Bain analysis of SLEI’s latest 2021 survey data—and they are concentrated in the fastest-growing regions of the US and the fastest-growing industries. As of 2017, 13% of all US small businesses are Latino owned, but that percentage will only grow as Latinos are 1.7 times more likely to start a business than any other racial group.
The relative lack of interest LOBs receive in the funding community is not because they are not sound investments. In fact, there is ample reason to believe that Latino-owned businesses are on par with today’s landscape of WOBs. Latino-owned employer businesses report comparable revenue and employment growth patterns to WOBs. We know that Latino- and white-owned employer businesses have similar financial risk profiles and are similarly likely to have healthy business credit scores. In fact, Latino-owned employer businesses are approximately 11 percentage points more likely to have a business credit score above 680. They are also similarly likely to have very good business credit scores (above 760).
Latino-owned employer businesses do fall short of their white-owned peers in two important aspects: They are less likely to be profitable, and they exhibit lower profit margins overall (see Figure 2). Only 45% of LOBs are profitable, compared with 50% of WOBs, and profitable LOBs are about 5 percentage points less likely to see profit margins climb above 20%. And, at the aggregate level, we can identify at least one point where the two paths between WOBs and LOBs most clearly diverge: As LOBs reach that $1 million mark, they face relative funding barriers their white-owned peers do not, and their growth and profitability both begin to slow. LOBs have higher revenue CAGRs across all sizes compared with WOBs; once LOBs scale to $1 million, however, they become less profitable compared with WOBs and are less likely to fully scale to revenue greater than $5 million. LOBs are around 30% less likely than WOBs to ever hit $5 million in revenue. Yet there’s nothing to suggest that LOBs are somehow inherently incapable of growth beyond this level—those LOBs that do break through the $5 million mark are achieving rapid growth.
Without access to the capital they need to grow—capital that is easier for employer WOBs to obtain at a lower cost—employer LOBs are forced to pay higher rates, sacrifice cash flow to debt service, and bootstrap as they scale. These high-cost sources eat into profitability, increase ROI thresholds, and require LOBs to act more conservatively compared with WOBs that can frequently access lower- cost funds, such as equity investments from family and friends and bank loans.
And therein lies the catch-22. Scaling is not working for employer LOBs. Just when they most need capital to grow, they face inadequate funding. Without reliable access to affordable capital, particularly

Bain & Company, Inc. | Closing the Capital Gap: Fueling the Promise of Latino-owned Businesses | 11
Figure 2a: Latino-owned businesses face a steep drop-off in odds of profitability when they reach $1 million in revenue, which is likely the result of the high costs of accessing the capital needed to scale
Note: Data incorporates weighting for industry, region, and revenue size Source: Stanford Latino Entrepreneurship Initiative annual survey, 2021
Latino-owned businesses (LOBs)
0
20
40
60
80
100%
US LOBs by revenue size and reported profitability (2021)
$10,000–$49,999
589 977
$100,000–$499,999
2,895
$500,000–$999,999
1,248 1,135211
5336 4639 48Percentage of profitablebusinesses
Total=7,106
$50,000–$99,999
$1 million – $4,999,999 $5 million–
$9,999,999$10 millionor above
51
6932
LOBs in the $1 million–$5 millionrevenue range are nearly10 percentagepoints less likelyto be profitablethan WOBs
Losses Breakeven Profits
Figure 2b: Latino-owned businesses face a steep drop-off in odds of profitability when they reach $1 million in revenue, which is likely the result of the high costs of accessing the capital needed to scale
Note: Data incorporates weighting for industry, region, and revenue size Source: Stanford Latino Entrepreneurship Initiative annual survey, 2021
White-owned businesses (WOBs)
0
20
40
60
80
100%
US WOBs by revenue size and reported profitability (2021)
$10,000–$49,999
485 806
$100,000–$499,999
3,315
$500,000–$999,999
1,336 1,233277
6333 4937 56Percentage of profitablebusinesses
Total=7,550
$50,000–$99,999
$1 million – $4,999,999 $5 million–
$9,999,999$10 millionor above
98
5051
WOB profits, however, spike within the $1 million–$5 million revenue range
Losses Breakeven Profits
12 | Closing the Capital Gap: Fueling the Promise of Latino-owned Businesses | Bain & Company, Inc.
equity capital, LOBs struggle with profitability and cannot afford to scale their businesses at the same pace as WOBs, creating a doom loop of underfunding from investors.
LOBs face a capital supply problem at every stage of their life cycle
The underfunding problem starts at the earliest stages of employer LOB growth, even from the first attempt to seek equity investments, or request a small business loan or line of credit. For example, over their entire life cycle, healthy LOBs experience lower odds of being fully funded by national banks (see Figure 3).
Though survey data does not fully explain why this gap exists, our research suggests that cultural expectations, language gaps, and loan approval processes can all play a role; some Latino business owners may struggle navigating the current structures and processes of the financing world and face challenges packaging a loan application or business data in ways likely to maximize the odds of being funded.
As a result, smaller employer LOBs (those with less than $1 million in revenue) are a full 19 percentage points less likely to be fully funded by local banks than comparable WOBs. LOBs are, in turn, forced to resort to less traditional sources of capital, relying on personal savings—smaller LOBs are 1.3 times more likely than WOBs to rely on personal savings and 1.4 times more likely to rely on family and friends to finance their businesses. They also turn more frequently to less stable sources of financing, such as grants or payday loans, and request five times more funding from hard-money lenders than WOBs. Not surprisingly, these sources of funding come with tougher terms, higher costs, and more risk, stunting LOBs’ growth (see Figure 4).
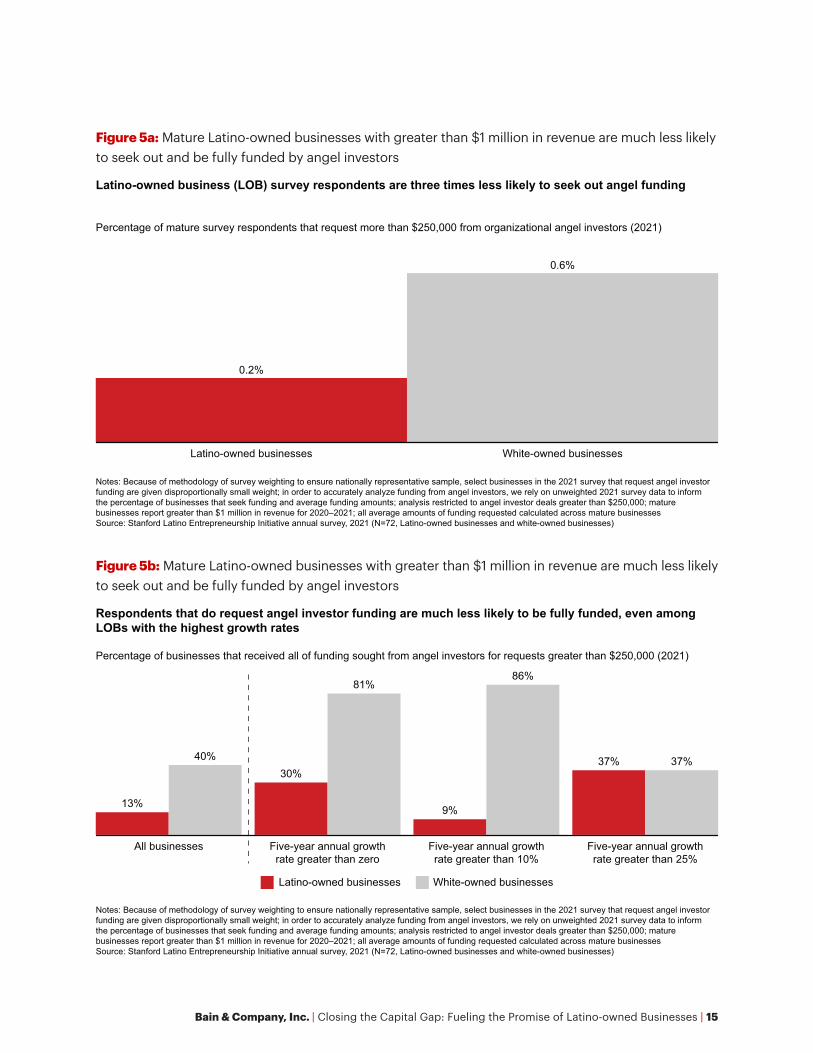
More mature employer LOBs (those with greater than $1 million in revenue) continue to experience disparities in their access to funding. At this stage, LOBs are 16 percentage points less likely to be fully funded by national banks compared with their white-owned peers. They are three times less likely to seek funding from angel investors—and those that do are nearly 30 percentage points less likely to have all their funding needs met (see Figure 5). Without reliable access to capital, mature LOBs continue to depend on sources of funding they have outgrown. They are 7 percentage points more likely to rely on personal credit cards to fund at this stage, and 6 percentage points more likely to rely on personal savings.
Scaling is not working for employer LOBs, especially as they mature and enter stages in which growth capital is most needed. The high cost of capital accessible to Latinos seems to play a role in depressing the profitability of LOBs right as they reach the $1 million revenue mark. Though they have similar profitability as WOBs at smaller sizes, by the time they reach $1 million to $5 million in revenue, only 53% of LOBs are profitable, compared with 63% of WOBs.

Bain & Company, Inc. | Closing the Capital Gap: Fueling the Promise of Latino-owned Businesses | 13
Figure 3a: Latino-owned businesses are less likely to receive funding from national and local banks
Notes: Analysis of businesses that request greater than $100,000 in funding from national banks and less than $100,000 from local banks; approval rate calculatedas businesses that received all (100%) of funding applied for, across all amounts of funding requested greater than $100,000; all reported percentages should betaken as directional indicators of trends; five-year annual growth rate calculated based on self-reported annual revenue, not included for all businesses included insurvey because of a lack of reported informationSource: Stanford Latino Entrepreneurship Initiative annual survey, 2021
Latino-owned businesses are less likely to be fully funded for smaller loans from local banks …
25%
44%
Percentage of businesses that received all funding sought from local banks for requests less than $100,000 (2021)
Latino-owned businesses White-owned businesses
Figure 3b: Latino-owned businesses are less likely to receive funding from national and local banks
Notes: Analysis of businesses that request greater than $100,000 in funding from national banks and less than $100,000 from local banks; approval rate calculatedas businesses that received all (100%) of funding applied for, across all amounts of funding requested greater than $100,000; all reported percentages should betaken as directional indicators of trends; five-year annual growth rate calculated based on self-reported annual revenue, not included for all businesses included insurvey because of a lack of reported informationSource: Stanford Latino Entrepreneurship Initiative annual survey, 2021
… and when they turn to national banks for larger funding amounts, they are severely underfunded vs. white-owned businesses
Percentage of businesses that received all funding sought from local banks for requests greater than $100,000 (2021)
Latino-owned businesses White-owned businesses
Five-year annual growthrate greater than zero
Less than $1 million
17% 18%
Greater than $1 million
44%
8%
10%
38%
Five-year annual growthrate greater than 10%
14%
27%
Five-year annual growthrate greater than 25%
14%
37%

14 | Closing the Capital Gap: Fueling the Promise of Latino-owned Businesses | Bain & Company, Inc.
Figure 4a: Small Latino-owned businesses with less than $1 million in revenue tend to rely on personal and higher-cost sources of capital
Notes: Small businesses report less than $1 million in revenue for 2020–2021; approval rate calculated as businesses that received all (100%) of funding appliedfor, across all amounts of funding requested greater than $100,000Source: Stanford Latino Entrepreneurship Initiative annual survey, 2021
Latino-owned businesses (LOBs) seek larger amounts from a variety of personal financing sourcesthan white-owned businesses (WOBs) …
Personal/family savings
$29,000$18,000
Personal/home equity loan
$79,000
$45,000
Family/friends
$48,000 $46,000
Latino-owned businesses White-owned businesses
Average amount of funding requested of businesses that requested each type of funding (2021)
Figure 4b: Small Latino-owned businesses with less than $1 million in revenue tend to rely on personal and higher-cost sources of capital
Notes: Small businesses report less than $1 million in revenue for 2020–2021; approval rate calculated as businesses that received all (100%) of funding appliedfor, across all amounts of funding requested greater than $100,000Source: Stanford Latino Entrepreneurship Initiative annual survey, 2021
… as well as from high-cost and nontraditional financing sources
Latino-owned businesses White-owned businesses
Average amount of funding requested of businesses that requested each type of funding (2021)
Hard money/payday loans Community developmentfinancial institutions
Nonprofit lenders Grants
$97,000
$18,000
$35,000$45,000
$24,000$32,000 $30,000
$22,000
Small LOBs are twice as likelyas WOBs to seek hard money and rely on this source in much larger amounts
Bain & Company, Inc. | Closing the Capital Gap: Fueling the Promise of Latino-owned Businesses | 15
Figure 5a: Mature Latino-owned businesses with greater than $1 million in revenue are much less likely to seek out and be fully funded by angel investors
Notes: Because of methodology of survey weighting to ensure nationally representative sample, select businesses in the 2021 survey that request angel investorfunding are given disproportionally small weight; in order to accurately analyze funding from angel investors, we rely on unweighted 2021 survey data to informthe percentage of businesses that seek funding and average funding amounts; analysis restricted to angel investor deals greater than $250,000; maturebusinesses report greater than $1 million in revenue for 2020–2021; all average amounts of funding requested calculated across mature businessesSource: Stanford Latino Entrepreneurship Initiative annual survey, 2021 (N=72, Latino-owned businesses and white-owned businesses)
Latino-owned business (LOB) survey respondents are three times less likely to seek out angel funding
0.2%
0.6%
Latino-owned businesses White-owned businesses
Percentage of mature survey respondents that request more than $250,000 from organizational angel investors (2021)
Figure 5b: Mature Latino-owned businesses with greater than $1 million in revenue are much less likely to seek out and be fully funded by angel investors
Respondents that do request angel investor funding are much less likely to be fully funded, even amongLOBs with the highest growth rates
Five-year annual growthrate greater than zero
All businesses Five-year annual growthrate greater than 10%
Five-year annual growthrate greater than 25%
Percentage of businesses that received all of funding sought from angel investors for requests greater than $250,000 (2021)
13%
40%30%
81%
9%
86%
37% 37%
Notes: Because of methodology of survey weighting to ensure nationally representative sample, select businesses in the 2021 survey that request angel investorfunding are given disproportionally small weight; in order to accurately analyze funding from angel investors, we rely on unweighted 2021 survey data to informthe percentage of businesses that seek funding and average funding amounts; analysis restricted to angel investor deals greater than $250,000; maturebusinesses report greater than $1 million in revenue for 2020–2021; all average amounts of funding requested calculated across mature businessesSource: Stanford Latino Entrepreneurship Initiative annual survey, 2021 (N=72, Latino-owned businesses and white-owned businesses)
Latino-owned businesses White-owned businesses

16 | Closing the Capital Gap: Fueling the Promise of Latino-owned Businesses | Bain & Company, Inc.
Bain & Company, Inc. | Closing the Capital Gap: Fueling the Promise of Latino-owned Businesses | 17
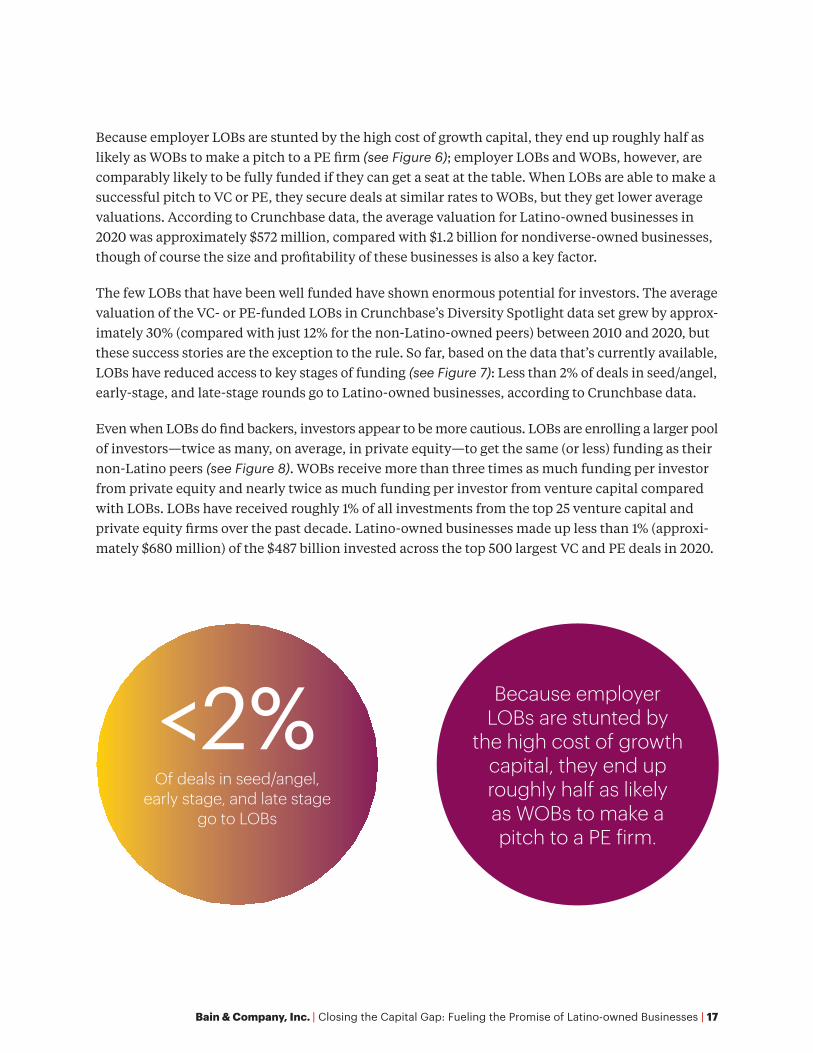
Because employer LOBs are stunted by the high cost of growth capital, they end up roughly half as likely as WOBs to make a pitch to a PE firm (see Figure 6); employer LOBs and WOBs, however, are comparably likely to be fully funded if they can get a seat at the table. When LOBs are able to make a successful pitch to VC or PE, they secure deals at similar rates to WOBs, but they get lower average valuations. According to Crunchbase data, the average valuation for Latino-owned businesses in 2020 was approximately $572 million, compared with $1.2 billion for nondiverse-owned businesses, though of course the size and profitability of these businesses is also a key factor.
The few LOBs that have been well funded have shown enormous potential for investors. The average valuation of the VC- or PE-funded LOBs in Crunchbase’s Diversity Spotlight data set grew by approx-imately 30% (compared with just 12% for the non-Latino-owned peers) between 2010 and 2020, but these success stories are the exception to the rule. So far, based on the data that’s currently available, LOBs have reduced access to key stages of funding (see Figure 7): Less than 2% of deals in seed/angel, early-stage, and late-stage rounds go to Latino-owned businesses, according to Crunchbase data.
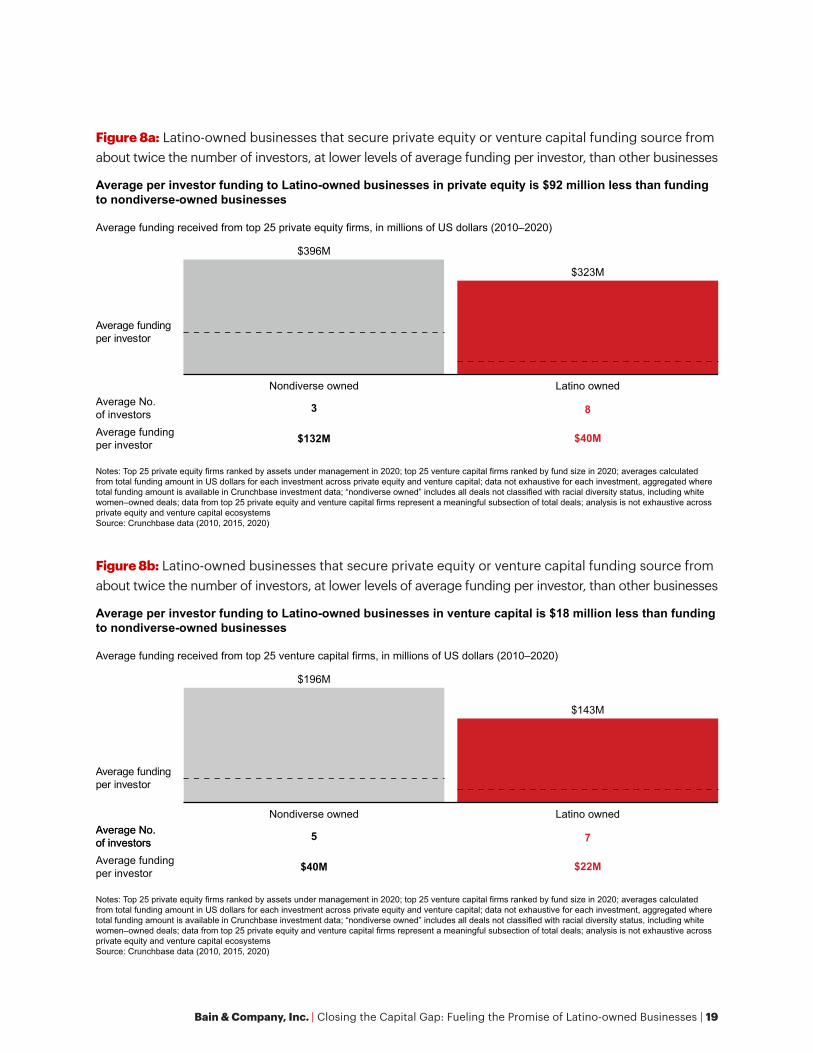
Even when LOBs do find backers, investors appear to be more cautious. LOBs are enrolling a larger pool of investors—twice as many, on average, in private equity—to get the same (or less) funding as their non-Latino peers (see Figure 8). WOBs receive more than three times as much funding per investor from private equity and nearly twice as much funding per investor from venture capital compared with LOBs. LOBs have received roughly 1% of all investments from the top 25 venture capital and private equity firms over the past decade. Latino-owned businesses made up less than 1% (approxi-mately $680 million) of the $487 billion invested across the top 500 largest VC and PE deals in 2020.
Of deals in seed/angel, early stage, and late stage
go to LOBs
<2% Because employer LOBs are stunted by
the high cost of growth capital, they end up roughly half as likely as WOBs to make a pitch to a PE firm.

18 | Closing the Capital Gap: Fueling the Promise of Latino-owned Businesses | Bain & Company, Inc.
Figure 7: Latino-owned businesses are underrepresented at all funding rounds
Notes: Seed/angel stage classified as angel, seed, preseed; early stage classified as series A, series B; late stage classified as series C through series J; data not exhaustive of all private equity and venture capital deals in 2020 data set, data includes subsegment in specified funding rounds; classifications excludedfrom analysis include corporate round, secondary market, debt financing, and others; Crunchbase manually tags diverse-owned businesses, with the assumptionthat if a business is not tagged as diverse owned, it is white and male owned; “other racial minority owned” includes Black, American Indian/Alaska Native, Middle Eastern, Asian; “nondiverse owned” includes all deals not classified with racial diversity status, including white women–owned deals Source: Crunchbase data (2010, 2015, 2020)
Seed/angel
~1% of deals made with Latino-owned businesses
~1% of deals made with Latino-owned businesses
~2% of deals made with Latino-owned businesses
Early stage Late stage
Other racial minority owned Latino ownedNondiverse owned
~16,000Total deals per funding stage (2020) ~5,000 ~3,000
100%
0
Figure 6: Latino-owned businesses are less likely to have part of their business owned by private equity, venture capital, or angel investors
Notes: Survey question asks each business if any nonzero portion of their business is owned by outside investors, not restricted to the last year (2020–2021); analysis isolated to mature businesses with greater than $1 million in annual revenue; because of methodology of survey weighting to ensure nationally representative sample, select businesses in 2021 survey that request organizational equity funding are given disproportionally small weight; in order to accurately analyze funding from venture capital, private equity, and angel investors, we rely on unweighted 2021 survey data to inform percentage of businesses that seek funding and average funding amounts; businesses that are owned by outside investors select multiple avenues of ownership on annual survey; investor types that own businesses are based on proportion of total Latino- and white-owned business respondents; are not mutually exclusive with other funding typesSource: Stanford Latino Entrepreneurship Initiative annual survey, 2021
Latino-owned businesses White-owned businesses
Percentage of mature Latino- and white-owned businesses with outside investors, by investor type (2021)
Venture capital Private equity Angel investor
−13%−8% −9%
24%
32%
12%
25%
8%
17%
Bain & Company, Inc. | Closing the Capital Gap: Fueling the Promise of Latino-owned Businesses | 19
Figure 8a: Latino-owned businesses that secure private equity or venture capital funding source from about twice the number of investors, at lower levels of average funding per investor, than other businesses
Notes: Top 25 private equity firms ranked by assets under management in 2020; top 25 venture capital firms ranked by fund size in 2020; averages calculatedfrom total funding amount in US dollars for each investment across private equity and venture capital; data not exhaustive for each investment, aggregated wheretotal funding amount is available in Crunchbase investment data; “nondiverse owned” includes all deals not classified with racial diversity status, including whitewomen–owned deals; data from top 25 private equity and venture capital firms represent a meaningful subsection of total deals; analysis is not exhaustive acrossprivate equity and venture capital ecosystemsSource: Crunchbase data (2010, 2015, 2020)
Average per investor funding to Latino-owned businesses in private equity is $92 million less than fundingto nondiverse-owned businesses
Average funding received from top 25 private equity firms, in millions of US dollars (2010–2020)
Nondiverse owned
$396M
Latino owned
$323M
$132M $40MAverage fundingper investor
3 8Average No.of investors
Average fundingper investor
Figure 8b: Latino-owned businesses that secure private equity or venture capital funding source from about twice the number of investors, at lower levels of average funding per investor, than other businesses
Notes: Top 25 private equity firms ranked by assets under management in 2020; top 25 venture capital firms ranked by fund size in 2020; averages calculatedfrom total funding amount in US dollars for each investment across private equity and venture capital; data not exhaustive for each investment, aggregated wheretotal funding amount is available in Crunchbase investment data; “nondiverse owned” includes all deals not classified with racial diversity status, including whitewomen–owned deals; data from top 25 private equity and venture capital firms represent a meaningful subsection of total deals; analysis is not exhaustive acrossprivate equity and venture capital ecosystemsSource: Crunchbase data (2010, 2015, 2020)
Average per investor funding to Latino-owned businesses in venture capital is $18 million less than fundingto nondiverse-owned businesses
Average funding received from top 25 venture capital firms, in millions of US dollars (2010–2020)
Nondiverse owned
$196M
Latino owned
$143M
$40M $22MAverage fundingper investor
5 7Average No.of investors
Average fundingper investor
Average No.of investors

Bain & Company, Inc. | Closing the Capital Gap: Fueling the Promise of Latino-owned Businesses | 21
LOBs also struggle with a demand problem—providers of capital need to bring this segment of the economy into the tent
This is not a one-sided problem. Latino-owned businesses have historically not sought funding at any-where near the same levels as their white-owned counterparts. Though Latino-owned businesses are more likely to apply for financing from banks than their white-owned peers, they are more tentative borrowers, seeking smaller amounts of funding from different sources. According to SLEI’s 2021 survey data, Latino owners of employer businesses who did not seek financing in 2021 were more than two times more likely to report that they did not know how to get it and three times more likely to report a bad past experience than white business owners.
Most Latino entrepreneurs in the US view their businesses as deeply personal endeavors. For the nearly 75% of employer LOBs that seek funding, compared with only 66% of employer WOBs, their most common source of capital is personal savings. Employer LOBs tend to rely most heavily on credit cards, personal bank loans, and loans from a family member or friend, according to SLEI’s 2021 survey data.
There may be good reason that they turn to friends and family for support: They’ve been burned too often in the past. Latino employer business owners report difficulty accessing credit to help manage cash flow or fund expenses related to expansion or procurement of new assets. SLEI’s 2019 State of Latino Entre-preneurship Report describes the distinct challenges that LOBs face, including lengthy loan requirements and documentation. These LOBs, however, still get rejected more often and receive less than they request when compared with white-owned businesses.
Onerous requirements (or outright rejections) that LOBs have encountered from banks and other lenders for even simple loans or lines of credit have deterred healthy, growing businesses from seeking outside help to grow and shape the LOB landscape in significant ways that are different than their WOB peers.

22 | Closing the Capital Gap: Fueling the Promise of Latino-owned Businesses | Bain & Company, Inc.
A burning platform: What equity providers and lenders can do to close the gap
In this current state, far too much money is being left on the table. There is a real need for all links in the financial services value chain to adopt a test-and-learn approach to better serving these communities—while seeking returns. Across the board, we have identified a preliminary set of recommendations to drive progress.
• Equity is a catalyst; in terms of liquidity, it is a limited-constraint source of capital that allows small businesses to scale and meet their full potential.
– Small LOBs need new approaches from all investors that create access to equity funding. Entrepreneurs of all backgrounds commonly source funding through family, friends, and private investors. Equity funding can be the optimal way to grow small businesses so that they aren’t hamstrung by the need to service debt. But for LOBs, these sources of funding can run dry given existing wealth disparities and comparatively recent immigration. Banks, as well as angels, VC, and other equity sources, however, could open up the spigot by creating funds focused on helping bridge the gap and providing equity-based financing to new small businesses to help them grow and build a history that will open the doors to debt and larger equity institutional investors. Angel investors will be particularly well positioned to offer equity to high-potential small businesses.
– Institutional equity investors have an opportunity to help LOBs scale. There are many attractive and fast-growing LOBs—but they are less likely to be courted by angels, and less likely to reach the VC and PE investment stage. There is an opportunity for VC, PE, and other equity investors to bring expertise to help Latinos scale their businesses more efficiently and quickly when these businesses reach that stage.
• Other solutions, such as increased access to debt, innovative assessment models, and targeted education, will help narrow the funding gap.
– Debt lenders (banks and CDFIs) also have a role to play. Many segments have not fully taken advantage of lower-cost debt lending, or they may need to refinance to separate personal assets from their businesses. CDFIs and banks can partner together to help relay younger LOBs to help them get early access to capital—as well as help professionalizing and maturing into borrowing from banks.
Bain & Company, Inc. | Closing the Capital Gap: Fueling the Promise of Latino-owned Businesses | 23
– Renewed, clear credit assessment models are needed. Given that many of these LOBs are relatively new to debt financing or have faced rejection in the past, banks can simplify their credit models or look toward innovation (for instance, recommending LOBs use simple accounting software that estimates things like cash flow) to make the process easier/clearer.
– Suppliers can help solve the demand problem. Some LOB segments do not seek outside funding because of unfamiliarity with financing options; banks and CDFIs can partner to educate and market to LOBs on their funding options and the potential returns of using leverage to grow their businesses.
Segmentation provides a roadmap for investors to better target, assess, and support LOBs
Even if investors suddenly widen their aperture to include LOBs, today’s approaches will not easily bridge the mismatch with the LOB community. To start with, investors need to understand that there is, arguably, no single profile of a Latino-owned business. Similar to any other group, LOBs are a diverse group of businesses with very different risk profiles, needs, and approaches to growing their businesses.
The employer LOB market divides into six broad segments, each with a different history, profile, and approach to growth. In general terms, LOBs can be categorized by their overall scale and maturity—namely, less than or greater than $1 million in revenue. Within each of those two groupings, we have identified three distinct and actionable segments based on their funding behaviors, current capital structure, business growth, and overall business health. The solutions we’ve outlined above can make a material difference in helping employer LOBs access the funds they need to scale. But the best solutions vary across segments—as well as their existing behaviors accessing capital. LOBs are not one monolithic group, and neither are their capital needs.
Let’s break these down to explore the segments in more detail:

24 | Closing the Capital Gap: Fueling the Promise of Latino-owned Businesses | Bain & Company, Inc.
• Proportion of all employer LOBs: 23% of LOBs• Typical revenue: less than $1 million• Typical age: 6 to 10 years old• Other notable characteristics:
– Not seeking outside funding but growing with the funds they have – Rates of debt and equity investment are low and rare
• Financing needs: – Education on types of funding (debt vs. equity) and how to access – Outreach with funding opportunities to build trust/awareness – Education on loan/financing application process
Industrious upstarts
Who they are: Industrious upstarts are full of enthusiasm and promise, but access to structures or pro-cesses to support them is limited. Industrious upstarts are typically younger, smaller businesses that are figuring out the business world as they go along. Early interest from potential customers (or some-times business plan competitions) spurs their drive, but they are not equipped to supercharge their growth trajectory on their own. Upstarts often are not aware of the financing options available to them; they need outreach and education platforms to provide entry pathways into the formal financial system.
What they need: Upstarts need help growing their business out of the gate and professionalizing their business plan to get access to funding as they scale. In particular, they need a relay partnership between banks and CDFIs, as well as access to small business–focused equity investment funds.
Preliminary solutions:• Angel investors/incubators
– Innovative, small business–focused seed equity offerings coupled with wraparound services (for instance, education services, physical resources)
• Retail banks and CDFIs – Outreach campaigns to build early relationships – CDFI referral programs through which retail banks refer LOBs that are unable to pass bank
lending requirements to CDFIs – CDFI support programs to prepare LOBs for bank loan applications (including to build credit)
Upstarts should be referred to CDFIs that can provide funding, wraparound services, and education to help them mature into credible, professionalized loan partners with banks.

Betasoft Consulting Santa Clara, California Electronic engineering design services to the semiconductor industry Owner: Rafael Betancourt
Their story: “I have been able to stay 100% booked. Now the problem is scalability, which we are trying to solve by moving into selling CAD software targeting the same customer base. I had the recent experience of the PPP [Paycheck Protection Program] loan, but besides that, I have not used any other financing. Even my business credit card is paid in full every month. Being structured as an S corporation, I don’t see myself being funded via equity investments; I am also very uncomfortable with debt, so I plan to continue self-funding for the foreseeable future. My current strategy is to grow organically by hiring only as software sales pick up, as those provide a more predictable revenue stream than project-based work.”
Bain & Company, Inc. | Closing the Capital Gap: Fueling the Promise of Latino-owned Businesses | 25
Industrious upstart profile

26 | Closing the Capital Gap: Fueling the Promise of Latino-owned Businesses | Bain & Company, Inc.
• Proportion of all employer LOBs: 20% of LOBs• Typical revenue: less than $1 million• Typical age: greater than five years old• Other notable characteristics:
– Seek debt financing, but at low levels (less than $100,000) – Fast-growing businesses; seek financing to accelerate growth
• Financing needs: – Growth capital via equity in order to acquire new assets while protecting cash flow – Opportunities to use business history and existing assets to secure funding
Rising stars
Who they are: Rising stars are well-connected, growing businesses. Rising stars tend to have good credit, greater than $500,000 in revenue, and positive revenue growth. Rising stars are looking to grow, either by buying new assets or expanding. But if they hope to get to the next stage of growth and scale, they will need a new magnitude of strategic capital.
What they need: These businesses present a significant opportunity for banks to efficiently filter for top-tier loan candidates and lower total cost to serve; they need quick, simple approval, followed by revenue-based repayment or asset-backed loans. They also represent a promising opportunity for early equity investors, such as angels, which can support these businesses with both capital and coaching on how to achieve scale sustainably.
Preliminary solutions:• Angel investors/incubators
– Small business–focused equity offerings – Financial guidance/leadership coaching to achieve and sustain scale
• Retail banks and CDFIs – CDFI support programs to prepare LOBs for bank loan applications – Renewed, defined set of evaluation metrics and loan criteria from banks – Financing offerings to suit business needs (for instance, revenue-based repayment for high-
growth, less profitable businesses and asset-based financing for businesses with weak or no financial history)
CDFI and retail bank partnerships can also help rising stars navigate the loan process and use their business history and credit scores as strengths in their applications.

Empire Business & Tax Advisors Kissimmee, Florida Owner: Edna Mendez
Their story: “Although the business continues to grow, the low season period is approaching, and we believe that we will have some difficulty in covering operating expenses during those months. We are always running with our own capital, and during the pandemic period, we received PPP through our bank, Regions Bank. We are highly respected in the community. The injection of additional funds would help us improve our facilities and expand our services.”
Rising star profile
Bain & Company, Inc. | Closing the Capital Gap: Fueling the Promise of Latino-owned Businesses | 27
28 | Closing the Capital Gap: Fueling the Promise of Latino-owned Businesses | Bain & Company, Inc.
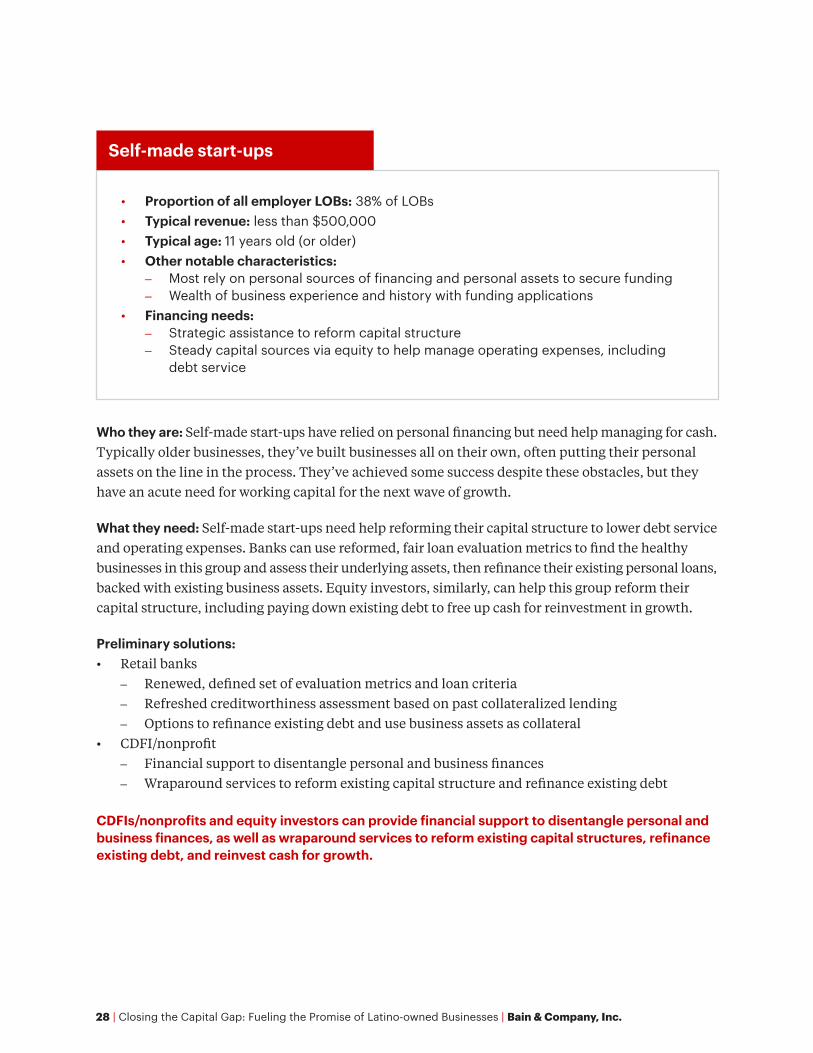
• Proportion of all employer LOBs: 38% of LOBs• Typical revenue: less than $500,000• Typical age: 11 years old (or older)• Other notable characteristics:
– Most rely on personal sources of financing and personal assets to secure funding – Wealth of business experience and history with funding applications
• Financing needs: – Strategic assistance to reform capital structure – Steady capital sources via equity to help manage operating expenses, including
debt service
Self-made start-ups
Who they are: Self-made start-ups have relied on personal financing but need help managing for cash. Typically older businesses, they’ve built businesses all on their own, often putting their personal assets on the line in the process. They’ve achieved some success despite these obstacles, but they have an acute need for working capital for the next wave of growth.
What they need: Self-made start-ups need help reforming their capital structure to lower debt service and operating expenses. Banks can use reformed, fair loan evaluation metrics to find the healthy businesses in this group and assess their underlying assets, then refinance their existing personal loans, backed with existing business assets. Equity investors, similarly, can help this group reform their capital structure, including paying down existing debt to free up cash for reinvestment in growth.
Preliminary solutions:• Retail banks
– Renewed, defined set of evaluation metrics and loan criteria – Refreshed creditworthiness assessment based on past collateralized lending – Options to refinance existing debt and use business assets as collateral
• CDFI/nonprofit – Financial support to disentangle personal and business finances – Wraparound services to reform existing capital structure and refinance existing debt
CDFIs/nonprofits and equity investors can provide financial support to disentangle personal and business finances, as well as wraparound services to reform existing capital structures, refinance existing debt, and reinvest cash for growth.
AB Unlimited Worldwide Las Vegas, Nevada Marketing resource agency, consulting in marketing and event collateral Owner: Amy Williams, CEO
Their story: “We have leveraged our personal assets, and credit is closely tied to the company as majority shareholders. We raised capital when we first started and were very new to running a company. Most traditional lenders rely on the personal financial history and personal credit history of the owners, some of whom use their personal assets to infuse capital into their business to keep it running. We saw this happen during the pandemic. The owners’ credit ratings plummet as a result, and [they] can be precluded from successfully gaining funding from traditional lenders. It’s a catch-22 that lenders have yet to rectify.”
Self-made start-up profile
Bain & Company, Inc. | Closing the Capital Gap: Fueling the Promise of Latino-owned Businesses | 29

30 | Closing the Capital Gap: Fueling the Promise of Latino-owned Businesses | Bain & Company, Inc.
• Proportion of all employer LOBs: 6% of LOBs• Typical revenue: $1 million to $5 million• Typical age: less than 10 years old• Other notable characteristics:
– Healthy businesses with little to no financing experience – Low and rare levels of debt and equity investments
• Financing needs: – Outreach with financial products that suit this fast-growing segment – Education on the benefits of external financing
Young and hungry
Who they are: Young and hungry LOBs are fast-growing and profitable businesses that have already achieved some scale. These young businesses have quickly cleared the $1 million revenue hurdle, with relatively little debt or equity financing. They have the potential to become unicorns with the right investments and support. But they’re not knocking down doors to obtain capital—instead, they are wary of outside investors. That reluctance to bring in outside money may limit their growth, but currently they’re less willing to sacrifice control to get it. Many are likely unaware of the various permutations of support that outside investors can bring
What they need: Young and hungry LOBs represent the clearest opportunity for angel investors that can help them scale efficiently and get in ahead of VC, particularly with convertible debt/equity options. Banks can play a key role, too—this is a fast-growing, healthy, and untapped segment with little debt; this group needs education on the financing options available to them and on how debt can help them accelerate growth and acquire new assets.
Preliminary solutions:• Angel investors/venture capital
– Early funding with coaching to scale efficiently – Convertible debt/flex equity for businesses less likely to sacrifice ownership
• Retail banks and CDFIs – Partnerships with CDFIs to refer mature LOBs to banks – LOB outreach campaigns through partnerships with business management tools – Differentiated financing offerings (for instance, revenue-based repayment for less profitable
but growing businesses)
Banks can improve their service to this segment by offering tailored products that suit fast-growing businesses with little experience applying for traditional financing (for instance, revenue-based repayment, which capitalizes on their rapid revenue growth while recognizing their profitability struggles). This segment is ripe for angels, too, whose experience and mentoring can help guide young and hungry LOBs. But these companies aren’t as open to traditional angel arrangements, so angels will need to reach out and offer creative approaches such as convertible debt.

Global Containers & Custom Packaging El Paso, Texas Owner: José Ochoa
Their story: “Great profitable projects, good cash flow, and great opportunities to diversify. At the beginning of our entrepreneurial journey, we started using factoring companies (selling our invoices weekly). Then with a proven record, we asked for a working capital credit line with our local bank. Since day one, they believed in our company, business model, and expertise. My vision is to always set up our company operations, finance, and mechanics as if we are going to sell the company, even if we do not have any intentions to do that. To be honest, 2021 is exceeding my growth expectations. This is by far the best year of our company since 2009.”
Young and hungry profile
Bain & Company, Inc. | Closing the Capital Gap: Fueling the Promise of Latino-owned Businesses | 31

32 | Closing the Capital Gap: Fueling the Promise of Latino-owned Businesses | Bain & Company, Inc.
• Proportion of all employer LOBs: 7% of LOBs• Typical revenue: $1 million to $5 million• Typical age: greater than 10 years old• Other notable characteristics:
– Established businesses with high levels of debt and equity – Business finances heavily intertwined with personal finances
• Financing needs: – Fair, clear loan assessment criteria to provide growth capital – Resources to professionalize businesses and reform asset structure
Homegrown operations
Who they are: Homegrown operations are larger, more mature businesses, with the founder still deeply embedded financially via personal assets. The business is, in some ways, an extension of the founder’s identity. But the next stage of growth eludes them without a capital injection to fuel it.
What they need: These mature businesses have a mixed profile of revenue growth and profitability—but overwhelmingly healthy credit. They have relied heavily on personal assets to grow to this stage, so they need help reforming their capital structure and building their balance sheet around their considerable business assets.
Preliminary solutions:• Venture capital and other equity funding
– Specialized funds that target and earmark capital for LOBs – Distinct focus on helping businesses scale and reach next level of growth – Equity offerings structured to cap outside ownership (i.e., to preserve LOB minority-owned
business status)• Retail banks
– Renewed, clear creditworthiness model and defined set of evaluation metrics – Financial offerings to suit business needs (for instance, collateralize business assets, refinance
capital structure) – Technological products to demonstrate creditworthiness (for instance, assist in estimating
capital flows) Banks can rely on strong credit scores and higher revenue as indicators to find the strongest businesses in this group and provide refinancing options, utilize the existing business assets as collateral, and help this group fund new assets that can recharge growth with easier debt terms.
Border X Brewing San Diego, California Owner: David Favela, CEO
Their story: “Initially, securing funding was not an issue, since we really never expected the company to grow. We all pitched in $6,000 and started a tiny, tiny brewery near the border. However, that plan disappeared within hours. Within hours customers drank all of our inventory. When we spoke to banks, they never lent to us, even SBA banks. My partners didn’t want to put their houses on the loan or had little to no assets to use as collateral. I sold my house to provide the initial seed money to expand. Raising capital was our biggest Achilles’ heel. Our challenge was that we never imagined growing as fast as we did.”
Homegrown operations profile
Bain & Company, Inc. | Closing the Capital Gap: Fueling the Promise of Latino-owned Businesses | 33
34 | Closing the Capital Gap: Fueling the Promise of Latino-owned Businesses | Bain & Company, Inc.
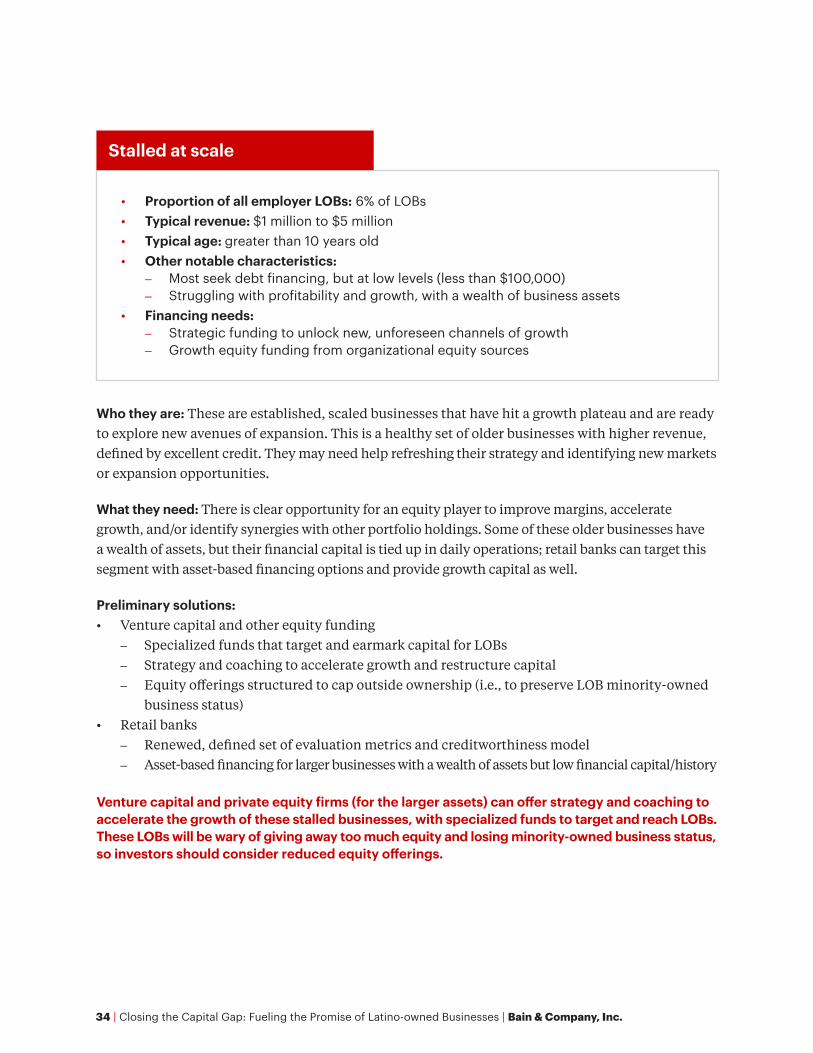
• Proportion of all employer LOBs: 6% of LOBs• Typical revenue: $1 million to $5 million• Typical age: greater than 10 years old• Other notable characteristics:
– Most seek debt financing, but at low levels (less than $100,000) – Struggling with profitability and growth, with a wealth of business assets
• Financing needs: – Strategic funding to unlock new, unforeseen channels of growth – Growth equity funding from organizational equity sources
Stalled at scale
Who they are: These are established, scaled businesses that have hit a growth plateau and are ready to explore new avenues of expansion. This is a healthy set of older businesses with higher revenue, defined by excellent credit. They may need help refreshing their strategy and identifying new markets or expansion opportunities.
What they need: There is clear opportunity for an equity player to improve margins, accelerate growth, and/or identify synergies with other portfolio holdings. Some of these older businesses have a wealth of assets, but their financial capital is tied up in daily operations; retail banks can target this segment with asset-based financing options and provide growth capital as well.
Preliminary solutions:• Venture capital and other equity funding
– Specialized funds that target and earmark capital for LOBs – Strategy and coaching to accelerate growth and restructure capital – Equity offerings structured to cap outside ownership (i.e., to preserve LOB minority-owned
business status) • Retail banks
– Renewed, defined set of evaluation metrics and creditworthiness model – Asset-based financing for larger businesses with a wealth of assets but low financial capital/history
Venture capital and private equity firms (for the larger assets) can offer strategy and coaching to accelerate the growth of these stalled businesses, with specialized funds to target and reach LOBs. These LOBs will be wary of giving away too much equity and losing minority-owned business status, so investors should consider reduced equity offerings.

EC Hispanic Media Norwalk, California Owner: Martha de la Torre
Their story: “We launched the business with outside funding in 1988. The family and close friends provided additional capital or sweat equity in the first 10 years of operation. Once cash flow turned positive in 1996, funding has been only through traditional banks for mortgages and lines of credit. Our growth has been self-funded through operational cash flow and sold investments, such as real estate. EC does not need capital. We need help designing an exit strategy that rewards our employees, ensures that our legacy company lasts, and that enables the hiring of key professional leaders to guide our existing talent to the next level of success past $60 million.”
Stalled at scale profile
Bain & Company, Inc. | Closing the Capital Gap: Fueling the Promise of Latino-owned Businesses | 35

36 | Closing the Capital Gap: Fueling the Promise of Latino-owned Businesses | Bain & Company, Inc.
Some investors have seen—and are starting to seize—this enormous opportunity
The projections for the potential upside of the Latino-owned business market are not simply wishful thinking. Some pioneer investors have already recognized LOBs’ enormous potential and have tailored their practices and products to fund them. There are a mix of funders dipping a toe in this market.
• Latino-focused small business debt lenders: Some debt lenders, including Wells Fargo, Bank of America, and listo!, are beginning to offer Latino-oriented loans and outreach programs.
• Latino-owned and Latino-focused VC/PE firms and social impact–focused firms: This growing group of investors, including Camino Financial, Founders First, LiftFund, and others, see strong potential in providing capital to LOBs, and they are driving impact.
• VC/PE: Some VC and PE firms have an explicit Latino focus and are already moving to capture the strong returns LOBs can deliver, including Chingona, Leap Global Partners, and Palladium Equity Partners. These investors range from 50% to 97% of total investment in LOBs to date.
There are a handful of players driving investment in this space and they’re seeing great success so far. Among the more notable investors in these categories are LiftFund, a CDFI nonprofit focused on funding LOBs and providing wraparound services to support their growth (for example, consulting, education). Fifty-four percent of LiftFund’s clients are LOBs. They have helped multiple companies increase their workforces from zero and achieve other milestones. Their model has proven to accelerate business growth and drive broader economic impacts; this model could be considered by other investors.
Camino Financial is successfully redefining financial services practices to better suit Latino-owned businesses through alternative financing and machine learning. Camino has deployed approximately $30 million in small business loans and has supported LOBs to grow in multiple ways, including in-creasing their production capacity and operating income.

Bain & Company, Inc. | Closing the Capital Gap: Fueling the Promise of Latino-owned Businesses | 37
38 | Closing the Capital Gap: Fueling the Promise of Latino-owned Businesses | Bain & Company, Inc.
Leap Global Partners has been successful in growing LOBs through its capital investment. Leap’s ultimate mission is to develop and invest in Latino entrepreneurs; thus, nearly 97% of its total funding (constituting around 86% of its total deals) is allocated to LOBs. For example, Leap’s investment in Paystand helped the business-to-business payments company grow revenue 2.5 times year over year and drive a 240% increase in monthly subscriptions from 2017 to 2020.
Palladium Equity Partners also has a long and lucrative journey with LOB investment strategies. As a result of a deliberate decision to focus on the Hispanic market, 56% of its investments in fund rounds IV and V have been Hispanic oriented.
But this small group can’t support the full needs of the LOB community across all six of our segments. Properly understood, LOBs should be attractive investment opportunities for institutional investors of all types, including retail banks, CDFIs, VC, PE (for larger deals), and other equity sources. But under-standing and targeting the distinct LOB segments will require a test-and-learn approach, new evaluation methods, and a creative mix of new products, such as revenue-based repayments, LOB outreach, education, and wraparound business support services.
A call to action for investors The moment has come to recognize the potential of the Latino-owned business market. Taking into account the size of the opportunity and the success of the pioneers in this market, it’s time to do more. This is an opportunity to do well—and do good. The majority of these Latino entrepreneurs, often first- generation Americans, have built their businesses through their own hard work in spite of the disadvantages they face compared with their white peers. Ironically, even when they’re thriving along with growth, the path gets much rockier for LOBs as they approach the critical scale threshold, and a lack of affordable funding starts to make a material difference in their growth trajectory.
Funding the undercapitalized Latino-owned business market has the potential to provide great returns, not just for investors but for the Latino community and the country as a whole. LOBs could help fuel the economic engine for the US economy over the next decade—and provide a clear beacon of the power of capitalism, done right, to continue to supercharge growth, revitalize communities, and create access to opportunities for everyone.


Bain & Company, Inc. | Closing the Capital Gap: Fueling the Promise of Latino-owned Businesses | 41
Appendix—Table 1: Latino-owned businesses vs. white-owned businesses by revenue size and profitability
Note: Data incorporates weighting for industry, region, and revenue sizeSource: Stanford Latino Entrepreneurship Initiative annual survey, 2021 (LOB N=7,016; WOB N=7,550)
$10,000–$49,999
$50,000–$99,999
$100,000–$499,999
$500,000–$999,999
$1 million–$4,999,999
$5 million–$9,999,999
$10 million or above
Grand total
Profits
Breakeven
Losses
Grand total
2.95% 5.42% 18.73% 8.34% 8.44% 0.96% 0.50% 45.34%
2.48% 3.50% 9.36% 5.20% 3.19% 1.31% 0.19% 25.22%
2.86% 4.83% 12.65% 4.02% 4.35% 0.70% 0.03% 29.44%
8.28% 13.75% 40.74% 17.56% 15.98% 2.96% 0.72% 100.00%
Latino-owned businesses (LOBs)
53% of LOBs from $1 million to $5 million are profitable, compared with 63% of WOBs
$10,000–$49,999
$50,000–$99,999
$100,000–$499,999
$500,000–$999,999
$1 million–$4,999,999
$5 million–$9,999,999
$10 million or above
Grand total
Profits
Breakeven
Losses
Grand total
2.09% 3.93% 21.46% 9.92% 10.21% 1.87% 0.64% 50.12%
1.96% 2.92% 10.39% 3.59% 3.60% 1.02% 0.45% 23.92%
2.38% 3.82% 12.06% 4.19% 2.52% 0.78% 0.21% 25.96%
6.43% 10.68% 43.91% 17.70% 16.33% 3.67% 1.29% 100.00%
White-owned businesses (WOBs)

42 | Closing the Capital Gap: Fueling the Promise of Latino-owned Businesses | Bain & Company, Inc.
Appendix—Table 2: Latino-owned businesses vs. white-owned businesses by revenue size and revenue growth rate
Notes: Select businesses not represented in growth rate categories because of unavailability of revenue growth data; columns and totals do not sum to 100%; businesses that do not report a five-year revenue are excluded from CAGR analysis; growth rate calculated using 2016 reported revenue and 2021 reported revenue; based on LOB and WOB survey responses, data incorporates weighting for industry, region, and revenue sizeSource: Stanford Latino Entrepreneurship Initiative annual survey, 2021 (LOB N=7,016; WOB N=7,550)
$10,000–$49,999
$50,000–$99,999
$100,000–$499,999
$500,000–$999,999
$1 million–$4,999,999
$5 million–$9,999,999
$10 million or above
Less than −26%
−25%–0
0
Grand total
0.19% 0.62% 1.76% 0.97% 1.35% 0.01% 0.13%
1.12% 3.14% 8.98% 2.15% 3.21% 0.43% 0.02%
0.16% 0.29% 1.19% 0.19% 0.38% 0.04% 0.01%
8.28% 13.75% 40.74% 17.56% 15.98% 2.96% 0.72%
0–10% 0.68% 1.38% 5.19% 3.38% 2.94% 0.20% 0.10%
11%–25% 0.34% 1.06% 5.10% 4.36% 2.64% 1.13% 0.07%
26%–50% 0.36% 0.61% 3.12% 1.22% 1.91% 0.63% 0.23%
50%–100% 0.14% 0.31% 0.96% 0.95% 0.48% 0.26% 0
More than 100% 0.02% 0.15% 0.43% 0.50% 0.17% 0.03% 0.16%
Less than −26%
−25%–0
0
Grand total
0.27% 0.45% 2.38% 1.00% 0.69% 0.28% 0.02%
1.42% 2.81% 11.65% 4.76% 3.61% 1.03% 0.36%
0.17% 0.13% 1.68% 0.93% 0.64% 0.21% 0.05%
6.43% 10.68% 43.91% 17.70% 16.33% 3.67% 1.29%
0–10% 0.48% 1.43% 6.69% 3.45% 4.00% 0.72% 0.30%
11%–25% 0.50% 1.04% 5.12% 2.65% 3.08% 0.78% 0.27%
26%–50% 0.17% 0.45% 1.93% 1.00% 1.23% 0.36% 0.13%
50%–100% 0.07% 0.16% 0.65% 0.75% 0.38% 0.06% 0.00%
More than 100% 0.02% 0.06% 0.21% 0.07% 0.23% 0.01% 0.05%
Latino-owned businesses (LOBs)
Only around 3% of LOBs cross the $5 million threshold, compared with around 5% of WOBs
$10,000–$49,999
$50,000–$99,999
$100,000–$499,999
$500,000–$999,999
$1 million–$4,999,999
$5 million–$9,999,999
$10 million or above
Grand total
5.08%
19.05%
2.26%
100.00%
13.86%
14.69%
8.09%
3.11%
1.45%
5.03%
25.65%
3.79%
100.00%
17.06%
13.43%
5.27%
2.07%
0.65%
Grand total
White-owned businesses (WOBs)

Bain & Company, Inc. | Closing the Capital Gap: Fueling the Promise of Latino-owned Businesses | 43
Appendix—Table 3: Latino-owned businesses vs. white-owned businesses by business age and revenue size
Notes: Select businesses not represented in age categories because of unavailability of business age data; columns and totals do not sum to 100%; data incorporates weighting for industry, region, and revenue sizeSource: Stanford Latino Entrepreneurship Initiative annual survey, 2021 (Latino-owned business N=7,016; white-owned business N=7,550)
1–5 6–10 11–20 21–40 41 or moreGrand total
$10,000–$49,999
$50,000–$99,999
Grand total
5.24% 0.93% 1.20% 0.49% 0.06% 8.28%
6.84% 2.05% 3.02% 1.50% 0.15% 13.75%
36.34% 28.22% 20.23% 11.67% 2.08% 100.00%
$100,000–$499,999
15.01% 11.48% 7.68% 5.12% 0.72% 40.74%
$500,000–$999,999
$1 million–$4,999,999
5.27% 6.79% 3.16% 1.81% 0.39% 17.56%
$5 million–$9,999,999
3.62% 5.31% 4.41% 2.14% 0.50% 15.98%
$10 million or above
0.35% 1.26% 0.73% 0.43% 0.18% 2.96%
0.01% 0.41% 0.04% 0.18% 0.08% 0.72%
1–5 6–10 11–20 21–40 41 or moreGrand total
$10,000–$49,999
$50,000–$99,999
Grand total
3.23% 1.04% 0.95% 0.75% 0.13% 6.43%
4.47% 2.00% 1.73% 1.94% 0.27% 10.68%
29.38% 19.33% 22.14% 22.78% 5.38% 100.00%
$100,000–$499,999
14.71% 7.97% 8.86% 9.93% 2.12% 43.91%
$500,000–$999,999
$1 million–$4,999,999
3.91% 3.64% 4.44% 4.67% 1.04% 17.70%
$5 million–$9,999,999
2.77% 3.59% 4.51% 4.08% 1.31% 16.33%
$10 million or above
0.17% 0.91% 1.07% 1.08% 0.44% 3.67%
0.12% 0.17% 0.59% 0.33% 0.07% 1.29%
Latino-owned businesses
White-owned businesses
44 | Closing the Capital Gap: Fueling the Promise of Latino-owned Businesses | Bain & Company, Inc.
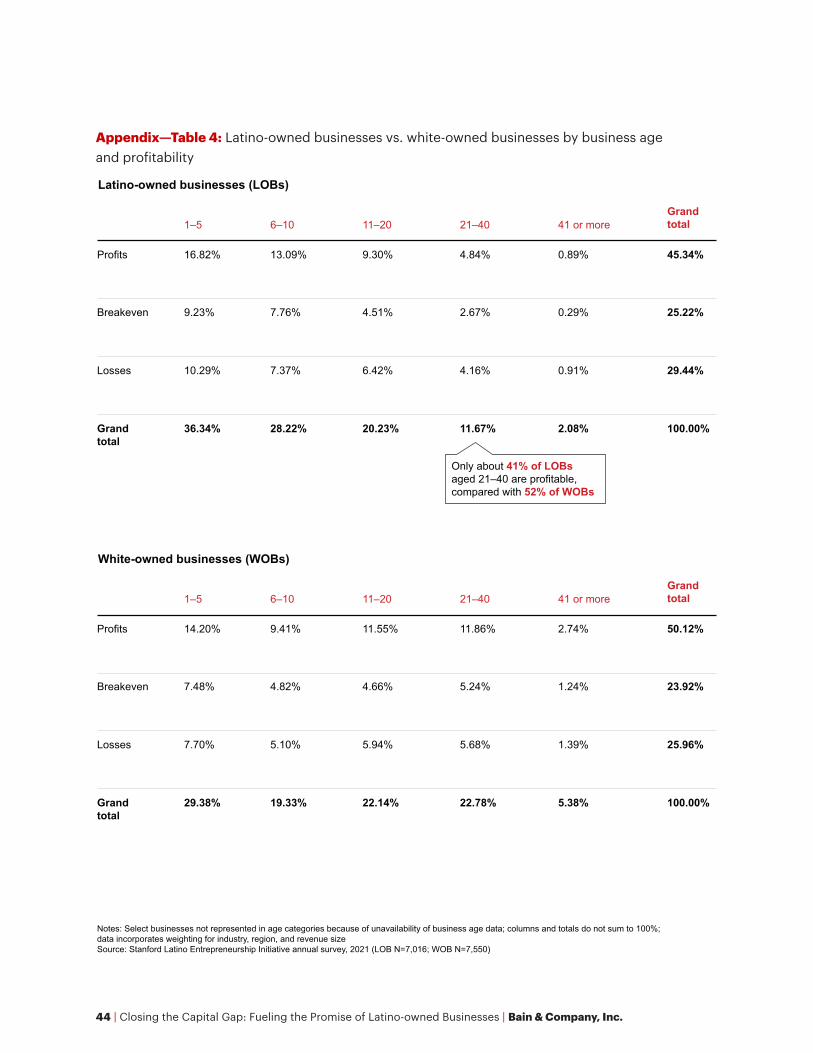
Appendix—Table 4: Latino-owned businesses vs. white-owned businesses by business age and profitability
Notes: Select businesses not represented in age categories because of unavailability of business age data; columns and totals do not sum to 100%; data incorporates weighting for industry, region, and revenue size Source: Stanford Latino Entrepreneurship Initiative annual survey, 2021 (LOB N=7,016; WOB N=7,550)
1–5 6–10 11–20 21–40 41 or moreGrand total
Latino-owned businesses (LOBs)
White-owned businesses (WOBs)
Profits
Breakeven
Losses
Grand total
16.82% 13.09% 9.30% 4.84% 0.89% 45.34%
9.23% 7.76% 4.51% 2.67% 0.29% 25.22%
10.29% 7.37% 6.42% 4.16% 0.91% 29.44%
36.34% 28.22% 20.23% 11.67% 2.08% 100.00%
1–5 6–10 11–20 21–40 41 or moreGrand total
Profits
Breakeven
Losses
Grand total
14.20% 9.41% 11.55% 11.86% 2.74% 50.12%
7.48% 4.82% 4.66% 5.24% 1.24% 23.92%
7.70% 5.10% 5.94% 5.68% 1.39% 25.96%
29.38% 19.33% 22.14% 22.78% 5.38% 100.00%
Only about 41% of LOBs aged 21–40 are profitable, compared with 52% of WOBs
Bain & Company, Inc. | Closing the Capital Gap: Fueling the Promise of Latino-owned Businesses | 45
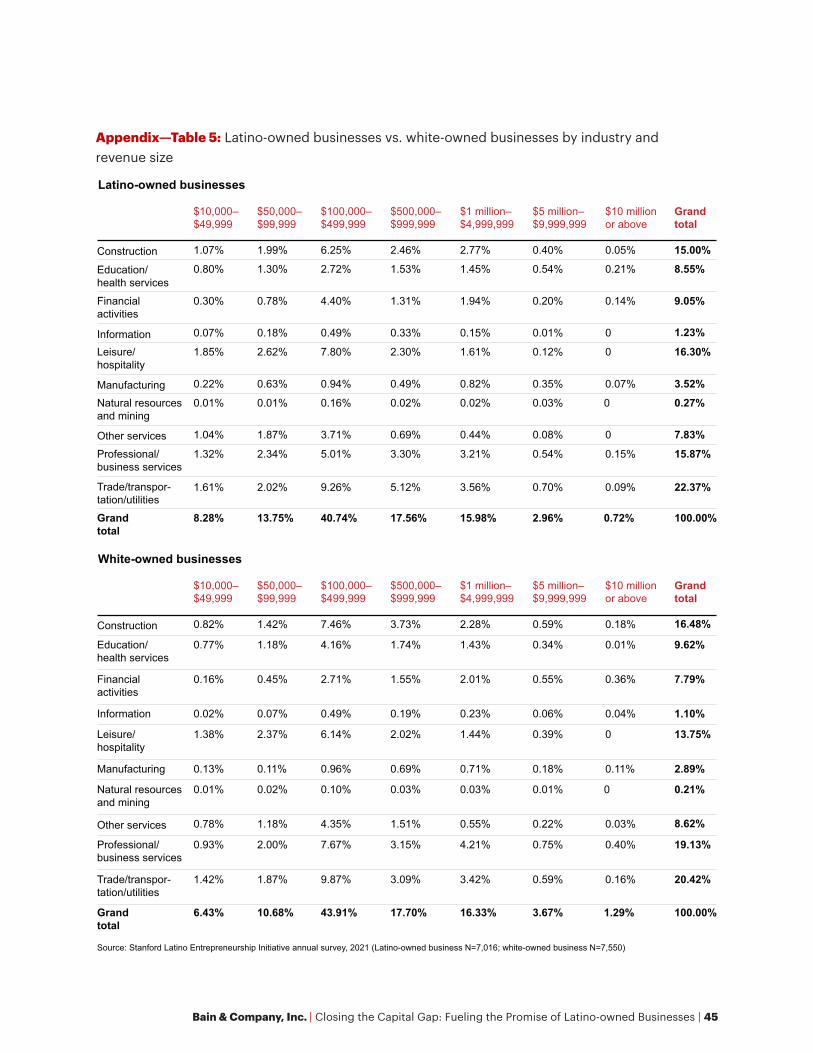
Appendix—Table 5: Latino-owned businesses vs. white-owned businesses by industry and revenue size
Source: Stanford Latino Entrepreneurship Initiative annual survey, 2021 (Latino-owned business N=7,016; white-owned business N=7,550)
$10,000–$49,999
$50,000–$99,999
$100,000–$499,999
$500,000–$999,999
$1 million–$4,999,999
$5 million–$9,999,999
$10 million or above
Construction
Education/health servicesFinancial activities
Grand total
1.07% 1.99% 6.25% 2.46% 2.77% 0.40% 0.05%
0.80% 1.30% 2.72% 1.53% 1.45% 0.54% 0.21%
0.30% 0.78% 4.40% 1.31% 1.94% 0.20% 0.14%
8.28% 13.75% 40.74% 17.56% 15.98% 2.96% 0.72%
Information 0.07% 0.18% 0.49% 0.33% 0.15% 0.01% 0
Leisure/hospitality
1.85% 2.62% 7.80% 2.30% 1.61% 0.12% 0
Manufacturing 0.22% 0.63% 0.94% 0.49% 0.82% 0.35% 0.07%
Natural resources and mining
0.01% 0.01% 0.16% 0.02% 0.02% 0.03% 0
Other services 1.04% 1.87% 3.71% 0.69% 0.44% 0.08% 0
1.32% 2.34% 5.01% 3.30% 3.21% 0.54% 0.15%
1.61% 2.02% 9.26% 5.12% 3.56% 0.70% 0.09%
Grand total
15.00%
8.55%
9.05%
100.00%
1.23%
16.30%
3.52%
0.27%
7.83%
15.87%
22.37%
Professional/business services
Trade/transpor-tation/utilities
$10,000–$49,999
$50,000–$99,999
$100,000–$499,999
$500,000–$999,999
$1 million–$4,999,999
$5 million–$9,999,999
$10 million or above
Construction
Education/health services
Financial activities
Grand total
0.82% 1.42% 7.46% 3.73% 2.28% 0.59% 0.18%
0.77% 1.18% 4.16% 1.74% 1.43% 0.34% 0.01%
0.16% 0.45% 2.71% 1.55% 2.01% 0.55% 0.36%
6.43% 10.68% 43.91% 17.70% 16.33% 3.67% 1.29%
Information 0.02% 0.07% 0.49% 0.19% 0.23% 0.06% 0.04%
Leisure/hospitality
1.38% 2.37% 6.14% 2.02% 1.44% 0.39% 0
Manufacturing 0.13% 0.11% 0.96% 0.69% 0.71% 0.18% 0.11%
Natural resources and mining
0.01% 0.02% 0.10% 0.03% 0.03% 0.01% 0
Other services 0.78% 1.18% 4.35% 1.51% 0.55% 0.22% 0.03%
0.93% 2.00% 7.67% 3.15% 4.21% 0.75% 0.40%
1.42% 1.87% 9.87% 3.09% 3.42% 0.59% 0.16%
Grand total
16.48%
9.62%
7.79%
100.00%
1.10%
13.75%
2.89%
0.21%
8.62%
19.13%
20.42%
Professional/business services
Trade/transpor-tation/utilities
Latino-owned businesses
White-owned businesses

46 | Closing the Capital Gap: Fueling the Promise of Latino-owned Businesses | Bain & Company, Inc.
Appendix—Table 6: Latino-owned businesses vs. white-owned businesses by region and industry
Source: Stanford Latino Entrepreneurship Initiative annual survey, 2021 (Latino-owned business N=7,016; white-owned business N=7,550)
Eastnorthcentral
Eastsouthcentral
Mid-Atlantic Mountain Northeast Pacific
SouthAtlantic
Construction
Education/health services
Financial activities
Grand total
0.85% 0.40% 0.98% 1.27% 0.46% 3.78%
0.30% 0.02% 1.08% 0.93% 0.21% 2.51%
0.75% 0.11% 0.43% 1.02% 0.42% 2.80%
6.56% 1.53% 10.52% 10.31% 2.50% 24.71%
Information 0.01% 0.01% 0.29% 0.19% 0.01% 0.11%
Leisure/hospitality
0.97% 0.19% 2.05% 1.95% 0.22% 3.99%
Manufacturing 0.35% 0.04% 0.26% 0.42% 0.18% 1.05%
Natural resources and mining
0.02% 0.01% 0.01% 0 0 0.08%
Other services 0.16% 0.24% 0.72% 0.88% 0.19% 2.01%
1.19% 0.34% 2.06% 1.50% 0.34% 3.50%
1.96% 0.17% 2.61% 2.14% 0.47% 4.89%
3.64%
2.37%
2.08%
24.96%
0.43%
3.66%
0.60%
0.08%
2.21%
3.64%
6.24%
Professional/business services
Trade/trans-portation/utilities
Latino-owned businessesWestnorthcentral
Westsouthcentral
0.25%
0.10%
0.20%
1.74%
0.01%
0.39%
0.08%
0.00%
0.08%
0.27%
0.35%
3.36%
1.03%
1.25%
17.17%
0.17%
2.88%
0.53%
0.06%
1.33%
3.03%
3.53%
Eastnorthcentral
Eastsouthcentral
Mid-Atlantic Mountain Northeast Pacific
SouthAtlantic
Construction
Education/health services
Financial activities
Grand total
0.93% 0.35% 1.45% 1.72% 0.53% 2.15%
0.62% 0.12% 1.56% 1.45% 0.26% 1.80%
0.36% 0.06% 0.49% 0.65% 0.18% 2.03%
6.90% 1.25% 11.47% 9.56% 2.20% 21.87%
Information 0.03% 0 0.09% 0.18% 0.01% 0.39%
Leisure/hospitality
0.70% 0.20% 1.35% 1.22% 0.20% 4.18%
Manufacturing 0.15% 0.03% 0.34% 0.20% 0.04% 0.64%
Natural resources and mining
0.01% 0 0.02% 0.01% 0 0.04%
Other services 0.52% 0.11% 0.51% 0.76% 0.13% 2.65%
2.18% 0.20% 3.48% 1.70% 0.39% 3.30%
1.39% 0.17% 2.18% 1.66% 0.47% 4.70%
5.04%
2.26%
2.14%
27.83%
0.22%
3.73%
0.67%
0.05%
2.33%
5.44%
5.95%
Grand total
15.00%
8.55%
9.05%
100.00%
1.23%
16.30%
3.52%
0.27%
7.83%
15.87%
22.37%
Grand total
16.48%
9.62%
7.79%
100.00%
1.10%
13.75%
2.89%
0.21%
8.62%
19.13%
20.42%
Professional/business services
Trade/trans-portation/utilities
White-owned businessesWestnorthcentral
Westsouthcentral
0.35%
0.14%
0.07%
1.45%
0.01%
0.22%
0.04%
0.01%
0.11%
0.26%
0.24%
3.96%
1.41%
1.80%
17.46%
0.17%
1.95%
0.78%
0.05%
1.51%
2.17%
3.66%

Bain & Company, Inc. | Closing the Capital Gap: Fueling the Promise of Latino-owned Businesses | 47
Appendix—Figure 1: Both Latino-owned and white-owned small businesses rely on personal sources for early funding
Notes: Sources of funding are not mutually exclusive; businesses have the option to select all sources of funding they apply to on the annual survey; sources oforganizational equity funding removed because of low N and data weighting considerations across angel investors, private equity, and venture capital; delta totalshave been rounded; unscaled businesses are businesses with less than $1 million in annual revenue, 2020–2021Source: Stanford Latino Entrepreneurship Initiative annual survey, 2021 (LOB N=3,554; WOB N=4,688)
Percentage of total businesses with less than $1 million in revenue that sought each funding source, 2021
Latino-owned businesses White-owned businesses
107
2122
118
232217
12
4 3 2 2 1 0 2 2
8 8
1 1 1 1 26 8
1719
1 13 4
1 1
–1%01%5%3% 1%03% 1%1% 0–1% 2% –2% –2%0 01%8%
Delta, LOBsvs. WOBs
0Personal/
familysavings
Personal credit card
Business credit card
Local bankloan
Grants Shuttered Venue
Operators Grant
Covid-19 Economic
Injury Disaster Loan
FactoringCommunity development
financial institutions
Personal/home equity loan
Family/friends
National bank loan
Hard money/
payday loans
Nonprofit lenders
Federal Reserve Main Street
Lending Program
Restaurant Revitalization
Fund
Paycheck Protection Program
Other government
loan
34
26
10
20
30
40%
Other
Personal Other
1
Organizational debt
Appendix—Figure 2: Similar requests, but lower approval, from traditional funding sources for Latino- owned businesses vs. white-owned businesses
Notes: Five-year annual growth rate calculated based on self-reported annual revenue, not included for all businesses included in survey because of lackof reported information; delta totals have been rounded; unscaled businesses are businesses with less than $1 million in annual revenue, 2020–2021Source: Stanford Latino Entrepreneurship Initiative annual survey, 2021 (LOB N=3,554; WOB N=4,688)
White-owned and Latino-owned businesses request similaramounts of funding in bank loans and credit card financing …
Average amount of funding requested by small businesses that requested each type of funding, 2021 (in US dollars)
… but small Latino-owned businesses get approved for small loans at much lower rates than white-owned businesses
Percentage of small businesses that received all funding soughtfrom capital sources for requests less than $100,000, 2021
Delta LOBsvs. WOBs
Delta LOBsvs. WOBs
Latino-owned businesses (LOBs) White-owned businesses (WOBs)
0 0
20,000
40,000
$60,000
Local bank loan
38,000
58,000
National bank loan
50,00053,000
Business credit card
30,000
21,000
Personal credit card
33,000
23,000
─$20,000 ─$3,000 $10,000$9,000
50%
40
30
20
10
Local bank loan
25
44
National bank loan
2327
Business credit card
40
48
Personal credit card
22
41
─19% ─8% ─19%─4%

48 | Closing the Capital Gap: Fueling the Promise of Latino-owned Businesses | Bain & Company, Inc.
Appendix—Figure 3: Mature Latino-owned businesses more likely to rely on personal financing sources
Notes: Sources of funding are not mutually exclusive; businesses have the option to select all sources of funding they apply to on the annual survey; sources oforganizational equity funding removed because of low N and data weighting considerations across angel investors, private equity, and venture capital; delta totalshave been rounded; scaled businesses are businesses with greater than $1 million in annual revenue, 2020–2021Source: Stanford Latino Entrepreneurship Initiative annual survey, 2021 (LOB N=3,554; WOB N=4,688)
Percentage of total businesses with greater than $1 million in revenue that sought each funding source, 2021
Latino-owned businesses White-owned businesses
–1%1%–1%–1%–2% 006% 0–1% –1%8% –2% 1% –9%0 0–1%6%
Delta, LOBsvs. WOBs
0Personal/
familysavings
Personal credit card
Business credit card
Local bankloan
Grants Shuttered Venue
Operators Grant
Covid-19 Economic
Injury Disaster Loan
FactoringCommunity development
financial institutions
10
20
30%
Other
25
19
12
6
21
14
8 10
2425
1314
3 40 1 1 1 2 1
4 42 1 0 1 1 1
6 5
13
23
1 13 4
0 1
Personal OtherOrganizational debt
Personal/home equity loan
Family/friends
National bank loan
Hard money/
payday loans
Nonprofit lenders
Federal Reserve Main Street
Lending Program
Restaurant Revitalization
Fund
Paycheck Protection Program
Other government
loan
Appendix—Figure 4: Mature Latino-owned businesses ask for and get less funding from banks than white-owned businesses
Notes: Data calculated based on comparison of LOBs that received all of funding sought for requests greater than $100,000; delta totals have been rounded; scaled businesses are businesses with greater than $1 million in annual revenue, 2020–2021Source: Stanford Latino Entrepreneurship Initiative annual survey, 2021 (LOB N=3,554; WOB N=4,688)
Nearly 15% of both Latino-ownedand white-owned mature businessesrequest national bank funding ...
… and are much less likely to be fully approved for larger loans
… but Latino-owned businesses requestfunding at amounts around 50% lessthan white-owned businesses …
4%
National bank loan National bank loan National bank loanDelta LOBsvs. WOBs ~$6,000 ~16%
Percentage of all mature businesses thatrequested national bank funding, 2021
Average amount of funding requested by mature businesses that requested national bank funding, 2021 (in US dollars)
Percentage of mature businesses that received all funding sought from national banks for requests greater than $100,000, 2021
17%
12%
$66,000$73,000
14%
30%
Latino-owned businesses (LOBs) White-owned businesses (WOBs)


For more information, visit www.bain.com