LOSALAMOS NATIONAL LAHORA TOR Y 87458 Alamos National... · Technical Area 21 (TA-21) is an area at...
19
8 ERID#: i LOS ALAMOS NATIONAL LAHORA TOR Y 7 87458 ENVIRONMENTALRESTORA110N(RRES-Rj 4 Records Processing Facility 5 ER Records Index Form 8 Date Received: 12114/2004 Processor: DSV Page Count: 18 Privileged: (YIN) N Record Category: p Administrative Record: (YIN) Y FileFolder: NIA Miscellaneous Comments: SUBMITTED BY JENNIFER SANDERS FOR REFERENCE ONLY Record Documents: Start Pg Doc Type Doc Date Title Box Package Report 7/8/1999 A Qualitative Integration of Geophysical Methods, Environmental Remediation at Los Alamos National Laboratory Technical Area 21. Micharl Martin, SAGE 1999, Santa Fe, NM. July 8.1999 N/A N/A N/A \ ,\\\1\ \\\\\ ,,\\\ \\\\\ \"" \\\\ \\\\ \0942
Transcript of LOSALAMOS NATIONAL LAHORA TOR Y 87458 Alamos National... · Technical Area 21 (TA-21) is an area at...
8 ERID i LOSALAMOS NATIONAL LAHORA TOR Y 7
87458 ENVIRONMENTALRESTORA110N(RRES-Rj4 Records Processing Facility 5 ER Records Index Form 8
Date Received 121142004 Processor DSV Page Count 18
Privileged (YIN) N Record Category p Administrative Record (YIN) Y
FileFolder NIA
Miscellaneous Comments SUBMITTED BY JENNIFER SANDERS FOR REFERENCE ONLY
Record Documents
Start Pg Doc Type Doc Date Title Box Package
Report 781999 A Qualitative Integration of Geophysical Methods Environmental Remediation at Los Alamos National Laboratory Technical Area 21 Micharl Martin SAGE 1999 Santa Fe NM July 81999
NA NA NA
1 0942
(
A Qualitative Integration of Geophysical Methods
Environmental Remediation At Los Alamos National Laboratory
Technical Area 21
Michael Martin University of California at Riverside
Prepared for SAGE 1999 Santa Fe New Mexico
July 81999
Introduction
Technical Area 21 (TA-21) is an area at Los Alamos National Laboratory
(LANL) that has been used since 1949 for the production and disposal of
radioactive materials One area in particular Materials Disposal Area (MDA) A
is the site for this study (Figure 1)
This study aims to take four separate objectives and use geophysical tests
to qualitatively integrate and interpret the results The objectives are to find two
buried underground tanks to locate a central disposal site to identify two
disposal pits and to find a buried paleo-channel outside the MDA-A
Four geophysical methods were used in the study Five seismic refraction
lines were established just outside and to the north of the MDA-A site
Magnetometer readings were taken both outside to the north of MDA-A and
inside the fenced area Ground penetrating radar (GPR) was used inside the
fenced area at MDA-A An Ohmmappertrade developed by Geometries Inc was
used for resistivity readings inside the fenced area
Background
MDA-A is located on DP Mesa on the flanks of the Jemez Volcanic
caldera This area is comprised of Bandelier Tuff a volcanic rock deposited 12
to 15 million years ago during a caldera collapse After the eruption the material
was eroded by streams washing down off of the flanks of the volcano As
headward erosion carved many canyons into the plateau many of those streams
were buried
Many studies have concentrated on this site Broxton and Eller (1995)
show an area of DP Mesa to be a sediment deposition site downgradient
of MDA-A This area is marked by a small arroyo that seemingly ends at the
study area Ferguson (1999) has speculated that this arroyo continues
upgradient as a paleo-channel
The fenced area at MDA-A contains a large disposal pit two long disposal
trenches and two large underground tanks (Generals Tanks) These disposal
areas may still contain large amounts of radioactive material particularly
plutonium 239240 (LANL 1991)
Discussion of Methods Used
The Ohmmappertrade developed by Geometries Inc is an electrical
resistivity mapping system A transmitter and receiver is capacitively coupled
and dragged over the ground (Figure 2) The distance between the transmitter
and receiver can be adjusted to make readings at varying depths
The resistivity lines were oriented east-west longitudinal to the MDA-A site
(Figure 3) These lines were designed to be perpendicular to the magnetometer
and GPR lines This would give more contour to the subsurface resistivity
readings
Two very good lines of data were taken Two other lines were taken but
were noisy and not very useful Another line did not receive any data At this
point the Ohmmappertrade was rendered unusable and the data discounted
Another instrument the GEM-2 by Geophex Ltd was used in a separate
study of the MDA-A site The GEM-2 is an electro-magnetic sensor that operates
at multiple frequencies This allows a pseudo 3-D distribution image to be
constructed and enhances the ability to detect targets The image in this study
was produced by the GEM-2 at a frequency of 9210Hz
Ground penetrating radar (GPR) lines were oriented in a north-south
direction perpendicular to the resistivity lines These GPR lines were also
perpendicular to the Generals Tanks on the western end of MDA-A There were
8 lines used in this study (Figure 3)
A Cesium Vapor Magnetometer was used for the magnetic contouring
Magnetic lines were run inside the MDA-A site and outside the site to the north
across the road (Figure 3) Because of the amount of magnetic data collected
profiles are available oriented either north-south or east-west
A Bison 9000 48-channel seismograph was used for the seismic refraction
lines Figure 3 shows the location of each seismic line and their proximity to
MDA-A
The Generals Tanks
Figure 4 shows the location of the Generals Tanks inside MDA-A GPR
Line 21 (Figure 3) shows a large reflector parallel to the tanks A magnetic
profile also taken along that same line (Figure 5) shows a large anomaly along
the western edge suggesting the presence of the tanks Ohm mapper Line 1
(Figure 3) shows an area of low resistivity values along the western edge also
suggesting the presence of the tanks This was rather hard to correlate because
of the lack of field notes stating the horizontal distance of each line
Central Disposal Site
Figure 4 shows the location of the Central Disposal Site inside MDA-A
GPR Line 44 (Figure 3) shows some small reflectors across the middle of the
MDA-A site correlating to the Central Disposal Site A magnetic profile across
the same area (Figure 6) shows a small anomaly in the same area The
Ohm mapper lines also show lower than average resistivity values in the central
area of the site
Eastern Disposal Pits
The Ohm mapper shows low resistivity values in the eastern part of the site
(Figure 7) suggesting the presence of the pits The magnetic profiles (Figure 8)
also show high anomalies across those pits GPR line 89 shows reflectors
across those pits (Figure 9) The GEM-2 plan view resistivity contour map shows
the pits very clearly (Figure 10)
l
Paleo-channel
All three seismic models show the pres~nce of a buried palecrchannel
Seismic line 8 (Figure 11) shows how the paleo-channel model matches the
magnetic data The presence of a large magnetic anomaly corresponds to the
location of the channel This paleo-channel also correlates to a small surface
arroyo to the east of the study area (Broxton and Eller 1995 plate 4) The
paleo-channel extends westward under the road (Quesada 1999)
Conclusions
All four electro-magnetic methods allowed for imaging the tanks and pits
inside MDA-A The GPR and magnetic data show strong data suggesting the
presence of the Generals Tanks The Eastern Disposal Pits are clearly shown
using magnetic and GEM-2 data
The buried paleo-channel outside MDA-A is clearly shown using refractive
seismology and magnetics It is not known how far to the west into TA-21 the
paleo-channel extends Perhaps more refractive seismic lines in the future will
show this extent
Recommendations
It is recommended that Seismic Lines 6 and 7 be modeled to determine
the extent of the paleo-channel It is also recommended that magnetic data be
collected in other areas of TA-21 and MDA-A to find any other traces of the
paleo-channel anomaly A small incised channel to the northwest of MDA-A
should be studied for a possible paleo-channel
Acknowledgments
The author would like to extend his thanks to the entire SAGE staff for
their help suggestions and support Thanks also go to Mike Quesada Kaj
Johnson and Greg Young whose help on this project goes beyond words The
author also would like to thank the people at Los Alamos National Laboratory for
their permission to work at TA-21 Finally the author would like to extend a
special thanks to Dr George Jiracek for daring me to dance
References
Los Alamos National Laboratory 1991 T A-21 Operable Unit RFI Work Plan for Environmental Remediation
Broxton D E and Eller P G eds 1995 Earth Science Investigations for Environmental Restorations - Los Alamos National Laboratory Technical Area 21 Los Alamos National Laboratory Publication UC-903
Ferguson J 1999 personal communication
Geophex Ltd 1996 Geophysical Investigation of Material Disposal Areas A and T Los Alamos New Mexico Geophex Job No 636
Quesada M 1999 personal communication
l
Table of Figures
Figure 1 Los Alamos National Laboratory Study Area including TA-21 and MDA-A
Figure 2 The OhmmapperTM
Figure 3 The MDA-A Study Site The magnetic areas the GPR lines and the Ohm mapper lines are all shown
Figure 4 MDA-A Study Site showing the approximate location of the Generals Tanks the Central Disposal Area and the Eastern Disposal Pits
Figure 5 Comparative models of the magnetic profile GPR Line 21 and Ohmmapper Line O Horizontal axis scaled equally for all models Note that the Ohm mapper line is reversed to match the other lines
Figure 6 Same as above showing GPR Line 44 Ohm mapper line is normal
Figure 7 Ohm mapper values along lines 0 and 1
Figure 8 Magnetic profiles along Ohmmapper lines 0 and 1
Figure 9 Same as figures 5 and 6 but with GPR Line 89 with magnetic profile of GPR89
Figure 10 Data from the GEM-2 showing clearly the presence of the Eastern Disposal Pits
Figure 11 Seismic model and magnetic profile along Seismic Line 8
Figure 1
t IiI80 SolI Sample Locationbull -- fencine
o 1CO 200 I
fig 1 GenenII bas map d UDAl showing IocaIIcn d1880 ICliI ampIes
Figure 2
The OhmmapperTM
Dipole cabl Dipole
SAGE 1999 Refraction Lines
800
700 I
(
600
o ~ ~ 500 orshyI MDA-TCl ~ 400
1 c o Z
300
N
200
I
1I M 100 l2 s
C)
i
Line 5
GPR Lines ~
middot-middot middot--middotMmiddot-hftmiddot-A_
U M ~ ~
100 200 300 400 500 600 700 800 900 1000 1100 Easting ~ 1632500
if
SAGE 1999 Refraction Lines
800
700
600
Line 5 Magneometer Survey Grid0
~ 500 ~ f-
f- -rshy
I
MDA-TC) shy5400 r 1 0 Z
300 f-
N
- ti C ntral Olsposal Site i f-1f ~ ~1
I lt bull I 200 f- East~ its
I ocent 100 f J 0)
u 100 200 300 400 500 600 700 800 900 1000 1100
Easting - 1632500
Figure 5
In 1S74 em em 2 12 22 32
T II B 0 8~8
28 1amp II A 10 y
2amp 0
3amp E69T p R A BB amp TH U E 188 Samp)t l
68 T
_ bullUr---------------------------ii_114~
I
6OOO1L-__---____---__---___---shy
B05 80 815 Il12O 82S 830
2 12 22 32 42
10 196middot
l l~ )01) bullbull )00
0
middotZO o
30 E p
T18 H
50 11
68
18
10 241 ~OO
6000[shy
4000
12ooo~
o
middot2000
~ooot I
middot---l Figure 6
I I I
I I
~ r-middotI
J
~
T U 0
U 11 Y
T R 11 88 I)
E lOO l
120 T 1 14R
t__~~
~
I
i I bull I I
I I i I I~ I l
---------------__shy - -
Plottint Of 41- t~ Line 0 ark -0 to 11 0 rk 1
Figure 7
Ew
to24~~IL1----------------------------------------------------------------------102641 000
Plottl of 141e fro LhM 1 rk S to 11 1 Mrk -1 15bullbull12
(
E
HI 40 t~middot~~---------------------------------- tonntoo
Figure 8
Magnetic Profiles of Ohmmappertrade Lines
Line 0 1l1000
14000
12000
10000
eooo
CIIOOO
4000
2000
0
20()0
-4000 700 1150 7SO lOCI
12000
10000
eooo
2000
o
IISO 100 8SO 1000 1DSO 1100
Line 1
~ 700 750 IlOO IISO 100 8SO 1000 1DSO 1100
----- shy--~
Figure 9 0
(
I~I I
( l~l
I I
lOOOj I ~
~
I
~
100CI
laquo100 940 lin 950
l lZ 22 3Z 12
I J n
00 u bull 111 n
SOt I
I R n I [
l
tl 0 0 Et 30 p
60
~
ti V ~
Figure 10
(lA 0 f1-~er1
80000 19500 17500 15500 13500
11500 9500 7500 5500 3500 1500 -500 -2500 -4500 -6500 -8500 -10500 -12500 -14500 -16500 -18500 -100000
Plot of mdaagem1-15210 Hz In-phase
DP Site Une 8 60
Figure 11 II) 40E
lt -CD ~ E1= 20
0 150
Range (ft)
0
20 c-~40 CD
deg60
80
250 1
(
200~ I
I
150L
100
50
0
I
-50~ I Ii
-100 L 805
40 1100 o 41 3200+ 42
~ 43 Velocity (Ills) o 44
I I
i I
~ i I I I
~ I
1 I
I I
I i i i i
-l I I I I
810
815
820 ~--
825 _1 ____
830 835 840 845 -- 850
(
A Qualitative Integration of Geophysical Methods
Environmental Remediation At Los Alamos National Laboratory
Technical Area 21
Michael Martin University of California at Riverside
Prepared for SAGE 1999 Santa Fe New Mexico
July 81999
Introduction
Technical Area 21 (TA-21) is an area at Los Alamos National Laboratory
(LANL) that has been used since 1949 for the production and disposal of
radioactive materials One area in particular Materials Disposal Area (MDA) A
is the site for this study (Figure 1)
This study aims to take four separate objectives and use geophysical tests
to qualitatively integrate and interpret the results The objectives are to find two
buried underground tanks to locate a central disposal site to identify two
disposal pits and to find a buried paleo-channel outside the MDA-A
Four geophysical methods were used in the study Five seismic refraction
lines were established just outside and to the north of the MDA-A site
Magnetometer readings were taken both outside to the north of MDA-A and
inside the fenced area Ground penetrating radar (GPR) was used inside the
fenced area at MDA-A An Ohmmappertrade developed by Geometries Inc was
used for resistivity readings inside the fenced area
Background
MDA-A is located on DP Mesa on the flanks of the Jemez Volcanic
caldera This area is comprised of Bandelier Tuff a volcanic rock deposited 12
to 15 million years ago during a caldera collapse After the eruption the material
was eroded by streams washing down off of the flanks of the volcano As
headward erosion carved many canyons into the plateau many of those streams
were buried
Many studies have concentrated on this site Broxton and Eller (1995)
show an area of DP Mesa to be a sediment deposition site downgradient
of MDA-A This area is marked by a small arroyo that seemingly ends at the
study area Ferguson (1999) has speculated that this arroyo continues
upgradient as a paleo-channel
The fenced area at MDA-A contains a large disposal pit two long disposal
trenches and two large underground tanks (Generals Tanks) These disposal
areas may still contain large amounts of radioactive material particularly
plutonium 239240 (LANL 1991)
Discussion of Methods Used
The Ohmmappertrade developed by Geometries Inc is an electrical
resistivity mapping system A transmitter and receiver is capacitively coupled
and dragged over the ground (Figure 2) The distance between the transmitter
and receiver can be adjusted to make readings at varying depths
The resistivity lines were oriented east-west longitudinal to the MDA-A site
(Figure 3) These lines were designed to be perpendicular to the magnetometer
and GPR lines This would give more contour to the subsurface resistivity
readings
Two very good lines of data were taken Two other lines were taken but
were noisy and not very useful Another line did not receive any data At this
point the Ohmmappertrade was rendered unusable and the data discounted
Another instrument the GEM-2 by Geophex Ltd was used in a separate
study of the MDA-A site The GEM-2 is an electro-magnetic sensor that operates
at multiple frequencies This allows a pseudo 3-D distribution image to be
constructed and enhances the ability to detect targets The image in this study
was produced by the GEM-2 at a frequency of 9210Hz
Ground penetrating radar (GPR) lines were oriented in a north-south
direction perpendicular to the resistivity lines These GPR lines were also
perpendicular to the Generals Tanks on the western end of MDA-A There were
8 lines used in this study (Figure 3)
A Cesium Vapor Magnetometer was used for the magnetic contouring
Magnetic lines were run inside the MDA-A site and outside the site to the north
across the road (Figure 3) Because of the amount of magnetic data collected
profiles are available oriented either north-south or east-west
A Bison 9000 48-channel seismograph was used for the seismic refraction
lines Figure 3 shows the location of each seismic line and their proximity to
MDA-A
The Generals Tanks
Figure 4 shows the location of the Generals Tanks inside MDA-A GPR
Line 21 (Figure 3) shows a large reflector parallel to the tanks A magnetic
profile also taken along that same line (Figure 5) shows a large anomaly along
the western edge suggesting the presence of the tanks Ohm mapper Line 1
(Figure 3) shows an area of low resistivity values along the western edge also
suggesting the presence of the tanks This was rather hard to correlate because
of the lack of field notes stating the horizontal distance of each line
Central Disposal Site
Figure 4 shows the location of the Central Disposal Site inside MDA-A
GPR Line 44 (Figure 3) shows some small reflectors across the middle of the
MDA-A site correlating to the Central Disposal Site A magnetic profile across
the same area (Figure 6) shows a small anomaly in the same area The
Ohm mapper lines also show lower than average resistivity values in the central
area of the site
Eastern Disposal Pits
The Ohm mapper shows low resistivity values in the eastern part of the site
(Figure 7) suggesting the presence of the pits The magnetic profiles (Figure 8)
also show high anomalies across those pits GPR line 89 shows reflectors
across those pits (Figure 9) The GEM-2 plan view resistivity contour map shows
the pits very clearly (Figure 10)
l
Paleo-channel
All three seismic models show the pres~nce of a buried palecrchannel
Seismic line 8 (Figure 11) shows how the paleo-channel model matches the
magnetic data The presence of a large magnetic anomaly corresponds to the
location of the channel This paleo-channel also correlates to a small surface
arroyo to the east of the study area (Broxton and Eller 1995 plate 4) The
paleo-channel extends westward under the road (Quesada 1999)
Conclusions
All four electro-magnetic methods allowed for imaging the tanks and pits
inside MDA-A The GPR and magnetic data show strong data suggesting the
presence of the Generals Tanks The Eastern Disposal Pits are clearly shown
using magnetic and GEM-2 data
The buried paleo-channel outside MDA-A is clearly shown using refractive
seismology and magnetics It is not known how far to the west into TA-21 the
paleo-channel extends Perhaps more refractive seismic lines in the future will
show this extent
Recommendations
It is recommended that Seismic Lines 6 and 7 be modeled to determine
the extent of the paleo-channel It is also recommended that magnetic data be
collected in other areas of TA-21 and MDA-A to find any other traces of the
paleo-channel anomaly A small incised channel to the northwest of MDA-A
should be studied for a possible paleo-channel
Acknowledgments
The author would like to extend his thanks to the entire SAGE staff for
their help suggestions and support Thanks also go to Mike Quesada Kaj
Johnson and Greg Young whose help on this project goes beyond words The
author also would like to thank the people at Los Alamos National Laboratory for
their permission to work at TA-21 Finally the author would like to extend a
special thanks to Dr George Jiracek for daring me to dance
References
Los Alamos National Laboratory 1991 T A-21 Operable Unit RFI Work Plan for Environmental Remediation
Broxton D E and Eller P G eds 1995 Earth Science Investigations for Environmental Restorations - Los Alamos National Laboratory Technical Area 21 Los Alamos National Laboratory Publication UC-903
Ferguson J 1999 personal communication
Geophex Ltd 1996 Geophysical Investigation of Material Disposal Areas A and T Los Alamos New Mexico Geophex Job No 636
Quesada M 1999 personal communication
l
Table of Figures
Figure 1 Los Alamos National Laboratory Study Area including TA-21 and MDA-A
Figure 2 The OhmmapperTM
Figure 3 The MDA-A Study Site The magnetic areas the GPR lines and the Ohm mapper lines are all shown
Figure 4 MDA-A Study Site showing the approximate location of the Generals Tanks the Central Disposal Area and the Eastern Disposal Pits
Figure 5 Comparative models of the magnetic profile GPR Line 21 and Ohmmapper Line O Horizontal axis scaled equally for all models Note that the Ohm mapper line is reversed to match the other lines
Figure 6 Same as above showing GPR Line 44 Ohm mapper line is normal
Figure 7 Ohm mapper values along lines 0 and 1
Figure 8 Magnetic profiles along Ohmmapper lines 0 and 1
Figure 9 Same as figures 5 and 6 but with GPR Line 89 with magnetic profile of GPR89
Figure 10 Data from the GEM-2 showing clearly the presence of the Eastern Disposal Pits
Figure 11 Seismic model and magnetic profile along Seismic Line 8
Figure 1
t IiI80 SolI Sample Locationbull -- fencine
o 1CO 200 I
fig 1 GenenII bas map d UDAl showing IocaIIcn d1880 ICliI ampIes
Figure 2
The OhmmapperTM
Dipole cabl Dipole
SAGE 1999 Refraction Lines
800
700 I
(
600
o ~ ~ 500 orshyI MDA-TCl ~ 400
1 c o Z
300
N
200
I
1I M 100 l2 s
C)
i
Line 5
GPR Lines ~
middot-middot middot--middotMmiddot-hftmiddot-A_
U M ~ ~
100 200 300 400 500 600 700 800 900 1000 1100 Easting ~ 1632500
if
SAGE 1999 Refraction Lines
800
700
600
Line 5 Magneometer Survey Grid0
~ 500 ~ f-
f- -rshy
I
MDA-TC) shy5400 r 1 0 Z
300 f-
N
- ti C ntral Olsposal Site i f-1f ~ ~1
I lt bull I 200 f- East~ its
I ocent 100 f J 0)
u 100 200 300 400 500 600 700 800 900 1000 1100
Easting - 1632500
Figure 5
In 1S74 em em 2 12 22 32
T II B 0 8~8
28 1amp II A 10 y
2amp 0
3amp E69T p R A BB amp TH U E 188 Samp)t l
68 T
_ bullUr---------------------------ii_114~
I
6OOO1L-__---____---__---___---shy
B05 80 815 Il12O 82S 830
2 12 22 32 42
10 196middot
l l~ )01) bullbull )00
0
middotZO o
30 E p
T18 H
50 11
68
18
10 241 ~OO
6000[shy
4000
12ooo~
o
middot2000
~ooot I
middot---l Figure 6
I I I
I I
~ r-middotI
J
~
T U 0
U 11 Y
T R 11 88 I)
E lOO l
120 T 1 14R
t__~~
~
I
i I bull I I
I I i I I~ I l
---------------__shy - -
Plottint Of 41- t~ Line 0 ark -0 to 11 0 rk 1
Figure 7
Ew
to24~~IL1----------------------------------------------------------------------102641 000
Plottl of 141e fro LhM 1 rk S to 11 1 Mrk -1 15bullbull12
(
E
HI 40 t~middot~~---------------------------------- tonntoo
Figure 8
Magnetic Profiles of Ohmmappertrade Lines
Line 0 1l1000
14000
12000
10000
eooo
CIIOOO
4000
2000
0
20()0
-4000 700 1150 7SO lOCI
12000
10000
eooo
2000
o
IISO 100 8SO 1000 1DSO 1100
Line 1
~ 700 750 IlOO IISO 100 8SO 1000 1DSO 1100
----- shy--~
Figure 9 0
(
I~I I
( l~l
I I
lOOOj I ~
~
I
~
100CI
laquo100 940 lin 950
l lZ 22 3Z 12
I J n
00 u bull 111 n
SOt I
I R n I [
l
tl 0 0 Et 30 p
60
~
ti V ~
Figure 10
(lA 0 f1-~er1
80000 19500 17500 15500 13500
11500 9500 7500 5500 3500 1500 -500 -2500 -4500 -6500 -8500 -10500 -12500 -14500 -16500 -18500 -100000
Plot of mdaagem1-15210 Hz In-phase
DP Site Une 8 60
Figure 11 II) 40E
lt -CD ~ E1= 20
0 150
Range (ft)
0
20 c-~40 CD
deg60
80
250 1
(
200~ I
I
150L
100
50
0
I
-50~ I Ii
-100 L 805
40 1100 o 41 3200+ 42
~ 43 Velocity (Ills) o 44
I I
i I
~ i I I I
~ I
1 I
I I
I i i i i
-l I I I I
810
815
820 ~--
825 _1 ____
830 835 840 845 -- 850

l
Paleo-channel
All three seismic models show the pres~nce of a buried palecrchannel
Seismic line 8 (Figure 11) shows how the paleo-channel model matches the
magnetic data The presence of a large magnetic anomaly corresponds to the
location of the channel This paleo-channel also correlates to a small surface
arroyo to the east of the study area (Broxton and Eller 1995 plate 4) The
paleo-channel extends westward under the road (Quesada 1999)
Conclusions
All four electro-magnetic methods allowed for imaging the tanks and pits
inside MDA-A The GPR and magnetic data show strong data suggesting the
presence of the Generals Tanks The Eastern Disposal Pits are clearly shown
using magnetic and GEM-2 data
The buried paleo-channel outside MDA-A is clearly shown using refractive
seismology and magnetics It is not known how far to the west into TA-21 the
paleo-channel extends Perhaps more refractive seismic lines in the future will
show this extent
Recommendations
It is recommended that Seismic Lines 6 and 7 be modeled to determine
the extent of the paleo-channel It is also recommended that magnetic data be
collected in other areas of TA-21 and MDA-A to find any other traces of the
paleo-channel anomaly A small incised channel to the northwest of MDA-A
should be studied for a possible paleo-channel
Acknowledgments
The author would like to extend his thanks to the entire SAGE staff for
their help suggestions and support Thanks also go to Mike Quesada Kaj
Johnson and Greg Young whose help on this project goes beyond words The
author also would like to thank the people at Los Alamos National Laboratory for
their permission to work at TA-21 Finally the author would like to extend a
special thanks to Dr George Jiracek for daring me to dance
References
Los Alamos National Laboratory 1991 T A-21 Operable Unit RFI Work Plan for Environmental Remediation
Broxton D E and Eller P G eds 1995 Earth Science Investigations for Environmental Restorations - Los Alamos National Laboratory Technical Area 21 Los Alamos National Laboratory Publication UC-903
Ferguson J 1999 personal communication
Geophex Ltd 1996 Geophysical Investigation of Material Disposal Areas A and T Los Alamos New Mexico Geophex Job No 636
Quesada M 1999 personal communication
l
Table of Figures
Figure 1 Los Alamos National Laboratory Study Area including TA-21 and MDA-A
Figure 2 The OhmmapperTM
Figure 3 The MDA-A Study Site The magnetic areas the GPR lines and the Ohm mapper lines are all shown
Figure 4 MDA-A Study Site showing the approximate location of the Generals Tanks the Central Disposal Area and the Eastern Disposal Pits
Figure 5 Comparative models of the magnetic profile GPR Line 21 and Ohmmapper Line O Horizontal axis scaled equally for all models Note that the Ohm mapper line is reversed to match the other lines
Figure 6 Same as above showing GPR Line 44 Ohm mapper line is normal
Figure 7 Ohm mapper values along lines 0 and 1
Figure 8 Magnetic profiles along Ohmmapper lines 0 and 1
Figure 9 Same as figures 5 and 6 but with GPR Line 89 with magnetic profile of GPR89
Figure 10 Data from the GEM-2 showing clearly the presence of the Eastern Disposal Pits
Figure 11 Seismic model and magnetic profile along Seismic Line 8
Figure 1
t IiI80 SolI Sample Locationbull -- fencine
o 1CO 200 I
fig 1 GenenII bas map d UDAl showing IocaIIcn d1880 ICliI ampIes
Figure 2
The OhmmapperTM
Dipole cabl Dipole
SAGE 1999 Refraction Lines
800
700 I
(
600
o ~ ~ 500 orshyI MDA-TCl ~ 400
1 c o Z
300
N
200
I
1I M 100 l2 s
C)
i
Line 5
GPR Lines ~
middot-middot middot--middotMmiddot-hftmiddot-A_
U M ~ ~
100 200 300 400 500 600 700 800 900 1000 1100 Easting ~ 1632500
if
SAGE 1999 Refraction Lines
800
700
600
Line 5 Magneometer Survey Grid0
~ 500 ~ f-
f- -rshy
I
MDA-TC) shy5400 r 1 0 Z
300 f-
N
- ti C ntral Olsposal Site i f-1f ~ ~1
I lt bull I 200 f- East~ its
I ocent 100 f J 0)
u 100 200 300 400 500 600 700 800 900 1000 1100
Easting - 1632500
Figure 5
In 1S74 em em 2 12 22 32
T II B 0 8~8
28 1amp II A 10 y
2amp 0
3amp E69T p R A BB amp TH U E 188 Samp)t l
68 T
_ bullUr---------------------------ii_114~
I
6OOO1L-__---____---__---___---shy
B05 80 815 Il12O 82S 830
2 12 22 32 42
10 196middot
l l~ )01) bullbull )00
0
middotZO o
30 E p
T18 H
50 11
68
18
10 241 ~OO
6000[shy
4000
12ooo~
o
middot2000
~ooot I
middot---l Figure 6
I I I
I I
~ r-middotI
J
~
T U 0
U 11 Y
T R 11 88 I)
E lOO l
120 T 1 14R
t__~~
~
I
i I bull I I
I I i I I~ I l
---------------__shy - -
Plottint Of 41- t~ Line 0 ark -0 to 11 0 rk 1
Figure 7
Ew
to24~~IL1----------------------------------------------------------------------102641 000
Plottl of 141e fro LhM 1 rk S to 11 1 Mrk -1 15bullbull12
(
E
HI 40 t~middot~~---------------------------------- tonntoo
Figure 8
Magnetic Profiles of Ohmmappertrade Lines
Line 0 1l1000
14000
12000
10000
eooo
CIIOOO
4000
2000
0
20()0
-4000 700 1150 7SO lOCI
12000
10000
eooo
2000
o
IISO 100 8SO 1000 1DSO 1100
Line 1
~ 700 750 IlOO IISO 100 8SO 1000 1DSO 1100
----- shy--~
Figure 9 0
(
I~I I
( l~l
I I
lOOOj I ~
~
I
~
100CI
laquo100 940 lin 950
l lZ 22 3Z 12
I J n
00 u bull 111 n
SOt I
I R n I [
l
tl 0 0 Et 30 p
60
~
ti V ~
Figure 10
(lA 0 f1-~er1
80000 19500 17500 15500 13500
11500 9500 7500 5500 3500 1500 -500 -2500 -4500 -6500 -8500 -10500 -12500 -14500 -16500 -18500 -100000
Plot of mdaagem1-15210 Hz In-phase
DP Site Une 8 60
Figure 11 II) 40E
lt -CD ~ E1= 20
0 150
Range (ft)
0
20 c-~40 CD
deg60
80
250 1
(
200~ I
I
150L
100
50
0
I
-50~ I Ii
-100 L 805
40 1100 o 41 3200+ 42
~ 43 Velocity (Ills) o 44
I I
i I
~ i I I I
~ I
1 I
I I
I i i i i
-l I I I I
810
815
820 ~--
825 _1 ____
830 835 840 845 -- 850
l
Table of Figures
Figure 1 Los Alamos National Laboratory Study Area including TA-21 and MDA-A
Figure 2 The OhmmapperTM
Figure 3 The MDA-A Study Site The magnetic areas the GPR lines and the Ohm mapper lines are all shown
Figure 4 MDA-A Study Site showing the approximate location of the Generals Tanks the Central Disposal Area and the Eastern Disposal Pits
Figure 5 Comparative models of the magnetic profile GPR Line 21 and Ohmmapper Line O Horizontal axis scaled equally for all models Note that the Ohm mapper line is reversed to match the other lines
Figure 6 Same as above showing GPR Line 44 Ohm mapper line is normal
Figure 7 Ohm mapper values along lines 0 and 1
Figure 8 Magnetic profiles along Ohmmapper lines 0 and 1
Figure 9 Same as figures 5 and 6 but with GPR Line 89 with magnetic profile of GPR89
Figure 10 Data from the GEM-2 showing clearly the presence of the Eastern Disposal Pits
Figure 11 Seismic model and magnetic profile along Seismic Line 8
Figure 1
t IiI80 SolI Sample Locationbull -- fencine
o 1CO 200 I
fig 1 GenenII bas map d UDAl showing IocaIIcn d1880 ICliI ampIes
Figure 2
The OhmmapperTM
Dipole cabl Dipole
SAGE 1999 Refraction Lines
800
700 I
(
600
o ~ ~ 500 orshyI MDA-TCl ~ 400
1 c o Z
300
N
200
I
1I M 100 l2 s
C)
i
Line 5
GPR Lines ~
middot-middot middot--middotMmiddot-hftmiddot-A_
U M ~ ~
100 200 300 400 500 600 700 800 900 1000 1100 Easting ~ 1632500
if
SAGE 1999 Refraction Lines
800
700
600
Line 5 Magneometer Survey Grid0
~ 500 ~ f-
f- -rshy
I
MDA-TC) shy5400 r 1 0 Z
300 f-
N
- ti C ntral Olsposal Site i f-1f ~ ~1
I lt bull I 200 f- East~ its
I ocent 100 f J 0)
u 100 200 300 400 500 600 700 800 900 1000 1100
Easting - 1632500
Figure 5
In 1S74 em em 2 12 22 32
T II B 0 8~8
28 1amp II A 10 y
2amp 0
3amp E69T p R A BB amp TH U E 188 Samp)t l
68 T
_ bullUr---------------------------ii_114~
I
6OOO1L-__---____---__---___---shy
B05 80 815 Il12O 82S 830
2 12 22 32 42
10 196middot
l l~ )01) bullbull )00
0
middotZO o
30 E p
T18 H
50 11
68
18
10 241 ~OO
6000[shy
4000
12ooo~
o
middot2000
~ooot I
middot---l Figure 6
I I I
I I
~ r-middotI
J
~
T U 0
U 11 Y
T R 11 88 I)
E lOO l
120 T 1 14R
t__~~
~
I
i I bull I I
I I i I I~ I l
---------------__shy - -
Plottint Of 41- t~ Line 0 ark -0 to 11 0 rk 1
Figure 7
Ew
to24~~IL1----------------------------------------------------------------------102641 000
Plottl of 141e fro LhM 1 rk S to 11 1 Mrk -1 15bullbull12
(
E
HI 40 t~middot~~---------------------------------- tonntoo
Figure 8
Magnetic Profiles of Ohmmappertrade Lines
Line 0 1l1000
14000
12000
10000
eooo
CIIOOO
4000
2000
0
20()0
-4000 700 1150 7SO lOCI
12000
10000
eooo
2000
o
IISO 100 8SO 1000 1DSO 1100
Line 1
~ 700 750 IlOO IISO 100 8SO 1000 1DSO 1100
----- shy--~
Figure 9 0
(
I~I I
( l~l
I I
lOOOj I ~
~
I
~
100CI
laquo100 940 lin 950
l lZ 22 3Z 12
I J n
00 u bull 111 n
SOt I
I R n I [
l
tl 0 0 Et 30 p
60
~
ti V ~
Figure 10
(lA 0 f1-~er1
80000 19500 17500 15500 13500
11500 9500 7500 5500 3500 1500 -500 -2500 -4500 -6500 -8500 -10500 -12500 -14500 -16500 -18500 -100000
Plot of mdaagem1-15210 Hz In-phase
DP Site Une 8 60
Figure 11 II) 40E
lt -CD ~ E1= 20
0 150
Range (ft)
0
20 c-~40 CD
deg60
80
250 1
(
200~ I
I
150L
100
50
0
I
-50~ I Ii
-100 L 805
40 1100 o 41 3200+ 42
~ 43 Velocity (Ills) o 44
I I
i I
~ i I I I
~ I
1 I
I I
I i i i i
-l I I I I
810
815
820 ~--
825 _1 ____
830 835 840 845 -- 850
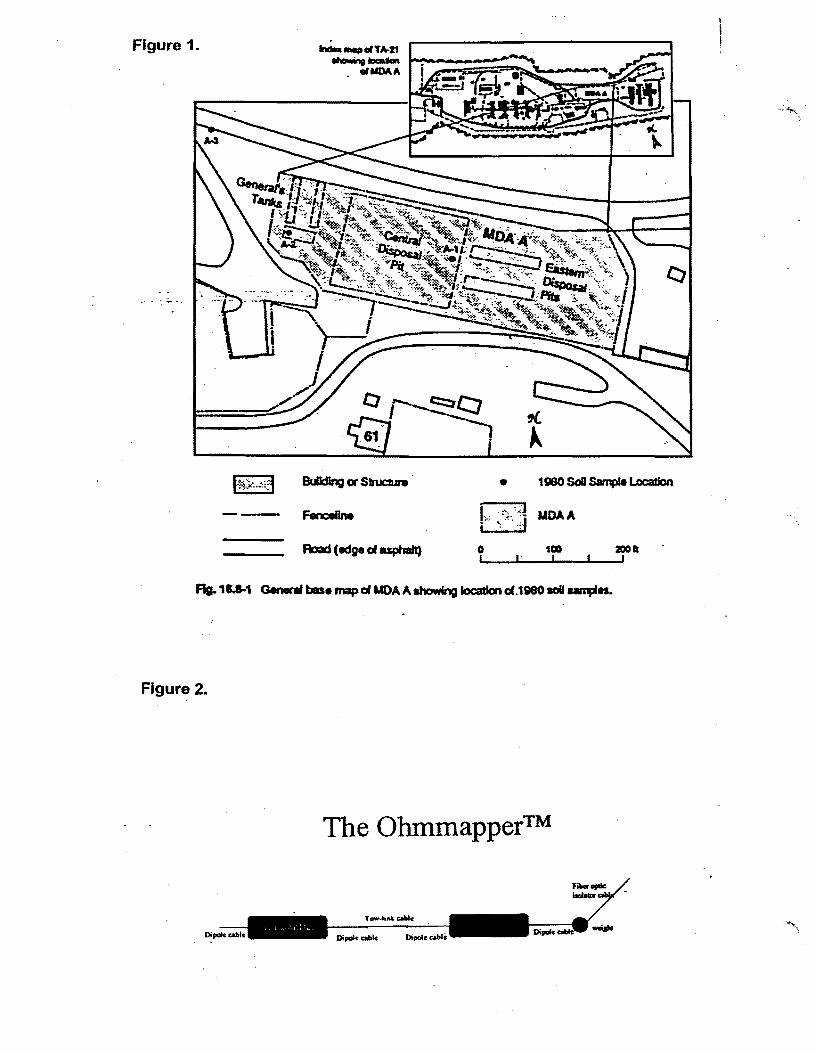
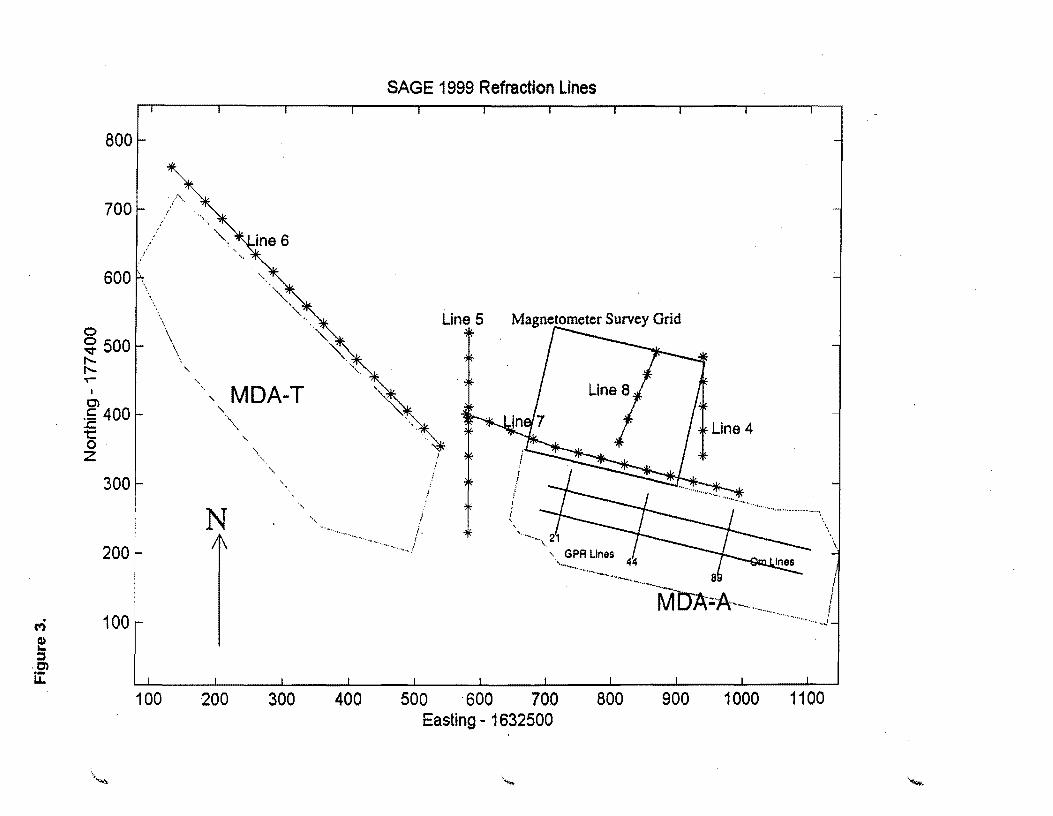
SAGE 1999 Refraction Lines
800
700 I
(
600
o ~ ~ 500 orshyI MDA-TCl ~ 400
1 c o Z
300
N
200
I
1I M 100 l2 s
C)
i
Line 5
GPR Lines ~
middot-middot middot--middotMmiddot-hftmiddot-A_
U M ~ ~
100 200 300 400 500 600 700 800 900 1000 1100 Easting ~ 1632500
if
SAGE 1999 Refraction Lines
800
700
600
Line 5 Magneometer Survey Grid0
~ 500 ~ f-
f- -rshy
I
MDA-TC) shy5400 r 1 0 Z
300 f-
N
- ti C ntral Olsposal Site i f-1f ~ ~1
I lt bull I 200 f- East~ its
I ocent 100 f J 0)
u 100 200 300 400 500 600 700 800 900 1000 1100
Easting - 1632500
Figure 5
In 1S74 em em 2 12 22 32
T II B 0 8~8
28 1amp II A 10 y
2amp 0
3amp E69T p R A BB amp TH U E 188 Samp)t l
68 T
_ bullUr---------------------------ii_114~
I
6OOO1L-__---____---__---___---shy
B05 80 815 Il12O 82S 830
2 12 22 32 42
10 196middot
l l~ )01) bullbull )00
0
middotZO o
30 E p
T18 H
50 11
68
18
10 241 ~OO
6000[shy
4000
12ooo~
o
middot2000
~ooot I
middot---l Figure 6
I I I
I I
~ r-middotI
J
~
T U 0
U 11 Y
T R 11 88 I)
E lOO l
120 T 1 14R
t__~~
~
I
i I bull I I
I I i I I~ I l
---------------__shy - -
Plottint Of 41- t~ Line 0 ark -0 to 11 0 rk 1
Figure 7
Ew
to24~~IL1----------------------------------------------------------------------102641 000
Plottl of 141e fro LhM 1 rk S to 11 1 Mrk -1 15bullbull12
(
E
HI 40 t~middot~~---------------------------------- tonntoo
Figure 8
Magnetic Profiles of Ohmmappertrade Lines
Line 0 1l1000
14000
12000
10000
eooo
CIIOOO
4000
2000
0
20()0
-4000 700 1150 7SO lOCI
12000
10000
eooo
2000
o
IISO 100 8SO 1000 1DSO 1100
Line 1
~ 700 750 IlOO IISO 100 8SO 1000 1DSO 1100
----- shy--~
Figure 9 0
(
I~I I
( l~l
I I
lOOOj I ~
~
I
~
100CI
laquo100 940 lin 950
l lZ 22 3Z 12
I J n
00 u bull 111 n
SOt I
I R n I [
l
tl 0 0 Et 30 p
60
~
ti V ~
Figure 10
(lA 0 f1-~er1
80000 19500 17500 15500 13500
11500 9500 7500 5500 3500 1500 -500 -2500 -4500 -6500 -8500 -10500 -12500 -14500 -16500 -18500 -100000
Plot of mdaagem1-15210 Hz In-phase
DP Site Une 8 60
Figure 11 II) 40E
lt -CD ~ E1= 20
0 150
Range (ft)
0
20 c-~40 CD
deg60
80
250 1
(
200~ I
I
150L
100
50
0
I
-50~ I Ii
-100 L 805
40 1100 o 41 3200+ 42
~ 43 Velocity (Ills) o 44
I I
i I
~ i I I I
~ I
1 I
I I
I i i i i
-l I I I I
810
815
820 ~--
825 _1 ____
830 835 840 845 -- 850

I
6OOO1L-__---____---__---___---shy
B05 80 815 Il12O 82S 830
2 12 22 32 42
10 196middot
l l~ )01) bullbull )00
0
middotZO o
30 E p
T18 H
50 11
68
18
10 241 ~OO
6000[shy
4000
12ooo~
o
middot2000
~ooot I
middot---l Figure 6
I I I
I I
~ r-middotI
J
~
T U 0
U 11 Y
T R 11 88 I)
E lOO l
120 T 1 14R
t__~~
~
I
i I bull I I
I I i I I~ I l
---------------__shy - -
Plottint Of 41- t~ Line 0 ark -0 to 11 0 rk 1
Figure 7
Ew
to24~~IL1----------------------------------------------------------------------102641 000
Plottl of 141e fro LhM 1 rk S to 11 1 Mrk -1 15bullbull12
(
E
HI 40 t~middot~~---------------------------------- tonntoo
Figure 8
Magnetic Profiles of Ohmmappertrade Lines
Line 0 1l1000
14000
12000
10000
eooo
CIIOOO
4000
2000
0
20()0
-4000 700 1150 7SO lOCI
12000
10000
eooo
2000
o
IISO 100 8SO 1000 1DSO 1100
Line 1
~ 700 750 IlOO IISO 100 8SO 1000 1DSO 1100
----- shy--~
Figure 9 0
(
I~I I
( l~l
I I
lOOOj I ~
~
I
~
100CI
laquo100 940 lin 950
l lZ 22 3Z 12
I J n
00 u bull 111 n
SOt I
I R n I [
l
tl 0 0 Et 30 p
60
~
ti V ~
Figure 10
(lA 0 f1-~er1
80000 19500 17500 15500 13500
11500 9500 7500 5500 3500 1500 -500 -2500 -4500 -6500 -8500 -10500 -12500 -14500 -16500 -18500 -100000
Plot of mdaagem1-15210 Hz In-phase
DP Site Une 8 60
Figure 11 II) 40E
lt -CD ~ E1= 20
0 150
Range (ft)
0
20 c-~40 CD
deg60
80
250 1
(
200~ I
I
150L
100
50
0
I
-50~ I Ii
-100 L 805
40 1100 o 41 3200+ 42
~ 43 Velocity (Ills) o 44
I I
i I
~ i I I I
~ I
1 I
I I
I i i i i
-l I I I I
810
815
820 ~--
825 _1 ____
830 835 840 845 -- 850
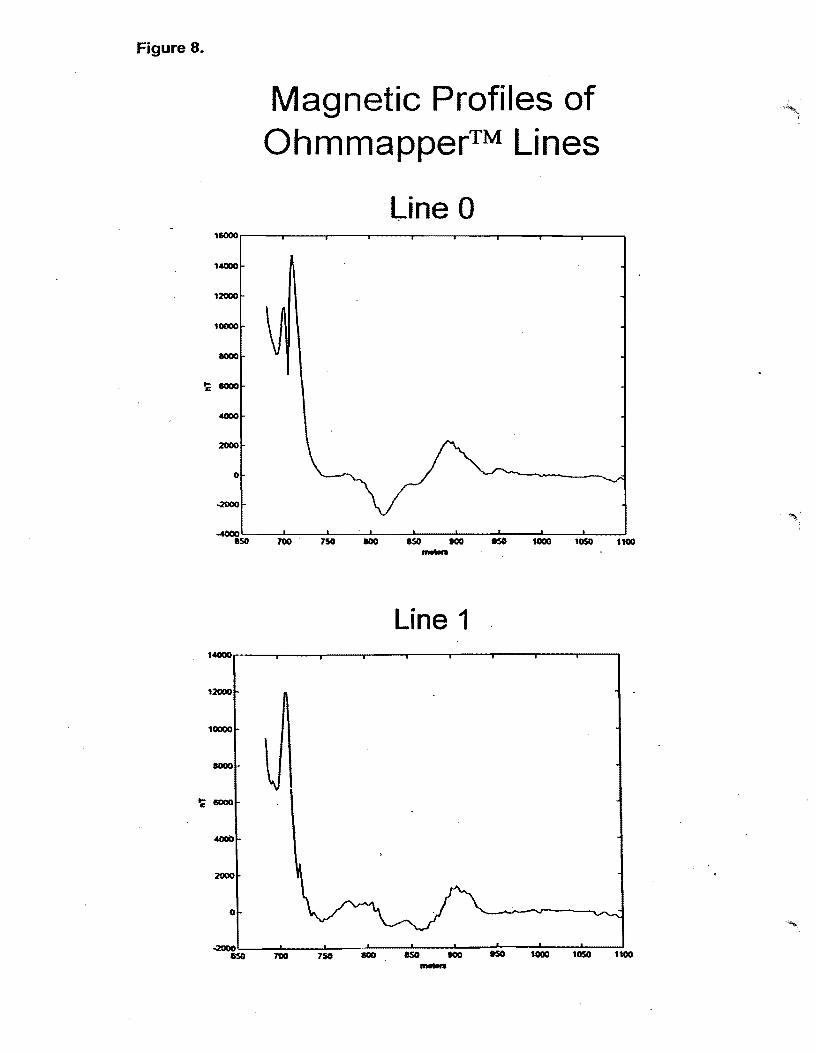

DP Site Une 8 60
Figure 11 II) 40E
lt -CD ~ E1= 20
0 150
Range (ft)
0
20 c-~40 CD
deg60
80
250 1
(
200~ I
I
150L
100
50
0
I
-50~ I Ii
-100 L 805
40 1100 o 41 3200+ 42
~ 43 Velocity (Ills) o 44
I I
i I
~ i I I I
~ I
1 I
I I
I i i i i
-l I I I I
810
815
820 ~--
825 _1 ____
830 835 840 845 -- 850