Los Tretos Street Speed Study - City of Albuquerque Tretos Street Speed Study Final Report City of...
48
LOS TRETOS STREET SPEED STUDY
Transcript of Los Tretos Street Speed Study - City of Albuquerque Tretos Street Speed Study Final Report City of...

LOS TRETOS STREET SPEED STUDY


Los Tretos Street Speed Study
Final Report City of Albuquerque – Department of Municipal Development
Page | i
Table of Contents
INTRODUCTION ..................................................................................................................................................................... 1
1.A. PROJECT PURPOSE ...................................................................................................................................................... 1
1.B. PROJECT DESCRIPTION ............................................................................................................................................... 1
1.C. BACKGROUND OF SPEED LIMITS ................................................................................................................................ 3
1.D. SETTING SPEED LIMITS ................................................................................................................................................ 3
2. EXISTING CONDITIONS .................................................................................................................................................... 5
2.A. COUNT LOCATIONS ....................................................................................................................................................... 5
2.B. EXISTING CONDITIONS ................................................................................................................................................. 5
3. DATA ................................................................................................................................................................................... 7
3.A. ADT .................................................................................................................................................................................. 7
3.B. PEAK HOUR TRAFFIC VOLUMES .................................................................................................................................. 7
3.C. SPEED STUDY RESULTS .............................................................................................................................................. 8
3.D. CRASH DATA .................................................................................................................................................................. 9
4. U.S. LIMITS SPEED LIMITS PROGRAM .......................................................................................................................... 10
5. CONCLUSION ................................................................................................................................................................... 11
Appendices ............................................................................................................................................................................ 12

Los Tretos Street Speed Study
Final Report City of Albuquerque – Department of Municipal Development
Page | ii
List of Tables
Table 3.A.1. Los Tretos Street ADT ..................................................................................................................................... 7
Table 3.B.1. Los Tretos Street Peak Hour Traffic Volumes (vph) ........................................................................................ 7
Table 3.C.1. Los Tretos Street North Speed Study .............................................................................................................. 8
Table 3.C.2. Los Tretos Street South Speed Study ........................................................................................................................ 8
Table 3.C.3. Los Tretos Street ADT ≥ 25 mph ................................................................................................................................ 8
Table 3.D.1. Los Tretos Street Crash Summary ............................................................................................................................. 9
Table 5.1. COA NMTP Traffic Calming Measures ..................................................................................................................... 11

Los Tretos Street Speed Study
Final Report City of Albuquerque – Department of Municipal Development
Page | iii
List of Figures FIGURE 1.B.1. STUDY LOCATION ..................................................................................................................................... 1
FIGURE 1.B.2. STUDY LIMITS ............................................................................................................................................ 2
FIGURE 2.1. COUNT LOCATIONS ................................................................................................................................... 6
FIGURE 2.2. EXISTING LOS TRETOS STREET TYPICAL SECTION ............................................................................. 6
Los Tretos Street Speed Study
Final Report City of Albuquerque – Department of Municipal Development
Page | 1
INTRODUCTION The City of Albuquerque – Department of Municipal Development (Traffic Engineering Design Division) has requested
that Souder, Miller & Associates conduct at speed study along Los Tretos Street in northwest Albuquerque.
1.A. PROJECT PURPOSE A speed study on Los Tretos Street from the end of the cul-de-sac to Ladera Drive was conducted to determine the
following:
Evaluate the 85th percentile speed along Los Tretos Street at two (2) locations; Calculate average and daily peak hour traffic volumes along Los Tretos Street.
As part of this study, an evaluation and cataloging of existing roadway conditions, collection of historical ADT, and
crash data will be completed.
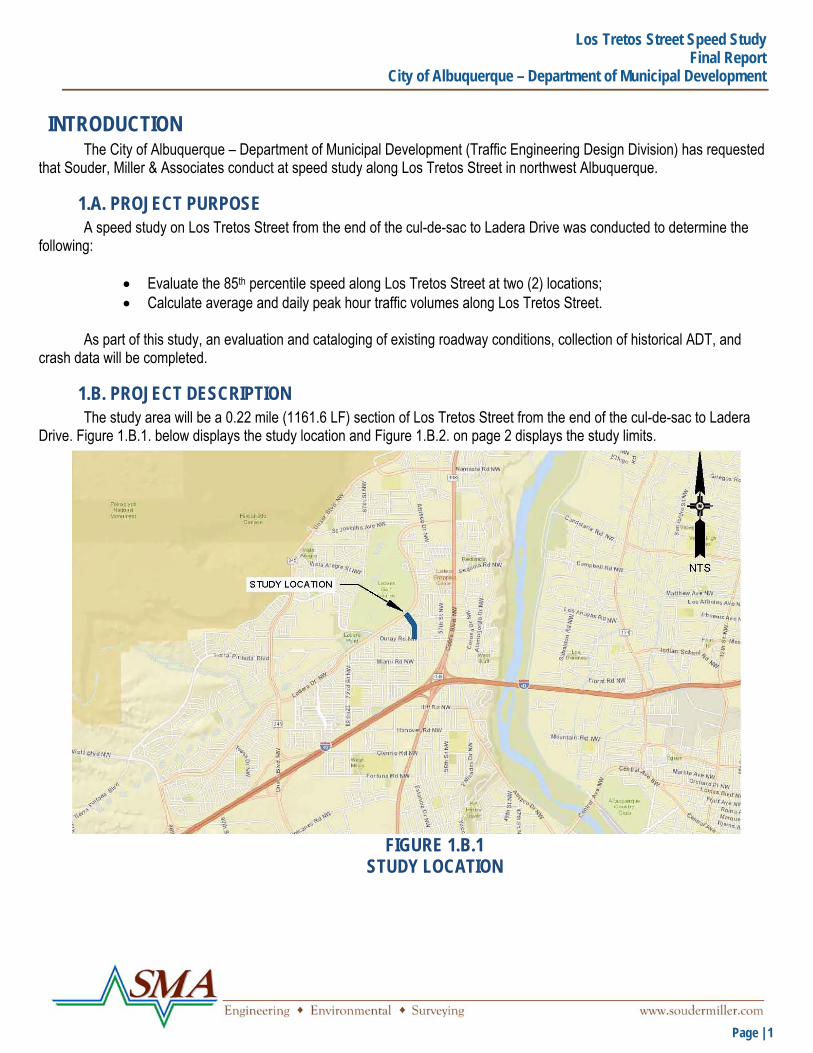
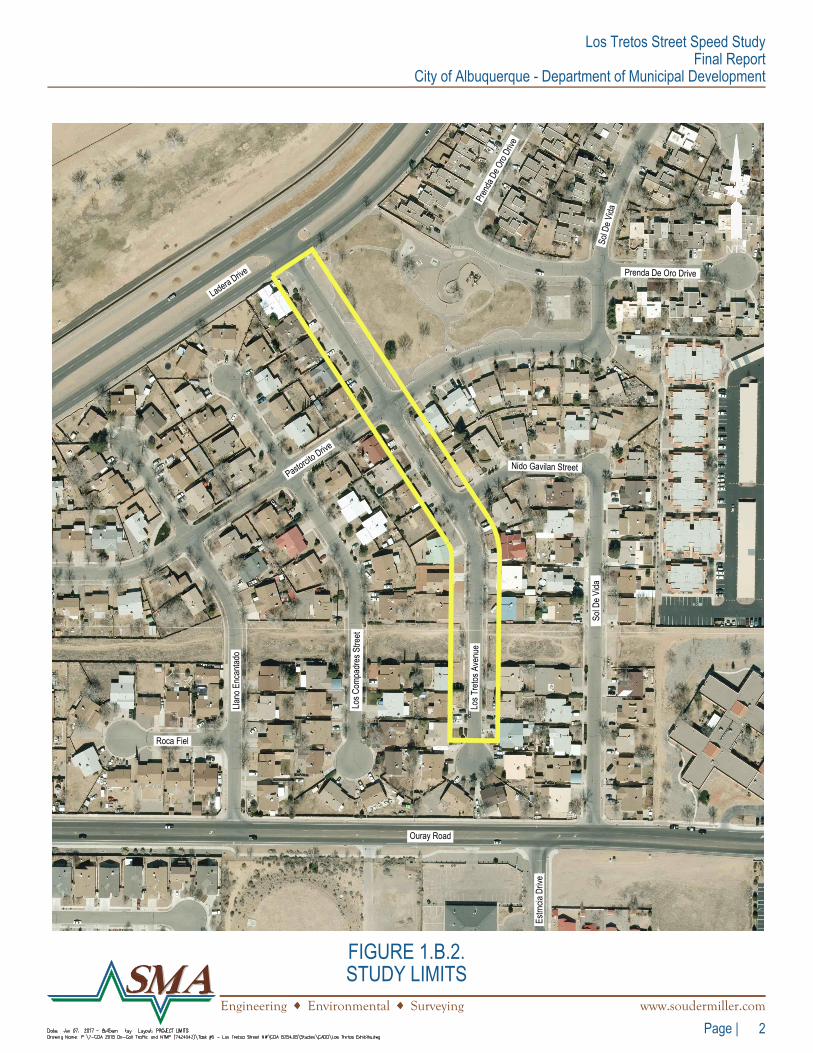
1.B. PROJECT DESCRIPTION The study area will be a 0.22 mile (1161.6 LF) section of Los Tretos Street from the end of the cul-de-sac to Ladera
Drive. Figure 1.B.1. below displays the study location and Figure 1.B.2. on page 2 displays the study limits.
FIGURE 1.B.1 STUDY LOCATION
Page | www.soudermiller.comEngineering Environmental Surveying
FIGURE 1.B.2.STUDY LIMITS
Los Tretos Street Speed StudyFinal Report
City of Albuquerque - Department of Municipal Development
2
NTS
Ouray Road
Prenda De Oro Drive
Los C
ompa
dres
Stre
et
Estrn
cia D
rive
Los T
retos
Ave
nue
Sol D
e Vida
Ladera Drive
Llano
Enc
antad
o
Pastorcito Drive
Sol D
e Vida
Pren
da D
e Oro
Drive
Roca Fiel
Nido Gavilan Street

Los Tretos Street Speed Study
Final Report City of Albuquerque – Department of Municipal Development
Page | 3
1.C. BACKGROUND OF SPEED LIMITS Speed limits are established on roadways of virtually all classifications, from interstate freeways to low volume local
streets. The primary purpose of speed limits is to give motorists clear instruction as to what is a reasonable speed for them to drive at while traveling on a given roadway.
Among regulatory signage, speed limit signs arguably contain the most critical information that motorists need to be
informed of while driving (next to stop signs, which are considered the highest impact regulatory sign). Drivers unfamiliar with a roadway often do not realize what characteristics the roadway has, and properly established speed limit signs give them the information they need to drive the roadway safely.
The NMDOT has guidelines for analyzing and establishing posted speed limits; the following text is based on one such
example:
Realistic posted speed limits are of public importance for many reasons:
They invite public compliance by conforming to the behavior or the driving majority They give clear reminders of safe and reasonable speeds to non-conforming violators They offer the most effective tool for law enforcement of safe driving They will minimize public antagonism toward law enforcement that results from unreasonable regulations
Improperly, or artificially low, posted speed limits can cause problems for state and local agencies for several reasons:
They do not encourage voluntary compliance, since they do not reflect the behavior of the majority They make the behavior of the majority unlawful The maximize public antagonism toward law enforcement, since the perception is that the police are
enforcing a “speed trap” The create a bad image for a community in the eyes of tourists / visitors
1.D. SETTING SPEED LIMITS In accordance with Section 66-7-303 of the New Mexico Criminal and Traffic Law Manual, the speed limit on state
highways shall be set by the Cabinet Secretary of the Department of Transportation, based on an engineering survey and traffic investigation that includes the following parameters.
Spot speed studies (typically consisting of 100 vehicles) Roadway geometry/number of lanes Roadside environment and characteristics Building setbacks (if within a commercial business district) Driveway and intersection spacing/density Historical crash data for the roadway study area
Many speed limits are established using the theory of 85th percentile. Out of the (typically) 100 vehicles surveyed,
beginning with the fasted vehicle speed recorded the 15th vehicle from that speed is determined to show where the 85th percentile speed is. This is assuming that most drivers (85%) drive within reasonable limits. The posted speed limit can be established and is usually the 5 – mph increment just below the 85th percentile speed. For example, if the 85th percentile speed
Los Tretos Street Speed Study
Final Report City of Albuquerque – Department of Municipal Development
Page | 4
has been determined by an engineering survey to be 57 mph, the posted speed would be 55 mph. This method of posting speed limits allows for a reasonable posted speed limit that can be enforced by local agencies, without creating a speed trap.
For surveys with a different amount than 100 vehicles, the 85th percentile speed is determined by the following formula:
100/15 = # of vehicles surveyed/X (where x = the vehicle at the 85th percentile). For example, a 50 vehicle survey would result in:
10015
50
Where x = 7.5, or the 8th vehicle in the survey
Other methods are frequently used to further analyze the posting of speed limits – these are the mode, median, and geometric mean:
Mode is the most frequently clocked vehicle speed in a given survey. For example, in a 100 vehicle survey
where 12 vehicles were clocked traveling 55 mph and no other speed was observed as frequently, the mode is 55 mph.
Median is the numerical midpoint of a given survey. For example, in a survey of 100 vehicles, the speeds of the 50th and 51st vehicles are added and divided by 2 to obtain the median speed. If the 50th vehicle of such a survey was traveling at 56 mph and the 51st vehicle was also traveling at 56 mph, the resulting median would be (56 + 56)÷2 = 112÷2 = 56 mph
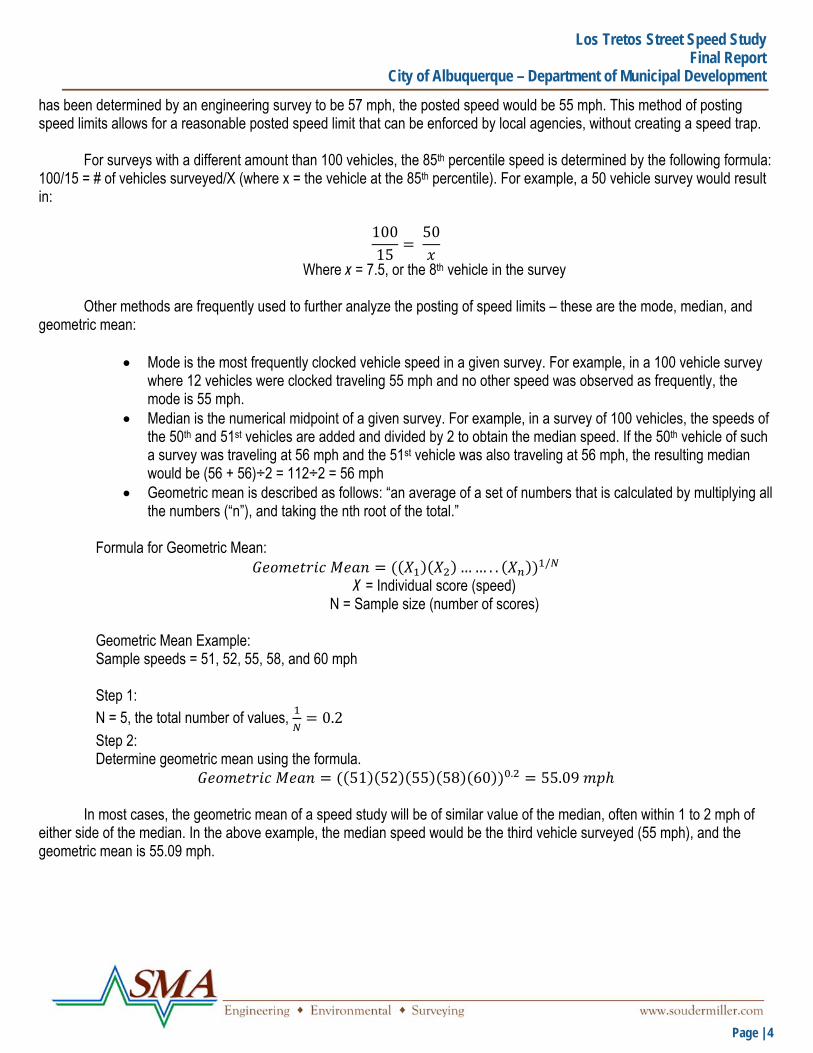
Geometric mean is described as follows: “an average of a set of numbers that is calculated by multiplying all the numbers (“n”), and taking the nth root of the total.”
Formula for Geometric Mean:
…… . . / X = Individual score (speed)
N = Sample size (number of scores) Geometric Mean Example: Sample speeds = 51, 52, 55, 58, and 60 mph Step 1: N = 5, the total number of values, 0.2
Step 2: Determine geometric mean using the formula.
51 52 55 58 60 . 55.09
In most cases, the geometric mean of a speed study will be of similar value of the median, often within 1 to 2 mph of either side of the median. In the above example, the median speed would be the third vehicle surveyed (55 mph), and the geometric mean is 55.09 mph.

Los Tretos Street Speed Study
Final Report City of Albuquerque – Department of Municipal Development
Page | 5
2. EXISTING CONDITIONS
2.A. COUNT LOCATIONS The study area included two (2) volume and speed count locations which were at the following locations:
Los Tretos Street between Pastorcito Drive and Ladera Drive; Los Tretos Street between the end of cul-de-sac and Pastorcito Drive.
Figure 2.1. on page 6 displays the approximate traffic count locations.
2.B. EXISTING CONDITIONS Figure 2.2. on page 6 displays the existing typical section of Los Tretos Street. Within the study limits, there are 2
intersections and approximately 21 driveways that provide access to homes and a park is located at the end of the study limits.

Page | www.soudermiller.comEngineering Environmental Surveying
FIGURE 2.2.EXISTING LOS TRETOS STREET TYPICAL SECTION
Los Tretos Street Speed StudyFinal Report
City of Albuquerque - Department of Municipal Development
6
~6'BUFFER
~2.25'GUTTER
~26'ASPHALT PAVEMENT
~2.25'GUTTER
~6'BUFFER
FIGURE 2.1.COUNT LOCATIONS
NTS
~COUNT LOCATION 1 -
Los Tretos Street North
Los C
ompa
dres
Stre
et
Los t
retos
Stre
et
Sol D
e Vida
Pastorcito Drive
Ladera Drive
Ouray Road
~COUNT LOCATION 2 -
Los Tretos Street South
~4'SIDE-WALK
~4'SIDE-WALK

Los Tretos Street Speed Study
Final Report City of Albuquerque – Department of Municipal Development
Page | 7
3. DATA
3.A. ADT The ADT for the two (2) count locations are listed below in Table 3.A.1.
Table 3.A.1.
Los Tretos Street ADT Count Location NB SB ADT
Los Tretos Street North 209 177 386 Los Tretos Street South 175 117 292
Average 192 147 339 .
The Los Tretos Street study area ADT directional ranges from 117 to 209 vehicles per day.
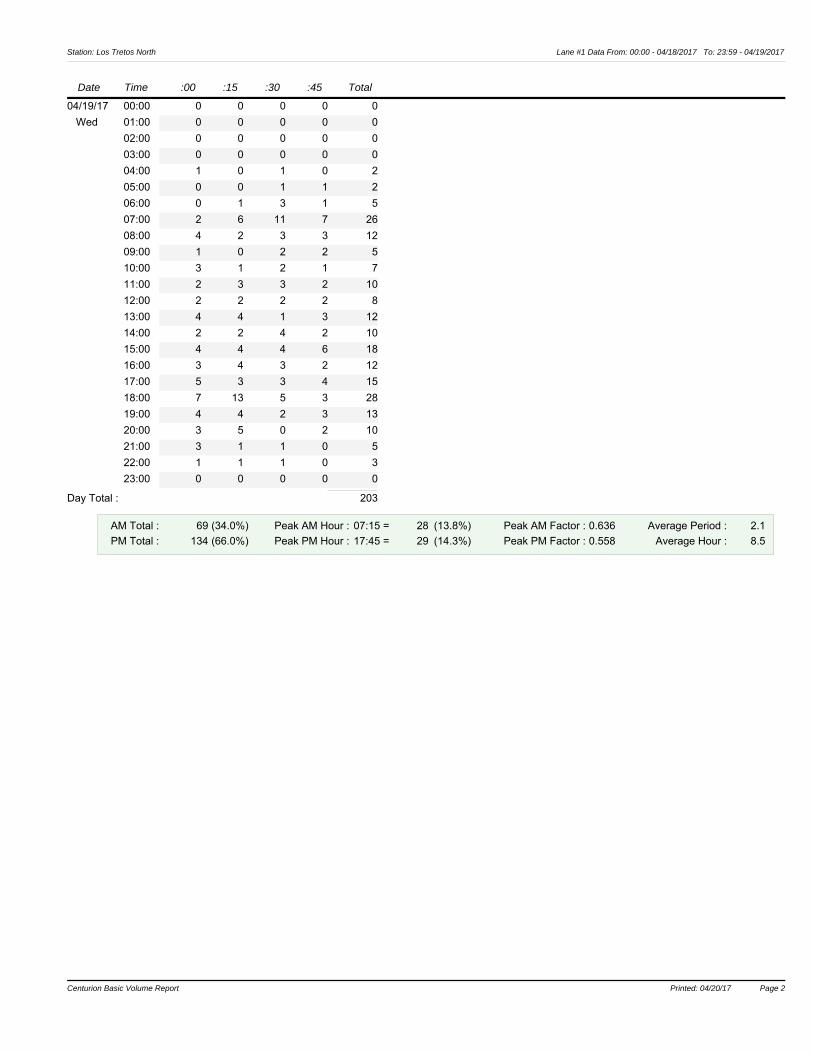
3.B. PEAK HOUR TRAFFIC VOLUMES The peak hour traffic volumes for the two (2) count locations are shown below in Table 3.B.1.
Table 3.B.1. Los Tretos Street Peak Hour Traffic Volumes (vph)
Count Location Peak Hour Northbound (Peak Hour) Southbound (Peak Hour)
Los Tretos Street North AM Peak 35 (7:30 AM - 8:30 AM) 15 (8:00 AM - 9:00 AM) PM Peak 29 (5:45 PM - 6:45 PM) 22 (5:00 PM - 6:00 PM)
Los Tretos Street South AM Peak 27 (7:00 AM - 8:00 AM) 14 (8:30 AM - 9:30 AM) PM Peak 24 (6:15 PM - 7:15 PM ) 14 (12:45 PM - 1:45 PM )
The Los Tretos Street study area peak hour traffic volumes range from 14 to 35 vehicles per hour.
Los Tretos Street Speed Study
Final Report City of Albuquerque – Department of Municipal Development
Page | 8
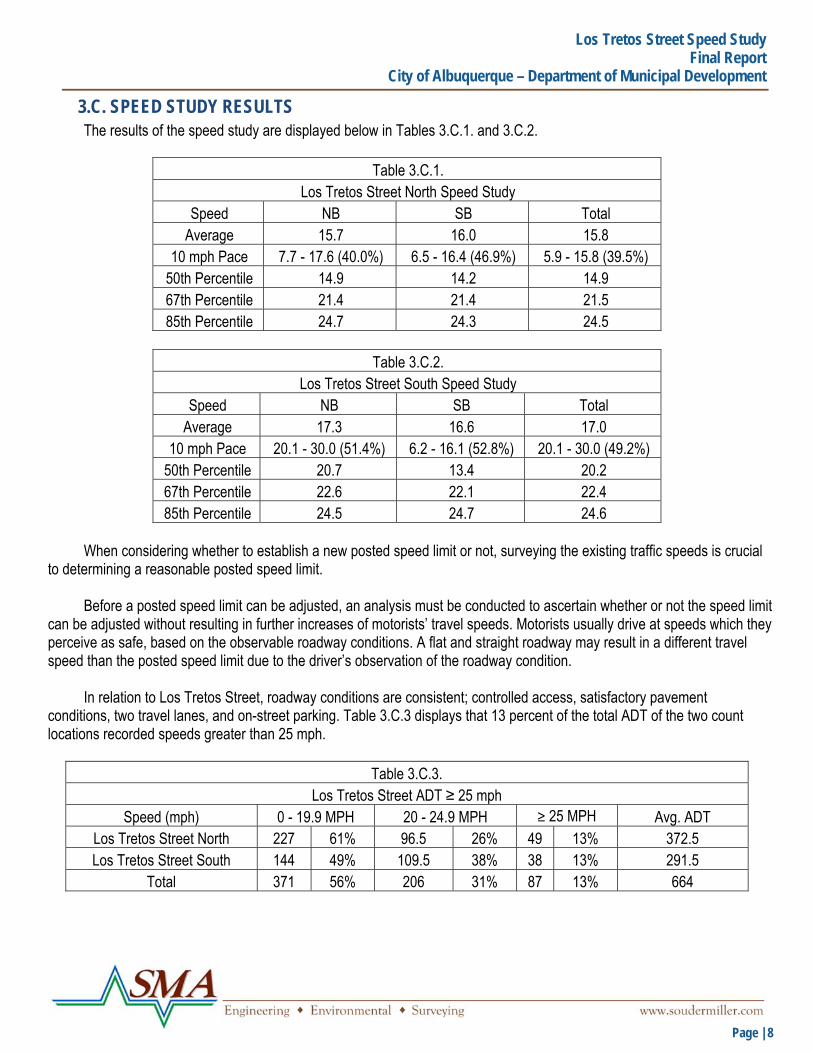
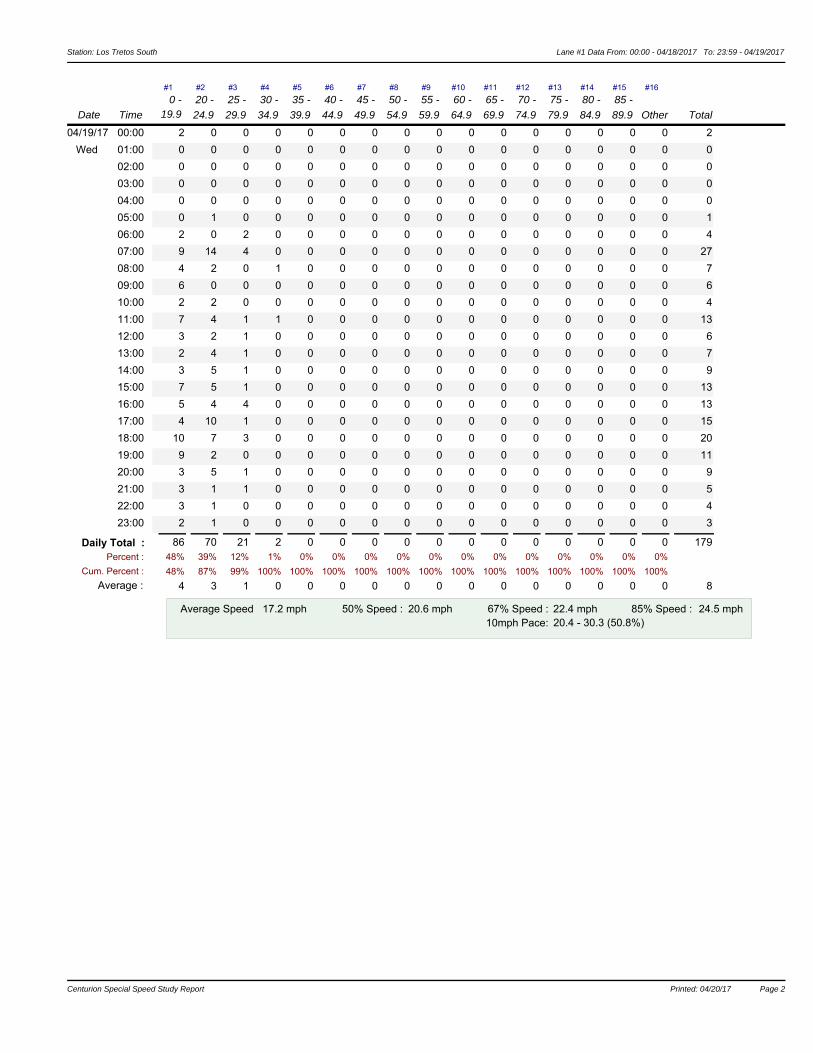
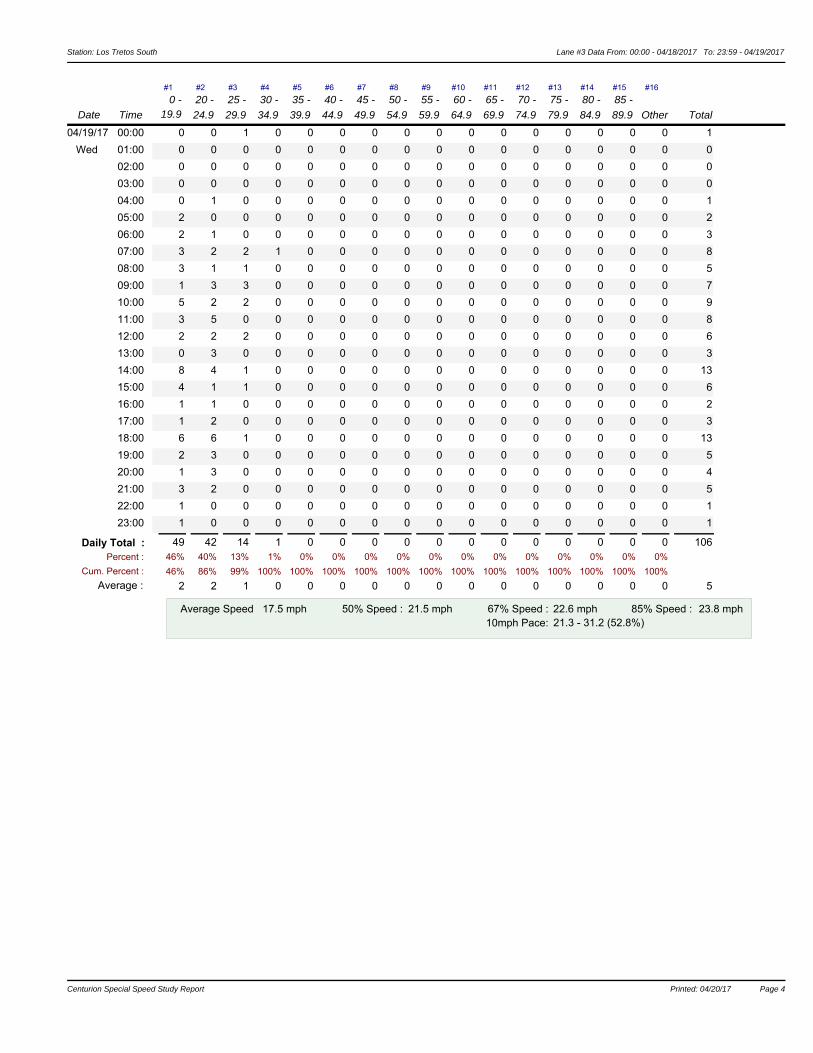
3.C. SPEED STUDY RESULTS The results of the speed study are displayed below in Tables 3.C.1. and 3.C.2.
Table 3.C.1.
Los Tretos Street North Speed Study Speed NB SB Total
Average 15.7 16.0 15.8 10 mph Pace 7.7 - 17.6 (40.0%) 6.5 - 16.4 (46.9%) 5.9 - 15.8 (39.5%)
50th Percentile 14.9 14.2 14.9 67th Percentile 21.4 21.4 21.5 85th Percentile 24.7 24.3 24.5
Table 3.C.2.
Los Tretos Street South Speed Study Speed NB SB Total
Average 17.3 16.6 17.0 10 mph Pace 20.1 - 30.0 (51.4%) 6.2 - 16.1 (52.8%) 20.1 - 30.0 (49.2%)
50th Percentile 20.7 13.4 20.2 67th Percentile 22.6 22.1 22.4 85th Percentile 24.5 24.7 24.6
When considering whether to establish a new posted speed limit or not, surveying the existing traffic speeds is crucial
to determining a reasonable posted speed limit.
Before a posted speed limit can be adjusted, an analysis must be conducted to ascertain whether or not the speed limit can be adjusted without resulting in further increases of motorists’ travel speeds. Motorists usually drive at speeds which they perceive as safe, based on the observable roadway conditions. A flat and straight roadway may result in a different travel speed than the posted speed limit due to the driver’s observation of the roadway condition.
In relation to Los Tretos Street, roadway conditions are consistent; controlled access, satisfactory pavement
conditions, two travel lanes, and on-street parking. Table 3.C.3 displays that 13 percent of the total ADT of the two count locations recorded speeds greater than 25 mph.
Table 3.C.3.
Los Tretos Street ADT ≥ 25 mph Speed (mph) 0 - 19.9 MPH 20 - 24.9 MPH ≥ 25 MPH Avg. ADT
Los Tretos Street North 227 61% 96.5 26% 49 13% 372.5 Los Tretos Street South 144 49% 109.5 38% 38 13% 291.5
Total 371 56% 206 31% 87 13% 664
Los Tretos Street Speed Study
Final Report City of Albuquerque – Department of Municipal Development
Page | 9
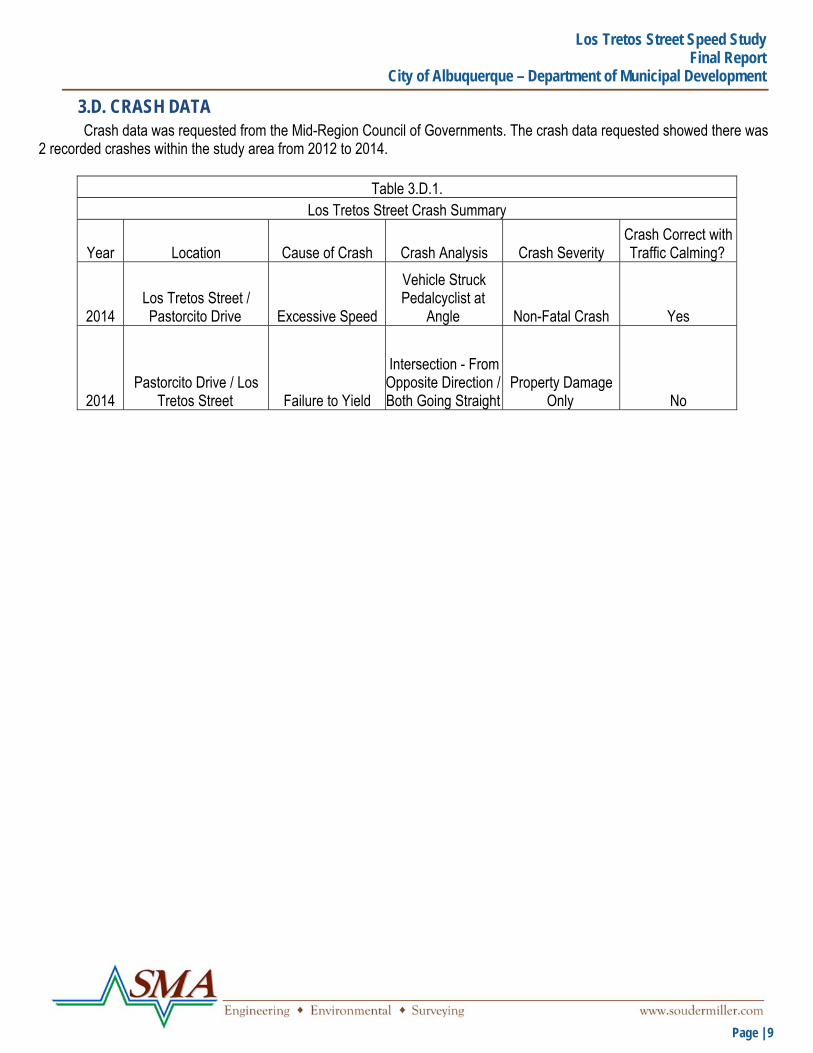
3.D. CRASH DATA Crash data was requested from the Mid-Region Council of Governments. The crash data requested showed there was
2 recorded crashes within the study area from 2012 to 2014.
Table 3.D.1. Los Tretos Street Crash Summary
Year Location Cause of Crash Crash Analysis Crash Severity Crash Correct with Traffic Calming?
2014 Los Tretos Street / Pastorcito Drive Excessive Speed
Vehicle Struck Pedalcyclist at
Angle Non-Fatal Crash Yes
2014 Pastorcito Drive / Los
Tretos Street Failure to Yield
Intersection - From Opposite Direction / Both Going Straight
Property Damage Only No

Los Tretos Street Speed Study
Final Report City of Albuquerque – Department of Municipal Development
Page | 10
4. U.S. LIMITS SPEED LIMITS PROGRAM U.S. Limits is an FHWA sponsored program used to analyze speed limits. This program calculates a recommended
speed limit based on the criteria given, which is listed on the website as follows:
Density of surrounding development (e.g. high density, low density, or rural); Frequency of roadside access (e.g. number of residential driveways, commercial, industrial, shopping, and
special activity properties, and the number and type of intersection roads); Road function (e.g. traffic movement vs. access to abutting properties); Road characteristics (e.g. paved width, divided or undivided, lane width, number and lanes, and sight
restrictions); Road conditions and important high speed road characteristics (e.g. interchange spacing, AADT, and
shoulders); Existing vehicle operating speeds; Adjoining speed limits: and Any special conditions that may exist on the road section (e.g. adverse alignment, pedestrian and roadside
activities, high crash rates, etc.)
This analysis was used for Los Tretos Street and based on the data entered into http://www.uslimits.com for the above-listed categories. The output sheet is shown in Appendix A – U.S. Limits Output. The U.S. Limits Output recommended a speed limit of 20 mph.

Los Tretos Street Speed Study
Final Report City of Albuquerque – Department of Municipal Development
Page | 11
5. CONCLUSION After evaluating the volume and speed data within the project area, it is concluded that 13% of traffic is exceeding 25
mph and the 85th percentile for both the northbound and southbound at the north count location does not exceed the speed limit by 5 mph or more. In order to meet criteria for traffic calming measures as outlined in the City of Albuquerque’s Neighborhood Traffic Management Program, at least two (2) of the following threshold criteria must be met:
Figure 5.1.
COA NMTP Traffic Calming Measures Description Warranted?
Reported crashes in the past 3 years that could be corrected with traffic calming Yes Peak-hour traffic volume greater than 400 vehicles in one direction No
25% of peak-hour traffic is non-local cut-through traffic Not Studied 85th percentile speeds exceeds the posted speed limit by 5 mph or more No
Based on the data collected, Los Tretos Street meets only 1 of the 4 warrants and therefore DOES NOT meet the
minimum COA NTMP traffic calming measures threshold.

Los Tretos Street Speed Study
Final Report City of Albuquerque – Department of Municipal Development
Page | 12
Appendices • Appendix A – USLIMITS2 Speed Zoning Report • Appendix B – Volume and Speed Data • Appendix C – Crash Data

Los Tretos Street Speed Study
Final Report City of Albuquerque – Department of Municipal Development
Page | A 1
Appendix A


Los Tretos Street Speed Study
Final Report City of Albuquerque – Department of Municipal Development
Page | B 1
Appendix B

Special Speed Study Report: Los Tretos North
Station ID : Los Tretos NorthInfo Line 1 : North of PastorcitoInfo Line 2 : Albuquerque
DB File : L T NO PAST.DBNumber of Lanes :
0.0 mph1
Posted Speed Limit :
1.66ApolloLast Connected Device Type :
Version Number :Serial Number :
GPS Lat/Lon :
Lane #1 Configuration
# Dir. Vehicle SensorsInformation Sensor Spacing Loop Length Comment
1. Northbound Ax-Ax 4.0 ft 6.0 ft
Lane #1 Special Speed Study Data From: 00:00 - 04/18/2017 To: 23:59 - 04/19/2017
Date Time
#1 #2 #3 #5#4 #7#6 #8 #9 #10 #11 #12 #13 #16#15#14
Total
0 - 19.9
20 -
24.9
25 -
29.9
30 -
34.9
35 -
39.9
40 -
44.9
45 -
49.9
50 - 55 - 60 - 65 - 70 - 75 -
54.9 59.9 64.9 69.9 74.9 79.9 Other89.9
85 -
84.9
80 -
04/18/17 00:00 0 0 0 0 0 0 0 0 0 0 0 0 0 0 0 0 0
Tue 01:00 0 0 0 0 0 0 0 0 0 0 0 0 0 0 0 0 0
02:00 0 0 0 0 0 0 0 0 0 0 0 0 0 0 0 0 0
03:00 2 0 0 0 0 0 0 0 0 0 0 0 0 0 0 0 2
04:00 2 0 1 0 0 0 0 0 0 0 0 0 0 0 0 0 3
05:00 0 1 0 0 0 0 0 0 0 0 0 0 0 0 0 0 1
06:00 5 3 1 0 0 0 0 0 0 0 0 0 0 0 0 0 9
07:00 19 7 5 2 0 0 0 0 0 0 0 0 0 0 0 0 33
08:00 7 1 1 2 0 0 0 0 0 0 0 0 0 0 0 0 11
09:00 4 4 1 1 0 0 0 0 0 0 0 0 0 0 0 0 10
10:00 7 1 2 0 0 0 0 0 0 0 0 0 0 0 0 0 10
11:00 9 1 1 0 0 0 0 0 0 0 0 0 0 0 0 0 11
12:00 6 2 1 0 0 0 0 0 0 0 0 0 0 0 0 0 9
13:00 8 1 1 0 0 0 0 0 0 0 0 0 0 0 0 0 10
14:00 9 0 0 0 0 0 0 0 0 0 0 0 0 0 0 0 9
15:00 12 2 0 0 0 0 0 0 0 0 0 0 0 0 0 0 14
16:00 11 4 1 0 0 0 0 0 0 0 0 0 0 0 0 0 16
17:00 14 2 2 0 0 0 0 0 0 1 0 0 0 0 0 0 19
18:00 7 5 2 0 0 0 0 0 0 0 0 0 0 0 0 0 14
19:00 6 4 0 0 0 0 0 0 0 0 0 0 0 0 0 0 10
20:00 3 2 1 0 0 0 0 0 0 0 0 0 0 0 0 0 6
21:00 3 2 0 0 0 0 0 0 0 0 0 0 0 0 0 0 5
22:00 3 3 0 0 0 0 0 0 0 0 0 0 0 0 0 0 6
23:00 1 0 0 0 0 0 0 0 0 0 0 0 0 0 0 0 1
Daily Total : 0 0 0 0 0 1 0 0 0 0 0 0 209138 45 20 566% 22% 10% 2% 0% 0% 0% 0% 0% 0% 0% 0% 0% 0% 0% 0% Percent :
Cum. Percent :
Average :66% 88% 97% 100% 100% 100% 100% 100% 100% 100% 100% 100% 100% 100% 100% 100%
6 2 1 0 0 0 0 0 0 0 0 0 0 0 0 0 9
Average Speed 50% Speed : 67% Speed : 85% Speed : 15.2 mph 12.2 mph 21.3 mph 23.5 mph10mph Pace: 5.8 - 15.7 (66.0%)
Centurion Special Speed Study Report Printed: 04/20/17 Page 1Centurion Special Speed Study Report Printed: 04/20/17 Page 1

Station: Los Tretos North Lane #1 Data From: 00:00 - 04/18/2017 To: 23:59 - 04/19/2017
Date Time
#1 #2 #3 #5#4 #7#6 #8 #9 #10 #11 #12 #13 #16#15#14
Total
0 - 19.9
20 -
24.9
25 -
29.9
30 -
34.9
35 -
39.9
40 -
44.9
45 -
49.9
50 - 55 - 60 - 65 - 70 - 75 -
54.9 59.9 64.9 69.9 74.9 79.9 Other89.9
85 -
84.9
80 -
04/19/17 00:00 0 0 0 0 0 0 0 0 0 0 0 0 0 0 0 0 0
Wed 01:00 0 0 0 0 0 0 0 0 0 0 0 0 0 0 0 0 0
02:00 0 0 0 0 0 0 0 0 0 0 0 0 0 0 0 0 0
03:00 0 0 0 0 0 0 0 0 0 0 0 0 0 0 0 0 0
04:00 1 1 0 0 0 0 0 0 0 0 0 0 0 0 0 0 2
05:00 1 0 1 0 0 0 0 0 0 0 0 0 0 0 0 0 2
06:00 3 0 1 1 0 0 0 0 0 0 0 0 0 0 0 0 5
07:00 11 8 4 2 0 0 0 0 0 0 0 0 0 0 0 0 25
08:00 9 1 1 1 0 0 0 0 0 0 0 0 0 0 0 0 12
09:00 4 1 0 0 0 0 0 0 0 0 0 0 0 0 0 0 5
10:00 5 1 1 0 0 0 0 0 0 0 0 0 0 0 0 0 7
11:00 6 3 0 1 0 0 0 0 0 0 0 0 0 0 0 0 10
12:00 4 2 2 0 0 0 0 0 0 0 0 0 0 0 0 0 8
13:00 7 3 1 0 0 0 0 0 0 0 0 0 0 0 0 0 11
14:00 5 4 0 1 0 0 0 0 0 0 0 0 0 0 0 0 10
15:00 10 4 2 0 0 0 0 0 0 0 0 0 0 0 0 0 16
16:00 3 4 3 2 0 0 0 0 0 0 0 0 0 0 0 0 12
17:00 8 5 2 0 0 0 0 0 0 0 0 0 0 0 0 0 15
18:00 15 5 2 0 0 0 0 0 0 0 0 0 0 0 0 0 22
19:00 9 4 0 0 0 0 0 0 0 0 0 0 0 0 0 0 13
20:00 5 3 2 0 0 0 0 0 0 0 0 0 0 0 0 0 10
21:00 2 3 0 0 0 0 0 0 0 0 0 0 0 0 0 0 5
22:00 1 1 1 0 0 0 0 0 0 0 0 0 0 0 0 0 3
23:00 0 0 0 0 0 0 0 0 0 0 0 0 0 0 0 0 0
Daily Total : 0 0 0 0 0 0 0 0 0 0 0 0 193109 53 23 856% 27% 12% 4% 0% 0% 0% 0% 0% 0% 0% 0% 0% 0% 0% 0% Percent :
Cum. Percent :
Average :56% 84% 96% 100% 100% 100% 100% 100% 100% 100% 100% 100% 100% 100% 100% 100%
5 2 1 0 0 0 0 0 0 0 0 0 0 0 0 0 8
Average Speed 50% Speed : 67% Speed : 85% Speed : 16.4 mph 12.6 mph 22.1 mph 26.9 mph10mph Pace: 6.6 - 16.5 (56.5%)
Centurion Special Speed Study Report Printed: 04/20/17 Page 2Centurion Special Speed Study Report Printed: 04/20/17 Page 2

Station: Los Tretos North Lane #3 Data From: 00:00 - 04/18/2017 To: 23:59 - 04/19/2017
Lane #3 Configuration
# Dir. Information Vehicle Sensors Sensor Spacing Loop Length Comment
3. Southbound Ax-Ax 4.0 ft 6.0 ft
Lane #3 Special Speed Study Data From: 00:00 - 04/18/2017 To: 23:59 - 04/19/2017
Date Time
#1 #2 #3 #5#4 #7#6 #8 #9 #10 #11 #12 #13 #16#15#14
Total
0 - 19.9
20 -
24.9
25 -
29.9
30 -
34.9
35 -
39.9
40 -
44.9
45 -
49.9
50 - 55 - 60 - 65 - 70 - 75 -
54.9 59.9 64.9 69.9 74.9 79.9 Other89.9
85 -
84.9
80 -
04/18/17 00:00 0 1 0 0 0 0 0 0 0 0 0 0 0 0 0 0 1
Tue 01:00 1 0 0 0 0 0 0 0 0 0 0 0 0 0 0 0 1
02:00 0 1 0 0 0 0 0 0 0 0 0 0 0 0 0 0 1
03:00 1 0 0 0 0 0 0 0 0 0 0 0 0 0 0 0 1
04:00 1 0 0 0 0 0 0 0 0 0 0 0 0 0 0 0 1
05:00 0 0 0 1 0 0 0 0 0 0 0 0 0 0 0 0 1
06:00 3 1 0 1 0 0 0 0 0 0 0 0 0 0 0 0 5
07:00 5 2 0 0 0 0 0 0 0 0 0 0 0 0 0 0 7
08:00 7 3 4 1 0 0 0 0 0 0 0 0 0 0 0 0 15
09:00 4 1 1 0 0 0 0 0 0 0 0 0 0 0 0 0 6
10:00 2 0 1 1 0 0 0 0 0 0 0 0 0 0 0 0 4
11:00 3 1 0 1 0 0 0 0 0 0 0 0 0 0 0 0 5
12:00 9 3 1 1 0 0 0 0 0 0 0 0 0 0 0 0 14
13:00 4 5 1 0 0 0 0 0 0 0 0 0 0 0 0 0 10
14:00 17 2 0 0 0 0 0 0 0 0 0 0 0 0 0 0 19
15:00 8 2 0 0 0 0 0 0 0 0 0 0 0 0 0 0 10
16:00 17 1 0 0 0 0 0 0 0 0 0 0 0 0 0 0 18
17:00 17 4 0 1 0 0 0 0 0 0 0 0 0 0 0 0 22
18:00 7 4 3 1 0 0 0 0 0 0 0 0 0 0 0 0 15
19:00 7 1 0 0 0 0 0 0 0 0 0 0 0 0 0 0 8
20:00 2 1 1 1 0 0 0 1 0 0 0 1 0 0 0 0 7
21:00 6 2 0 0 0 0 0 0 0 0 0 0 0 0 0 0 8
22:00 1 1 0 0 0 0 0 0 0 0 0 0 0 0 0 0 2
23:00 1 3 0 0 0 0 0 0 0 0 0 0 0 0 0 0 4
Daily Total : 0 0 0 1 0 0 0 1 0 0 0 0 185123 39 12 966% 21% 6% 5% 0% 0% 0% 1% 0% 0% 0% 1% 0% 0% 0% 0% Percent :
Cum. Percent :
Average :66% 88% 94% 99% 99% 99% 99% 99% 99% 99% 99% 100% 100% 100% 100% 100%
5 2 1 0 0 0 0 0 0 0 0 0 0 0 0 0 8
Average Speed 50% Speed : 67% Speed : 85% Speed : 15.4 mph 11.9 mph 13.9 mph 23.4 mph10mph Pace: 6.2 - 16.1 (66.5%)
Centurion Special Speed Study Report Printed: 04/20/17 Page 3Centurion Special Speed Study Report Printed: 04/20/17 Page 3

Station: Los Tretos North Lane #3 Data From: 00:00 - 04/18/2017 To: 23:59 - 04/19/2017
Date Time
#1 #2 #3 #5#4 #7#6 #8 #9 #10 #11 #12 #13 #16#15#14
Total
0 - 19.9
20 -
24.9
25 -
29.9
30 -
34.9
35 -
39.9
40 -
44.9
45 -
49.9
50 - 55 - 60 - 65 - 70 - 75 -
54.9 59.9 64.9 69.9 74.9 79.9 Other89.9
85 -
84.9
80 -
04/19/17 00:00 2 0 0 0 1 0 0 0 0 0 0 0 0 0 0 0 3
Wed 01:00 0 0 0 0 0 0 0 0 0 0 0 0 0 0 0 0 0
02:00 0 0 0 0 0 0 0 0 0 0 0 0 0 0 0 0 0
03:00 0 0 0 0 0 0 0 0 0 0 0 0 0 0 0 0 0
04:00 0 1 0 0 0 0 0 0 0 0 0 0 0 0 0 0 1
05:00 0 0 0 0 0 0 0 0 0 0 0 0 0 0 0 0 0
06:00 2 0 0 0 0 0 0 0 0 0 0 0 0 0 0 0 2
07:00 3 2 0 2 0 0 0 0 0 0 0 0 0 0 0 0 7
08:00 3 1 1 0 0 0 0 0 0 0 0 0 0 0 0 0 5
09:00 3 2 2 1 0 0 0 0 0 0 0 0 0 0 0 0 8
10:00 6 4 2 0 0 0 0 0 0 0 0 0 0 0 0 0 12
11:00 3 3 1 0 0 0 0 0 0 0 0 0 0 0 0 0 7
12:00 4 5 2 0 0 0 0 0 0 0 0 0 0 0 0 0 11
13:00 4 3 1 0 0 0 0 0 0 0 0 0 0 0 0 0 8
14:00 7 4 2 0 0 0 1 0 0 0 0 0 0 0 0 0 14
15:00 8 5 1 0 0 0 0 0 0 0 0 0 0 0 0 0 14
16:00 5 3 1 0 0 0 0 0 0 0 0 0 0 0 0 0 9
17:00 8 5 0 0 0 0 0 0 0 0 0 0 0 0 0 0 13
18:00 5 8 0 0 0 0 0 0 0 0 0 0 0 0 0 0 13
19:00 3 5 0 0 0 0 0 0 0 0 0 0 0 0 0 0 8
20:00 10 3 0 0 0 0 0 0 0 0 0 0 0 0 0 0 13
21:00 4 1 0 0 0 0 0 0 0 0 0 0 0 0 0 0 5
22:00 3 0 0 0 0 0 0 0 0 0 0 0 0 0 0 0 3
23:00 1 1 0 0 0 0 0 0 0 0 0 0 0 0 0 0 2
Daily Total : 1 0 1 0 0 0 0 0 0 0 0 0 15884 56 13 353% 35% 8% 2% 1% 0% 1% 0% 0% 0% 0% 0% 0% 0% 0% 0% Percent :
Cum. Percent :
Average :53% 89% 97% 99% 99% 99% 100% 100% 100% 100% 100% 100% 100% 100% 100% 100%
4 2 1 0 0 0 0 0 0 0 0 0 0 0 0 0 7
Average Speed 50% Speed : 67% Speed : 85% Speed : 16.7 mph 12.4 mph 22.1 mph 23.9 mph10mph Pace: 7.5 - 17.4 (53.2%)
Centurion Special Speed Study Report Printed: 04/20/17 Page 4Centurion Special Speed Study Report Printed: 04/20/17 Page 4

Station: Los Tretos North Lane #3 Data From: 00:00 - 04/18/2017 To: 23:59 - 04/19/2017
Date Time
#1 #2 #3 #5#4 #7#6 #8 #9 #10 #11 #12 #13 #16#15#14
Total
0 - 19.9
20 -
24.9
25 -
29.9
30 -
34.9
35 -
39.9
40 -
44.9
45 -
49.9
50 - 55 - 60 - 65 - 70 - 75 -
54.9 59.9 64.9 69.9 74.9 79.9 Other89.9
85 -
84.9
80 -
Centurion Special Speed Study Report Printed: 04/20/17 Page 5

Station: Los Tretos North Data From: 00:00 - 04/18/2017 To: 23:59 - 04/19/2017
Special Speed Study Summary: Los Tretos North
Description 19.9 0 -
#1 #2
20 -
24.9 29.9
25 - #3
30 -
34.9
#4 #5
35 -
39.9 44.9
40 - #6
49.9
45 - #7 #8
50 -
54.9 59.9
55 - #9 #10
60 -
64.9 69.9
65 - #11 #12
70 -
74.9 79.9
75 - #13 #14
80 -
84.9 89.9
85 - #15 #16
Other Total
Grand Total #1: 247 98 43 13 0 0 0 0 0 1 0 0 0 0 0 40261% 24% 11% 3% 0% 0% 0% 0% 0% 0% 0% 0% 0% 0% 0% 0% Percent :
Cum. Percent :
Average :
0
61% 86% 97% 100% 100% 100% 100% 100% 100% 100% 100% 100% 100% 100% 100% 100%
5 2 1 0 0 0 0 0 0 0 0 0 0 0 0 0 8
Average Speed 15.7 mph 50% Speed : 14.9 mph 67% Speed :10mph Pace: 7.7 - 17.6 (40.0%)
21.4 mph 85% Speed : 24.7 mphADT = 201
Grand Total #3: 207 95 25 12 1 0 1 1 0 0 0 0 0 0 0 34360% 28% 7% 3% 0% 0% 0% 0% 0% 0% 0% 0% 0% 0% 0% 0% Percent :
Cum. Percent :
Average :
1
60% 88% 95% 99% 99% 99% 99% 100% 100% 100% 100% 100% 100% 100% 100% 100%
4 2 1 0 0 0 0 0 0 0 0 0 0 0 0 0 7
Average Speed 16.0 mph 50% Speed : 14.2 mph 67% Speed :10mph Pace: 6.5 - 16.4 (46.9%)
21.4 mph 85% Speed : 24.3 mphADT = 171
Comb. Total : 454 193 68 25 1 0 1 1 0 1 0 0 0 0 0 74561% 26% 9% 3% 0% 0% 0% 0% 0% 0% 0% 0% 0% 0% 0% 0% Percent :
Cum. Percent :
Average :
1
61% 87% 96% 99% 99% 99% 100% 100% 100% 100% 100% 100% 100% 100% 100% 100%
9 4 1 1 0 0 0 0 0 0 0 0 0 0 0 0 15
Average Speed 15.8 mph 50% Speed : 14.9 mph 67% Speed :10mph Pace: 5.9 - 15.8 (39.5%)
21.5 mph 85% Speed : 24.5 mphADT = 372
Centurion Special Speed Study Report Printed: 04/20/17 Page 6

Los Tretos North Charts For Data From: 00:00 - 04/18/2017 To: 23:59 - 04/19/2017
Mean50%67%85%
Speed Percent vs. Time (all lanes)00
:00
01:0
0
02:0
0
03:0
0
04:0
0
05:0
0
06:0
0
07:0
0
08:0
0
09:0
0
10:0
0
11:0
0
12:0
0
13:0
0
14:0
0
15:0
0
16:0
0
17:0
0
18:0
0
19:0
0
20:0
0
21:0
0
22:0
0
23:0
0
SP
EE
D
28
26
24
22
20
18
16
14
12
10
8
6
4
2
0
Speed Bin Chart (all lanes combined)
0 -
19.9
20 -
24.
9
25 -
29.
9
30 -
34.
9
35 -
39.
9
40 -
44.
9
45 -
49.
9
50 -
54.
9
55 -
59.
9
60 -
64.
9
65 -
69.
9
70 -
74.
9
75 -
79.
9
80 -
84.
9
85 -
89.
9
Oth
er
Vol
ume
450
400
350
300
250
200
150
100
50
0
60.9%
25.9%
9.1%
3.4%
0.1% 0% 0.1% 0.1% 0% 0.1% 0% 0.1% 0% 0% 0% 0%
Centurion Special Speed Study Report Printed: 04/20/17 Page 7

Special Speed Study Report: Los Tretos South
Station ID : Los Tretos SouthInfo Line 1 : South of PastorcitoInfo Line 2 : Albuquerque
DB File : LOS T SO PASTO.DBNumber of Lanes :
0.0 mph1
Posted Speed Limit :
214941.62ApolloLast Connected Device Type :
Version Number :Serial Number :
GPS Lat/Lon :
Lane #1 Configuration
# Dir. Vehicle SensorsInformation Sensor Spacing Loop Length Comment
1. Northbound Ax-Ax 4.0 ft 6.0 ft
Lane #1 Special Speed Study Data From: 00:00 - 04/18/2017 To: 23:59 - 04/19/2017
Date Time
#1 #2 #3 #5#4 #7#6 #8 #9 #10 #11 #12 #13 #16#15#14
Total
0 - 19.9
20 -
24.9
25 -
29.9
30 -
34.9
35 -
39.9
40 -
44.9
45 -
49.9
50 - 55 - 60 - 65 - 70 - 75 -
54.9 59.9 64.9 69.9 74.9 79.9 Other89.9
85 -
84.9
80 -
04/18/17 00:00 1 0 0 0 0 0 0 0 0 0 0 0 0 0 0 0 1
Tue 01:00 0 0 1 0 0 0 0 0 0 0 0 0 0 0 0 0 1
02:00 0 0 0 0 0 0 0 0 0 0 0 0 0 0 0 0 0
03:00 0 0 0 0 0 0 0 0 0 0 0 0 0 0 0 0 0
04:00 1 1 0 0 0 0 0 0 0 0 0 0 0 0 0 0 2
05:00 0 1 0 0 0 0 0 0 0 0 0 0 0 0 0 0 1
06:00 3 4 0 0 0 0 0 0 0 0 0 0 0 0 0 0 7
07:00 8 11 5 1 0 0 0 0 0 0 0 0 0 0 0 0 25
08:00 2 4 1 1 0 0 0 0 0 0 0 0 0 0 0 0 8
09:00 2 2 2 0 0 0 0 0 0 0 0 0 0 0 0 0 6
10:00 1 5 1 0 0 0 0 0 0 0 0 0 0 0 0 0 7
11:00 2 2 0 1 0 0 0 0 0 0 0 0 0 0 0 0 5
12:00 7 4 0 0 0 0 0 0 0 0 0 0 0 0 0 0 11
13:00 6 1 0 0 0 0 0 0 0 0 0 0 0 0 0 0 7
14:00 6 1 0 0 0 0 0 0 0 0 0 0 0 0 0 0 7
15:00 7 4 0 0 0 0 0 0 0 0 0 0 0 0 0 0 11
16:00 6 10 1 0 0 0 0 0 0 0 0 0 0 0 0 0 17
17:00 6 4 2 0 0 0 0 0 0 0 0 0 0 0 0 0 12
18:00 5 7 3 0 0 0 0 0 0 0 0 0 0 0 0 0 15
19:00 5 3 2 0 0 0 0 0 0 0 0 0 0 0 0 0 10
20:00 4 2 1 0 0 0 0 0 0 0 0 0 0 0 0 0 7
21:00 5 2 1 0 0 0 0 0 0 0 0 0 0 0 0 0 8
22:00 2 1 0 0 0 0 0 0 0 0 0 0 0 0 0 0 3
23:00 0 0 0 0 0 0 0 0 0 0 0 0 0 0 0 0 0
Daily Total : 0 0 0 0 0 0 0 0 0 0 0 0 17179 69 20 346% 40% 12% 2% 0% 0% 0% 0% 0% 0% 0% 0% 0% 0% 0% 0% Percent :
Cum. Percent :
Average :46% 87% 98% 100% 100% 100% 100% 100% 100% 100% 100% 100% 100% 100% 100% 100%
3 3 1 0 0 0 0 0 0 0 0 0 0 0 0 0 7
Average Speed 50% Speed : 67% Speed : 85% Speed : 17.5 mph 20.8 mph 22.6 mph 24.5 mph10mph Pace: 20.4 - 30.3 (52.0%)
Centurion Special Speed Study Report Printed: 04/20/17 Page 1Centurion Special Speed Study Report Printed: 04/20/17 Page 1
Station: Los Tretos South Lane #1 Data From: 00:00 - 04/18/2017 To: 23:59 - 04/19/2017
Date Time
#1 #2 #3 #5#4 #7#6 #8 #9 #10 #11 #12 #13 #16#15#14
Total
0 - 19.9
20 -
24.9
25 -
29.9
30 -
34.9
35 -
39.9
40 -
44.9
45 -
49.9
50 - 55 - 60 - 65 - 70 - 75 -
54.9 59.9 64.9 69.9 74.9 79.9 Other89.9
85 -
84.9
80 -
04/19/17 00:00 2 0 0 0 0 0 0 0 0 0 0 0 0 0 0 0 2
Wed 01:00 0 0 0 0 0 0 0 0 0 0 0 0 0 0 0 0 0
02:00 0 0 0 0 0 0 0 0 0 0 0 0 0 0 0 0 0
03:00 0 0 0 0 0 0 0 0 0 0 0 0 0 0 0 0 0
04:00 0 0 0 0 0 0 0 0 0 0 0 0 0 0 0 0 0
05:00 0 1 0 0 0 0 0 0 0 0 0 0 0 0 0 0 1
06:00 2 0 2 0 0 0 0 0 0 0 0 0 0 0 0 0 4
07:00 9 14 4 0 0 0 0 0 0 0 0 0 0 0 0 0 27
08:00 4 2 0 1 0 0 0 0 0 0 0 0 0 0 0 0 7
09:00 6 0 0 0 0 0 0 0 0 0 0 0 0 0 0 0 6
10:00 2 2 0 0 0 0 0 0 0 0 0 0 0 0 0 0 4
11:00 7 4 1 1 0 0 0 0 0 0 0 0 0 0 0 0 13
12:00 3 2 1 0 0 0 0 0 0 0 0 0 0 0 0 0 6
13:00 2 4 1 0 0 0 0 0 0 0 0 0 0 0 0 0 7
14:00 3 5 1 0 0 0 0 0 0 0 0 0 0 0 0 0 9
15:00 7 5 1 0 0 0 0 0 0 0 0 0 0 0 0 0 13
16:00 5 4 4 0 0 0 0 0 0 0 0 0 0 0 0 0 13
17:00 4 10 1 0 0 0 0 0 0 0 0 0 0 0 0 0 15
18:00 10 7 3 0 0 0 0 0 0 0 0 0 0 0 0 0 20
19:00 9 2 0 0 0 0 0 0 0 0 0 0 0 0 0 0 11
20:00 3 5 1 0 0 0 0 0 0 0 0 0 0 0 0 0 9
21:00 3 1 1 0 0 0 0 0 0 0 0 0 0 0 0 0 5
22:00 3 1 0 0 0 0 0 0 0 0 0 0 0 0 0 0 4
23:00 2 1 0 0 0 0 0 0 0 0 0 0 0 0 0 0 3
Daily Total : 0 0 0 0 0 0 0 0 0 0 0 0 17986 70 21 248% 39% 12% 1% 0% 0% 0% 0% 0% 0% 0% 0% 0% 0% 0% 0% Percent :
Cum. Percent :
Average :48% 87% 99% 100% 100% 100% 100% 100% 100% 100% 100% 100% 100% 100% 100% 100%
4 3 1 0 0 0 0 0 0 0 0 0 0 0 0 0 8
Average Speed 50% Speed : 67% Speed : 85% Speed : 17.2 mph 20.6 mph 22.4 mph 24.5 mph10mph Pace: 20.4 - 30.3 (50.8%)
Centurion Special Speed Study Report Printed: 04/20/17 Page 2Centurion Special Speed Study Report Printed: 04/20/17 Page 2

Station: Los Tretos South Lane #3 Data From: 00:00 - 04/18/2017 To: 23:59 - 04/19/2017
Lane #3 Configuration
# Dir. Information Vehicle Sensors Sensor Spacing Loop Length Comment
3. Southbound Ax-Ax 4.0 ft 6.0 ft
Lane #3 Special Speed Study Data From: 00:00 - 04/18/2017 To: 23:59 - 04/19/2017
Date Time
#1 #2 #3 #5#4 #7#6 #8 #9 #10 #11 #12 #13 #16#15#14
Total
0 - 19.9
20 -
24.9
25 -
29.9
30 -
34.9
35 -
39.9
40 -
44.9
45 -
49.9
50 - 55 - 60 - 65 - 70 - 75 -
54.9 59.9 64.9 69.9 74.9 79.9 Other89.9
85 -
84.9
80 -
04/18/17 00:00 0 0 0 0 0 0 0 0 0 0 0 0 0 0 0 0 0
Tue 01:00 1 0 0 0 0 0 0 0 0 0 0 0 0 0 0 0 1
02:00 0 1 0 0 0 0 0 0 0 0 0 0 0 0 0 0 1
03:00 0 0 0 0 0 0 0 0 0 0 0 0 0 0 0 0 0
04:00 1 0 0 0 0 0 0 0 0 0 0 0 0 0 0 0 1
05:00 2 0 1 0 0 0 0 0 0 0 0 0 0 0 0 0 3
06:00 6 0 1 0 0 0 0 0 0 0 0 0 0 0 0 0 7
07:00 3 2 0 0 0 0 0 0 0 0 0 0 0 0 0 0 5
08:00 4 5 3 1 0 0 0 0 0 0 0 0 0 0 0 0 13
09:00 2 2 0 0 0 0 0 0 0 0 0 0 0 0 0 0 4
10:00 1 1 1 1 0 0 0 0 0 0 0 0 0 0 0 0 4
11:00 2 1 1 0 0 0 0 0 0 0 0 0 0 0 0 0 4
12:00 7 2 0 0 0 0 0 0 0 0 0 0 0 0 0 0 9
13:00 9 4 0 0 0 0 0 0 0 0 0 0 0 0 0 0 13
14:00 6 3 1 0 0 0 0 0 0 0 0 0 0 0 0 0 10
15:00 1 4 0 0 0 0 0 0 0 0 0 0 0 0 0 0 5
16:00 6 2 0 0 0 0 0 0 0 0 0 0 0 0 0 0 8
17:00 7 5 0 0 0 0 0 0 0 0 0 0 0 0 0 0 12
18:00 6 4 3 0 0 0 0 0 0 0 0 0 0 0 0 0 13
19:00 4 0 0 0 0 0 0 0 0 0 0 0 0 0 0 0 4
20:00 1 1 2 0 0 0 0 0 0 0 0 0 0 0 0 0 4
21:00 3 1 0 0 0 0 0 0 0 0 0 0 0 0 0 0 4
22:00 1 0 0 0 0 0 0 0 0 0 0 0 0 0 0 0 1
23:00 1 0 0 0 0 0 0 0 0 0 0 0 0 0 0 0 1
Daily Total : 0 0 0 0 0 0 0 0 0 0 0 0 12774 38 13 258% 30% 10% 2% 0% 0% 0% 0% 0% 0% 0% 0% 0% 0% 0% 0% Percent :
Cum. Percent :
Average :58% 88% 98% 100% 100% 100% 100% 100% 100% 100% 100% 100% 100% 100% 100% 100%
3 2 1 0 0 0 0 0 0 0 0 0 0 0 0 0 6
Average Speed 50% Speed : 67% Speed : 85% Speed : 15.9 mph 11.7 mph 22.1 mph 23.4 mph10mph Pace: 7.8 - 17.7 (58.3%)
Centurion Special Speed Study Report Printed: 04/20/17 Page 3Centurion Special Speed Study Report Printed: 04/20/17 Page 3
Station: Los Tretos South Lane #3 Data From: 00:00 - 04/18/2017 To: 23:59 - 04/19/2017
Date Time
#1 #2 #3 #5#4 #7#6 #8 #9 #10 #11 #12 #13 #16#15#14
Total
0 - 19.9
20 -
24.9
25 -
29.9
30 -
34.9
35 -
39.9
40 -
44.9
45 -
49.9
50 - 55 - 60 - 65 - 70 - 75 -
54.9 59.9 64.9 69.9 74.9 79.9 Other89.9
85 -
84.9
80 -
04/19/17 00:00 0 0 1 0 0 0 0 0 0 0 0 0 0 0 0 0 1
Wed 01:00 0 0 0 0 0 0 0 0 0 0 0 0 0 0 0 0 0
02:00 0 0 0 0 0 0 0 0 0 0 0 0 0 0 0 0 0
03:00 0 0 0 0 0 0 0 0 0 0 0 0 0 0 0 0 0
04:00 0 1 0 0 0 0 0 0 0 0 0 0 0 0 0 0 1
05:00 2 0 0 0 0 0 0 0 0 0 0 0 0 0 0 0 2
06:00 2 1 0 0 0 0 0 0 0 0 0 0 0 0 0 0 3
07:00 3 2 2 1 0 0 0 0 0 0 0 0 0 0 0 0 8
08:00 3 1 1 0 0 0 0 0 0 0 0 0 0 0 0 0 5
09:00 1 3 3 0 0 0 0 0 0 0 0 0 0 0 0 0 7
10:00 5 2 2 0 0 0 0 0 0 0 0 0 0 0 0 0 9
11:00 3 5 0 0 0 0 0 0 0 0 0 0 0 0 0 0 8
12:00 2 2 2 0 0 0 0 0 0 0 0 0 0 0 0 0 6
13:00 0 3 0 0 0 0 0 0 0 0 0 0 0 0 0 0 3
14:00 8 4 1 0 0 0 0 0 0 0 0 0 0 0 0 0 13
15:00 4 1 1 0 0 0 0 0 0 0 0 0 0 0 0 0 6
16:00 1 1 0 0 0 0 0 0 0 0 0 0 0 0 0 0 2
17:00 1 2 0 0 0 0 0 0 0 0 0 0 0 0 0 0 3
18:00 6 6 1 0 0 0 0 0 0 0 0 0 0 0 0 0 13
19:00 2 3 0 0 0 0 0 0 0 0 0 0 0 0 0 0 5
20:00 1 3 0 0 0 0 0 0 0 0 0 0 0 0 0 0 4
21:00 3 2 0 0 0 0 0 0 0 0 0 0 0 0 0 0 5
22:00 1 0 0 0 0 0 0 0 0 0 0 0 0 0 0 0 1
23:00 1 0 0 0 0 0 0 0 0 0 0 0 0 0 0 0 1
Daily Total : 0 0 0 0 0 0 0 0 0 0 0 0 10649 42 14 146% 40% 13% 1% 0% 0% 0% 0% 0% 0% 0% 0% 0% 0% 0% 0% Percent :
Cum. Percent :
Average :46% 86% 99% 100% 100% 100% 100% 100% 100% 100% 100% 100% 100% 100% 100% 100%
2 2 1 0 0 0 0 0 0 0 0 0 0 0 0 0 5
Average Speed 50% Speed : 67% Speed : 85% Speed : 17.5 mph 21.5 mph 22.6 mph 23.8 mph10mph Pace: 21.3 - 31.2 (52.8%)
Centurion Special Speed Study Report Printed: 04/20/17 Page 4Centurion Special Speed Study Report Printed: 04/20/17 Page 4

Station: Los Tretos South Lane #3 Data From: 00:00 - 04/18/2017 To: 23:59 - 04/19/2017
Date Time
#1 #2 #3 #5#4 #7#6 #8 #9 #10 #11 #12 #13 #16#15#14
Total
0 - 19.9
20 -
24.9
25 -
29.9
30 -
34.9
35 -
39.9
40 -
44.9
45 -
49.9
50 - 55 - 60 - 65 - 70 - 75 -
54.9 59.9 64.9 69.9 74.9 79.9 Other89.9
85 -
84.9
80 -
Centurion Special Speed Study Report Printed: 04/20/17 Page 5

Station: Los Tretos South Data From: 00:00 - 04/18/2017 To: 23:59 - 04/19/2017
Special Speed Study Summary: Los Tretos South
Description 19.9 0 -
#1 #2
20 -
24.9 29.9
25 - #3
30 -
34.9
#4 #5
35 -
39.9 44.9
40 - #6
49.9
45 - #7 #8
50 -
54.9 59.9
55 - #9 #10
60 -
64.9 69.9
65 - #11 #12
70 -
74.9 79.9
75 - #13 #14
80 -
84.9 89.9
85 - #15 #16
Other Total
Grand Total #1: 165 139 41 5 0 0 0 0 0 0 0 0 0 0 0 35047% 40% 12% 1% 0% 0% 0% 0% 0% 0% 0% 0% 0% 0% 0% 0% Percent :
Cum. Percent :
Average :
0
47% 87% 99% 100% 100% 100% 100% 100% 100% 100% 100% 100% 100% 100% 100% 100%
3 3 1 0 0 0 0 0 0 0 0 0 0 0 0 0 7
Average Speed 17.3 mph 50% Speed : 20.7 mph 67% Speed :10mph Pace: 20.1 - 30.0 (51.4%)
22.6 mph 85% Speed : 24.5 mphADT = 175
Grand Total #3: 123 80 27 3 0 0 0 0 0 0 0 0 0 0 0 23353% 34% 12% 1% 0% 0% 0% 0% 0% 0% 0% 0% 0% 0% 0% 0% Percent :
Cum. Percent :
Average :
0
53% 87% 99% 100% 100% 100% 100% 100% 100% 100% 100% 100% 100% 100% 100% 100%
3 2 1 0 0 0 0 0 0 0 0 0 0 0 0 0 6
Average Speed 16.6 mph 50% Speed : 13.4 mph 67% Speed :10mph Pace: 6.2 - 16.1 (52.8%)
22.1 mph 85% Speed : 24.7 mphADT = 116
Comb. Total : 288 219 68 8 0 0 0 0 0 0 0 0 0 0 0 58349% 38% 12% 1% 0% 0% 0% 0% 0% 0% 0% 0% 0% 0% 0% 0% Percent :
Cum. Percent :
Average :
0
49% 87% 99% 100% 100% 100% 100% 100% 100% 100% 100% 100% 100% 100% 100% 100%
6 5 1 0 0 0 0 0 0 0 0 0 0 0 0 0 12
Average Speed 17.0 mph 50% Speed : 20.2 mph 67% Speed :10mph Pace: 20.1 - 30.0 (49.2%)
22.4 mph 85% Speed : 24.6 mphADT = 291
Centurion Special Speed Study Report Printed: 04/20/17 Page 6

Los Tretos South Charts For Data From: 00:00 - 04/18/2017 To: 23:59 - 04/19/2017
Mean50%67%85%
Speed Percent vs. Time (all lanes)00
:00
01:0
0
02:0
0
03:0
0
04:0
0
05:0
0
06:0
0
07:0
0
08:0
0
09:0
0
10:0
0
11:0
0
12:0
0
13:0
0
14:0
0
15:0
0
16:0
0
17:0
0
18:0
0
19:0
0
20:0
0
21:0
0
22:0
0
23:0
0
SP
EE
D
28
26
24
22
20
18
16
14
12
10
8
6
4
2
0
Speed Bin Chart (all lanes combined)
0 -
19.9
20 -
24.
9
25 -
29.
9
30 -
34.
9
35 -
39.
9
40 -
44.
9
45 -
49.
9
50 -
54.
9
55 -
59.
9
60 -
64.
9
65 -
69.
9
70 -
74.
9
75 -
79.
9
80 -
84.
9
85 -
89.
9
Oth
er
Vol
ume
280
260
240
220
200
180
160
140
120
100
80
60
40
20
0
49.4%
37.6%
11.7%
1.4%0% 0% 0% 0% 0% 0% 0% 0% 0% 0% 0% 0%
Centurion Special Speed Study Report Printed: 04/20/17 Page 7

Basic Volume Report: Los Tretos North
Station ID : Los Tretos NorthInfo Line 1 : North of PastorcitoInfo Line 2 : Albuquerque
DB File : L T NO PAST.DBNumber of Lanes :
0.0 mph1
Posted Speed Limit :
1.66ApolloLast Connected Device Type :
Version Number :Serial Number :
Lane #1 Configuration
# Dir. Information Volume Mode Volume Sensors Divide By 2 Comment
1. Northbound Normal Veh. No
GPS Lat/Lon :
Lane #1 Basic Volume Data From: 00:00 - 04/18/2017 To: 23:59 - 04/19/2017
Date Time :00 :15 :30 :45 Total
04/18/17 00:00 0 0 0 0 0
Tue 01:00 0 0 0 0 0
02:00 0 0 0 0 0
03:00 0 2 0 0 2
04:00 0 3 0 0 3
05:00 0 0 1 0 1
06:00 1 2 2 4 9
07:00 3 2 8 21 34
08:00 3 3 3 2 11
09:00 2 5 2 1 10
10:00 5 0 2 4 11
11:00 2 0 3 7 12
12:00 2 2 1 4 9
13:00 2 4 3 1 10
14:00 2 1 3 3 9
15:00 4 3 5 2 14
16:00 5 6 2 3 16
17:00 5 5 5 6 21
18:00 8 1 3 2 14
19:00 2 2 4 2 10
20:00 1 3 2 0 6
21:00 1 1 0 3 5
22:00 1 1 1 3 6
23:00 0 0 0 1 1
Day Total : 214
AM Total :
PM Total :
Peak AM Hour :
Peak PM Hour :
Average Period :
Average Hour :
Peak AM Factor :
Peak PM Factor :
93 (43.5%)
121 (56.5%)
0.417
0.750
2.2
8.9
07:30 =
17:15 =
35 (16.4%)
24 (11.2%)
Centurion Basic Volume Report Printed: 04/20/17 Page 1Centurion Basic Volume Report Printed: 04/20/17 Page 1
Station: Los Tretos North Lane #1 Data From: 00:00 - 04/18/2017 To: 23:59 - 04/19/2017
Date Time :00 :15 :30 :45 Total
04/19/17 00:00 0 0 0 0 0
Wed 01:00 0 0 0 0 0
02:00 0 0 0 0 0
03:00 0 0 0 0 0
04:00 1 0 1 0 2
05:00 0 0 1 1 2
06:00 0 1 3 1 5
07:00 2 6 11 7 26
08:00 4 2 3 3 12
09:00 1 0 2 2 5
10:00 3 1 2 1 7
11:00 2 3 3 2 10
12:00 2 2 2 2 8
13:00 4 4 1 3 12
14:00 2 2 4 2 10
15:00 4 4 4 6 18
16:00 3 4 3 2 12
17:00 5 3 3 4 15
18:00 7 13 5 3 28
19:00 4 4 2 3 13
20:00 3 5 0 2 10
21:00 3 1 1 0 5
22:00 1 1 1 0 3
23:00 0 0 0 0 0
Day Total : 203
AM Total :
PM Total :
Peak AM Hour :
Peak PM Hour :
Average Period :
Average Hour :
Peak AM Factor :
Peak PM Factor :
69 (34.0%)
134 (66.0%)
0.636
0.558
2.1
8.5
07:15 =
17:45 =
28 (13.8%)
29 (14.3%)
Centurion Basic Volume Report Printed: 04/20/17 Page 2
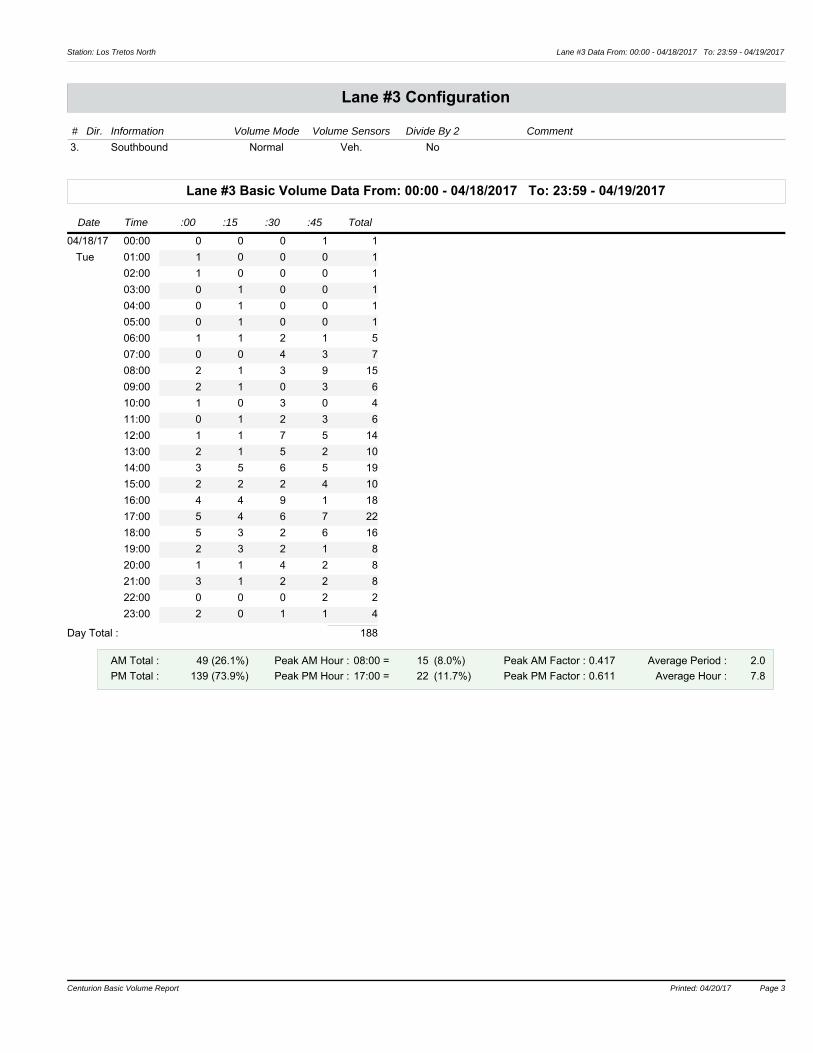
Station: Los Tretos North Lane #3 Data From: 00:00 - 04/18/2017 To: 23:59 - 04/19/2017
Lane #3 Configuration
Lane #3 Basic Volume Data From: 00:00 - 04/18/2017 To: 23:59 - 04/19/2017
# Dir. Information Volume Mode Volume Sensors Divide By 2 Comment
3. Southbound Normal Veh. No
Date Time :00 :15 :30 :45 Total
04/18/17 00:00 0 0 0 1 1
Tue 01:00 1 0 0 0 1
02:00 1 0 0 0 1
03:00 0 1 0 0 1
04:00 0 1 0 0 1
05:00 0 1 0 0 1
06:00 1 1 2 1 5
07:00 0 0 4 3 7
08:00 2 1 3 9 15
09:00 2 1 0 3 6
10:00 1 0 3 0 4
11:00 0 1 2 3 6
12:00 1 1 7 5 14
13:00 2 1 5 2 10
14:00 3 5 6 5 19
15:00 2 2 2 4 10
16:00 4 4 9 1 18
17:00 5 4 6 7 22
18:00 5 3 2 6 16
19:00 2 3 2 1 8
20:00 1 1 4 2 8
21:00 3 1 2 2 8
22:00 0 0 0 2 2
23:00 2 0 1 1 4
Day Total : 188
AM Total :
PM Total :
Peak AM Hour :
Peak PM Hour :
Average Period :
Average Hour :
Peak AM Factor :
Peak PM Factor :
49 (26.1%)
139 (73.9%)
0.417
0.611
2.0
7.8
08:00 =
17:00 =
15 (8.0%)
22 (11.7%)
Centurion Basic Volume Report Printed: 04/20/17 Page 3Centurion Basic Volume Report Printed: 04/20/17 Page 3

Station: Los Tretos North Lane #3 Data From: 00:00 - 04/18/2017 To: 23:59 - 04/19/2017
Date Time :00 :15 :30 :45 Total
04/19/17 00:00 0 1 1 1 3
Wed 01:00 0 0 0 0 0
02:00 0 0 0 0 0
03:00 0 0 0 0 0
04:00 0 0 1 0 1
05:00 0 0 0 0 0
06:00 0 1 0 1 2
07:00 2 1 3 2 8
08:00 2 0 1 2 5
09:00 4 0 1 3 8
10:00 2 5 0 5 12
11:00 1 1 3 2 7
12:00 2 1 4 4 11
13:00 2 2 2 2 8
14:00 8 3 3 1 15
15:00 4 2 6 3 15
16:00 0 2 2 5 9
17:00 2 7 3 1 13
18:00 2 4 8 3 17
19:00 1 3 2 2 8
20:00 3 3 0 7 13
21:00 1 2 0 2 5
22:00 1 2 1 0 4
23:00 0 0 1 1 2
Day Total : 166
AM Total :
PM Total :
Peak AM Hour :
Peak PM Hour :
Average Period :
Average Hour :
Peak AM Factor :
Peak PM Factor :
46 (27.7%)
120 (72.3%)
0.600
0.531
1.7
6.9
10:00 =
16:45 =
12 (7.2%)
17 (10.2%)
Centurion Basic Volume Report Printed: 04/20/17 Page 4Centurion Basic Volume Report Printed: 04/20/17 Page 4

Centurion Basic Volume Report Printed: 04/20/17 Page 5

Basic Volume Summary: Los Tretos North
Grand Total For Data From: 00:00 - 04/18/2017 To: 23:59 - 04/19/2017
Total Count # Of Days ADT Avg. Period PM Total & PercentAvg. Hour AM Total & PercentLane
#1. 417 2.00 209 2.2 8.7 162 255(54.1%) (61.2%)(38.8%)
#3. 354 2.00 177 1.8 7.4 95 259(45.9%) (73.2%)(26.8%)
ALL 771 2.00 386 4.0 16.1 257 514 (66.7%)(33.3%)
Lane Peak AM Hour Peak AM Factor Peak PM Hour Peak PM FactorDate Date
#1. 07:30 = 35 0.417 17:45 = 29 0.55804/18/2017 04/19/2017
#3. 08:00 = 15 0.417 17:00 = 22 0.61104/18/2017 04/18/2017
Centurion Basic Volume Report Printed: 04/20/17 Page 6

Basic Volume Report: Los Tretos South
Station ID : Los Tretos SouthInfo Line 1 : South of PastorcitoInfo Line 2 : Albuquerque
DB File : LOS T SO PASTO.DBNumber of Lanes :
0.0 mph1
Posted Speed Limit :
214941.62ApolloLast Connected Device Type :
Version Number :Serial Number :
Lane #1 Configuration
# Dir. Information Volume Mode Volume Sensors Divide By 2 Comment
1. Northbound Normal Veh. No
GPS Lat/Lon :
Lane #1 Basic Volume Data From: 00:00 - 04/18/2017 To: 23:59 - 04/19/2017
Date Time :00 :15 :30 :45 Total
04/18/17 00:00 0 1 0 0 1
Tue 01:00 0 0 1 0 1
02:00 0 0 0 0 0
03:00 0 0 0 0 0
04:00 0 2 0 0 2
05:00 0 0 1 0 1
06:00 1 2 1 3 7
07:00 6 2 5 12 25
08:00 2 4 1 1 8
09:00 1 4 1 0 6
10:00 3 1 0 3 7
11:00 0 1 3 1 5
12:00 0 4 3 4 11
13:00 3 1 2 1 7
14:00 1 3 1 2 7
15:00 4 1 1 5 11
16:00 5 5 1 6 17
17:00 1 2 6 3 12
18:00 6 3 4 2 15
19:00 2 1 5 2 10
20:00 2 3 2 0 7
21:00 2 1 1 4 8
22:00 1 1 1 0 3
23:00 0 0 0 0 0
Day Total : 171
AM Total :
PM Total :
Peak AM Hour :
Peak PM Hour :
Average Period :
Average Hour :
Peak AM Factor :
Peak PM Factor :
63 (36.8%)
108 (63.2%)
0.521
0.750
1.8
7.1
07:00 =
17:30 =
25 (14.6%)
18 (10.5%)
Centurion Basic Volume Report Printed: 04/20/17 Page 1Centurion Basic Volume Report Printed: 04/20/17 Page 1

Station: Los Tretos South Lane #1 Data From: 00:00 - 04/18/2017 To: 23:59 - 04/19/2017
Date Time :00 :15 :30 :45 Total
04/19/17 00:00 0 2 0 0 2
Wed 01:00 0 0 0 0 0
02:00 0 0 0 0 0
03:00 0 0 0 0 0
04:00 0 0 0 0 0
05:00 0 0 0 1 1
06:00 0 1 3 0 4
07:00 3 10 8 6 27
08:00 2 2 1 2 7
09:00 1 2 2 1 6
10:00 0 2 1 1 4
11:00 7 1 1 4 13
12:00 0 3 3 0 6
13:00 1 3 2 1 7
14:00 0 2 5 2 9
15:00 1 7 2 3 13
16:00 5 3 3 2 13
17:00 4 2 4 5 15
18:00 2 10 3 5 20
19:00 6 1 2 2 11
20:00 2 4 1 2 9
21:00 1 1 1 2 5
22:00 0 1 3 0 4
23:00 2 0 0 1 3
Day Total : 179
AM Total :
PM Total :
Peak AM Hour :
Peak PM Hour :
Average Period :
Average Hour :
Peak AM Factor :
Peak PM Factor :
64 (35.8%)
115 (64.2%)
0.675
0.600
1.9
7.5
07:00 =
18:15 =
27 (15.1%)
24 (13.4%)
Centurion Basic Volume Report Printed: 04/20/17 Page 2
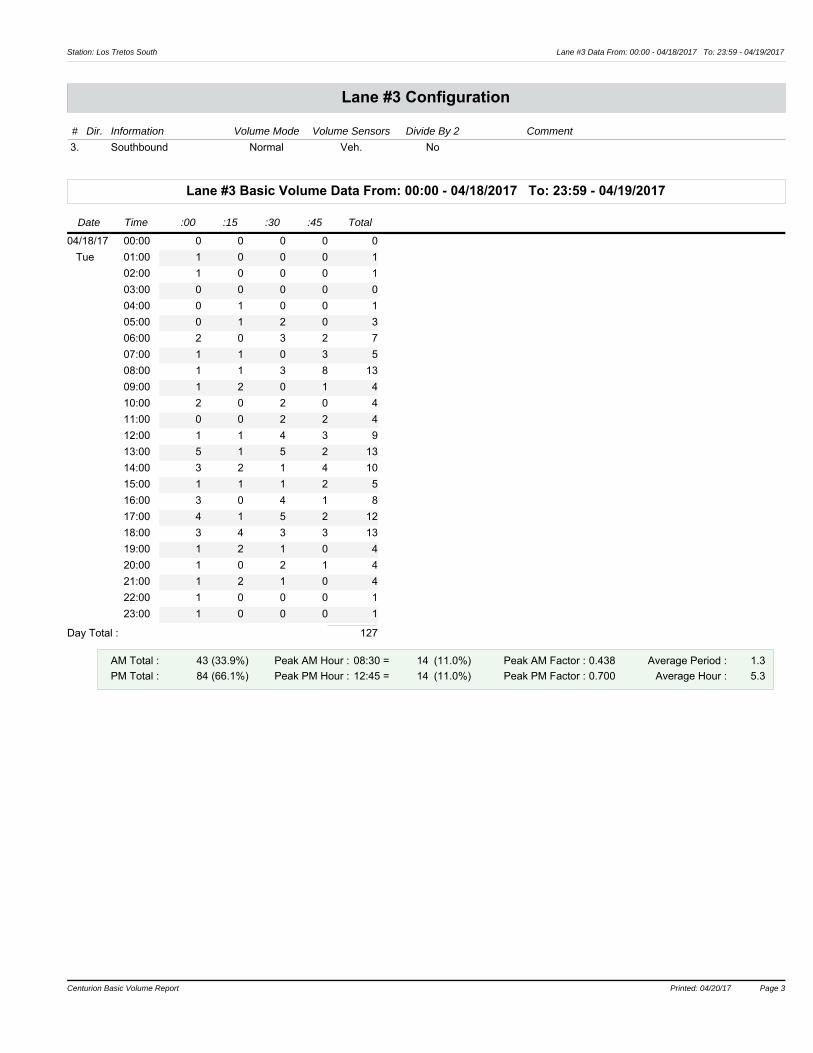
Station: Los Tretos South Lane #3 Data From: 00:00 - 04/18/2017 To: 23:59 - 04/19/2017
Lane #3 Configuration
Lane #3 Basic Volume Data From: 00:00 - 04/18/2017 To: 23:59 - 04/19/2017
# Dir. Information Volume Mode Volume Sensors Divide By 2 Comment
3. Southbound Normal Veh. No
Date Time :00 :15 :30 :45 Total
04/18/17 00:00 0 0 0 0 0
Tue 01:00 1 0 0 0 1
02:00 1 0 0 0 1
03:00 0 0 0 0 0
04:00 0 1 0 0 1
05:00 0 1 2 0 3
06:00 2 0 3 2 7
07:00 1 1 0 3 5
08:00 1 1 3 8 13
09:00 1 2 0 1 4
10:00 2 0 2 0 4
11:00 0 0 2 2 4
12:00 1 1 4 3 9
13:00 5 1 5 2 13
14:00 3 2 1 4 10
15:00 1 1 1 2 5
16:00 3 0 4 1 8
17:00 4 1 5 2 12
18:00 3 4 3 3 13
19:00 1 2 1 0 4
20:00 1 0 2 1 4
21:00 1 2 1 0 4
22:00 1 0 0 0 1
23:00 1 0 0 0 1
Day Total : 127
AM Total :
PM Total :
Peak AM Hour :
Peak PM Hour :
Average Period :
Average Hour :
Peak AM Factor :
Peak PM Factor :
43 (33.9%)
84 (66.1%)
0.438
0.700
1.3
5.3
08:30 =
12:45 =
14 (11.0%)
14 (11.0%)
Centurion Basic Volume Report Printed: 04/20/17 Page 3Centurion Basic Volume Report Printed: 04/20/17 Page 3

Station: Los Tretos South Lane #3 Data From: 00:00 - 04/18/2017 To: 23:59 - 04/19/2017
Date Time :00 :15 :30 :45 Total
04/19/17 00:00 0 0 1 0 1
Wed 01:00 0 0 0 0 0
02:00 0 0 0 0 0
03:00 0 0 0 0 0
04:00 0 0 1 0 1
05:00 0 0 0 2 2
06:00 1 0 0 2 3
07:00 2 1 2 3 8
08:00 2 1 1 1 5
09:00 1 0 1 5 7
10:00 1 2 1 5 9
11:00 3 1 1 3 8
12:00 2 0 3 1 6
13:00 1 0 1 1 3
14:00 5 3 5 0 13
15:00 2 0 3 1 6
16:00 1 0 0 1 2
17:00 0 1 2 0 3
18:00 2 2 5 4 13
19:00 1 3 1 0 5
20:00 1 1 0 2 4
21:00 1 3 0 1 5
22:00 0 0 0 1 1
23:00 0 1 0 0 1
Day Total : 106
AM Total :
PM Total :
Peak AM Hour :
Peak PM Hour :
Average Period :
Average Hour :
Peak AM Factor :
Peak PM Factor :
44 (41.5%)
62 (58.5%)
0.550
0.700
1.1
4.4
10:15 =
13:45 =
11 (10.4%)
14 (13.2%)
Centurion Basic Volume Report Printed: 04/20/17 Page 4Centurion Basic Volume Report Printed: 04/20/17 Page 4

Centurion Basic Volume Report Printed: 04/20/17 Page 5

Basic Volume Summary: Los Tretos South
Grand Total For Data From: 00:00 - 04/18/2017 To: 23:59 - 04/19/2017
Total Count # Of Days ADT Avg. Period PM Total & PercentAvg. Hour AM Total & PercentLane
#1. 350 2.00 175 1.8 7.3 127 223(60.0%) (63.7%)(36.3%)
#3. 233 2.00 117 1.2 4.9 87 146(40.0%) (62.7%)(37.3%)
ALL 583 2.00 292 3.0 12.2 214 369 (63.3%)(36.7%)
Lane Peak AM Hour Peak AM Factor Peak PM Hour Peak PM FactorDate Date
#1. 07:00 = 27 0.675 18:15 = 24 0.60004/19/2017 04/19/2017
#3. 08:30 = 14 0.438 12:45 = 14 0.70004/18/2017 04/18/2017
Centurion Basic Volume Report Printed: 04/20/17 Page 6

OBJECTID ReportIDSt Date CrashDate Year
338260 14.710146911 3/2/2014 20140302 2014
342216 14.710188165 9/25/2014 20140925 2014
OBJECTID Day Month Time24 Hour24
338260 1 3 1850 18
342216 5 9 736 7
OBJECTID Agency County City AStreet
338260 3 1 7825 LOS TRETOS NW
342216 3 1 7825 PASTORCITO DR NW
OBJECTID BStreet Landmark Route MilePost
338260 PASTORCITO DR NW 0
342216 LOS TRETOS NW 0
OBJECTID NumVeh NumPersons NumKilled NumClassA
338260 2 2 0 0
342216 2 3 0 0
OBJECTID NumClassB NumClassC NumInjured NumUnhurt
338260 1 0 1 1
342216 0 0 0 3
OBJECTID Severity Class Analysis TOPCACC
338260 Non‐Fatal Crash (injury) 8 e Struck Pedalcyclist At Excessive Speed
342216 operty Damage Only Cra 4 m Opposite Direction/Bo Failure to Yield
OBJECTID Weather Lighting ALCInv DRUGInv
338260 1 4 F F
342216 1 1 F F
OBJECTID PEDInv MCInv PECInv TrkInv
338260 F F T F
342216 F F F F
OBJECTID HZInv HitRun SHTDProp System
338260 F T 0 2
342216 F F 0 2
OBJECTID MaxDam RoadRel Character Grade
338260 5 T F 8
342216 3 T F 8
OBJECTID NonLocal Measure MeasureUni Direction
338260 2 99
342216 2 99