LoRa Indoor Coverage and Performance in an Industrial ... · LoRa Indoor Coverage and Performance...
8
LoRa Indoor Coverage and Performance in an Industrial Environment: Case Study Jetmir Haxhibeqiri, Abdulkadir Karaagac, Floris Van den Abeele, Wout Joseph, Ingrid Moerman and Jeroen Hoebeke Ghent University - imec, IDLab, Department of Information Technology Email: [jetmir.haxhibeqiri,abdulkadir.karaagac,floris.vandenabeele,wout.joseph,ingrid.moerman,jeroen.hoebeke]@ugent.be iGent Tower, Technologiepark-Zwijnaarde 15, B-9052 Ghent, Belgium Abstract—LoRa is a long range, low power, low bit rate, single hop wireless communication technology. It is intended to be used for Internet of Things (IoT) networks, where devices are battery powered and limited bandwidth is needed. In combination with its scalability and the low end device price, LoRa is a candidate technology for low bandwidth industrial applications with a high number of communication devices spread across large areas. The use case for this paper is taken from the flower industry, where a large number of trolleys need to communicate with a server during their movement across the auction floor area. Once trolleys are outside of the auction floor they can use the public LoRaWAN network to communicate with the server, without switching communication technology. The LoRaWAN network consists of multiple end nodes and a single gateway per cell, acting as a transparent bridge between the end nodes and the network server. The measurements show that with a single LoRa gateway we can cover an indoor area of around 34000m2 only with spreading factor 7, while for spreading factor 12 the total covered area will be even higher. Also, the area outside the factory is covered when switching to spreading factor 12. We also show that the number of nodes (trolleys) that can be served by a gateway in such a case can be as high as 6000. Keywords: low power wide area networks (LPWAN), LoRa, Internet of Things (IoT),indoor industrial environment, RSSI, PER. I. I NTRODUCTION In many industrial environments communication between devices and people is crucial for improving the work effi- ciency and automating processes. Different means of wireless communication are one of the enabling technologies in the paradigm of Industry 4.0 [1]. Low power wide area networks (LPWAN) are seen as promising technologies for those industries where the devices and tools need to be transported distant from the main fac- tory, with requirements for low bandwidth and non-critical communication. The bit rates provided by LPWAN are up to hundreds of bits per second. However, the range is in the order of kilometers and the battery life of end devices can easily be several years. LPWANs have a single hop topology where end devices communicate directly with gateways, but not directly with each other. Gateways will act as bridges towards a central network server and the Internet. Typically end devices in an LPWAN can communicate with the gateway even under low Signal to Noise Ratio (SNR) and Received Signal Strength Indicator (RSSI) values thanks to the usage of robust modulation techniques. Different LPWANs technologies exist such as LoRa [2], SigFox [3], RPMA [4], NB-IOT [5], Weightless [6], etc. A comparison between ultra-narrow band (UNB) and spread spectrum technologies which are currently used in LPWANs is given in [7]. The LoRaWAN technology recently gained interest from research and industrial community. The advantage of Lo- RaWAN is that it is an open specification on top of the LoRa physical layer, end devices are cheap and coverage is large. This makes it suitable for large-scale deployments in large industrial environments that can be covered by a single gateway only, not requiring any handover. One such industry example is the flower industry, where a lot of flower trolleys need to be monitored during their shipment to clients as well as when residing on the large auction floor. There is need for communication across long distances as well as inside the auction floor where a lot of trolleys need to be processed. Industrial environments have proven to be difficult environments in terms of wireless communication [8] [9]. However, until now, there was no study of LoRaWAN perfor- mance in such difficult environments where a lot of shielding and scattering effects occur. In this study, we will focus on the LoRaWAN performance in an industrial environment deployment consisting of a single gateway and single network server. We will evaluate the performance based on coverage (RSSI values), SNR values, packet received ratio with wrong Cyclic Redundancy Check (CRC) and packet loss ratio. The rest of the paper is composed as follows: in Section II we will discuss related work on LoRa performance and analysis; in Section III we will give the basics of LoRa and LoRaWAN and how it works; in Section IV we will describe the setup and environment where the performance measurements were done together with our simulation model; in Section V we will give the results of measurements and simulations; Section VI will conclude the paper and will discuss potential future work. II. RELATED WORK Recently, the research community started to publish studies on different aspects of LoRa technology and LoRaWAN networks. Some of these studies are in the field of LoRaWAN coverage [10], [11], [12], [13], [14], some of them make a comparison between LoRA and other WAN technologies in
Transcript of LoRa Indoor Coverage and Performance in an Industrial ... · LoRa Indoor Coverage and Performance...
LoRa Indoor Coverage and Performance in anIndustrial Environment: Case Study
Jetmir Haxhibeqiri, Abdulkadir Karaagac, Floris Van den Abeele, Wout Joseph,Ingrid Moerman and Jeroen Hoebeke
Ghent University - imec, IDLab, Department of Information TechnologyEmail: [jetmir.haxhibeqiri,abdulkadir.karaagac,floris.vandenabeele,wout.joseph,ingrid.moerman,jeroen.hoebeke]@ugent.be
iGent Tower, Technologiepark-Zwijnaarde 15, B-9052 Ghent, Belgium
Abstract—LoRa is a long range, low power, low bit rate, singlehop wireless communication technology. It is intended to be usedfor Internet of Things (IoT) networks, where devices are batterypowered and limited bandwidth is needed. In combination withits scalability and the low end device price, LoRa is a candidatetechnology for low bandwidth industrial applications with a highnumber of communication devices spread across large areas.The use case for this paper is taken from the flower industry,where a large number of trolleys need to communicate with aserver during their movement across the auction floor area. Oncetrolleys are outside of the auction floor they can use the publicLoRaWAN network to communicate with the server, withoutswitching communication technology. The LoRaWAN networkconsists of multiple end nodes and a single gateway per cell,acting as a transparent bridge between the end nodes and thenetwork server. The measurements show that with a single LoRagateway we can cover an indoor area of around 34000m2 onlywith spreading factor 7, while for spreading factor 12 the totalcovered area will be even higher. Also, the area outside the factoryis covered when switching to spreading factor 12. We also showthat the number of nodes (trolleys) that can be served by agateway in such a case can be as high as 6000.
Keywords: low power wide area networks (LPWAN), LoRa,Internet of Things (IoT),indoor industrial environment, RSSI,PER.
I. INTRODUCTION
In many industrial environments communication betweendevices and people is crucial for improving the work effi-ciency and automating processes. Different means of wirelesscommunication are one of the enabling technologies in theparadigm of Industry 4.0 [1].
Low power wide area networks (LPWAN) are seen aspromising technologies for those industries where the devicesand tools need to be transported distant from the main fac-tory, with requirements for low bandwidth and non-criticalcommunication. The bit rates provided by LPWAN are up tohundreds of bits per second. However, the range is in theorder of kilometers and the battery life of end devices caneasily be several years. LPWANs have a single hop topologywhere end devices communicate directly with gateways, butnot directly with each other. Gateways will act as bridgestowards a central network server and the Internet. Typicallyend devices in an LPWAN can communicate with the gatewayeven under low Signal to Noise Ratio (SNR) and ReceivedSignal Strength Indicator (RSSI) values thanks to the usage ofrobust modulation techniques.
Different LPWANs technologies exist such as LoRa [2],SigFox [3], RPMA [4], NB-IOT [5], Weightless [6], etc. Acomparison between ultra-narrow band (UNB) and spreadspectrum technologies which are currently used in LPWANsis given in [7].
The LoRaWAN technology recently gained interest fromresearch and industrial community. The advantage of Lo-RaWAN is that it is an open specification on top of theLoRa physical layer, end devices are cheap and coverageis large. This makes it suitable for large-scale deploymentsin large industrial environments that can be covered by asingle gateway only, not requiring any handover. One suchindustry example is the flower industry, where a lot of flowertrolleys need to be monitored during their shipment to clientsas well as when residing on the large auction floor. Thereis need for communication across long distances as well asinside the auction floor where a lot of trolleys need to beprocessed. Industrial environments have proven to be difficultenvironments in terms of wireless communication [8] [9].However, until now, there was no study of LoRaWAN perfor-mance in such difficult environments where a lot of shieldingand scattering effects occur. In this study, we will focuson the LoRaWAN performance in an industrial environmentdeployment consisting of a single gateway and single networkserver. We will evaluate the performance based on coverage(RSSI values), SNR values, packet received ratio with wrongCyclic Redundancy Check (CRC) and packet loss ratio.
The rest of the paper is composed as follows: in SectionII we will discuss related work on LoRa performance andanalysis; in Section III we will give the basics of LoRaand LoRaWAN and how it works; in Section IV we willdescribe the setup and environment where the performancemeasurements were done together with our simulation model;in Section V we will give the results of measurements andsimulations; Section VI will conclude the paper and willdiscuss potential future work.
II. RELATED WORK
Recently, the research community started to publish studieson different aspects of LoRa technology and LoRaWANnetworks. Some of these studies are in the field of LoRaWANcoverage [10], [11], [12], [13], [14], some of them make acomparison between LoRA and other WAN technologies in

terms of physical layer performance [15], [16], and there area few studies on the interference mitigation for LoRa [17],[18]. To make a clarification of terms, from now onward inthis paper, we will use LoRa to refer to the physical layertechnology itself, whereas we will use LoRaWAN to refer tothe deployment of LoRa based WANs using the LoRaWANMAC protocol and network architecture.
Results for LoRaWAN coverage when deployed in sub-urban areas are reported in [10]. They reached a good coverageup to 3 km for spreading factor (SF) 12 and 2.3 km for SF 7.The gateway was mounted at the second floor of a building andthe area mainly consisted of low-rise residential buildings. In[11], authors give an introduction to LoRaWAN networks andcoverage planning for such networks. They reach coverage of 2km radius for SF 12 and 1.2 km radius for SF 7. They achievednetwork coverage for a city of 100 km2 with only 30 gateways,half the number of base stations that are used for a cellularnetwork covering the same area. This network deployment hada density of 7000 inhabitants per gateway. Another LoRaWANcoverage study was presented in [12]. They performed mea-surements in an open sea environment and a city environment.Based on these measurements they achieved up to 80% packetsuccess rate at distances lower than 5 km from the gatewayand 60% success rate for distances from 5 to 10 km for thecity environment. Contrary, for the open sea environment theyobserved up to 70% packets delivery rate at a distance of 15km, which is quite promising. Based on those experimentalresults they model the channel attenuation of LoRa [12]. Apartfrom outdoor coverage studies, there were two other studiesfor indoor LoRaWAN coverage, namely [13] and [14]. In[13], authors made excessive measurements to characterize theperformance in terms of packet loss, indoor coverage, receivedsignal strength at gateways, power consumption of end devicesand delays due to duty cycle. The gateway was installed indoorand the measurements were done at the same floor, as wellat the floors above and below the gateway. They report apacket loss rate of around 40% when using SF12 at certainmeasurement points, which is a high percentage. However, forother SF usage the losses were under 5%. Indoor LoRaWANcoverage in a hospital is presented in [14]. The lowest deliveryratio they achieved was 94.7% at a certain measurement point.The RSSI values were always higher than -132 dBm, whichexplains the good reception ratio.
In [15], an overview of LoRa is given and a comparisonwith other LPWA technologies is presented. They number theadvantages of using chirp modulation at the physical layerand the possibility of adopting upper layer solutions fromother technologies such as IEEE 802.15.4 or 6LoWPAN. MACand physical layers of Sigfox and LoRa are compared in[16]. LoRa uses a patented chirp spread spectrum modulationtechnique opposed to Sigfox that uses ultra-narrow bandcommunication. In terms of coverage they calculated that,theoretically, LoRa can go up to 22 km compared to 63 kmfor SigFox. For LoRa self-interference, they calculate the co-channel interference rejection for all combinations of SFs.They claim that one transmission can be received with the
same SF and in the same channel if it is received 6 dB higherthan its interferer [16], known as the capture effect. This effectwill be taken into consideration in our simulation model forassessing the scalability for our use case (see Section VI).
In [17] a self-interference study for LoRaWAN networks ispresented. Two techniques covered in this study to decreasethe self-interference are the usage of directional antennas andthe usage of multiple base stations (gateways). They use asingle base station with 600 nodes which is interfered by 4other base stations with 600 nodes each. Using simulations, itis shown that in case of LoRaWANs usage of multiple basestations, an increase in data extraction rate of 56% was feasiblecompared to 32% when directional antennas were used.
In [18], authors made a study regarding the CSS modulationtechnique that is used in LoRa. They show that not any twoCSS symbols are always orthogonal. Based on a simulationmodel, they show that the range is lower than ultra-narrowbandsolutions (like Sigfox), but that the CSS modulation techniqueis more robust against interference.
The network capacity is studied in [19]. They show thatnodes near the gateway can send 2 kbit/s on average in uplink,while this number decreases for an increased distance fromthe gateway, down to only 100 bit/s on average for far awaynodes. They also show the possible end devices distributionfor different SFs.
III. OVERVIEW OF LORA AND LORAWAN
The LoRa physical layer is patented by Semtech [20] andis based on Chirp Spread Spectrum (CSS) which enables highreceiver sensitivity. LoRaWAN is a MAC layer protocol andsystem architecture design and is standardized by the LoRaAlliance [21]. In addition to CSS, the LoRa physical layer alsouses forward error correction codes to increase the robustnessagainst noise, while the MAC layer uses an Aloha like channelaccess technique.
In Europe, LoRa operates in the 863 - 870 MHz frequencyband. It can operate in two sub-bands, one at 868 MHz thatoffers three 125 KHz LoRa channels and one at 867 MHzhaving that offers five 125 kHz LoRa channels. The gatewayshould be able to listen to all channels at the same time, whilefor end nodes it is mandatory to be able to communicate atleast in the 868MHz sub-band. The European regulations [22]ask for adhering to a 1% duty cycle per sub-band or applying a”listen-before-talk and adaptive frequency agility” mechanism.
The narrowband signal is spread into a broadband signal byrepresenting each bit of information with a number of chipsof information. The spreading factor is related to the numberof chips per bit of information. It is given as log2(N), whereN is the number of chips per symbol. LoRa uses 6 differentspreading factors ranging from 7 to 12. The nominal bit rate isdecreased by increasing the spreading factor, but the receiversensitivity increases.The relation between data rates, spreadingfactor and receiver sensitivity is given in Table I. The FECcodes use a coding rate of 4/5 up to 4/8. The physical framestructure is composed of a preamble, an optional header andthe LoRaWAN packet itself.

TABLE IRELATIONS BETWEEN DATA RATE, SPREADING FACTOR AND RECEIVER
SENSITIVITY
Data Rate SF Bit rate [kbps] Rx sensitivity [dBm]
DR0 12 0.25 -137DR1 11 0.44 -135DR2 10 0.98 -133DR3 9 1.7 -130DR4 8 3.1 -129DR5 7 5.4 -124
The physical frame always starts with a known chirp se-quence, which helps to achieve synchronization between thetransmitter and receiver. At the receiver side, the beginning ofthe preamble is found by correlating the received signal withthe known sequence. The preamble has a variable length andcan be 10 up to 65539 symbols long. According to [20], thepreamble starts with a sequence of upchirps followed by twoupchirps encoding the sync word. The sync word can be usedto distinguish between devices from different networks. If thesync word does not match the sync word which is configuredon the gateway, then the gateway will stop receiving thatframe. Finally, the preamble ends with 2.25 downchirps.
The header can be implicit or explicit. The explicit headercontains the payload length in bytes, the FEC code rate of thepayload and the header CRC. The header is always protectedwith an FEC of highest code rate of 4/8. If all of thesethree parameters are known in advance, then it makes senseto remove the header totally, decreasing the time on air ofthe packet. In this case, the implicit header is applied, wherethe header parameters are fixed beforehand in the receiver.The payload will contain either LoRaWAN MAC layer controlpackets or data packets. Optionally it can be followed by thepayload CRC.
The LoRaWAN MAC layer provides the medium accesscontrol mechanism that enables the communication of multipledevices with the receiver gateway. Each node transmits withoutsensing the channel and only adheres to the duty cycle.
LoRaWAN has a star topology architecture, where the enddevices can only communicate with a LoRaWAN gateway andnot directly with each other. Multiple gateways are connectedto a central network server. The LoRaWAN gateways areonly responsible for forwarding raw data packets from theend devices towards the server and vice versa. The networkserver is responsible to send the downlink packets towardsend devices, if needed. The LoraWAN standard defines threeclasses of end devices. Class A devices support bidirectionalcommunication by triggering the downlink communicationwith an uplink communication. A Class A device sends anuplink packet and after the end of the transmission it opens twodownlink windows for receiving downlink traffic. The first andsecond receive window opens 1s and 2 s after the end of thetransmission, respectively. At any other moment, the downlinkpacket needs to wait for an incoming uplink transmission.
Class B devices schedule receiver slots periodically. The
Fig. 1. The border between buffering zone and distribution zone.
period of time is determined by time synchronized beaconsfrom the gateway. Class C devices can continuously receive,except when they transmit. With respect to power consump-tion, Class A devices are most of the time ”sleeping” whileClass C devices are all the time ”awake”.
The features of Class A devices are a basic set of optionsthat every end device needs to implement in order to join aLoRaWAN network.
IV. METHODS AND MEASUREMENT ENVIRONMENT
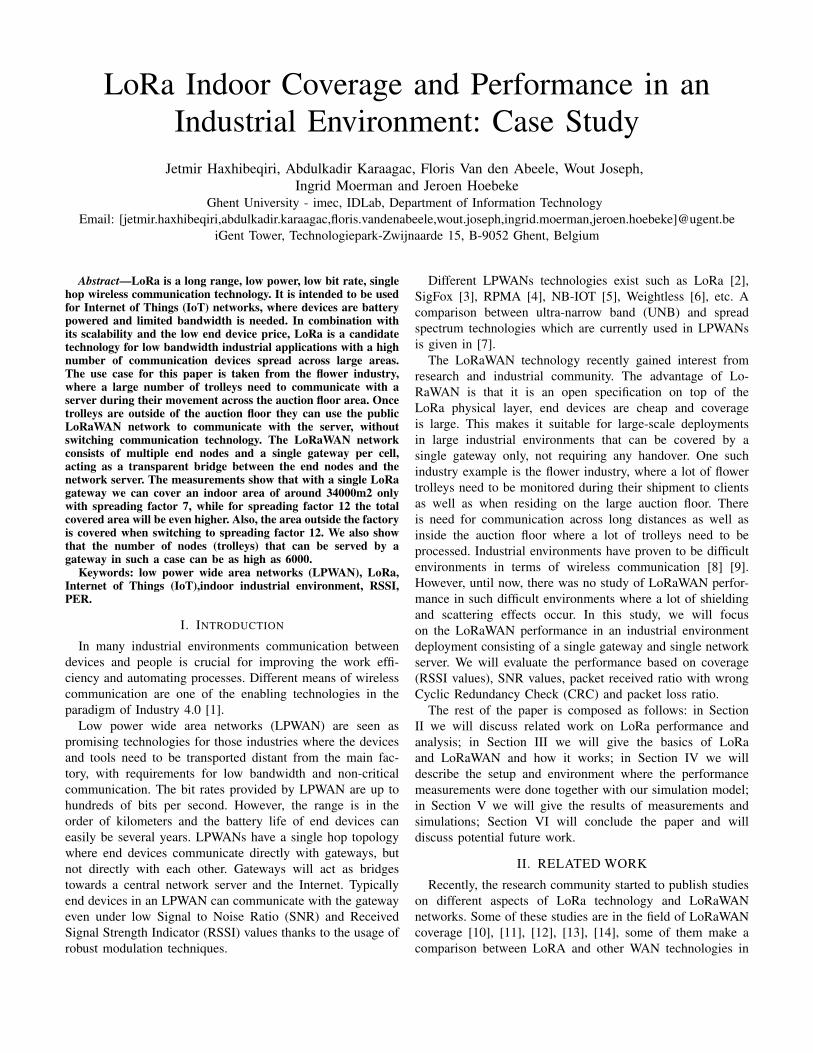
The chosen environment where we performed our measure-ments was the Royal FloraHolland Auction Center [23] locatedin Naaldwijk, a city near The Hague, in the Netherlands.Such a large industrial area (with 250000m2 covered areaand several other open areas) makes it challenging in termsof coverage when using a single technology and keeping thenumber of base stations as low as possible. The high numberof flower trolleys (approximately 10000 going in and out everyday) and their dynamicity make the environment challengingfor the wave propagation, possibly having a high impacton the communication. The auction floor is composed ofdifferent areas such as: an auction hall, storing zones, bufferingzones and a distribution zone. The considered measurementenvironment is shown in Figure 1; this is the border betweenthe buffering zone and the distribution zone, where trolleysare processed manually by the workers. On the sides of themeasurement area there are sideways (at 5.6m height) wherethere are no trolleys. These are used as connections betweenthe different auction floor zones.
Due to its dynamicity and due to access permissions, ourmeasurement area was concentrated in the buffering zone(sector A) and distribution zones (sectors B and C) of theauction floor, with dimensions of 190 by 180 meters (Figure2). This zone is challenging due to the high number oftrolleys full of plants and flowers moving around either inparallel lines (buffer zone) or zigzag (in distribution zone).Some measurements were done outside the auction floor atthe distribution gates where the tracks are filled with theflower trolleys. The LoRa gateway was installed indoor on thesideways at a height of 6m above the auction floor. During themeasurements, the LoRa mote was kept at a height of 1.7m,

the same height as the trolleys. We used the highest transmitpower allowed in the 868 MHz frequency band, namely 14dBm. The measurement points and the distances between thegateway and the measurement points are shown in Figure 2.
A. Measurements
The physical layer information of the used LoRaWAN moteis provided in Table II. In order to speed up the measurementprocess, we made a controllable parallel measurement setupfor SF 7 and SF 12. When the node which sent with SF7 was waiting as part of its radio duty cycle we used thesecond node to send with SF 12. A microcontroller was usedto trigger the transmission at the right timing. We chose thesetwo spreading factors to test the highest (SF 7) and the lowest(SF 12) data rate possible, respectively 5.4 kbps and 250 bps.In total, we obtained 33 measuring points inside the auctionfloor (12 points at the ground floor and 21 at the first floor onthe sideways) and 13 measurement points outside the auctionfloor to assess the performance in the nearby vicinity of theindoor covered environment. For each measurement point wesent 50 packets for each SF.
We used the LoRANK gateway [24] which employs aWiMOD iC880A chip [25]. It is able to receive on 8 channelsin parallel at sub-bands 868 MHZ and 867 MHz and allspreading factors. Spreading factors are orthogonal to eachother so sending two packets with different SF at the sametime and on the same channel will not collide. The networkserver saved all the received packets together with informationfrom the physical layer: RSSI value, SNR value, CRC check,channel on which it was received and code rate. For theLoRaWAN motes we used two WiMOD iM880A [26] nodesto send packets with two different SFs one after another tospeed up the measurement process. Since each LoRa moteuses counters to distinguish between consequent packets at thereceiving side, we make use of this counter to detect any lostpackets during the measurement. Once we moved to anotherlocation the counter was reset to 0 to make it possible todistinguish the packets from different measurement locationsin the logs of the LoRaWAN server. The use case of the RoyalFloraHolland Auction floor imposes several requirements tothe communication. The trolleys have different update ratesdepending on whether they are moving or they are staticallywaiting at the buffer zone for the operators to pick them up.Moving trolleys should have an update rate with the serverevery 5 minutes, while the non-moving trolleys should have anupdate rate every hour. The payload packet length is 20 bytes.At any time approximately 25% of trolleys on the auction floorare moving and 75% are not moving. The requirements are tokeep the packet loss rate under 10%.
B. Simulation Method
In order to assess the feasibility of using a LoRaWAN net-work in such a large industrial environment we need to knowthe network scalability (the number of end nodes supported persingle gateway) beforehand. For this, we prepared a simulationenvironment for scalability tests. The simulator is a Python
TABLE IIPHYSICAL LAYER PARAMETERS FOR MEASUREMENT SETUP
Parameter Value
Spreading Factor 12 and 7Channel Bandwidth 125 KHz
Code Rate 4/5Explicit Header On
Channel 868.3 MHzPayload CRC On
Programmable preamble symbol length 6Low Data rate optimization On
Payload length 15 bytesTx power 14 dBm
script that compares the starting time of random transmissionsand the transmission time length and calculates the collisionsbased on timing overlap and RSSI values [27]. The transmis-sions are done randomly from different transmissions.
In our LoRa scalability simulator we use all three channelsfrom the sub-band of 868 MHz and all the spreading factors.The code rate for the payload was 4/8, the most robust one.We generate three vectors, the SF vector, the RSSI vectorand channel vector, all with length N, N being the numberof transmitters. The distribution of different SFs can be doneuniformly or with certain distribution based on the density ofthe nodes per area which is covered by SF. The distribution ofthe RSSI values is done randomly chosen from a certain rangeof values, or the RSSI values can be assigned based on the SFthat the transmitter is using. When the SF is the highest (SF12), then the RSSI value is assigned from a subset of valuesnear the lowest border of the value range while for the lowestSF the RSSI value is assigned from the subset of values nearthe highest border of the value range. For each transmitter,a channel is assigned in a random way irrespective of theassigned SF or RSSI value. The two-dimensional matrix ofpacket transmission start times has a dimension of Nxn, whereN is the number of transmitters and n is the number of packetsthat each transmitter sends (it is same for each transmitter).The matrix is populated based on the requirements of theradio duty cycle. If the transmission timings of packets fromdifferent transmitters are overlapping, and the SF and thechannel is the same for both transmitters, then the packet fromthe transmitter received with 6 dB lower RSSI is counted aslost. This way we take into account the capture effect [16]which makes it possible for the packet to be received by thegateway even under collision conditions. We also calculate thenumber of packets received with wrong CRC. This dependson whether the collision happens during the preamble timeor during the payload time of the packet. If the preamble ofthe packet was received uncollided, but the collision happenedonly during the transmission of the payload, then the packet isclassified as received with wrong CRC. We calculated the totalPLR for the given number of end nodes served by a gatewayas a sum of the number of packets lost and the number of

Fig. 2. Measurement points and their distance to the receiver (LoRa gateway): (left) At the sideways; (right) At the ground floor.
packets received with wrong CRC over the total number ofpackets sent by all nodes.
V. RESULTS
In a normal LPWAN the area of the zone which is coveredby SF 12 is bigger than the area of the zone which is coveredby SF 7 when we think of coverage zones of SFs as concentricareas around the gateway position [19]. Consequently, thenumber of nodes to be served with SF 12 is higher thanthe number of nodes to be served by any other of SFs.This makes the node distribution between different SFs non-uniform reducing thus the scalability.
In use cases like the one considered here, the main challengeis the network scalability. If the deployed LoRAWAN networkcan have a uniform distribution of the nodes with different SFthen it can serve more nodes with a single gateway.
One of the first targets of the measurement campaign wasto determine the coverage zones for the different spreadingfactors. However, once the zone under consideration is cov-ered by SF 7 it can be covered by any other SF since thereceiver sensitivity of any other SFs is lower than the SF 7receiver sensitivity (see Table I). Therefore, we only performedmeasurements with SF 7 and SF 12.
A. Measurement Results
The RSSI values for different locations are shown in Figure3. The RSSI values are undoubtedly above the sensitivity levelof the SF 7 which is -123 dBm. The lowest average RSSIvalue was at position 12 at the ground floor which was 23 dBhigher than the sensitivity threshold. The average values arelower for the measurement locations at the ground floor. Thisis due to non Line of Sight (nLOS) communication as manytrolleys were blocking the LOS between the LoRa gatewayand the LoRa mote. In case of measurements on the sideways,most of the time, LOS communication was ensured. Similarresults were obtained using SF 12, which shows that the areaunder consideration can be covered by all SFs. In case ofan LoRaWAN indoor network deployment, node distributionusing different SFs can be done uniformly in order to increasescalability and does not have to be based on the distancefrom the gateway, as it should be in an outdoor LPWAN
deployment. In such a case since the number of nodes usingSF 12 is lower than in outdoor deployment, this will have apositive impact bit rates and will result in shorter transmissiontimes.
The average, minimal and maximal SNR values for differentlocations are given in Table III and Table IV. The average SNRvalues (9.5- 10 dB) were similar at different locations dueto the good reception conditions. The minimal SNR valuesranged from -4 dB at position 11 at the ground floor to 8.8dB at many other locations. The maximal values were in theinterval 11 - 12 dB. At the ground floor at locations 11 and 12we had cases when the SNR value was negative. This is due tothe non-LOS communication and increased number of trolleysbetween the LoRa mote and the gateway. Even for negativeSNR values (up to -20 dB) the receiver will still be able toreceive the packet due to the robustness of the modulationscheme [20].
The same measurements were done outside of the auctionfloor in the vicinity of the building. The measurement locationsare shown in Figure 4. The gateway position is indicated bythe large circle (it is installed at the same indoor positionlike before) while the measurement locations are indicated bysmaller circles. The color of the circle of the measurementpoint shows the average RSSI value of the measurementpoint. The furthest location was around 400 m away fromthe gateway. The encircled measurement points could only bereached when using SF 12 but not when using SF 7 as theRSSI value received at the gateway was nearly at the SF 7receiver sensitivity threshold. Also the average SNR valueswere under 0 dB at all encircled points reaching a value of-16.4 dB for the furthest point from the gateway.
For the indoor measurement locations, all packets were re-ceived. However, negligible amounts of packets were receivedwith wrong payload CRC (0.5 - 0.8%). Contrary to the indoormeasurement, for the outdoor measurement at the locationsencircled in Figure 4, we received around 6% of all packetswith wrong payload CRC even with SF 12. For lower SF than12, all packets were lost. From the measurement results we canconclude that with single gateway we can cover large indoorindustrial areas ( 30000 m2) like the one considered in this use

Fig. 3. RSSI values in dBm (Min, Max, and average) for each measuring location for SF7: a) At the sideways; b) At the ground floor.
TABLE IIISNR VALUES IN DB FOR THE MEASUREMENT LOCATIONS AT GROUND FLOOR
Locations L1 L2 L3 L4 L5 L6 L7 L8 L9 L10 L11 L12
SNR avg. [dB] 9.8 9.7 9.9 9.7 9.8 9.9 9.83 9.98 9.29 9.65 8.87 8.65SNR min [dB] 8.5 7.5 8.5 8.8 8.2 8.8 8.2 7.8 3 7 -4 -3.5SNR max [dB] 11 11.5 11.2 11 11.8 11.8 11.5 12 11 11.5 11 11
TABLE IVSNR VALUES IN DB FOR THE MEASUREMENT LOCATIONS AT SIDEWAYS
Locations L1 L2 L3 L4 L5 L6 L7 L8 L9 L10 L11
SNR avg. [dB] 9.8 9.6 9.8 9.63 9.8 9.8 10 9.7 10 9.64 9.1SNR min [dB] 8.5 7.5 8.8 8.8 6.5 8.8 8.5 6.5 8.8 7 0.2SNR max [dB] 11.8 10.8 11.2 10.8 11.8 11.5 11.5 11.8 11.5 11 11
Locations L12 L13 L14 L15 L16 L17 L18 L19 L20 L21
SNR avg. [dB] 9.79 10 9.85 9.76 9.86 9.76 9.72 9.7 9.71 9.84SNR min [dB] 8.5 8.8 8.8 8.8 8.5 8.5 6 8.5 8.2 8.2SNR max [dB] 11 11.2 11.5 11.5 12 11 11.2 11.8 11.8 11
case with all the SFs. However, the coverage outside the indoorenvironment will decrease quickly and will be low due to thelarge attenuation of the walls. This makes it possible to designa LoRaWAN network with uniform SF node distribution ratherthan non-uniform distribution due to different coverage zones.We did not observe any packet loss at indoor locations. Themain cause of the losses at this LoRaWAN deployment casecome from network self-interference. In subsection V B wepresent simulation results for such a case using the LoRasimulation model described in subsection IV B.
B. Simulation Results
We calculated the time on air for a packet with a payloadof 20 bytes, being 1318.91 ms for SF 12 and 66.82 ms forSF 7. So even for SF12, we can send such packets every5 minutes as the waiting time due to the radio duty cyclerequirements is only 139 s. The other physical layer data thatwe took into account were: channel width of 125 KHz, useof the explicit MAC header, 8 symbols programmed preamblelength, payload CRC enabled and low data rate optimizationenabled.
Fig. 4. The outdoor measurement locations and their RSSI values with SF12.
For the simulation, the three channels in the 868MHz sub-band were used. We used 6 different SFs, so we had 18 logicalchannels in total. The SF vector was populated uniformly,while the RSSI values vector was populated randomly withvalues from the range [-110,-60] dBm. These values were theRSSI range of the values we measured at factory. The matrix

Fig. 5. Scalability simulations.
of packet transmission start time is populated based on therequirements of the trolleys update rate. This will not violatethe radio duty cycle as the update rate of the trolleys is in anycase lower than the radio duty cycle.
In Figure 5 the number of nodes that can be served by asingle gateway resulting from this simulation is shown. Upto 6000 nodes can be served with a single gateway underthe aforementioned conditions and update rates. The lostpackets line shows the percentage of packets that collided onthe preamble time and that were never received. The packetreceived with bad CRC line shows the percentage of packetsthat were collided on the payload time and the total line is theaddition of both previous ones. For number lower than 3500end devices per gateway the total losses will be lower than6%.
The simulation model takes into consideration only thedeployment of networks with single gateway. If there will betwo gateways in each other proximity then the scalability canbe increased as the packets that experience collisions as seenfrom the first gateway can be picked up by the other gateway.Another factor impacting the scalability of the network is theinterference caused by other technologies that operate in thesame band. This is not considered in this case.
VI. CONCLUSION AND FUTURE WORK
In this paper, we showed the coverage and performanceresults for an LPWAN indoor deployment. We deployed a Lo-RaWAN network with a single gateway and a single networkserver. The measurements to determine the coverage area andthe performance were performed in a real indoor industrialenvironment, namely a flower auction warehouse. In mostcases, the communication path between the LoRaWAN enddevice and the gateway was blocked by the metallic flowertrolleys.
Based on the measurements we can conclude that we areable to cover the whole industrial area under consideration,with a surface of 34000 m2, with SF 7. In general, theSNR values were above 0 dB with some negative values atsome measuring locations. The average RSSI values wereabove -100 dBm at all measuring locations. We did not haveany packet losses except some negligible number of packets
received with wrong payload CRC (0.5 - 0.8%) for the indoormeasuring points.
For the outdoor measuring locations, we could have com-munication only with SF 12 with the most distant measuringpoint, at 400 m. At those points, we had up to 6% of packetsreceived with wrong CRC. Communication using SF 7 wasnot possible. The average SNR values were negative with anegative peak of -16.4 dB.
To calculate the network scalability in such an environmentwe made use of a simulation model. We took into account theupdate rate of the end devices: 75% of the nodes sending a 20byte packet every hour and 25% of them sending a 20 bytepacket every 5 minutes. In such a network configuration, weare able to serve up to 6000 end nodes while keeping packetloss ratio below 10%.
By adding a second gateway the number of end nodes thatcan be served can be further increased. However, this needsto be evaluated beforehand. The simulation model mentionedin this paper could be extended by taking into account thereception of packets by two gateways simultaneously, whichwill increase the guarantees that the packet will be receivedas well as the total network performance.
ACKNOWLEDGMENT
HYCOWARE is a project realized in collaboration withimec. Project partners are Egemin, Aucxis and Intation, withproject supported by VLAIO (Flanders Innovation and En-trepreneurship).
REFERENCES
[1] Drath, R. and Horch, A., Industrie 4.0: Hit or Hype? IEEE IndustrialElectronics Magazine, Vol. 8, 2014, pp. 56-58.
[2] https://www.lora-alliance.org/what-is-lora/technology[3] https://www.sigfox.com/[4] How RPMA Works, A White Paper by INGENU.[5] Landstrom, S., et al. ”NB-IoT: A sustainable technology for connecting
billions of devices”, Ericsson Technology Review, 22 April 2016[6] http://www.nwave.io/[7] ”A comparision of UNB and spread spectrum wireless technologies as
used in LPWA M2M applications”, A white paper by Real Wireless.[8] Haxhibeqiri, J, et al. ”Wireless handover performance in industrial envi-
ronments: A case study.” Emerging Technologies and Factory Automation(ETFA), 2016 IEEE 21st International Conference on. IEEE, 2016. doi:10.1109/ETFA.2016.7733578
[9] Gong, X., et al. A Measurement-Based Wireless Network Planning, Mon-itoring, and Reconfiguration Solution for Robust Radio Communicationsin Indoor Factories, IET Science, Measurement & Technology, 2015. doi:10.1049/iet-smt.2015.0213
[10] Augustin, A., et al. ”A Study of LoRa: Long Range & Low PowerNetworks for the Internet of Things.” Sensors 16.9 (2016): 1466.doi:10.3390/s16091466
[11] Centenaro, M., et al. ”Long-range communications in unlicensed bands:The rising stars in the IoT and smart city scenarios.” arXiv preprintarXiv:1510.00620 (2015). doi: 10.1109/MWC.2016.7721743
[12] Petajajarvi, J., et al. ”On the coverage of LPWANs: range evaluationand channel attenuation model for LoRa technology.” ITS Telecommuni-cations (ITST), 2015 14th International Conference on. IEEE, 2015. doi:10.1109/ITST.2015.7377400
[13] Neumann, P., et al. ”Indoor Deployment of Low-Power Wide AreaNetworks (LPWAN): a LoRaWAN case study.”, IEEE 12th Interna-tional Conference on Wireless and Mobile Computing, Networkingand Communications (WiMob), New York, NY, 2016, pp. 1-8. doi:10.1109/WiMOB.2016.7763213

[14] Petjjrvi, J., et al. ”Evaluation of LoRa LPWAN technology for remotehealth and wellbeing monitoring.” 2016 10th International Symposiumon Medical Information and Communication Technology (ISMICT). 2016.doi: 10.1109/ISMICT.2016.7498898
[15] Vangelista, L., Zanella, A. and Zorzi, M. ”Long-Range IoT Technolo-gies: The Dawn of LoRa.” Future Access Enablers of Ubiquitous andIntelligent Infrastructures. Springer International Publishing, 2015.
[16] Goursaud, C. and Gorce, J.M. ”Dedicated networks for IoT: PHY/MACstate of the art and challenges.” EAI endorsed transactions on Internet ofThings (2015).
[17] Voigt, T., et al. ”Mitigating Inter-network Interference in LoRa Net-works.” arXiv preprint arXiv:1611.00688 (2016).
[18] Reynders, B. and Pollin, S., ”Chirp spread spectrum as a modulationtechnique for long range communication,” 2016 Symposium on Commu-nications and Vehicular Technologies (SCVT), Mons, 2016, pp. 1-5. doi:10.1109/SCVT.2016.7797659
[19] Mikhaylov, K., Petaejaejaervi, J. and Haenninen, T. ”Analysis of Capac-ity and Scalability of the LoRa Low Power Wide Area Network Tech-nology,” European Wireless 2016; 22th European Wireless Conference,Oulu, Finland, 2016, pp. 1-6.
[20] Seller, O. B. A., and Sornin, N., ”Low power long range transmitter.”EP 2763321A1, issued Aug 6, 2014.
[21] LoRaWANTM Specifications, V1.0, January 2015.[22] ETSI, ERM TG28. ”Electromagnetic compatibility and Radio spectrum
Matters (ERM); Short Range Devices (SRD); Radio equipment to be usedin the 25 MHz to 1 000 MHz frequency range with power levels rangingup to 500 mW.” European harmonized standard EN 300.220: v2.
[23] Royal Flora Holland company website, Retrieved onJanuary 23, 2017,from https://www.royalfloraholland.com.
[24] Ideetron company products website, Retrieved onJanuary 23, 2017, fromhttp://www.ideetron.nl/lora/
[25] WiMOD iC880A v0.15, Datasheet, IMST GmbH, March 3, 2015.[26] WiMOD iM880A v0.8, Datasheet, IMST GmbH, July 27, 2013.[27] Haxhibeqiri, J.; Van den Abeele, F.; Moerman, I.; Hoebeke, J. LoRa
Scalability: A Simulation Model Based on Interference Measurements.Sensors 2017, 17, 1193. doi: 10.3390/s17061193