Lopsided Nature of Alumni Giving Part 2 · THE LOPSIDED NATURE OF ALUMNI GIVING (PART TWO) Guest...
26
THE LOPSIDED NATURE OF ALUMNI GIVING (PART TWO) Guest post by Peter Wylie, January 10, 2018 Back in March of 2013 I wrote a guest post for CoolData called the Lopsided Nature of Alumni Giving. It’s time to revisit the concept, but given that this new piece follows directly from the original piece, it’s helpful to read (or re-read) Part One. Rather than have you click a link to bring that piece up, we’ve decided to embed it into this piece. I figured that if we didn’t repeat it for you here, fussy cusses like me wouldn’t read the original one. Switching back and forth between the old and the new is a pain. Of course, you can skip ahead to the new posting (found on page 14), but all irreverence aside, Kevin and I hope you don’t do that. THE LOPSIDED NATURE OF ALUMNI GIVING Guest post by Peter Wylie, CoolData Blog, 21 March 2013 Eight years ago I wrote a piece called “Sports, Fund Raising, and the 80/20 Rule” It had to do with how most alumni giving in higher education comes from a very small group of former students. Nobody was shocked or awed by the article. The sotto voce response seemed to be, "Thanks, Pete. We got that. Tell us something we don't know." That's okay. It's like my jokes. A lot of ‘em don't get more than a polite laugh; some get stone silence. Anyway, time passed and I started working closely with John Sammis. Just about every week we'd look at a new alumni database, and over and over, we'd see the same thing. The top one percent of alumni givers had donated more than the other ninety-nine percent. Finally, I decided to take a closer look at the lifetime giving data from seven schools that I thought covered a wide spectrum of higher education institutions in North America. Once again, I saw this huge lopsided phenomenon where a small, small group of alums were accounting for a whopping portion of the giving in each school. That's when I went ahead and put this piece together.
Transcript of Lopsided Nature of Alumni Giving Part 2 · THE LOPSIDED NATURE OF ALUMNI GIVING (PART TWO) Guest...

THE LOPSIDED NATURE OF ALUMNI GIVING (PART TWO)
Guest post by Peter Wylie, January 10, 2018
Back in March of 2013 I wrote a guest post for CoolData called the Lopsided Nature of Alumni Giving. It’s time to revisit the concept, but given that this new piece follows directly from the original piece, it’s helpful to read (or re-read) Part One.
Rather than have you click a link to bring that piece up, we’ve decided to embed it into this piece. I figured that if we didn’t repeat it for you here, fussy cusses like me wouldn’t read the original one. Switching back and forth between the old and the new is a pain.
Of course, you can skip ahead to the new posting (found on page 14), but all irreverence aside, Kevin and I hope you don’t do that.
THE LOPSIDED NATURE OF ALUMNI GIVING Guest post by Peter Wylie, CoolData Blog, 21 March 2013 Eight years ago I wrote a piece called “Sports, Fund Raising, and the 80/20 Rule” It had to do with how most alumni giving in higher education comes from a very small group of former students. Nobody was shocked or awed by the article. The sotto voce response seemed to be, "Thanks, Pete. We got that. Tell us something we don't know." That's okay. It's like my jokes. A lot of ‘em don't get more than a polite laugh; some get stone silence. Anyway, time passed and I started working closely with John Sammis. Just about every week we'd look at a new alumni database, and over and over, we'd see the same thing. The top one percent of alumni givers had donated more than the other ninety-nine percent. Finally, I decided to take a closer look at the lifetime giving data from seven schools that I thought covered a wide spectrum of higher education institutions in North America. Once again, I saw this huge lopsided phenomenon where a small, small group of alums were accounting for a whopping portion of the giving in each school. That's when I went ahead and put this piece together.

2
What makes this one any different from the previous piece? For one thing, I think it gives you a more granular look at the lopsidedness, sort of like Google Maps allows you to really focus in on the names of tiny streets in a huge city. But more importantly, for this one I asked several people in advancement whose opinions I respect to comment on the data. After I show you that data, I'll summarize some of what they had to say, and I'll add in some thoughts of my own. After that, if you have a chance, I'd love to hear what you think.
The Data
I mentioned above that I looked at data from seven schools. After some agonizing, I decided I would end up putting you to sleep if I showed you all seven. So I chopped it down to four. Believe me, four is enough to make the point.
Here’s how I’ve laid out the data:
• For each of the four schools I ranked only the alumni givers (no other constituencies) into deciles (10 groups), centiles (100 groups), and milliles (1,000 groups), by total lifetime hard credit giving. (There is actually no such word as “milliles” in English; I have borrowed from the French.)
• In the first table in each set I’ve included all the givers. In the second table I’ve included only the top ten percent of givers. And in the third table I’ve included only the top one percent of givers. (The chart following the third table graphically conveys some of the information included in the third table.)
To make sure all this is clear, let’s go through the data for School A. Take a look at Table 1. It shows the lifetime giving for all alumni donors at the school divided into ten equal size groups called deciles. Notice that the alums in decile 10 account for over 95% of that giving. Conversely, the alums in decile 1 account for two tenths of one percent of the giving.

3
Table 1: Amount and Percentage of Total Lifetime Giving in School A
for all Alumni by Giving Decile
Moving on to Table 2. Here we’re looking at only the top decile of alumni givers divided into one percent groups. What jumps out from this table is that the top one percent of all givers account for more than 80% of alumni lifetime giving. That’s five times as much as the remaining 99% of alumni givers.
Table 2: Amount and Percentage of Total Lifetime Giving at School A
for Top Ten Percent of Alumni Donors
PERCENTILE CountTOTALGIVING
PERCENTAGEOFTOTALGIVING
91 238 $849,161 0.44%92 237 $1,025,680 0.53%93 238 $1,256,880 0.65% 94 237 $1,580,390 0.82%95 238 $2,100,300 1.08%96 237 $2,822,880 1.46%97 238 $3,867,230 2.00%98 237 $5,647,390 2.92%99 238 $9,843,550 5.08%
100 237 $156,186,000 80.65%
DECILE Count TOTALGIVING
PERCENTAGEOFTOTALGIVING
1 2376 $32,694 0.02%2 2375 $60,673 0.03%3 2375 $108,820 0.06%4 2375 $184,121 0.10%5 2375 $302,300 0.16%6 2375 $549,092 0.28%7 2375 $969,034 0.50%8 2375 $1,828,900 0.94%9 2375 $4,446,480 2.30%
10 2375 $185,180,000 95.62%
4
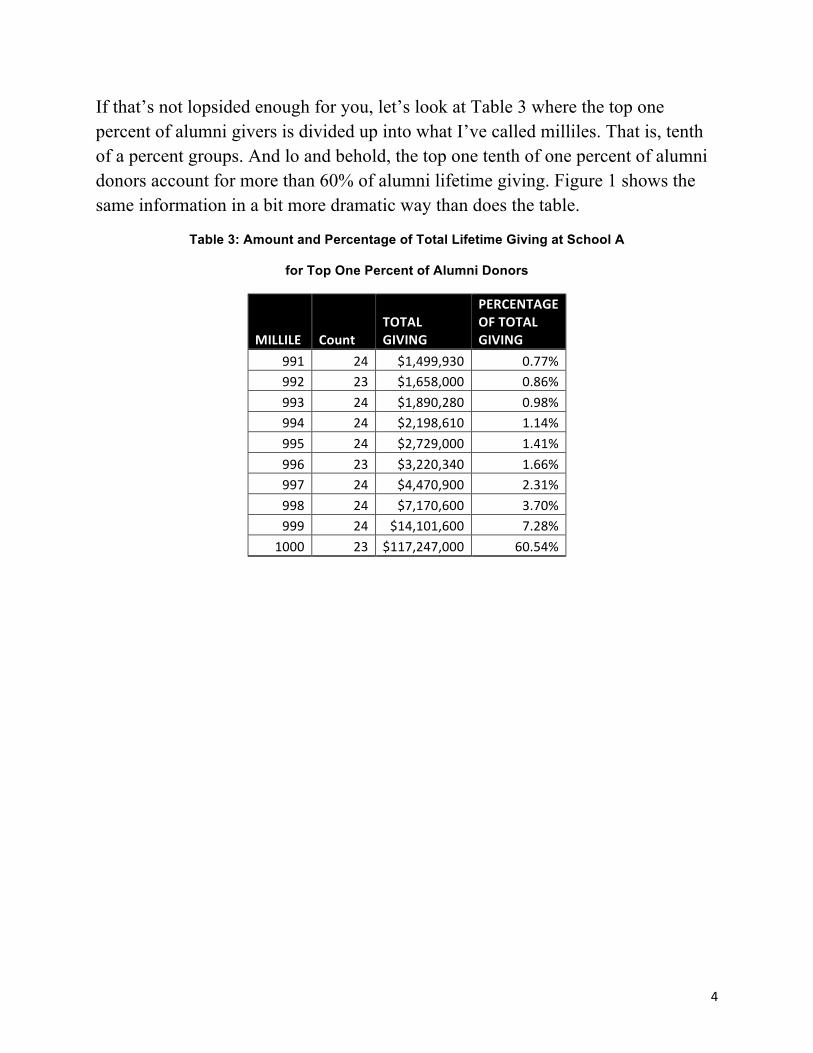
If that’s not lopsided enough for you, let’s look at Table 3 where the top one percent of alumni givers is divided up into what I’ve called milliles. That is, tenth of a percent groups. And lo and behold, the top one tenth of one percent of alumni donors account for more than 60% of alumni lifetime giving. Figure 1 shows the same information in a bit more dramatic way than does the table.
Table 3: Amount and Percentage of Total Lifetime Giving at School A
for Top One Percent of Alumni Donors
MILLILE CountTOTALGIVING
PERCENTAGEOFTOTALGIVING
991 24 $1,499,930 0.77%992 23 $1,658,000 0.86%993 24 $1,890,280 0.98%994 24 $2,198,610 1.14%995 24 $2,729,000 1.41%996 23 $3,220,340 1.66%997 24 $4,470,900 2.31%998 24 $7,170,600 3.70%999 24 $14,101,600 7.28%
1000 23 $117,247,000 60.54%

5
What I’d recommend is that you go through the same kinds of tables and charts laid out below for Schools B, C, and D. Go as fast or as slowly as you’d like. Being somewhat impatient, I would focus on Figures 2-4. I think that’s where the real punch in these data resides.
0.77% 0.86% 0.98% 1.14% 1.41% 1.66% 2.31% 3.70%7.28%
60.54%
0.00%
10.00%
20.00%
30.00%
40.00%
50.00%
60.00%
70.00%
991 992 993 994 995 996 997 998 999 1000TOPONEPERCENTOFALUMNIDONORS
Fig.1:PercentageofTotalLifeBmeGivingatSchoolAforTopOnePercentofAlumniDonors

6
Table 4: Amount and Percentage of Total Lifetime Giving in School B
for all Alumni by Giving Decile
DECILE CountTOTALGIVING
PERCENTAGEOFTOTALGIVING
1 5003 $63,252 0.03%2 5003 $153,077 0.08%3 5003 $306,781 0.17%4 5003 $562,824 0.31%5 5003 $992,263 0.54%6 5003 $1,688,920 0.92%7 5003 $2,925,780 1.59%8 5003 $5,192,870 2.83%9 5003 $10,632,800 5.79%
10 5002 $161,261,000 87.75%
Table 5: Amount and Percentage of Total Lifetime Giving at School B
for Top Ten Percent of Alumni Donors
PERCENTILE CountTOTALGIVING
PERCENTAGEOFTOTALGIVING
91 500 $1,733,040 0.94%92 500 $1,958,830 1.07%93 500 $2,244,520 1.22%94 501 $2,661,210 1.45%95 500 $3,156,340 1.72%96 500 $3,888,850 2.12%97 501 $5,097,380 2.77%98 500 $7,120,280 3.87%99 500 $12,409,500 6.75%
100 500 $120,991,000 65.83%

7
Table 6: Amount and Percentage of Total Lifetime Giving at School B
for Top One Percent of Alumni Donors
MILLILE CountTOTALGIVING
PERCENTAGEOFTOTALGIVING
991 50 $1,895,150 1.03%992 50 $2,147,120 1.17%993 50 $2,489,700 1.35%994 50 $2,903,630 1.58%995 50 $3,518,480 1.91%996 50 $4,461,800 2.43%997 50 $5,735,260 3.12%998 50 $7,758,370 4.22%999 50 $14,018,000 7.63%
1000 50 $76,063,200 41.39%
1.03% 1.17% 1.35% 1.58% 1.91% 2.43% 3.12% 4.22%7.63%
41.39%
0.00%
5.00%
10.00%
15.00%
20.00%
25.00%
30.00%
35.00%
40.00%
45.00%
991 992 993 994 995 996 997 998 999 1000TOPONEPERCENTOFALUMNIDONORS
Fig.2:PercentageofTotalLifeBmeGivingatSchoolBforTopOnePercentofAlumniDonors

8
Table 7: Amount and Percentage of Total Lifetime Giving in School C
for all Alumni by Giving Decile
DECILE CountTOTALGIVING
PERCENTAGEOFTOTALGIVING
1 2033 $15,757 0.12%2 2032 $36,545 0.27%3 2033 $51,426 0.38%4 2032 $80,620 0.59%5 2032 $113,205 0.83%6 2033 $180,941 1.33%7 2032 $248,437 1.83%8 2033 $411,174 3.02%9 2032 $778,122 5.72%
10 2032 $11,695,700 85.92%
Table 8: Amount and Percentage of Total Lifetime Giving at School C
for Top Ten Percent of Alumni Donors
PERCENTILE CountTOTALGIVING
PERCENTAGEOFTOTALGIVING
91 203 $119,166 0.88%92 204 $133,595 0.98%93 203 $149,786 1.10%94 203 $175,402 1.29%95 203 $205,382 1.51%96 204 $252,808 1.86%97 203 $326,366 2.40%98 203 $468,507 3.44%99 203 $889,582 6.54%
100 203 $8,975,090 65.94%

9
Table 9: Amount and Percentage of Total Lifetime Giving at School C
for Top One Percent of Alumni Donors
MILLILE CountTOTALGIVING
PERCENTAGEOFTOTALGIVING
991 21 $155,953 1.15%992 20 $176,455 1.30%993 20 $205,685 1.51%994 21 $275,453 2.02%995 20 $323,743 2.38%996 20 $415,513 3.05%997 21 $580,063 4.26%998 20 $828,802 6.09%999 20 $1,244,350 9.14%
1000 20 $4,769,070 35.04%
1.15% 1.30% 1.51% 2.02% 2.38% 3.05% 4.26% 6.09%9.14%
35.04%
0.00%
5.00%
10.00%
15.00%
20.00%
25.00%
30.00%
35.00%
40.00%
991 992 993 994 995 996 997 998 999 1000TOPONEPERCENTOFALUMNIDONORS
Fig.3:PercentageofTotalLifeBmeGivingatSchoolCforTopOnePercentofAlumni
Donors
10
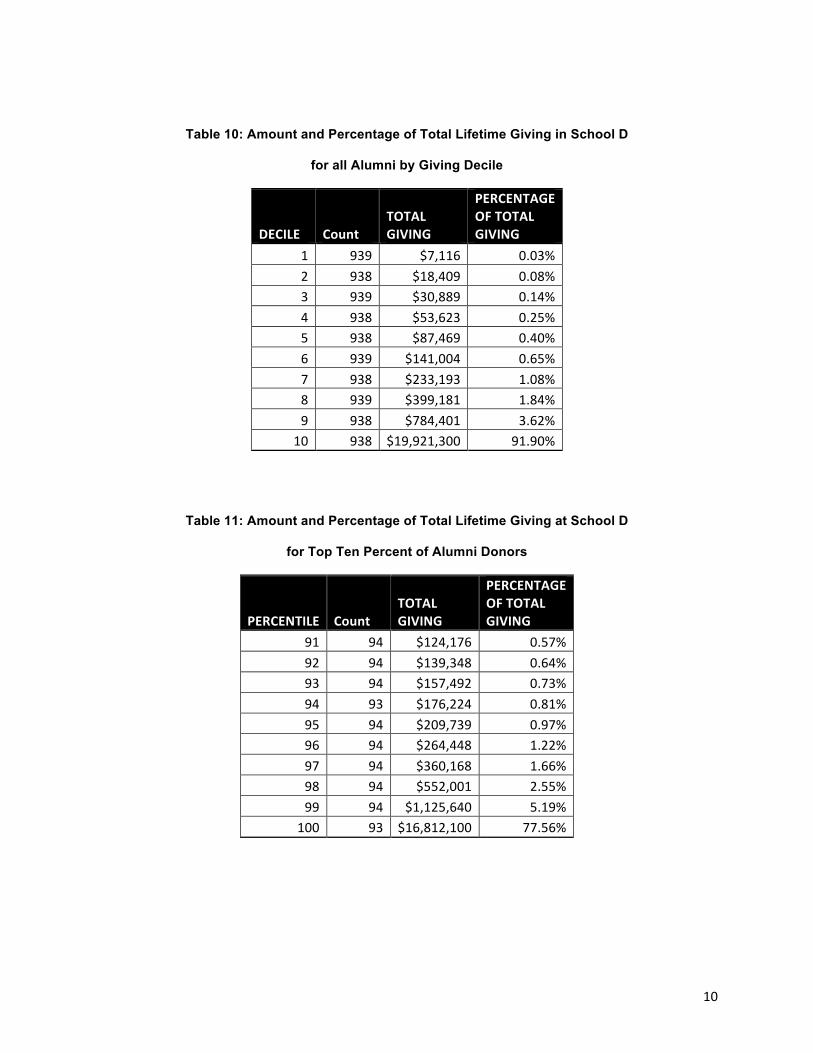
Table 10: Amount and Percentage of Total Lifetime Giving in School D
for all Alumni by Giving Decile
DECILE CountTOTALGIVING
PERCENTAGEOFTOTALGIVING
1 939 $7,116 0.03%2 938 $18,409 0.08%3 939 $30,889 0.14%4 938 $53,623 0.25%5 938 $87,469 0.40%6 939 $141,004 0.65%7 938 $233,193 1.08%8 939 $399,181 1.84%9 938 $784,401 3.62%
10 938 $19,921,300 91.90%
Table 11: Amount and Percentage of Total Lifetime Giving at School D
for Top Ten Percent of Alumni Donors
PERCENTILE CountTOTALGIVING
PERCENTAGEOFTOTALGIVING
91 94 $124,176 0.57%92 94 $139,348 0.64%93 94 $157,492 0.73%94 93 $176,224 0.81%95 94 $209,739 0.97%96 94 $264,448 1.22%97 94 $360,168 1.66%98 94 $552,001 2.55%99 94 $1,125,640 5.19%
100 93 $16,812,100 77.56%

11
Table 12: Amount and Percentage of Total Lifetime Giving at School D
for Top One Percent of Alumni Donors
MILLILE CountTOTALGIVING
PERCENTAGEOFTOTALGIVING
991 9 $168,072 0.78%992 9 $194,224 0.90%993 10 $254,785 1.18%994 9 $261,628 1.21%995 10 $370,048 1.71%996 9 $464,568 2.14%997 9 $715,114 3.30%998 10 $1,345,370 6.21%999 9 $2,632,040 12.14%
1000 9 $10,406,300 48.01%
0.78% 0.90% 1.18% 1.21% 1.71% 2.14% 3.30%6.21%
12.14%
48.01%
0.00%
10.00%
20.00%
30.00%
40.00%
50.00%
60.00%
991 992 993 994 995 996 997 998 999 1000TOPONEPERCENTOFALUMNIDONORS
Fig.4:PercentageofTotalLifeBmeGivingatSchoolDforTopOnePercentofAlumni
Donors

12
When I boil down to its essence what you’ve just looked at for these three schools, here’s what I see:
• In School B over the half of the total giving is accounted for by three tenths of one percent of the givers.
• In School C we have pretty much the same situation as we have in School B. • In School D over 60% of the total giving is accounted for by two tenths of
one percent of the givers.
What Some People in Advancement have to Say about All This
Over the years I’ve gotten to know a number of thoughtful/idea-oriented folks in advancement. I asked several of them to comment on the data you’ve just seen. To protect the feelings of the people I didn’t ask, I’ll keep the commenters anonymous. They know who they are, and they know how much I appreciate their input.
Here are a few of the many helpful observations they made:
Most of the big money in campaigns and other advancement efforts does not come from alumni. I’m a bit embarrassed to admit that I had forgotten this fact. CASE puts out plenty of literature that confirms this. It is “friends” who carry the big load in higher education fundraising. At least two of the commenters pointed out that we could look at that fact as a sad commentary on the hundreds and hundreds of thousands of alums who give little or nothing to their alma maters. However, both felt it was better to look at these meager givers as an untapped resource that we have to do a better job of reaching.
The data we see here reflect the distribution of wealth in society. The commenter said, “There simply are very few people who have large amounts of disposable wealth and a whole lot of hard working folks who are just trying to participate in making a difference.” I like this comment; it jibes with my sense of the reality out there.
“It is easier (and more comfortable) to work with donors rather than prospective donors.” The commenter went on to say: “The wealthier the

13
constituency the more you can get away with this approach because you have enough people who can make mega-gifts and that enables you to avoid building the middle of the gift pyramid.” This is very consistent with what some other commenters had to say about donors in the middle of the pyramid – donors who don’t get enough attention from the major giving folks in advancement.
Most people in advancement ARE aware of the lopsidedness. All of the commenters said they felt people in advancement were well aware of the lopsided phenomenon, perhaps not to the level of granularity displayed in this piece. But well aware, nonetheless.
What you see in this piece underestimates the skew because it doesn’t include non-givers. I was hoping that none of the commenters would bring up this fact because I had not (and still have not) come up with a clear, simple way to convey what the commenter had pointed out. But let’s see if I can give you an example. Look at Figure 4. It shows that one tenth of one percent of alumni givers account for over 48% of total alumni giving. However, let’s imagine that half of the solicitable alumni in this school have given nothing at all. Okay, if we now double the base to include all alums, not just alum givers, then what happens to the percentage size of that top one tenth of one percent of givers? It’s no longer one tenth of one percent; it’s now one twentieth of one percent. If you’re confused, let’s ask someone else reading this thing to explain it. I’m spinning my wheels.
One More Thought from Me
But here's a thought that I've had for a long time. When I look at the incredible skewness that we see in the top one percent of alumni donors, I say, "WHY?!" Is the difference among the top millile and the bottom millile in that top one percent simply a function of capacity to give? Maybe it is, but I'd like to know. And then I say, call me crazy, LET'S FIND OUT! Not with some online survey. That won’t cut it. Let's hire a first rate survey research team to go out and interview these folks (we're not talking a lot of people here). Would that cost some money to go out and get these answers? Yes, and it would be worth every penny of it. The potential funding sources I’ve talked to yawn at the idea. But I'll certainly never let go of it.

14
The Lopsided Nature of Alumni Giving, Part 2
Okay, on to the new stuff.
With the four schools we used in the original piece, we could not look at giving over time. We could only look at total lifetime giving. With the two schools we’ve used for this piece, things were different. We could look at what alums had given a number of years ago, and we could look at what they’d given more recently. We had a chance to see how the lopsided giving a number of years ago had held up (or not) over time. We found some intriguing stuff. Let’s see if you agree.
WhatWeDid
To avoid confusion with the four schools in the first piece, which we’d labeled A, B, C, and D, we’ve called the two schools in this piece E and F. They’re both four year higher education institutions located in markedly different regions of North America. One is private; one is public.
The giving we looked at was hard credit for all “solicitable” alums. (That is, these were living alums who could be reached by phone or email or snail mail or some combination of the three.) For both schools we had total lifetime giving as well as giving for each of the last ten fiscal years.
What we’ll show you now will get a bit detailed. We’ll take it slow. If it gets too slow, go ahead and skip to points where we provide summaries. (Just a heads up: We’ll be using the terms “deciles,” “percentiles,” and “milliles” throughout the rest of the piece. These terms are all explained in the first piece.)
The first thing we did was isolate all the alums who had given anything at all prior to the year on which we had individual fiscal year data. For School E that was FY 2006; for School F that was FY 2005. Take a look at Tables 1 and 2 below. (Pay particular attention to the rightmost column in each table.) We’ll join up with you below the tables.

15
Table1:AmountandPercentageofTotalLifetimeGivingPriorto
FY2006inSchoolEbyGivingDecile
Decile CountTOTALGIVING
PERCENTAGEOFTOTALGIVING
1 753 $4 0.0%2 753 $10 0.0%3 753 $175 0.0%4 752 $16,896 .01%5 753 $45,441 .26%6 753 $95,999 .54%7 752 $195,429 1.1%8 753 $391,610 2.2%9 753 $895,131 5.1%10 752 $15,831,400 90.6%
Table2:AmountandPercentageofTotalLifetimeGivingPriorto
FY2005inSchoolFbyGivingDecile
Decile CountTOTALGIVING
PERCENTAGEOFTOTALGIVING
1 9068 $188,441 0.06%2 9067 $276,613 0.08%3 9067 $465,559 0.14%4 9067 $799,526 0.24%5 9067 $1,030,020 0.31%6 9067 $1,634,860 0.49%7 9067 $2,655,130 0.80%8 9067 $4,630,270 1.40%9 9067 $9,851,570 2.97%10 9067 $310,027,000 93.51%
These tables look remarkably similar to the decile tables we saw in the first piece. The lion’s share of the giving is coming from the tenth decile. So that you don’t have to scroll back to the first piece, we’ve listed the percentage of giving in the tenth decile for all six schools. (We’ve highlighted Schools E and F):

16
A:95.6%
B:87.8%
C:85.9%
D:91.9%
E:90.6%
F:93.8%
Moving on to Tables 3 and 4. Here we’re looking at only the top decile of alumni givers divided into one percent groups. Same drill. Look at the tables. Pay particular attention to the rightmost column in each table. Then we’ll join up with you below the tables.
Table3:AmountandPercentageofTotalLifetimeGivingPriorto
FY2006atSchoolEforTopTenPercentofDonors
Percentile CountTOTALGIVING
PERCENTAGEOFTOTALGIVING
91 75 $154,548 0.8%92 75 $179,266 1.0%93 76 $209,277 1.2%94 75 $247,187 1.4%95 75 $297,728 1.7%96 75 $369,410 2.1%97 76 $504,615 2.9%98 75 $752,852 4.3%99 75 $1,326,830 7.6%100 75 $11,789,700 67.5%

17
Table4:AmountandPercentageofTotalLifetimeGivingPriorto
FY2005atSchoolFforTopTenPercentofDonors
Percentile CountTOTALGIVING
PERCENTAGEOFTOTALGIVING
91 907 $1,752,150 0.53%92 907 $2,067,590 0.62%93 907 $2,497,070 0.75%94 906 $3,086,000 0.93%95 907 $3,979,290 1.20%96 907 $5,366,350 1.62%97 906 $7,621,490 2.30%98 907 $11,386,800 3.43%99 907 $21,666,100 6.53%
100 906 $250,604,000 75.58%
Again, these tables look remarkably similar to the corresponding tables we saw in the first piece. The lion’s share of the giving is coming from the top one percent of all givers. And again, so you don’t have to scroll back to the first piece, we’ve listed the percentage of giving in the top one percent for all six schools. (We’ve highlighted Schools E and F):
A:80.7%
B:65.8%
C:65.9%
D:77.6%
E:67.5%
F:76.1%
And now moving on to Tables 5 and 6. Here we’re looking at only the top one percent of alumni givers divided into one millile groups. Same drill. Look at the tables. Pay particular attention to the right most column in each table. Then we’ll join up with you below the tables.

18
Table5:AmountandPercentageofTotalLifetimeGivingPriorto
FY2006atSchoolEforTopOnePercentofDonors
Millile CountTOTALGIVING
PERCENTAGEOFTOTALGIVING
991 8 $207,487 1.2%992 7 $203,080 1.2%993 8 $252,832 1.4%994 7 $243,144 1.4%995 8 $341,395 2.0%996 7 $396,509 2.3%997 8 $619,627 3.5%998 7 $668,021 3.8%999 8 $1,340,570 7.7%1000 7 $7,517,020 43.0%
Table6:AmountandPercentageofTotalLifetimeGivingPriorto
FY2005atSchoolFforTopOnePercentofDonors
Millile CountTOTALGIVING
PERCENTAGEOFTOTALGIVING
991 90 $3,480,040 1.05%992 91 $4,144,250 1.25%993 91 $4,793,370 1.45%994 90 $5,501,580 1.66%995 91 $6,834,700 2.06%996 91 $9,027,810 2.72%997 90 $11,785,900 3.55%998 91 $17,961,800 5.42%999 91 $32,456,800 9.79%
1000 90 $154,618,000 46.63%
And once again, these tables look remarkably similar to the corresponding tables we saw in the first piece. A huge share of the giving is coming from the top one tenth of one percent of all givers. And once again, so you don’t have to scroll back

19
to the first piece, we’ve listed the percentage of giving in the top one tenth of one percent for all six schools. (We’ve highlighted Schools E and F):
Previous four schools tenth millile:
A:60.5%
B:41.39%
C:35.0%
D:48.1%
E:43.0%
F:47.8%
A few pages back, we said the two schools we’ve used for this piece were different from the four schools we used in the original piece. Here we could look at what alums had given a number of years ago, and we could look at what they’d given more recently.
What we’ve shown you so far is what alums at Schools E and F had given up to FY 2006 and FY 2005 respectively. And we’ve found that the lopsided nature of their giving was very similar to the lopsided giving we saw in Schools A-D in the first piece.
Now comes what we think is cool. We can show you how the lopsided nature of giving for the two schools held up (or not) over the next ten fiscal years.
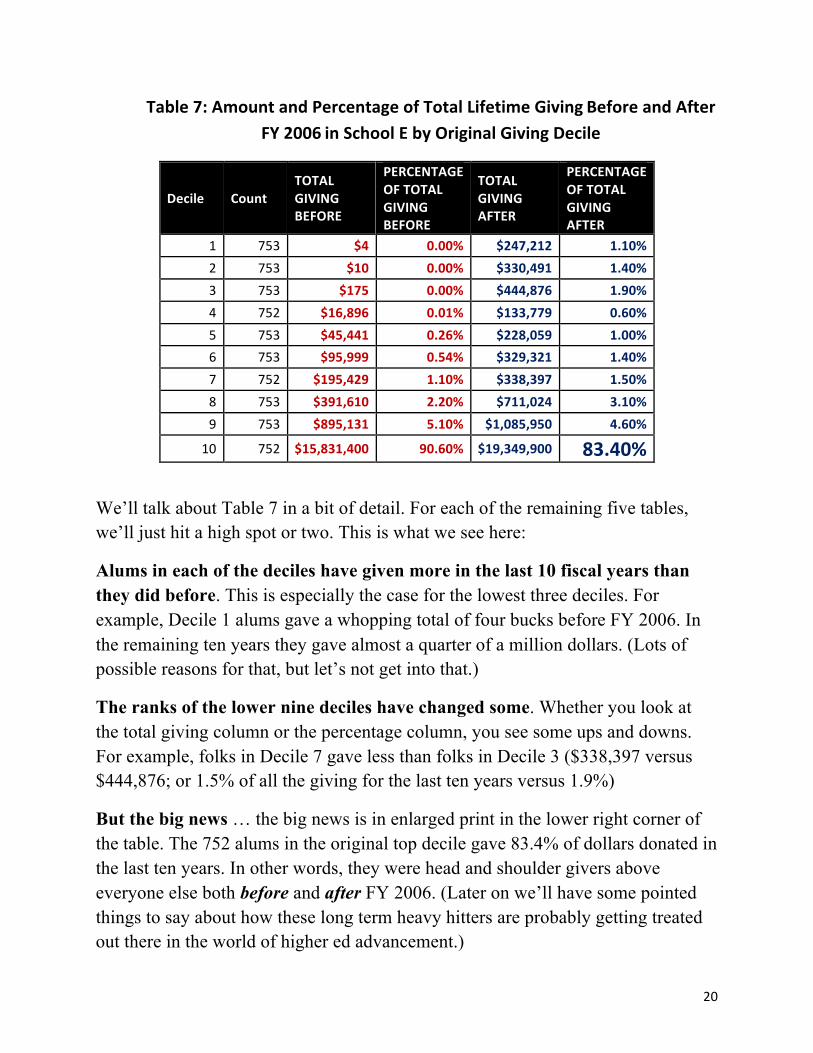
To make it clear how we did this, take a look at Table 7. What you see in the red print is something you already saw in Table 1: the amount and percentage of total lifetime giving before FY 2006 in School E by giving decile. What you see in the blue print is the amount and percentage of total lifetime giving from FY 2006 through FY 2015 in School E by original giving decile.
20
Table7:AmountandPercentageofTotalLifetimeGivingBeforeandAfterFY2006inSchoolEbyOriginalGivingDecile
Decile CountTOTALGIVINGBEFORE
PERCENTAGEOFTOTALGIVINGBEFORE
TOTALGIVINGAFTER
PERCENTAGEOFTOTALGIVINGAFTER
1 753 $4 0.00% $247,212 1.10%2 753 $10 0.00% $330,491 1.40%3 753 $175 0.00% $444,876 1.90%4 752 $16,896 0.01% $133,779 0.60%5 753 $45,441 0.26% $228,059 1.00%6 753 $95,999 0.54% $329,321 1.40%7 752 $195,429 1.10% $338,397 1.50%8 753 $391,610 2.20% $711,024 3.10%9 753 $895,131 5.10% $1,085,950 4.60%
10 752 $15,831,400 90.60% $19,349,900 83.40%
We’ll talk about Table 7 in a bit of detail. For each of the remaining five tables, we’ll just hit a high spot or two. This is what we see here:
Alums in each of the deciles have given more in the last 10 fiscal years than they did before. This is especially the case for the lowest three deciles. For example, Decile 1 alums gave a whopping total of four bucks before FY 2006. In the remaining ten years they gave almost a quarter of a million dollars. (Lots of possible reasons for that, but let’s not get into that.)
The ranks of the lower nine deciles have changed some. Whether you look at the total giving column or the percentage column, you see some ups and downs. For example, folks in Decile 7 gave less than folks in Decile 3 ($338,397 versus $444,876; or 1.5% of all the giving for the last ten years versus 1.9%)
But the big news … the big news is in enlarged print in the lower right corner of the table. The 752 alums in the original top decile gave 83.4% of dollars donated in the last ten years. In other words, they were head and shoulder givers above everyone else both before and after FY 2006. (Later on we’ll have some pointed things to say about how these long term heavy hitters are probably getting treated out there in the world of higher ed advancement.)

21
Table8:AmountandPercentageofTotalLifetimeGivingBeforeandAfterFY2005inSchoolFbyOriginalGivingDecile
Decile Count TOTALGIVINGBEFORE
PERCENTAGEOFTOTALGIVINGBEFORE
TOTALGIVINGAFTER
PERCENTAGEOFTOTALGIVINGAFTER
1 9068 $188,441 0.06% $2,631,270 0.78%2 9067 $276,613 0.08% $4,185,310 1.25%3 9067 $465,559 0.14% $2,358,320 0.70%4 9067 $799,526 0.24% $2,325,890 0.69%5 9067 $1,030,020 0.31% $4,227,450 1.26%6 9067 $1,634,860 0.49% $4,968,220 1.48%7 9067 $2,655,130 0.80% $11,708,900 3.48%8 9067 $4,630,270 1.40% $10,610,000 3.16%9 9067 $9,851,570 2.97% $33,278,700 9.90%10 9067 $310,027,000 93.51% $259,724,000 77.30%
School F is obviously a much bigger institution than is School E, but we’d say much the same things here as we did for the previous table.
In Tables 9 and 10 we’re looking at percentiles as opposed to deciles. That is, we’re looking at “before” and “after” giving for alums in percentiles 91-100. We’ve already seen the before (red) data. Now let’s look at the after (blue) data. In particular let’s look at the 100th percentile.

22
Table9:AmountandPercentageofTotalLifetimeGivingBeforeandAfterFY2006inSchoolEbyTopTenPercentiles
Percentile CountTOTALGIVINGBEFORE
PERCENTAGEOFTOTALGIVINGBEFORE
TOTALGIVINGAFTER
PERCENTAGEOFTOTALGIVINGAFTER
91 75 $154,548 0.80% $130,792 0.60%92 75 $179,266 1.00% $146,741 0.60%93 76 $209,277 1.20% $709,884 3.10%94 75 $247,187 1.40% $210,542 1.00%95 75 $297,728 1.70% $368,523 1.60%96 75 $369,410 2.10% $486,404 2.10%97 76 $504,615 2.90% $760,116 3.30%98 75 $752,852 4.30% $716,536 3.10%99 75 $1,326,830 7.60% $2,463,930 10.60%
100 75 $11,789,700 67.50% $13,356,400 57.60%
Table10:AmountandPercentageofTotalLifetimeGivingBeforeandAfterFY2005inSchoolFbyTopTenPercentiles
Percentile Count TOTALGIVINGBEFORE
PERCENTAGEOFTOTALGIVINGBEFORE
TOTALGIVING PERCENTAGEOFTOTALGIVINGAFTER
AFTER
91 907 $1,752,150 0.53% $2,889,020 0.86%92 907 $2,067,590 0.62% $5,137,620 1.53%93 907 $2,497,070 0.75% $4,905,790 1.46%94 906 $3,086,000 0.93% $4,622,490 1.38%95 907 $3,979,290 1.20% $5,810,730 1.73%96 907 $5,366,350 1.62% $9,000,130 2.68%97 906 $7,621,490 2.30% $13,605,800 4.05%98 907 $11,386,800 3.43% $16,440,000 4.89%99 907 $21,666,100 6.53% $33,965,700 10.11%100 906 $250,604,000 75.58% $163,347,000 48.62%

23
This is where we really get impressed. In Table 9 we see that the 75 alums who were in the original 100th percentile gave over 57% of the money that came from alums during the next ten years. In Table 10 the results are slightly less impressive. Nevertheless, the 906 alums who were in the original 100th percentile gave almost half (48.6%) of the money that came from alums during the next ten years.
Finally, let’s look at milliles in Tables 11 and 12. Here, of course, we’re talking about the top one percent of original givers chopped up into ten groups of one tenth of one percent. All you have to do is look at the lower left corner in enlarged blue print. Wow!
Table11:AmountandPercentageofTotalLifetimeGivingBeforeandAfterFY2006inSchoolEbyTopTenMilliles
Millile CountTOTALGIVINGBEFORE
PERCENTAGEOFTOTALGIVINGAFTER
TOTALGIVINGBEFORE
PERCENTAGEOFTOTALGIVINGAFTER
991 8 $207,487 1.20% $236,033 1.00%992 7 $203,080 1.20% $216,360 0.90%993 8 $252,832 1.40% $144,225 0.60%994 7 $243,144 1.40% $182,465 0.80%995 8 $341,395 2.00% $224,362 1.00%996 7 $396,509 2.30% $1,058,570 4.60%997 8 $619,627 3.50% $600,082 2.60%998 7 $668,021 3.80% $1,400,210 6.00%999 8 $1,340,570 7.70% $3,177,110 13.70%
1000 7 $7,517,020 43.00% $6,117,000 26.40%

24
Table12:AmountandPercentageofTotalLifetimeGivingBeforeandAfterFY2005inSchoolFbyTopTenMilliles
Millile Count TOTALGIVINGBEFORE
PERCENTAGEOFTOTALGIVINGBEFORE
TOTALGIVINGAFTER
PERCENTAGEOFTOTALGIVINGAFTER
991 90 $3,480,040 1.05% $4,925,760 1.47%992 91 $4,144,250 1.25% $9,118,430 2.71%993 91 $4,793,370 1.45% $4,116,070 1.23%994 90 $5,501,580 1.66% $5,659,090 1.68%995 91 $6,834,700 2.06% $14,588,000 4.34%996 91 $9,027,810 2.72% $6,875,720 2.05%997 90 $11,785,900 3.55% $17,147,000 5.10%998 91 $17,961,800 5.42% $17,223,600 5.13%999 91 $32,456,800 9.79% $19,115,500 5.69%
1000 90 $154,618,000 46.63% $64,578,100 19.22%
Some Final Thoughts
The thrust of this piece (as well as the original one) has been straightforward. In most higher education institutions the lion's share of the alumni giving comes from a very small group of people: loyal donors who give big and over long periods of time. These are special folks. Some may be gracious, warm, and kind. Some may be eccentric and unpredictable. And some may be enormously challenging for a myriad of reasons. But they’re all special. No doubt whatsoever about that.
I have a couple of strong opinions that I’d like to express about these donors:
1. From a scientific standpoint, we don’t know much about them. 2. From a stewardship standpoint, we don’t take particularly good care of them.
Scientifically Based Knowledge about These Donors
I’m not an expert on the scientific literature concerning who major donors are and why they give so generously, in this case, to the place they went to college. However, several years ago I worked closely with a PhD candidate who was doing

25
her dissertation on this sort of thing. As part of that process, of course, she had to do a comprehensive literature review of empirical studies done on philanthropy.
I was overwhelmed by the shoddiness of these studies. The vast majority were based on mailed out surveys, or worse, on web surveys asking people how much money they gave and where they gave it.
What I did not see were summaries of studies conducted by world class survey research organizations (like the one at the University of Michigan) where highly trained interviewers were sent out to do in-depth, one-on-one interviews. Interviews with folks like the ones we’ve identified here. Interviews that might take as long as two or more hours to conduct.
I just don’t think you can get people to feel comfortable and open up about their giving habits without such a face-to-face approach. I also think that such studies would be expensive to fund, and that is probably a big reason they have not been conducted.
But that’s not a good excuse. There is plenty of money out there to fund the studies, whether that money comes from wealthy higher ed institutions or foundations. The only proviso is that these studies need to be conducted by independent research organizations that have good reputations for doing solid applied science. For many obvious reasons, they should not be conducted by vendors that sell products and services to colleges and universities.
Who should lead the charge on getting studies like these launched? I have some ideas on that, but I’d rather discuss them over the phone with a mover and shaker in higher education. If you are one and are interested, give me a call. If you’re not a big shot and still want to call me, please do so. I’m much more interested in your passion on this matter than in your power and/or your rung on the organizational ladder.
Stewardship of These Special Donors
A few paragraphs earlier I asserted that we don’t take very good care of these donors. What do I mean by taking good care of them? Here are some examples:
• Someone from the school (let’s call that person a steward) has a relationship of many years with each of these donors.
• The steward meets at least every six months with the donor for at least an hour (preferably face-to-face, but the phone will work with some of them).

26
• During this meeting the focus is on the donor and what’s going on in his/her life, not on how much the donor will be able to kick in for the next campaign. The donor is a human being with all the joys, successes, failures, and tragedies as the rest of us. The donor is not an ATM machine.
• Given the flow of the conversation, it may be appropriate to discuss the topic of another gift, or it may not be. Either way is just fine.
I could go on, but at this point you have to be thinking, “Dude, you gotta be kidding me. That’s never gonna happen at the place I work.” Well, I’m not kidding, but you’re right. It ain’t gonna happen. No way.
On the other hand, I think it’s something to strive for. Not because this kind of stewardship will raise more money. After all, these donors will probably keep on giving big regardless of whether or not they’re effectively stewarded. Look at the evidence. I think it’s something to strive for because it’s the right thing to do. That, you will never talk me out of.
As always, we’d love to hear from you.