Looking into the brain: How can conventional, morphometric and functional MRI help in diagnosing and...
8
Looking into the brain: How can conventional, morphometric and functional MRI help in diagnosing and understanding PD? Giovanni Rizzo a,b,⇑ , Caterina Tonon a , Raffaele Lodi a a Functional MR Unit, Department of Internal Medicine, Aging and Nephrology, University of Bologna, Bologna, Italy b ‘‘IRCCS Istituto delle Scienze Neurologiche di Bologna’’ and Department of Neurological Sciences, University of Bologna, Bologna, Italy article info Article history: Available online 4 July 2012 Keywords: Parkinson’s disease Atypical parkinsonian syndromes MRI Substantia nigra Diagnosis Pathophysiology abstract In recent years an increasing number of studies have demonstrated the usefulness of different magnetic resonance (MR) techniques in diagnosing and understanding Parkinson’s disease (PD). First, several MR- based studies have identified promising markers of substantia nigra degeneration in PD for early diagno- sis and the evaluation of disease progression. Second, quantitative MR techniques have been used to improve the differential diagnosis among parkinsonian syndromes. Among these, the most reproducible and consistent are morphometry and diffusion imaging, both of which are able to detect degenerative changes of cerebral structures specifically affected in the different forms of parkinsonism. Finally, advanced MR techniques such as functional MRI, voxel-based morphometry, and diffusion tensor imag- ing have provided insights into many pathophysiological aspects of PD. Currently, the main limitation to the use of advanced MR techniques is the heterogeneity of results among previous studies. This is due not only to a combination of technical variability in terms of magnetic fields, sequences, and methodological approaches of analysis, but also most likely to the differences in the patient samples examined, given that in most studies the subjects lack a pathological diagnosis. Furthermore, most of the diagnostic studies were performed in patients with long disease duration and it is not clear whether reported MRI findings allow an accurate differential diagnosis to be performed in the early stage of disease. Among pathophys- iological studies in particular, there is currently a gap in our understanding of the link between some of the alterations described in the literature and their possible pathogenic role. This especially true of the studies focused on symptoms occurring in later stage of disease, such as L-dopa induced dyskinesia and gait impairment, at a stage when additional clinical features may bias the results. A methodological consensus and a reduction of operator dependence would allow a reduction in inhomogeneity of results related to the technical variability. Regarding the characteristics of the patients examined, future studies should include larger and more homogeneous samples. In the diagnostic setting, the patients should be examined in the early stage of the disease, longitudinal studies should be preferred and a definite path- ological diagnosis should be obtained. Ó 2012 Elsevier GmbH. All rights reserved. Introduction In the past two decades an increasing number of studies have demonstrated the usefulness of magnetic resonance (MR) tech- niques in the study of many neurological disorders, including Par- kinson’s disease (PD). The potential of MRI has been enhanced by an array of advanced approaches, each of which interrogates a different aspect of the pathophysiology. Slight structural changes can be highlighted by morphometric measurements, voxel-based morphometry (VBM) and diffusion imaging (diffusion-weighted imaging, DWI, and diffusion tensor imaging, DTI). Metabolic information can be provided by magnetic resonance spectroscopy (MRS). Brain iron content can be quantified by relaxometric tech- niques (based on the evaluation of T2, T2 ⁄ and T2 0 ) and susceptibility imaging (based on the evaluation of phase shift). Specific regional brain functions can be evaluated using the BOLD (blood oxygenation level dependent) effect in functional magnetic resonance imaging (fMRI). Thus we currently have many tools helpful in diagnosing and understanding PD. Since the advent of high magnetic field scanners several MR- based studies have identified promising markers of substantia ni- gra (SN) degeneration in PD, contributing to the early diagnosis and the evaluation of disease progression. Moreover, both conven- tional and advanced MRI have been used extensively to improve the differential diagnosis between PD and the other forms of parkinsonism. 2210-5336/$ - see front matter Ó 2012 Elsevier GmbH. All rights reserved. http://dx.doi.org/10.1016/j.baga.2012.06.001 ⇑ Corresponding author at: Istituto delle Scienze Neurologiche, Ospedale Bellaria, Via Altura 3, 40139 Bologna, Italy. Tel.: +39 051 2092747; fax: +39 051 2092751. E-mail addresses: [email protected], [email protected] (G. Rizzo). Basal Ganglia 2 (2012) 175–182 Contents lists available at SciVerse ScienceDirect Basal Ganglia journal homepage: www.elsevier.com/locate/baga
-
Upload
giovanni-rizzo -
Category
Documents
-
view
212 -
download
0
Transcript of Looking into the brain: How can conventional, morphometric and functional MRI help in diagnosing and...

Basal Ganglia 2 (2012) 175–182
Contents lists available at SciVerse ScienceDirect
Basal Ganglia
journal homepage: www.elsevier .com/locate /baga
Looking into the brain: How can conventional, morphometric and functionalMRI help in diagnosing and understanding PD?
Giovanni Rizzo a,b,⇑, Caterina Tonon a, Raffaele Lodi a
a Functional MR Unit, Department of Internal Medicine, Aging and Nephrology, University of Bologna, Bologna, Italyb ‘‘IRCCS Istituto delle Scienze Neurologiche di Bologna’’ and Department of Neurological Sciences, University of Bologna, Bologna, Italy
a r t i c l e i n f o
Article history:Available online 4 July 2012
Keywords:Parkinson’s diseaseAtypical parkinsonian syndromesMRISubstantia nigraDiagnosisPathophysiology
2210-5336/$ - see front matter � 2012 Elsevier Gmbhttp://dx.doi.org/10.1016/j.baga.2012.06.001
⇑ Corresponding author at: Istituto delle Scienze NeVia Altura 3, 40139 Bologna, Italy. Tel.: +39 051 2092
E-mail addresses: [email protected], g.rizzo@un
a b s t r a c t
In recent years an increasing number of studies have demonstrated the usefulness of different magneticresonance (MR) techniques in diagnosing and understanding Parkinson’s disease (PD). First, several MR-based studies have identified promising markers of substantia nigra degeneration in PD for early diagno-sis and the evaluation of disease progression. Second, quantitative MR techniques have been used toimprove the differential diagnosis among parkinsonian syndromes. Among these, the most reproducibleand consistent are morphometry and diffusion imaging, both of which are able to detect degenerativechanges of cerebral structures specifically affected in the different forms of parkinsonism. Finally,advanced MR techniques such as functional MRI, voxel-based morphometry, and diffusion tensor imag-ing have provided insights into many pathophysiological aspects of PD. Currently, the main limitation tothe use of advanced MR techniques is the heterogeneity of results among previous studies. This is due notonly to a combination of technical variability in terms of magnetic fields, sequences, and methodologicalapproaches of analysis, but also most likely to the differences in the patient samples examined, given thatin most studies the subjects lack a pathological diagnosis. Furthermore, most of the diagnostic studieswere performed in patients with long disease duration and it is not clear whether reported MRI findingsallow an accurate differential diagnosis to be performed in the early stage of disease. Among pathophys-iological studies in particular, there is currently a gap in our understanding of the link between some ofthe alterations described in the literature and their possible pathogenic role. This especially true of thestudies focused on symptoms occurring in later stage of disease, such as L-dopa induced dyskinesiaand gait impairment, at a stage when additional clinical features may bias the results. A methodologicalconsensus and a reduction of operator dependence would allow a reduction in inhomogeneity of resultsrelated to the technical variability. Regarding the characteristics of the patients examined, future studiesshould include larger and more homogeneous samples. In the diagnostic setting, the patients should beexamined in the early stage of the disease, longitudinal studies should be preferred and a definite path-ological diagnosis should be obtained.
� 2012 Elsevier GmbH. All rights reserved.
Introduction
In the past two decades an increasing number of studies havedemonstrated the usefulness of magnetic resonance (MR) tech-niques in the study of many neurological disorders, including Par-kinson’s disease (PD). The potential of MRI has been enhanced byan array of advanced approaches, each of which interrogates adifferent aspect of the pathophysiology. Slight structural changescan be highlighted by morphometric measurements, voxel-basedmorphometry (VBM) and diffusion imaging (diffusion-weightedimaging, DWI, and diffusion tensor imaging, DTI). Metabolic
H. All rights reserved.
urologiche, Ospedale Bellaria,747; fax: +39 051 2092751.ibo.it (G. Rizzo).
information can be provided by magnetic resonance spectroscopy(MRS). Brain iron content can be quantified by relaxometric tech-niques (based on the evaluation of T2, T2⁄ and T2
0) and susceptibility
imaging (based on the evaluation of phase shift). Specific regionalbrain functions can be evaluated using the BOLD (blood oxygenationlevel dependent) effect in functional magnetic resonance imaging(fMRI). Thus we currently have many tools helpful in diagnosingand understanding PD.
Since the advent of high magnetic field scanners several MR-based studies have identified promising markers of substantia ni-gra (SN) degeneration in PD, contributing to the early diagnosisand the evaluation of disease progression. Moreover, both conven-tional and advanced MRI have been used extensively to improvethe differential diagnosis between PD and the other forms ofparkinsonism.

176 G. Rizzo et al. / Basal Ganglia 2 (2012) 175–182
Finally, advanced MR techniques such as fMRI, VBM, and diffu-sion imaging have provided insights into many pathophysiologicalaspects of PD symptomatology including motor and non-motorsymptoms.
Recent advances
Markers of substantia nigra degeneration
One of the major goals in the study of PD is to identify a reliableand reproducible in vivo marker of substantia nigra (SN) degener-ation. The most widely used MRI approach for identifying nigralneuron involvement in PD is the quantification of local iron con-tent, as iron accumulation is secondarily associated with neurode-generation [1]. Increased deposits of iron in SN were disclosedin vivo using magnetic resonance (MR) techniques based on theinfluence of iron content on T2, T2⁄ and T20, and R2 (=1/T2), R2⁄
(=1/T2⁄) and R20 (1/T20) relaxation times, although large discrepan-cies exist in the quantitative levels reported depending on themagnetic field used and the method applied. When local iron con-tent are increased T2, T2⁄ and T20 are reduced and R2, R2⁄ and R20
are increased [2]. Reduced T2 relaxation time corresponding to ahypointensity on T2-weighted images was detected in substantianigra of PD patients [3]. R2 increase in the SN was also detectedin young-onset PD patients [4]. Relaxometry studies with both1.5 and 3 Tesla MRI scanners disclosed increased R20 and R2⁄ inthe substantia nigra of patients with PD, indicative of elevated ironlevels, which correlated with motor performance and disease dura-tion [5,6]. Recent studies using 3 Tesla MRI and R2⁄ evaluationhave demonstrated more localized abnormalities, at level of thelateral substantia nigra pars compacta, in PD patients, consistentwith increased iron content, correlating with UPDRS scores andmore accurately corresponding to the known distribution ofneuronal loss occurring in this disorder [7,8]. Another interestingrelaxometric method evaluated neuronal-sensitive T1rho andiron-sensitive T2rho measures using a 4 Tesla scanner and dis-closed altered integrity and iron content of the parkinsonian SN
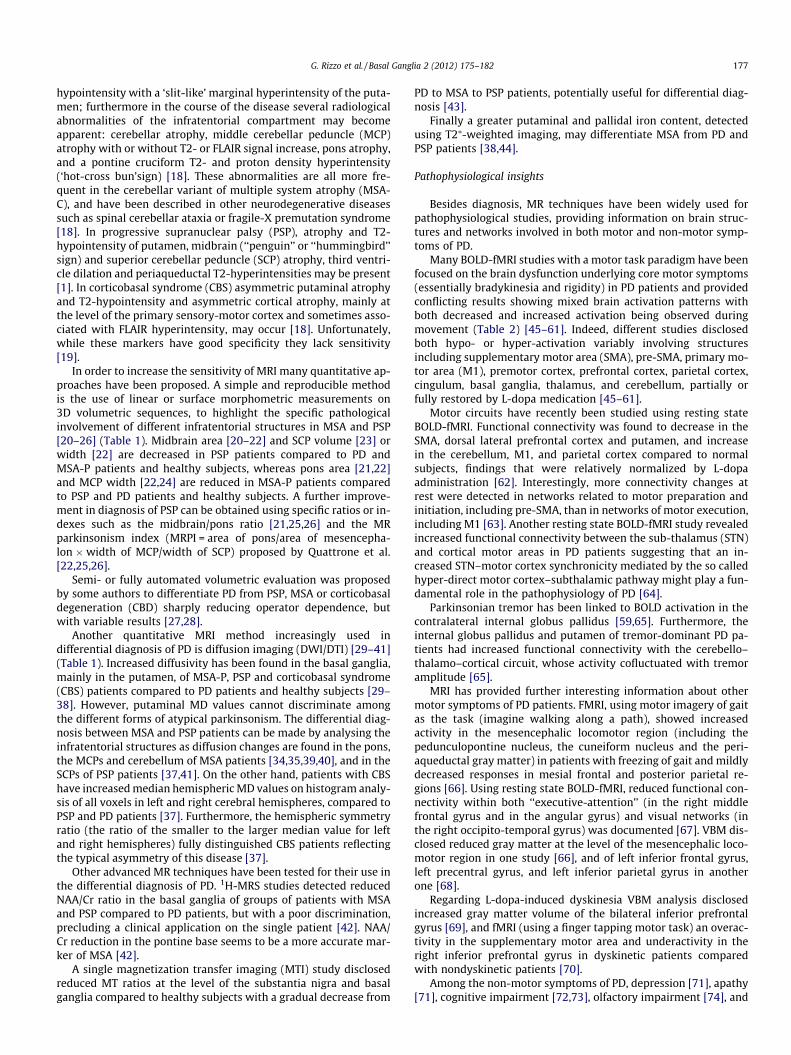
Fig. 1. Susceptibility images from an age-matched healthy subject (A, B, C) compareasymmetric, hypointensity of substantia nigra (arrows) in the patient.
[9]. The increased SN iron content of PD patients is also the targetof recently developed sequences, susceptibility imaging (Fig. 1),evaluating the relationship between the magnetic susceptibilityof brain tissue and iron concentration via image phase shift [2].Promising results were published referring to a discrimination be-tween PD patients and healthy controls evaluating phase shift[10,11] particularly when efforts were made to study the pars com-pacta of the SN [11].
Other sequences may also be able to detect nigral neuronal lossin PD patients including a variety of inversion-recovery images[12], and a recently developed neuromelanin-sensitive T1-weighted image [13]. Diffusion tensor imaging (DTI) has alsoyielded interesting results. This technique permits the evaluationof the microstructural integrity of brain structures via measure-ment of water diffusivity (mean diffusivity, MD, axial diffusivity,AD, radial diffusivity, RA, and fractional anisotropy, FA) [14]. Anumber of DTI studies have disclosed a reduced FA at the level ofthe SN of PD patients compared to healthy controls [6,8,15,16].However the different studies reported variable diagnostic accu-racy, which is increased when combined with other MRI metrics,specifically the R2⁄ values [6,8]. Finally, the advent of high fieldscanner (7 Tesla) opens new prospects for accurate morphologicalevaluation of the SN [17].
Differential diagnosis of PD
The most well-established clinical use of MRI is in the differen-tial diagnosis of PD. Conventional MRI is firstly useful to diagnosesecondary parkinsonisms, by showing, for example, marked palli-dal hypointensity within a hyperintense central core of necrosisin the case of pantothenate kinase-associated neurodegeneration(‘‘eye of the tiger’’), T1 hyperintensities of SN and pallidum in man-ganese accumulation, T2 and FLAIR hyperintesities at level of basalganglia, thalami and brainstem in Wilson disease [18]. Conven-tional MRI may also disclose specific alterations in atypical parkin-sonian syndromes. The parkinson variant of multiple systematrophy (MSA-P) may be associated to putaminal atrophy, T2-
d with a patient with Parkinson’s disease (D, E, F). Note the greater, apparently
G. Rizzo et al. / Basal Ganglia 2 (2012) 175–182 177
hypointensity with a ‘slit-like’ marginal hyperintensity of the puta-men; furthermore in the course of the disease several radiologicalabnormalities of the infratentorial compartment may becomeapparent: cerebellar atrophy, middle cerebellar peduncle (MCP)atrophy with or without T2- or FLAIR signal increase, pons atrophy,and a pontine cruciform T2- and proton density hyperintensity(‘hot-cross bun’sign) [18]. These abnormalities are all more fre-quent in the cerebellar variant of multiple system atrophy (MSA-C), and have been described in other neurodegenerative diseasessuch as spinal cerebellar ataxia or fragile-X premutation syndrome[18]. In progressive supranuclear palsy (PSP), atrophy and T2-hypointensity of putamen, midbrain (‘‘penguin’’ or ‘‘hummingbird’’sign) and superior cerebellar peduncle (SCP) atrophy, third ventri-cle dilation and periaqueductal T2-hyperintensities may be present[1]. In corticobasal syndrome (CBS) asymmetric putaminal atrophyand T2-hypointensity and asymmetric cortical atrophy, mainly atthe level of the primary sensory-motor cortex and sometimes asso-ciated with FLAIR hyperintensity, may occur [18]. Unfortunately,while these markers have good specificity they lack sensitivity[19].
In order to increase the sensitivity of MRI many quantitative ap-proaches have been proposed. A simple and reproducible methodis the use of linear or surface morphometric measurements on3D volumetric sequences, to highlight the specific pathologicalinvolvement of different infratentorial structures in MSA and PSP[20–26] (Table 1). Midbrain area [20–22] and SCP volume [23] orwidth [22] are decreased in PSP patients compared to PD andMSA-P patients and healthy subjects, whereas pons area [21,22]and MCP width [22,24] are reduced in MSA-P patients comparedto PSP and PD patients and healthy subjects. A further improve-ment in diagnosis of PSP can be obtained using specific ratios or in-dexes such as the midbrain/pons ratio [21,25,26] and the MRparkinsonism index (MRPI = area of pons/area of mesencepha-lon �width of MCP/width of SCP) proposed by Quattrone et al.[22,25,26].
Semi- or fully automated volumetric evaluation was proposedby some authors to differentiate PD from PSP, MSA or corticobasaldegeneration (CBD) sharply reducing operator dependence, butwith variable results [27,28].
Another quantitative MRI method increasingly used indifferential diagnosis of PD is diffusion imaging (DWI/DTI) [29–41](Table 1). Increased diffusivity has been found in the basal ganglia,mainly in the putamen, of MSA-P, PSP and corticobasal syndrome(CBS) patients compared to PD patients and healthy subjects [29–38]. However, putaminal MD values cannot discriminate amongthe different forms of atypical parkinsonism. The differential diag-nosis between MSA and PSP patients can be made by analysing theinfratentorial structures as diffusion changes are found in the pons,the MCPs and cerebellum of MSA patients [34,35,39,40], and in theSCPs of PSP patients [37,41]. On the other hand, patients with CBShave increased median hemispheric MD values on histogram analy-sis of all voxels in left and right cerebral hemispheres, compared toPSP and PD patients [37]. Furthermore, the hemispheric symmetryratio (the ratio of the smaller to the larger median value for leftand right hemispheres) fully distinguished CBS patients reflectingthe typical asymmetry of this disease [37].
Other advanced MR techniques have been tested for their use inthe differential diagnosis of PD. 1H-MRS studies detected reducedNAA/Cr ratio in the basal ganglia of groups of patients with MSAand PSP compared to PD patients, but with a poor discrimination,precluding a clinical application on the single patient [42]. NAA/Cr reduction in the pontine base seems to be a more accurate mar-ker of MSA [42].
A single magnetization transfer imaging (MTI) study disclosedreduced MT ratios at the level of the substantia nigra and basalganglia compared to healthy subjects with a gradual decrease from
PD to MSA to PSP patients, potentially useful for differential diag-nosis [43].
Finally a greater putaminal and pallidal iron content, detectedusing T2⁄-weighted imaging, may differentiate MSA from PD andPSP patients [38,44].
Pathophysiological insights
Besides diagnosis, MR techniques have been widely used forpathophysiological studies, providing information on brain struc-tures and networks involved in both motor and non-motor symp-toms of PD.
Many BOLD-fMRI studies with a motor task paradigm have beenfocused on the brain dysfunction underlying core motor symptoms(essentially bradykinesia and rigidity) in PD patients and providedconflicting results showing mixed brain activation patterns withboth decreased and increased activation being observed duringmovement (Table 2) [45–61]. Indeed, different studies disclosedboth hypo- or hyper-activation variably involving structuresincluding supplementary motor area (SMA), pre-SMA, primary mo-tor area (M1), premotor cortex, prefrontal cortex, parietal cortex,cingulum, basal ganglia, thalamus, and cerebellum, partially orfully restored by L-dopa medication [45–61].
Motor circuits have recently been studied using resting stateBOLD-fMRI. Functional connectivity was found to decrease in theSMA, dorsal lateral prefrontal cortex and putamen, and increasein the cerebellum, M1, and parietal cortex compared to normalsubjects, findings that were relatively normalized by L-dopaadministration [62]. Interestingly, more connectivity changes atrest were detected in networks related to motor preparation andinitiation, including pre-SMA, than in networks of motor execution,including M1 [63]. Another resting state BOLD-fMRI study revealedincreased functional connectivity between the sub-thalamus (STN)and cortical motor areas in PD patients suggesting that an in-creased STN–motor cortex synchronicity mediated by the so calledhyper-direct motor cortex–subthalamic pathway might play a fun-damental role in the pathophysiology of PD [64].
Parkinsonian tremor has been linked to BOLD activation in thecontralateral internal globus pallidus [59,65]. Furthermore, theinternal globus pallidus and putamen of tremor-dominant PD pa-tients had increased functional connectivity with the cerebello–thalamo–cortical circuit, whose activity cofluctuated with tremoramplitude [65].
MRI has provided further interesting information about othermotor symptoms of PD patients. FMRI, using motor imagery of gaitas the task (imagine walking along a path), showed increasedactivity in the mesencephalic locomotor region (including thepedunculopontine nucleus, the cuneiform nucleus and the peri-aqueductal gray matter) in patients with freezing of gait and mildlydecreased responses in mesial frontal and posterior parietal re-gions [66]. Using resting state BOLD-fMRI, reduced functional con-nectivity within both ‘‘executive-attention’’ (in the right middlefrontal gyrus and in the angular gyrus) and visual networks (inthe right occipito-temporal gyrus) was documented [67]. VBM dis-closed reduced gray matter at the level of the mesencephalic loco-motor region in one study [66], and of left inferior frontal gyrus,left precentral gyrus, and left inferior parietal gyrus in anotherone [68].
Regarding L-dopa-induced dyskinesia VBM analysis disclosedincreased gray matter volume of the bilateral inferior prefrontalgyrus [69], and fMRI (using a finger tapping motor task) an overac-tivity in the supplementary motor area and underactivity in theright inferior prefrontal gyrus in dyskinetic patients comparedwith nondyskinetic patients [70].
Among the non-motor symptoms of PD, depression [71], apathy[71], cognitive impairment [72,73], olfactory impairment [74], and

Table 1Studies using morphometric measurements or diffusion imaging for differential diagnosis between Parkinson’s disease and atypical parkinsonian syndromes (excluding thestudies comparing only atypical parkinsonian syndromes to healthy controls).
Author Technique Cohort studied⁄ Reported results
Kato et al.(2003) [20]
Morphometricmeasurements
PSP = 8; PD = 12; NC = 10Dis.dur. (y, M ± SD): PSP = 6.4 ± 6.2;PD = 6.9 ± 7.2
; area of midbrain tegmentum, inferior colliculus and pontine tegmentum in PSP (vsPD: p < 0.01).Se/Sp not reported
Oba et al.(2005) [21]
Morphometricmeasurements
PSP = 21; MSA-P = 25; PD = 23; NC = 31Dis.dur. (y, M ± SD): PSP = 2.8 ± 1.3; MSA-P = 7.8 ± 3.8; PD = 6.6 ± 1.9
; midbrain area in PSP (vs PD and vs MSA-P: p < 0.0001); pons area in MSA-P (vs PD: p < 0.0001; vs PSP: p < 0.01); midbrain/pons ratio in PSP (vs PD and vs MSA-P: p < 0.0001)Se/Sp for PSP diagnosis: midbrain area = 100%/91.3%; midbrain/pons ratio = 100%/100%
Paviour et al.(2005) [23]
Morphometricmeasurements
PSP = 19; MSA-P = 10; PD = 12; NC = 12Dis.dur. (y, M ± SD): PSP = 4.6 ± 1.6; MSA-P = 5.2 ± 1.7; PD = 13.2 ± 6.7
; SCP volume in PSP (vs PD: p = 0.003; vs MSA-P: p = 0.001)Se/Sp of SCP volume for PSP diagnosis = 74%/94%
Nicoletti et al.(2006) [24]
Morphometricmeasurements
MSA-P = 16; PD = 26; NC = 14Dis.dur. (y, M ± SD): MSA-P = 5.06 ± 3.38;PD = 5.92 ± 6.46
; MCP width in MSA-P (vs PD: p < 0.001)Se/Sp of MCP width for MSA-P diagnosis = 100%/100%
Quattrone et al.(2008) [22]
Morphometricmeasurements
PSP = 33; MSA-P = 19; PD = 108; NC = 50Dis.dur. (y, M ± SD): PSP = 3.0 ± 1.6; MSA-P = 4.6 ± 3.1; PD = 5.5 ± 4.3
; midbrain area in PSP (vs PD and vs MSA-P: p < 0.001); pons area in MSA-P (vs PD: p < 0.001; vs PSP: p = 0.013); SCP width in PSP (vs PD and vs MSA-P: p 6 0.001); MCP width in MSA-P (vs PD: p < 0.001; vs PSP: p = 0.022)" pons/midbrain ratio in PSP (vs PD and vs MSA-P: p < 0.001)" MCP/SCP ratio in PSP (vs PD and vs MSA-P: p < 0.001)" MRPI in PSP (vs PD and vs MSA-P: p < 0.001)Se/Sp for PSP diagnosis: pons/midbrain ratio = 90.9%/93.5% (vs PD), 97%/94.7% (vsMSA-P); MCP/SCP ratio = 78.8%/88.9% (vs PD), 93.9%/89.5% (vs MSA-P); MRPI = 100%/100% (vs PD and MSA-P)
Hussl et al.(2010) [25]
Morphometricmeasurements
PSP = 22; MSA-P = 26; PD = 75Dis.dur. (y, M ± SD): PSP = 2.88 ± 1.94;MSA-P = 4.09 ± 1.79; PD = 7.49 ± 6.89
; midbrain/pons ratio in PSP (vs non-PSP: p < 0.001)" MRPI in PSP (vs non-PSP: p < 0.001)Se/Sp for PSP diagnosis (vs non-PSP): midbrain/pons ratio = 63.6%/92.1%;MRPI = 81.8%/80.2%
Longoni et al.(2011) [26]
Morphometricmeasurements
PSP-RS = 10; PSP-P = 10; PD = 25; NC = 24Dis.dur. (y, M and range): PSP-RS = 3.8(2.5–7); PSP-P = 5.1 (3–10); PD = 4.9 (1–19)
" pons/midbrain ratio in PSP-RS and PSP-P (PSP-RS vs PD: p < 0.001; PSP-P vs PD:p = 0.01)" MR parkinsonism index in PSP-RS and PSP (PSP-RS vs PD: p < 0.001; PSP-P vs PD:p = 0.03)Se/Sp for PSP diagnosis: pons/midbrain ratio = 90%/96% (PSP-RS vs PD) and 60%/96%(PSP-P vs PD); MRPI = 100%/92% (PSP-RS vs PD) and 70%/68% (PSP-P vs PD)
Schocke et al.(2002) [29]
DWI MSA-P = 10; PD = 11; NC = 7Dis.dur. (y, M ± SD): MSA-P = 2.8 ± 0.9;PD = 2.9 ± 1.1
" rADC in putamen in MSA-P (vs PD: p < 0.001)Se/Sp for MSA-P diagnosis: 100%/100%
Seppi et al.(2003) [30]
DWI PSP = 10; MSA-P = 12; PD = 13Dis.dur. (y, M ± SD): PSP = 2.7 ± 1.1; MSA-P = 2.9 ± 1.1; PD = 3.0 ± 1.2
" rADC in putamen, caudate, pallidum in PSP (vs PD: respectively p < 0.001, p = 0.015;p < 0.01)" rADC in putamen, caudate in MSA-P (vs PD: respectively p < 0.001, p < 0.01)Se/Sp for MSA-P diagnosis (vs PD): putaminal rADC = 100%/100%. Se/Sp for PSPdiagnosis (vs PD): putaminal rADC = 90%/100%. No discrimination between MSA-P andPSP
Schocke et al.(2004) [31]
DWI MSA-P = 11; PD = 17; NC = 10Dis.dur. (y, M ± SD): MSA-P = 3.9 ± 1.9;PD = 3.7 ± 1.8
" rTrace(D) in putamen, caudate, pallidum in MSA-P (vs PD: respectively p < 0.001,p = 0.01, p < 0.001)Se/Sp not reported (but no overlap between MSA-P and PD using putaminal rTrace(D))
Seppi et al.(2004) [32]
DWI MSA-P = 15; PD = 17; NC = 10Dis.dur. (y, M ± SD): MSA-P = 3.1 ± 1.5;PD = 3.9 ± 0.9
" rADC in putamen in MSA-P (vs PD: p < 0.001)Se/Sp for MSA-P diagnosis: 93%/100% (higher compared with [123I]IBZM-SPECT)
Seppi et al.(2006) [33]
DWI MSA-P = 15; PD = 20; NC = 11Dis.dur. (y, M ± SD): MSA-P = 3.5 ± 2.1;PD = 3.9 ± 1.8
" rTrace(D) in putamen in MSA-P (vs PD: p < 0.001): posterior putamen> anteriorputamenSe/Sp not reported (but no overlap between MSA-P and PD using posterior putaminalrTrace(D))
Nicoletti et al.(2006) [34]
DWI PSP = 16; MSA-P = 16; PD = 16; NC = 15Dis.dur. (y, M ± SD): PSP = 3.3 ± 2.5; MSA-P = 4.9 ± 4.0; PD = 7.5 ± 5.8
" rADC in putamen, caudate, pallidum, thalamus, MCP, pons in MSA-P vs PD(respectively p < 0.001, p = 0.016, p = 0.035, p = 0.013, p < 0.001, p < 0.001)" rADC in putamen, caudate, pallidum, thalamus in PSP vs PD (all p < 0.001)" rADC in putamen, MCP in MSA-P vs PSP (respectively p = 0.001, p < 0.001)Se/Sp for MSA-P diagnosis: MCP rADC = 100%/100% (vs PD and vs PSP); putaminalrADC = 100%/100% (vs PD), 100%/81.2% (vs PSP); pallidal rADC = 62.5%/93.7% (vs PD);caudate rADC = 75%/93.7% (vs PD). Se/Sp for PSP diagnosis (vs PD): putaminalrADC = 75%/100%.
Blain et al.(2006) [39]
DTI PSP = 17; MSA = 17 (10 MSA-P and 7MSA-C); PD = 12; NC = 12Dis.dur. (y, M ± SD): PSP = 5.3 ± 2.4;MSA = 5.0 ± 2.3; PD = 6.9 ± 2.0
" MD in MCP and pons in MSA vs PSP (respectively p < 0.001, p = 0.003) and PD (bothp < 0.001); FA in MCP in MSA vs PSP (p = 0.002) and PD (p < 0.001)" MD in decussation of SCP in PSP vs MSA (p < 0.001) and PD (p < 0.001); FA in decussation of SCP in PSP vs PD (p = 0.003) Se/Sp not reported. No basal gangliaanalysis.
Paviour et al.(2007) [40]
DWI PSP = 20; MSA-P = 11; PD = 12; NC = 7Dis.dur. (y, M ± SD): PSP = 4.5 ± 1.8;MSA = 5.4 ± 1.6; PD = 13.3 ± 6.7
" rADC in MCP and rostral pons in MSA-P vs PSP (respectively p < 0.001, p = 0.009), vsPD (respectively p < 0.001, p = 0.002). No differences in basal ganglia.Se/Sp for MSA-P diagnosis (vs PSP and vs PD): MCP rADC = 91%/84%.
Ito et al. (2007)[35]
DTI MSA = 20 (10 MSA-P and 10 MSA-C);PD = 21; NC = 20Dis.dur. (y, M ± SD): MSA = 4 ± 2;
" ADC in putamen, pons, cerebellum in MSA-P vs PD (respectively p < 0.01, p < 0.005,p < 0.001); FA in putamen, pons, cerebellum in MSA-P vs PD (respectively p < 0.01, p < 0.001,
178 G. Rizzo et al. / Basal Ganglia 2 (2012) 175–182

Table 1 (continued)
Author Technique Cohort studied⁄ Reported results
PD = 10 ± 8 p < 0.005)Se/Sp for MSA-P diagnosis (vs PD): ADC: putamen = 70%/63.6%, pons = 70%/70%,cerebellum = 60%/87.5%; FA: putamen = 70%/87.5%, pons = 70%/100%,cerebellum = 70%/63.6%. 90% of MSA-P had " ADC and ; FA in any of the three areas.
Köllenspergeret al. (2007)[36]
DWI MSA-P = 9; PD = 9; NC = 9Dis.dur. (y, M ± SD): MSA = 6.4 ± 2.35;PD = 11.3 ± 6.07
" rTrace(D) in putamen in MSA-P (vs PD: p < 0.001)Se/Sp for MSA-P diagnosis: 100%/100% (higher compared with tilt test and heart MIBGscintigraphy)
Nicoletti et al.(2008) [41]
DWI PSP = 28; MSA-P = 15; PD = 15; NC = 16Dis.dur. (y, M ± SD): PSP = 3.2 ± 1.7;MSA = 5.1 ± 4.0; PD = 8.6 ± 3.6
" rADC in SCP in PSP vs PD and vs MSA-P (p < 0.001)Se/Sp for PSP diagnosis: 100%/100% (vs PD), 96.4%/93.3% (vs MSA-P). No basal gangliaanalysis.
Rizzo et al.(2008) [37]
DWI PSP-RS = 10; CBS = 7; PD = 13; NC = 9Dis.dur. (y, M ± SD): PSP-RS = 4 ± 3;CBS = 4 ± 3; PD = 14 ± 8
" ADCave in putamen and SCP in PSP-RS vs PD (respectively p = 0.003, p < 0.001; nodifferences vs CBS)" ADCave in putamen in CBS vs PD (p = 0.001) " hemispheric median ADCave in CBS vsPD (p = 0.002), vs PSP-RS (p = 0.001); HSR in CBS vs PD (p = 0.001) and vs PSP-RS (p = 0.001) Se/Sp for PSP-RS diagnosis (vsPD): putaminal ADCave = 80%/77%; SCP ADCave = 90%/85%.Se/Sp for CBS diagnosis: putaminal ADCave = 86%/92% (vs PD); hemispheric medianADCave = 86%/85% (vs PD), 100%/90% (vs PSP-RS); HSR = 100%/100% (vs PD and PSP-RS)
Focke et al.(2011) [38]
DTI PSP = 9; MSA-P = 10; PD = 12; NC = 13Dis.dur. (y, M ± SD): PSP = 2.5 ± 2.3;MSA = 4.5 ± 2.7; PD = 5.8 ± 3.8
" MD in pallidum and SN in PSP vs PD (p < 0.05) and in SN in PSP vs MSA-P (p < 0.05)Se/Sp not reported. No differences in other basal ganglia and in other groups ofpatients.
Dis.dur = disease duration; y = years; M = mean; SD = standard deviation; Se/Sp = Sensitivity/Specificity; PSP = progressive supranuclear palsy; PSP-RS = PSP-Richardson’sSyndrome; PSP-P = PSP-Parkinsonism; MSA = multiple system atrophy; MSA-P = parkinson variant of MSA; MSA-C = cerebellar variant of MSA; PD = Parkinson’s disease;NC = normal controls; CBS = corticobasal syndrome; SCP = superior cerebellar peduncle; MCP = middle cerebellar peduncle; MRPI = MR parkinsonism index [(P/M) � (MCP/SCP)]; DWI = diffusion-weighted imaging; DTI = diffusion tensor imaging; ADC = apparent diffusion coefficient; rADC = regional ADC; rTrace(D) = trace of diffusion tensor;ADCave = ADC average; MD = mean diffusivity; FA = fractional anisotropy; HSR = hemispheric symmetry ratio (the ratio of the smaller median value to the greater within leftand right hemispheres); SN = substantia nigra.
G. Rizzo et al. / Basal Ganglia 2 (2012) 175–182 179
pathological gambling [75] have been studied by VBM, DTI and/orfMRI. The interested reader is referred to referenced works, as thecurrent review is focussed on motor component of PD.
Knowledge gaps
In each point discussed above the most evident gap is the vari-ability of methods and results across the studies. When we look todifferent studies it is difficult to establish which technique is thebest, considering the large number of methods used by variousauthors. The potential and the results of each technique dependon magnetic fields, resolution, type of pre- and post-processingand statistical analysis adopted. Furthermore, a relevant problemconcerning SN studies is related to the challenging discriminationbetween pars compacta and pars reticolata of the SN on MRIimages. Inter-study variability is an important weakness for thedifferential diagnosis among parkinsonian syndromes. Differentstudies of diffusion imaging markers have demonstrated a highlyvariable diagnostic accuracy, with sensitivity and specificity rang-ing from 100% to low values [29–41], but the problem is also pres-ent using other techniques. Other than the technicalconsiderations, a limit of the most studies analysing small andmanually-segmented structures is operator dependence. Possibledifferences in the patient samples examined should also be consid-ered, considering the fact that almost all studies are on patientswith only a clinical diagnosis. Furthermore, it is important to notethat most of the studies were performed using patients with longdisease duration and as yet it is uncertain whether reported MRIfindings allows an accurate differential diagnosis to be performedeven in the early stage of the diseases.
When we look to the pathophysiological studies it is easy to getconfused by conflicting data [45–75]. The remarks about technicalvariability and especially the differences in patients examinedshould be also applied here. The link between some of the altera-tions described in the literature and their possible pathogenic roleis unclear. This is especially true of the studies focused on symp-toms occurring in later stage of disease, such as L-dopa induceddyskinesia and gait impairment, when many additional features,
related to disease progression, co-morbidity or therapy, may havebiased the results, especially in VBM and DTI studies. Regarding thefMRI studies of core motor symptoms in PD [45–61], discrepanciesin the results could be interpreted as being related to the stage ofdisease as some of the hyper-activations may represent compensa-tory phenomena. But the results of each experiment may also de-pend substantially on differences in the motor paradigm used,including whether the movements are externally generated, self-generated or automatic, and on the attention requirements of thetask. The use of an appropriate paradigm is even more importantin the study of dyskinesia and freezing of gait, and it is difficultto say which task is the most suitable for studying each of theseconditions using fMRI.
Bridging knowledge gaps
Considering the great variability of technical parameters andmethodological approaches employed, in both diagnostic andpathophysiological studies, a methodological consensus shouldbe obtained and guidelines proposed to allow the results from dif-ferent centres to be compared. But the scenario is further compli-cated by the continued improvement of techniques alreadyavailable and the uptake of new techniques at the basic researchlevel.
Regarding the evaluation of SN in PD patients and the differen-tial diagnosis among different parkinsonian syndromes, studiescomparing as many different techniques as possible in the samegroups of patients would be useful. The ultimate goal is an optimalcombination of sequences using a multimodal approach, to in-crease diagnostic potential [6,8]. Ideally, in the future, automatedand multiparametric diagnostic protocols will be available for clin-ical MRI scanners.
Furthermore, the operator-dependence related to the manualsegmentation of the brain structures should be reduced. For thesegmentation of the SN, a solution of this problem may be givenby a tractography-based approach leading to the evaluation of con-nectivity between SN and putamen which can provide at the sametime a parcellation of SN with more accurate identification of the

Table 2Pathophysiological studies using BOLD functional MRI with motor task paradigm to study core motor symptoms in Parkinson’s disease patients.
Author Motor paradigm Cohort studied Reported results in PD patients
Sabatiniet al.(2000)[45]
Sequentially: (i) finger-to-thumb opposition movements(1 Hz) (index> little finger); (ii) fist opening/closingtwice; (iii) finger-to-thumb oppositions (oppositeorder); (iv) fist opening/closing twice
PD (akinetic) = 6; NC = 6 Diseaseduration (y, M ± SD) = 5 ± 2
; activation rostral SMA (pre-SMA) and right DLPFC." activation SM1, lateral PMC, IPC, caudal SMA (SMA-proper) and ACC.
Haslingeret al.(2001)[46]
Motor task using an purpose-built non-magneticjoystick: respond to each computer-generated tone witha single joystick movement in one of four possible maindirections
PD (akinetic) = 8; NC = 8 Diseaseduration (y, M ± SD) = 1.84 ± 1.29
; activation rostral SMA and " activation M1 and lateralPMC bilaterally.L-dopa relatively normalize the impaired activation .
Mattayet al.(2002)[47]
Visually paced motor task, alternating with a workingmemory task and/or a rest condition
PD (no clinical details) = 10 (pre-and post-L-dopa) Diseaseduration: N/A (2: H&Y 1; 8: H&Y 2)
L-dopa increased activation SMA, M1 and parietal cortexbilaterally
Buhmannet al.(2003)[48]
Auditory-paced random finger (to thumb)-oppositionmotor task (0.3 Hz)
PD (akinetic, monolateral, drug-naive) = 8; NC = 10 Diseaseduration (m, M ± SD) = 13 ± 6
; activation SMA and M1 contralateral to the affectedhand.L-dopa increased activation SMA, M1.
Wu andHallet(2005)[49]
Automatic movement task: self-initiated, self-paced(0.5 Hz) sequences of finger movements untilautomaticity. Dual tasks to evaluate automaticity(simultaneous visual letter-counting task). Scan bothbefore and after the subjects achieved automaticity
PD = 12 (10/12 had tremor);NC = 14 Disease duration (y,M ± SD) = 6.33 ± 2.84
" activation cerebellum, premotor area, parietal cortex,precuneus and DLPFC bilaterally (at both less and moreautomatic stages); activation pre-SMA at less automatic stage and normalactivation pre-SMA at more automatic stage
Eckertet al.(2006)[50]
Self-paced (1 Hz) fist opening/closing motor task PD (akinetic) = 9; NC = 9 Diseaseduration (y, M ± SD) = 1.7 ± 0.7
" activation pre-SMA, SM1, lateral PMC, contralateralIPC, ipsilateral SPC, superior cerebellum.; activation contralateral SPC, ipsilateral IPC, inferiorcerebellum. L-dopa increased activation ipsilateralDLPFC and contralateral SPC
Yu et al.(2007)[51]
Auditory-paced thumb pressing movements at short(900 ms) and long (2400 ms) time intervals
PD (akinetic) = 8; NC = 8 Diseaseduration (y, M ± SD) = 5.9 ± 2.6
; activation putamen, SMA, pre-SMA" activation bilateral cerebellum, contralateral M1Negative correlation between activation ipsilateralcerebellum and contralateral putamen; activation M1(but not cerebellum) was positively correlated with limbrigidity
Kraft et al.(2009)[52]
Auditory-paced (1 Hz) power grip movements bypressing a push-button device (maximum compressiveforce of 10 N and about 0.5 cm amplitude) twiceunimanually and twice bimanually
PD = 12; NC = 12 Disease duration(y, M ± SD) = 3.1 ± 1.1
; activation putamen, SMA-proper, cerebellarhemispheres bilaterally (bimanual task)L-dopa increased activation putamen and thalamus
Palmeret al.(2009)[53]
Visually guided sinusoidal force task at 0.25, 0.5 and0.75 Hz
PD = 10; NC = 10 Disease duration(y, M ± SD) = 5.8 ± 3
Activity within striato-thalamo-cortical and cerebello-thalamo-cortical regions at low speeds was similar tothat in controls at higher speeds, in which " activity with" movement speed. Partial normalization by L-dopa
Ng et al.(2010)[54]
Visually guided sinusoidal force task at 0.25, 0.5 and0.75 Hz
PD = 10; NC = 10 Disease duration(y, M ± SD) = 5.8 ± 3
L-dopa had significant main effects on the amplitude ofBOLD signal in bilateral M1 and left SMA and on spatialdistribution in bilateral cerebellar hemispheres, M1,SMA, right prefrontal cortex> ‘‘focusing’’ effect onactivity (becoming similar to controls)
Wu et al.(2010)[55]
See Wu and Hallet, 2005 [49] PD = 12 (10/12 had tremor);NC = 12 Disease duration (y,M ± SD) = 6.33 ± 2.84
Automatic movement: ; effective connectivity of rostralSMA, cerebellum, and cingulate motor area with severalbrain regions (negative correlation with UPDRS score)
Sprakeret al.(2010)[56]
Two visually-guided precision grip force tasks: 4-s and2-s sustained contraction of maximum force using apinch grip (thumb, index, and middle finger) separatedby 1 s of rest
PD (drug-naïve) = 14; NC = 14Disease duration (m,M ± SD) = 16.5 ± 10.8
4-s task: ; activation putamen, external GP, thalamus 2-stask: ; activation all basal ganglia, thalamus, M1, SMA(more pronounced hypo-activity with repeated taskperformance)
Tessaet al.(2010)[57]
Self-paced continuous right hand-tapping. Dedicateddevice to monitor on-line tapping strength andfrequency (used as covariate in the analysis)
PD (drug-naïve) = 15; NC = 11Disease duration (y,M ± SD) = 1.8 ± 0.4
; activation left SM1, cerebellum " activation right SM1,left temporal-parietal cortex adjacent to SM1 H&Ycorrelated with activation left SM1, SMA, cingulumbilaterally.
Wu et al.(2010)[58]
Self-paced (0.5 Hz) multiple task: (i) extension andflexion of the right index finger (unimanual movement);(ii) extension and flexion of both index fingerssimultaneously (bimanual in-phase movement); (iii)simultaneous extension of one index finger and flexionof the other index finger (bimanual anti-phasemovement)
PD = 15; NC = 15 Disease duration(y, M ± SD) = 3.47 ± 1.60
Anti-phase movement: ; activation basal ganglia andSMA-proper (negative correlation with UPDRS score),and " activation SM1, PMC, inferior frontal gyrus,precuneus and cerebellum (positive correlation withUPDRS score). ; connectivity basal ganglia and DLPFCwith SMA-proper, and " connectivity SM1, parietalcortex, precuneus and cerebellum with SMA-proper.
Prodoehlet al.(2010)[59]
Visually guided precision grip force task: 2-secondpulse-hold contractions using a pinch grip followed by1-second of rest
PD (drug-naïve) = 20; NC = 20Disease duration: N/A (5: H&Y 1;15: H&Y 2)
; activation all basal ganglia and thalamus (negativecorrelation with UPDRS score), SMA and M1 (nocorrelation) Bradykinesia related to basal ganglia andthalamus activation. Tremor related to contralateralinternal GP activation.
Katschniget al.(2011)[60]
Visually-paced (1 Hz) unilateral foot movements withtwo conditions: active ankle dorsiflexion to a maximumof 30� and passive movement of the ankle by theexperimenter
PD = 20 (8 akinetic, 1 tremor-dominant, 11 mixed type); NC = 20Disease duration (y,M ± SD) = 6.25 ± 3.1
" activation in frontal regions comprising pre-SMA andSMA proper
Tessaet al.
Self-paced continuous writing of an ‘‘8’’ figureperformed with the right-dominant hand, without visual
PD (drug-naïve) = 15; NC = 13Disease duration (y,
; activation left SM1and cerebellum. Activation SM1 andSMA area bilaterally, left supramarginal, parietal
180 G. Rizzo et al. / Basal Ganglia 2 (2012) 175–182

Table 2 (continued)
Author Motor paradigm Cohort studied Reported results in PD patients
(2011)[61]
feedback M ± SD) = 1.7 ± 0.4 inferior, parietal superior and frontal superior gyri, rightparietal superior and angular gyri paralleled increasingH&Y stage
fMRI = functional magnetic resonance imaging; VBM = voxel-based morphometry; DTI = diffusion tensor imaging; y = years; m = months; M = mean; SD = standard deviation;PD = Parkinson’s disease; NC = normal controls; H&Y = Hoehn and Yahr stage; N/A = not available ; SMA = supplementary motor area; DLPFC = dorsolateral prefrontal cortex;SM1 = primary sensorimotor cortex; M1 = primary motor cortex; PMC = premotor cortex; IPC = inferior parietal cortex; SPC = superior parietal cortex; ACC = anterior cin-gulate cortex; GP = globus pallidus; UPDRS: Unified Parkinson’s Disease Rating Scale.
G. Rizzo et al. / Basal Ganglia 2 (2012) 175–182 181
pars compacta and a quantification of the nigro-striatal connectiv-ity [76].
A reduction of operator dependence in differential diagnosisstudies can be obtained using a histograms approach [37] and soft-ware able to automatically segment different brain structures[6,27,28], although these are methods needing improvement.
To bridge the gaps related to the characteristics of the patientsstudied, future diagnostic and pathophysiological studies shouldinclude larger and more homogeneous samples. In the diagnosticsetting, the patients should be examined in the early stage of dis-ease. Longitudinal studied should be performed and a definitepathological diagnosis of the patients studied should be obtainedwhenever possible.
References
[1] Gotz ME, Double K, Gerlach M, Youdim MB, Riederer P. The relevance of iron inthe pathogenesis of Parkinson’s disease. Ann N Y Acad Sci 2004;1012:193–208.
[2] Haacke EM, Cheng NY, House MJ, Liu Q, Neelavalli J, Ogg RJ, et al. Imaging ironstores in the brain using magnetic resonance imaging. Magn Reson Imaging2005;23:1–25.
[3] Antonini A, Leenders KL, Meier D, Oertel WH, Boesiger P, Anliker M. T2relaxation time in patients with Parkinson’s disease. Neurology1993;43:697–700.
[4] Bartzokis G, Cummings JL, Markham CH, Marmarelis PZ, Treciokas LJ, TishlerTA, et al. MRI evaluation of brain iron in earlier- and later-onset Parkinson’sdisease and normal subjects. Magn Reson Imaging 1999;17:213–22.
[5] Graham JM, Paley MN, Grunewald RA, Hoggard N, Griffiths PD. Brain irondeposition in Parkinson’s disease imaged using the PRIME magnetic resonancesequence. Brain 2000;123:2423–31.
[6] Du G, Lewis MM, Styner M, Shaffer ML, Sen S, Yang QX, et al. Combined R2⁄ anddiffusion tensor imaging changes in the substantia nigra in Parkinson’s disease.Mov Disord 2011;26:1627–32.
[7] Martin WR, Wieler M, Gee M. Midbrain iron content in early Parkinson disease:a potential biomarker of disease status. Neurology 2008;70:1411–7.
[8] Péran P, Cherubini A, Assogna F, Piras F, Quattrocchi C, Peppe A, et al. Magneticresonance imaging markers of Parkinson’s disease nigrostriatal signature.Brain 2010;133:3423–33.
[9] Nestrasil I, Michaeli S, Liimatainen T, Rydeen CE, Kotz CM, Nixon JP, et al. T1rhoand T2rho MRI in the evaluation of Parkinson’s disease. J Neurol2010;257:964–8.
[10] Zhang J, Zhang Y, Wang J, Cai P, Luo C, Qian Z, et al. Characterizing irondeposition in Parkinson’s disease using susceptibility-weighted imaging: anin vivo MR study. Brain Res 2010;1330:124–30.
[11] Lotfipour AK, Wharton S, Schwarz ST, Gontu V, Schäfer A, Peters AM, et al. Highresolution magnetic susceptibility mapping of the substantia nigra inParkinson’s disease. J Magn Reson Imaging 2012;35:48–55.
[12] Minati L, Grisoli M, Carella F, De Simone T, Bruzzone MG, Savoiardo M. Imagingdegeneration of the substantia nigra in Parkinson disease with inversion-recovery MR imaging. AJNR Am J Neuroradiol 2007;28:309–13.
[13] Schwarz ST, Rittman T, Gontu V, Morgan PS, Bajaj N, Auer DP. T1-weighted MRIshows stage-dependent substantia nigra signal loss in Parkinson’s disease.Mov Disord 2011;26:1633–8.
[14] Alexander AL, Lee JE, Lazar M, Field AS. Diffusion tensor imaging of the brain.Neurotherapeutics 2007;4:316–29.
[15] Chan LL, Rumpel H, Yap K, Lee E, Loo HV, Ho GL, et al. Case control study ofdiffusion tensor imaging in Parkinson’s disease. J Neurol Neurosurg Psychiatry2007;78:1383–6.
[16] Vaillancourt DE, Spraker MB, Prodoehl J, Abraham I, Corcos DM, Zhou XJ, et al.High-resolution diffusion tensor imaging in the substantia nigra of de novoParkinson disease. Neurology 2009;72:1378–84.
[17] Kwon DH, Kim JM, Oh SH, Jeong HJ, Park SY, Oh ES, et al. Seven-tesla magneticresonance images of the substantia nigra in Parkinson disease. Ann Neurol2012;71:267–77.
[18] Berg D, Steinberger JD, Warren Olanow C, Naidich TP, Yousry TA. Milestones inmagnetic resonance imaging and transcranial sonography of movementdisorders. Mov Disord 2011;26:979–92.
[19] Meijer FJ, Aerts MB, Abdo WF, Prokop M, Borm GF, Esselink RA, et al.Contribution of routine brain MRI to the differential diagnosis ofparkinsonism: a 3-year prospective follow-up study. J Neurol 2011 Oct 19.http://dx.doi.org/10.1007/s00415-011-6280-x.
[20] Kato N, Arai K, Hattori T. Study of the rostral midbrain atrophy in progressivesupranuclear palsy. J Neurol Sci 2003;210:57–60.
[21] Oba H, Yagishita A, Terada H, Barkovich AJ, Kutomi K, Yamauchi T, et al. Newand reliable MRI diagnosis for progressive supranuclear palsy. Neurology2005;64:2050–5.
[22] Quattrone A, Nicoletti G, Messina D, Fera F, Condino F, Pugliese P, et al. MRimaging index for differentiation of progressive supranuclear palsy fromParkinson disease and the Parkinson variant of multiple system atrophy.Radiology 2008;246:214–21.
[23] Paviour DC, Price SL, Stevens JM, Lees AJ, Fox NC. Quantitative MRImeasurement of superior cerebellar peduncle in progressive supranuclearpalsy. Neurology 2005;64:675–9.
[24] Nicoletti G, Fera F, Condino F, Auteri W, Gallo O, Pugliese P, et al. MR imagingof middle cerebellar peduncle width: differentiation of multiple systematrophy from Parkinson disease. Radiology 2006;239:825–30.
[25] Hussl A, Mahlknecht P, Scherfler C, Esterhammer R, Schocke M, Poewe W, et al.Diagnostic accuracy of the magnetic resonance Parkinsonism index and themidbrain-to-pontine area ratio to differentiate progressive supranuclear palsyfrom Parkinson’s disease and the Parkinson variant of multiple systematrophy. Mov Disord 2010;25:2444–9.
[26] Longoni G, Agosta F, Kostic VS, Stojkovic T, Pagani E, Stošic-Opincal T, et al. MRImeasurements of brainstem structures in patients with Richardson’ssyndrome, progressive supranuclear palsy-parkinsonism, and Parkinson’sdisease. Mov Disord 2011;26:247–55.
[27] Gröschel K, Hauser TK, Luft A, Patronas N, Dichgans J, Litvan I, et al. Magneticresonance imaging-based volumetry differentiates progressive supranuclearpalsy from corticobasal degeneration. Neuroimage 2004;21:714–24.
[28] Messina D, Cerasa A, Condino F, Arabia G, Novellino F, Nicoletti G, et al.Patterns of brain atrophy in Parkinson’s disease, progressive supranuclearpalsy and multiple system atrophy. Parkinsonism Relat Disord 2011;17:172–6.
[29] Schocke MF, Seppi K, Esterhammer R, Kremser C, Jaschke W, Poewe W, et al.Diffusion-weighted MRI differentiates the Parkinson variant of multiplesystem atrophy from PD. Neurology 2002;58:575–80.
[30] Seppi K, Schocke MF, Esterhammer R, Kremser C, Brenneis C, Mueller J, et al.Diffusion-weighted imaging discriminates progressive supranuclear palsyfrom PD, but not from the Parkinson variant of multiple system atrophy.Neurology 2003;60:922–7.
[31] Schocke MF, Seppi K, Esterhammer R, Kremser C, Mair KJ, Czermak BV, et al.Trace of diffusion tensor differentiates the Parkinson variant of multiplesystem atrophy and Parkinson’s disease. Neuroimage 2004;21:1443–51.
[32] Seppi K, Schocke MF, Donnemiller E, Esterhammer R, Kremser C, ScherflerC, et al. Comparison of diffusion-weighted imaging and [123I]IBZM-SPECTfor the differentiation of patients with the Parkinson variant of multiplesystem atrophy from those with Parkinson’s disease. Mov Disord2004;19:1438–45.
[33] Seppi K, Schocke MF, Prennschuetz-Schuetzenau K, Mair KJ, Esterhammer R,Kremser C, et al. Topography of putaminal degeneration in multiple systematrophy: a diffusion magnetic resonance study. Mov Disord 2006;21:847–52.
[34] Nicoletti G, Lodi R, Condino F, Tonon C, Fera F, Malucelli E, et al. Apparentdiffusion coefficient measurements of the middle cerebellar peduncledifferentiate the Parkinson variant of MSA from Parkinson’s disease andprogressive supranuclear palsy. Brain 2006;129:2679–87.
[35] Ito M, Watanabe H, Kawai Y, Atsuta N, Tanaka F, Naganawa S, et al. Usefulnessof combined fractional anisotropy and apparent diffusion coefficient values fordetection of involvement in multiple system atrophy. J Neurol NeurosurgPsychiatry 2007;78:722–8.
[36] Köllensperger M, Seppi K, Liener C, Boesch S, Heute D, Mair KJ, et al. Diffusionweighted imaging best discriminates PD from MSA-P: a comparison with tilttable testing and heart MIBG scintigraphy. Mov Disord 2007;22:1771–6.
[37] Rizzo G, Martinelli P, Manners D, Scaglione C, Tonon C, Cortelli P, et al.Diffusion-weighted brain imaging study of patients with clinical diagnosis ofcorticobasal degeneration, progressive supranuclear palsy and Parkinson’sdisease. Brain 2008;131:2690–700.
[38] Focke NK, Helms G, Pantel PM, Scheewe S, Knauth M, Bachmann CG, et al.Differentiation of typical and atypical Parkinson syndromes by quantitativeMR imaging. AJNR Am J Neuroradiol 2011;32:2087–92.
[39] Blain CR, Barker GJ, Jarosz JM, Coyle NA, Landau S, Brown RG, et al. Measuringbrain stem and cerebellar damage in parkinsonian syndromes using diffusiontensor MRI. Neurology 2006;67:2199–205.

182 G. Rizzo et al. / Basal Ganglia 2 (2012) 175–182
[40] Paviour DC, Thornton JS, Lees AJ, Jäger HR. Diffusion-weighted magneticresonance imaging differentiates Parkinsonian variant of multiple-systematrophy from progressive supranuclear palsy. Mov Disord 2007;22:68–74.
[41] Nicoletti G, Tonon C, Lodi R, Condino F, Manners D, Malucelli E, et al. Apparentdiffusion coefficient of the superior cerebellar peduncle differentiatesprogressive supranuclear palsy from Parkinson’s disease. Mov Disord2008;23:2370–6.
[42] Watanabe H, Fukatsu H, Katsuno M, Sugiura M, Hamada K, Okada Y, et al.Multiple regional 1H-MR spectroscopy in multiple system atrophy: NAA/Crreduction in pontine base as a valuable diagnostic marker. J Neurol NeurosurgPsychiatry 2004;75:103–9.
[43] Eckert T, Sailer M, Kaufmann J, Schrader C, Peschel T, Bodammer N, et al.Differentiation of idiopathic Parkinson’s disease, multiple system atrophy,progressive supranuclear palsy, and healthy controls using magnetizationtransfer imaging. Neuroimage 2004;21:229–35.
[44] Arabia G, Morelli M, Paglionico S, Novellino F, Salsone M, Giofrè L, et al. Anmagnetic resonance imaging T2⁄-weighted sequence at short echo time todetect putaminal hypointensity in Parkinsonisms. Mov Disord2010;25:2728–34.
[45] Sabatini U, Boulanouar K, Fabre N, Martin F, Carel C, Colonnese C, et al. Corticalmotor reorganization in akinetic patients with Parkinson’s disease: afunctional MRI study. Brain 2000;123:394–403.
[46] Haslinger B, Erhard P, Kämpfe N, Boecker H, Rummeny E, Schwaiger M, et al.Event-related functional magnetic resonance imaging in Parkinson’s diseasebefore and after levodopa. Brain 2001;124:558–70.
[47] Mattay VS, Tessitore A, Callicott JH, Bertolino A, Goldberg TE, Chase TN, et al.Dopaminergic modulation of cortical function in patients with Parkinson’sdisease. Ann Neurol 2002;51:156–64.
[48] Buhmann C, Glauche V, Stürenburg HJ, Oechsner M, Weiller C, Büchel C.Pharmacologically modulated fMRI–cortical responsiveness to levodopa indrug-naive hemiparkinsonian patients. Brain 2003;126:451–61.
[49] Wu T, Hallett M. A functional MRI study of automatic movements in patientswith Parkinson’s disease. Brain 2005;128:2250–9.
[50] Eckert T, Peschel T, Heinze HJ, Rotte M. Increased pre-SMA activation in earlyPD patients during simple self-initiated hand movements. J Neurol2006;253:199–207.
[51] Yu H, Sternad D, Corcos DM, Vaillancourt DE. Role of hyperactive cerebellumand motor cortex in Parkinson’s disease. Neuroimage 2007;35:222–33.
[52] Kraft E, Loichinger W, Diepers M, Lule D, Schwarz J, Ludolph AC, et al.Levodopa-induced striatal activation in Parkinson’s disease: a functional MRIstudy. Parkinsonism Relat Disord 2009;15:558–63.
[53] Palmer SJ, Ng B, Abugharbieh R, Eigenraam L, McKeown MJ. Motor reserve andnovel area recruitment: amplitude and spatial characteristics of compensationin Parkinson’s disease. Eur J Neurosci 2009;29:2187–96.
[54] Ng B, Palmer S, Abugharbieh R, McKeown MJ. Focusing effects of L-dopa inParkinson’s disease. Hum Brain Mapp 2010;31:88–97.
[55] Wu T, Chan P, Hallett M. Effective connectivity of neural networks inautomatic movements in Parkinson’s disease. Neuroimage 2010;49:2581–7.
[56] Spraker MB, Prodoehl J, Corcos DM, Comella CL, Vaillancourt DE. Basal gangliahypoactivity during grip force in drug naïve Parkinson’s disease. Hum BrainMapp 2010;31:1928–41.
[57] Tessa C, Lucetti C, Diciotti S, Baldacci F, Paoli L, Cecchi P, et al. Decreased andincreased cortical activation coexist in de novo Parkinson’s disease. Exp Neurol2010;224:299–306.
[58] Wu T, Wang L, Hallett M, Li K, Chan P. Neural correlates of bimanual anti-phaseand in-phase movements in Parkinson’s disease. Brain 2010;133:2394–409.
[59] Prodoehl J, Spraker M, Corcos D, Comella C, Vaillancourt D. Blood oxygenationlevel-dependent activation in basal ganglia nuclei relates to specific symptomsin de novo Parkinson’s disease. Mov Disord 2010;25:2035–43.
[60] Katschnig P, Schwingenschuh P, Jehna M, Svehlík M, Petrovic K, Ropele S, et al.Altered functional organization of the motor system related to anklemovements in Parkinson’s disease: insights from functional MRI. J NeuralTransm 2011;118:783–93.
[61] Tessa C, Lucetti C, Diciotti S, Paoli L, Cecchi P, Giannelli M, et al. Hypoactivationof the primary sensorimotor cortex in de novo Parkinson’s disease: a motorfMRI study under controlled conditions. Neuroradiology 2012;54:261–8.
[62] Wu T, Wang L, Chen Y, Zhao C, Li K, Chan P. Changes of functional connectivityof the motor network in the resting state in Parkinson’s disease. Neurosci Lett2009;460:6–10.
[63] Wu T, Long X, Wang L, Hallett M, Zang Y, Li K, et al. Functional connectivity ofcortical motor areas in the resting state in Parkinson’s disease. Hum BrainMapp 2011;32:1443–57.
[64] Baudrexel S, Witte T, Seifried C, von Wegner F, Beissner F, Klein JC, et al.Resting state fMRI reveals increased subthalamic nucleus-motor cortexconnectivity in Parkinson’s disease. Neuroimage 2011;55:1728–38.
[65] Helmich RC, Janssen MJ, Oyen WJ, Bloem BR, Toni I. Pallidal dysfunction drivesa cerebellothalamic circuit into Parkinson tremor. Ann Neurol2011;69:269–81.
[66] Snijders AH, Leunissen I, Bakker M, Overeem S, Helmich RC, Bloem BR, et al.Gait-related cerebral alterations in patients with Parkinson’s disease withfreezing of gait. Brain 2011;134:59–72.
[67] Tessitore A, Amboni M, Esposito F, Russo A, Picillo M, Marcuccio L, et al.Resting-state brain connectivity in patients with Parkinson’s disease andfreezing of gait. Parkinsonism Relat Disord 2012 Apr 15. http://dx.doi.org/10.1016/j.parkreldis.2012.03.018.
[68] Kostic VS, Agosta F, Pievani M, Stefanova E, Jecmenica-Lukic M, Scarale A, et al.Pattern of brain tissue loss associated with freezing of gait n Parkinson disease.Neurology 2012;78:409–16.
[69] Cerasa A, Messina D, Pugliese P, Morelli M, Lanza P, Salsone M, et al. Increasedprefrontal volume in PD with levodopa-induced dyskinesias: a voxel-basedmorphometry study. Mov Disord 2011;26:807–12.
[70] Cerasa A, Pugliese P, Messina D, Morelli M, Cecilia Gioia M, Salsone M, et al.Prefrontal alterations in Parkinson’s disease with levodopa-induced dyskinesiaduring fMRI motor task. Mov Disord 2011 Nov 10. http://dx.doi.org/10.1002/mds.24017.
[71] Kostic VS, Filippi M. Neuroanatomical correlates of depression and apathy inParkinson’s disease: magnetic resonance imaging studies. J Neurol Sci2011;310:61–3.
[72] Ibarretxe-Bilbao N, Tolosa E, Junque C, Marti MJ. MRI and cognitiveimpairment in Parkinson’s disease. Mov Disord 2009;24:S748–53.
[73] Weintraub D, Dietz N, Duda JE, Wolk DA, Doshi J, Xie SX, et al. Alzheimer’sdisease pattern of brain atrophy predicts cognitive decline in Parkinson’sdisease. Brain 2012;135:170–80.
[74] Moessnang C, Frank G, Bogdahn U, Winkler J, Greenlee MW, Klucken J. Alteredactivation patterns within the olfactory network in Parkinson’s disease. CerebCortex 2011;21:1246–53.
[75] Voon V, Gao J, Brezing C, Symmonds M, Ekanayake V, Fernandez H, et al.Dopamine agonists and risk: impulse control disorders in Parkinson’s disease.Brain 2011;134:1438–46.
[76] Menke RA, Jbabdi S, Miller KL, Matthews PM, Zarei M. Connectivity-basedsegmentation of the substantia nigra in human and its implications inParkinson’s disease. Neuroimage 2010;52:1175–80.