LOOKING AHEAD - flyingdoctor.org.au · looking ahead: responding to the health needs of country...
81
LOOKING AHEAD: RESPONDING TO THE HEALTH NEEDS OF COUNTRY AUSTRALIA IN 2028 – THE CENTENARY YEAR OF THE RFDS Research Report | August 2018 Fergus W Gardiner, Lauren Gale, Andy Ransom, Martin Laverty
Transcript of LOOKING AHEAD - flyingdoctor.org.au · looking ahead: responding to the health needs of country...

LOOKING AHEAD: RESPONDING TO THE HEALTH NEEDS OF COUNTRY AUSTRALIA IN 2028 – THE CENTENARY YEAR OF THE RFDS
Research Report | August 2018
Fergus W Gardiner, Lauren Gale, Andy Ransom, Martin Laverty

2 ROYAL FLYING DOCTOR SERVICE OF AUSTRALIA
Acknowledgments
This report has been prepared by the Royal Flying Doctor Service Research and Policy Unit using data and evidence from multiple sources. The report has benefited from review by academic experts, and several Royal Flying Doctor Service staff. We are grateful for their assistance and would like to acknowledge the external experts and internal staff.
Published by Royal Flying Doctor Service of Australia Level 2, 10–12 Brisbane Avenue Barton ACT 2600 Australia
ABN 74 438 059 643 Tel: (02) 6269 5500
Corresponding author: Fergus Gardiner; Royal Flying Doctor Service; 02 6269 5500; [email protected]
Suggested citation: Gardiner, F. W., Gale, L., Ransom, A., Laverty, M. (2018).Looking Ahead: Responding to the health needs of country Australians in 2028/ the centenary year of the RFDS. Canberra, Australia, The Royal Flying Doctor Service
© 2018 Royal Flying Doctor Service of Australia

3FROM 90 TO 100: PL ANNING FOR THE HEALTH NEEDS OF COUNTRY AUSTRALIA IN 2028
Commitment to Indigenous Reconciliation
The RFDS respects and acknowledges Aboriginal and Torres Strait Islander peoples as the first Australians and our vision for reconciliation is a culture that strives for unity, equity and respect between Aboriginal and Torres Strait Islander peoples and other Australians. The RFDS is committed to improved health outcomes and access to health services for all Aboriginal and Torres Strait Islander Australians, and our Reconciliation Action Plan (RAP) outlines our intentions to use research and policy to drive this improvement. RFDS research and policy reports, such as this one, include data on Aboriginal and Torres Strait Islander peoples as part of a broader effort to improve health outcomes and access to health services a contribution to the ‘Close the Gap’ campaign.
Royal Flying Doctor Service Research and Policy Unit
In mid-2015, the RFDS established a Research and Policy Unit, located in Canberra. The Unit’s role is to gather evidence about, and recommend solutions to, improving health outcomes and health service access for patients and communities cared for by RFDS programs. The Research and Policy Unit can be contacted by phone on (02) 6269 5500 or by email at [email protected].
Notes about this report
Use of the term ‘Indigenous’
The term ‘Aboriginal and Torres Strait Islander peoples’ is preferred in RFDS publications when referring to the separate Indigenous peoples of Australia. However, the term ‘Indigenous Australians’ is used interchangeably with ‘Aboriginal and Torres Strait Islander peoples’ in order to assist readability.
Data limitations
Data in RFDS reports come from a number of different administrative datasets and surveys, all of which have limitations that should be considered when interpreting the results.

4 ROYAL FLYING DOCTOR SERVICE OF AUSTRALIA
ContentsAcknowledgments 2
Commitment to Indigenous Reconciliation 3
Royal Flying Doctor Service Research and Policy Unit 3
Notes about this report 3
Tables 5
Figures 6
Abbreviations 7
Foreword 8
Executive summary 9
Introduction and methods 11
Chapter 1: The Australian Population and health status 14
1.1 The Australian population 15
1.2 Defining rural and remote Australia 15
1.3 The health status of the Australian population 15
1.4 RFDS services and population health trends 16
1.5 Summary 20
Chapter 2: The RFDS in 2018 21
2.1 Role of the RFDS in rural and remote Australia 22
2.2 Geographical analysis of the RFDS, gaps and opportunities 23
2.2.1 Geographical analysis methods (SPOT) 23
2.2.2 RFDS aeromedical retrievals in rural and remote Australia 23
2.2.3 RFDS primary healthcare services in rural and remote Australia 24
2.3 Summary 31
Chapter 3: Projecting Australian health needs in the year 2028 32
3.1 Total population forecast 33
3.2 Rural and remote population forecast 34
3.3 Australian chronic disease burden to 2028 35
3.4 Rural and remote Australia chronic disease burden 38
3.5 Estimated population and chronic disease increases 2018–28 40
Chapter 4: Australian workforce availability now and future capacity to meet rural and remote patient needs 42
4.1 Australian health workforce mapping 43
4.1.1 Methods 43
4.1.2 Medical service provision 43
4.2 Health workforce projections for the year 2028 54
4.2.1 Projecting demand for RFDS services in 2028 57
4.3 Clinical health priorities for people in the bush, a clinical perspective survey 60
4.3.1 Introduction 60
4.3.2 Methods 60
4.3.3 Results 61
4.4 Discussion and conclusion 65
5FROM 90 TO 100: PL ANNING FOR THE HEALTH NEEDS OF COUNTRY AUSTRALIA IN 2028
Chapter 5: Conclusion and Recommendations 67
5.1 Findings and Future Service Planning for the RFDS 67
Chapter 6: Future research and service planning 70
References 71
Appendix: Clinical health priorities for people in the bush, a clinical respective 75
Tables
Table 1.1. Total aeromedical retrievals per year by Indigenous status 16
Table 1.2. RFDS Queensland primary healthcare patient diagnosis and count 18
Table 2.1. RFDS services and patient contacts, 2016-17 23
Table 2.2. RFDS telehealth locations and total calls received, 2016-17 28
Table 3.1. Number and rates of DALYs, by age, 2003 and 2011 36
Table 3.2. Actual DALYs in 2003 and 2011, and predicted in 2028 37
Table 3.3. Prevalence of chronic disease by Australian geographical location 40
Table 3.4. Top reasons for an RFDS aeromedical retrieval, 2014–15 40
Table 4.1. Top areas of low medical service supply in 2016–17 44
Table 4.2. Top areas of high medical service supply in 2016–17 45
Table 4.3. Summary of healthcare area per 100 000 of population by ASGC location 55
Table 4.4. RFDS aeromedical retrieval biyearly growth predictions per leading diagnosis 59
Table 4.5. RFDS primary healthcare biyearly growth predictions per leading diagnosis 59
Table 4.6. Participant responses – the most important health issues for people in their rural and/or remote community 62
Table 4.7. Participant responses – areas where money should be spent to improve rural and remote Australian health 63
Table 4.8. Participant responses – the most important health issues that people in rural and remote areas will face in the next ten years 64
Table 4.9. Participant responses – the best policy drivers to help distribute clinical workers to rural and remote areas of Australia 65

6 ROYAL FLYING DOCTOR SERVICE OF AUSTRALIA
FiguresFigure 1.1. Diagnostic reason for RFDS aeromedical retrievals 17
Figure 1.2. Total patient diagnostic reason for RFDS Queensland primary healthcare clinics 19
Figure 2.1 RFDS bases 22
Figure 2.2 RFDS aeromedical retrievals by Indigenous status and location (July 2015 – June 2017) 24
Figure 2.3. RFDS GP clinic sites 25
Figure 2.4. RFDS nursing clinics 25
Figure 2.5. RFDS dental clinics 26
Figure 2.6. RFDS Medical chests 27
Figure 2.7. All rural and remote clinics, GPs and hospitals (inclusive of RFDS) 31
Figure 3.1. Projected ten-year growth in the 65 and older age group 33
Figure 3.2. Changes in the very remote population from 2007–17, and projections to 2028 34
Figure 3.3. Changes in the remote population from 2007–17, and projections to 2028 34
Figure 3.4. Population changes by Australian regional area (SA3), 2016–2018 35
Figure 3.5. Predicted prevalent DALY diagnosis in 2028 for all Australia 38
Figure 3.6. Total burden of disease by remoteness area and age group, rate and rate ratio between very remote areas and major cities, 2011 39
Figure 3.7. Population growth by geographical location and chronic disease prevalence 41
Figure 4.1. Overall medical service provision, by SA3, in 2016–17 44
Figure 4.2. GP services, by SA3, in 2016–17 46
Figure 4.3. Nursing services, by SA3, in 2016–17 47
Figure 4.4. Allied health (non-mental health) services, by SA3, in 2016–17 48
Figure 4.5. Allied mental health services, by SA3, in 2016–17 49
Figure 4.6. Optometry services, by SA3, in 2016–17 50
Figure 4.7. Dental services, by LGA, in 2016–17 51
Figure 4.8. Imaging services, by SA3, in 2016–17 52
Figure 4.9. Pathology services, by SA3, in 2016–17 53
Figure 4.10. RFDS aeromedical retrieval biyearly growth predictions per leading diagnosis 58
Figure 4.11. RFDS primary healthcare biyearly growth predictions per leading diagnosis 58
Figure 4.12. RFDS Victoria and Central Operations road patient transportations by number and year 60
Figure 4.14. Survey participants clinical role 61

7FROM 90 TO 100: PL ANNING FOR THE HEALTH NEEDS OF COUNTRY AUSTRALIA IN 2028
Abbreviations
ABS Australian Bureau of Statistics
ACT Australian Capital Territory
AHPRA Australian Health Practitioner Regulation Agency
AIHW Australian Institute of Health and Welfare
AMS Aboriginal Medical Service
ASGC Australian Standard Geographical Classification
ASGS Australian Statistical Geography Standard
BEACH Bettering the Evaluation and Care of Health
CHD coronary heart disease
COPD chronic obstructive pulmonary disease
CVD cardiovascular disease
DALYs disability-adjusted life years
GP general practitioner
ICD International Statistical Classification of Diseases and Related Health Problems
IHT inter-hospital transfer
LGA Local Government Area
MBS Medicare Benefits Schedule
NACCHO National Aboriginal Community Controlled Health Organisation
NHS National Health Survey
NSW New South Wales
NT Northern Territory
ORH Operational Research in Health
PBS Pharmaceutical Benefits Scheme
PE primary evacuation
POC point-of-care
QLD Queensland
RAP Reconciliation Action Plan RFDS
RFDS Royal Flying Doctor Service
SA South Australia
SA3 Statistical Area Level 3
SE (RFDS) South East
SPOT Service Planning and Operational Tool
TAS Tasmania
VIC Victoria
WA Western Australia
24/7 24-hour, seven-days-a-week
8 ROYAL FLYING DOCTOR SERVICE OF AUSTRALIA
Foreword Senator the Hon Bridget McKenzie Commonwealth Minister for Regional Services, Sport, Local Government and Decentralisation
Australians living in country areas make an enormous contribution to our nation – our economy, our culture and our national character. They deserve the same access to high-quality health care services as those living in our capital cities.
It is a key priority for The Nationals and the Coalition Government that country Australians can access comprehensive healthcare in times of need. We are taking on the challenge of ensuring Australia has the right mix of qualified health professionals, in the right place, at the right time, to deliver high quality care.
We know that currently there are inadequate numbers of health professionals from most disciplines in rural and remote areas of our country, and as a result people in these areas have poorer health outcomes. As shown in this report by the Royal Flying Doctor Service, without intervention, this situation will become worse over the next decade. For example, by 2028, it is projected that there will be 13.8 million Australians living with at least one chronic disease, compared to 11.8 million this year, with cardiovascular disease, mental health disorders and cancer the most common.
Meanwhile, with an ageing population throughout Australia, and particularly in country Australia, the prevalence of age-related neurological diseases, such as Alzheimer’s, will continue to increase. Our health system must be able to respond to these changes.
I was delighted to announce in this year’s Budget the Stronger Rural Health Strategy, a comprehensive package designed to address the current maldistribution of the Australian healthcare workforce. This historic ten year plan will provide 3,000 more doctors, over 3,000 more nurses, and hundreds more allied health professionals to rural and remote areas and ensure better access to health services. This transformational package also includes a $327 million commitment to the RFDS to ensure that essential aeromedical, primary health, dental and mental health care services can continue to be delivered by the RFDS over the next four years.
I commend the RFDS for producing this report that provides further insight to inform implementation of the Stronger Rural Health Strategy and future investment by governments. Only by identifying the key gaps in health services can we plan for the future health needs of regional Australians.
The RFDS’s analysis of projected population, health status and health workforce trends highlights the ongoing demand for services such as that of the RFDS. This report also highlights the need for services to adapt to respond to the increase in age-related illnesses, and even higher rates of chronic disease through coordinated, comprehensive and multi-disciplinary services.
During my time overseeing the Rural Health portfolio, I’ve had the pleasure of hearing firsthand how important the RFDS is to those living, working and travelling in rural and remote parts of our country. I encourage the findings of this report to be carefully considered to ensure that health services for country Australians are adequate, well-targeted and responsive to changing needs.
Senator the Hon Bridget McKenzie Commonwealth Minister for Regional Services, Sport, Local Government and Decentralisation

9FROM 90 TO 100: PL ANNING FOR THE HEALTH NEEDS OF COUNTRY AUSTRALIA IN 2028
Executive summary
As celebrations marking the 90th year of operations of the Royal Flying Doctor Service (RFDS) wind down, it is pertinent that we continue to look to the future, to ensure that our services remain competitive and efficient, optimally targeted and designed to meet the needs of a changing population in rural and remote Australia. This paper seeks to inform strategic planning and service design for the RFDS by answering the question:
In 10 years’ time, as we mark our centenary, what services should the RFDS be providing?
This is answered by analysing projected population, health status and health workforce trends in rural and remote Australia to identify key service gaps and inform recommendations for future RFDS service priorities. The findings of this paper also have a broader purpose and serve as an offering to the policy conversation on health service planning for rural and remote parts of Australia.
The objective of this report is to determine the health service needs of Australians living in rural and remote regions in 2028, based on projected population, health status, demand and provision of healthcare services. Furthermore, this report aims to predict the future adequacy of the rural and remote health workforce and service provision as compared to metropolitan areas. As such, this report identifies the best areas for investment in future healthcare services by governments, service providers, communities and the RFDS.
The Australian population is estimated to be 29.4 million by the year 2028, growing at approximately 1.4% per year, and with the population of remote areas predicted to grow steadily at 0.2% per year over the next decade. The number of Australians living with at least one chronic disease is estimated to increase from 11.8 million in 2018 to 13.8 million by 2028. Cancer, disorders of mental health and cardiovascular disease (CVD) are predicted to be the most prevalent chronic diseases, with those in rural and remote areas expected to be impacted most by these growing rates, consistent with current trends.
There was a 3.7% per year increase from 2003 to 2011 in disability-adjusted life years (DALYs) lost due to neurological diseases, such as dementia and Alzheimer’s. It is expected that without further prevention measures the prevalence of these diseases will continue to increase. Pathology, imaging and pharmaceuticals are expected to reach 6.6, 1.3 and 9.3 service episodes per patient per year, respectively, in 2028. This equals demand of 17.2 services per patient per year in 2027–28 as compared to only 13.3 in 2007–08. This increase is significant and reflects the growing burden of chronic disease.

10 ROYAL FLYING DOCTOR SERVICE OF AUSTRALIA
When comparing geographic areas in terms of the supply of health services, there is a significant difference between areas of low supply and areas of high supply, with the majority (p<0.05) of low supply areas being in rural and remote areas. Furthermore, the majority of clinical provision per 100 000 people is predicted to be located in metropolitan areas by the year 2028. Data presented in this report indicates that in the next decade there will be significant shortages of essential health services in rural and remote Australia, well below the estimated benchmark. For example, in 2028 there is projected to be less than a fifth the number of General Practitioners (GPs) in remote as compared to metropolitan areas (43 as compared to 255 per 100 000 population respectively); just a twelfth of the number of physiotherapists (276 as compared to 23 per 100 000 population); half the number of pharmacists (113 as compared to 52 per 100 000 population); and only a third the number of psychologists (104 as compared to 34 per 100 000 population).
The clinical perspective survey undertaken to inform this report indicated that primary healthcare was perceived as generally adequate in regard to availability. This indicates that progress has been made in response to renewed interest and policy intervention in rural and remote health since the early 1990s. Nonetheless, there were specific areas that were deemed as having limited or poor provision, including services for dental health, mental health and diagnostic imaging. Participants indicated that more resources should be invested into health literacy education, to the provision of mental health services, and to improving health infrastructure.
For the RFDS, recent trends of stability in the numbers of emergency aeromedical retrievals are expected to continue over the next decade, with no significant increase. However, it is predicted that with the decentralisation of health networks, the closure of regional hospitals and an increasingly ageing population suffering from complex and age-related illness, the demand for RFDS inter-hospital transfers (by air) and road transport will grow significantly throughout the next ten years. This has been illustrated to date by RFDS Victoria and Central Operations increasing their transfers by road from 12 000 in 2012 to 70 342 in 2018. This trend is predicted to continue.
RFDS primary healthcare (predominantly GP and nursing clinics) is predicted to have a non-significant increase in overall activity over the next decade. However, these services will need to evolve and, with an ageing population, the RFDS and other health service providers will need to prepare to respond to more complex and age-related illnesses. Furthermore, while allied health services have not been a traditional focus of the RFDS, there is a measurable need to increase provision, for example of physiotherapy, mental health pharmacy and diagnostic imaging services in rural and remote areas.
In summary, this report projects that over the next decade, on a population basis, there will continue to be significantly fewer services in country areas as compared to our major cities. Similarly, workforce provision will also continue to be significantly lower in rural and remote than metropolitan areas per 100 000 population. This is concerning, as the disease burden due to cancer, CVD and disorders of mental health in rural and remote areas is expected to continue surpassing that of metropolitan areas. Consequently, there will need to be:
1. Additional health prevention and early intervention activities to minimise and respond to growth in cancer, disorders of mental health and CVD;
2. Enhanced primary healthcare services and treatment services to respond to increases in chronic disease; and
3. Additional or amended support and incentives for clinicians working in the bush to bring numbers closer to the estimated required benchmark.
Services of the RFDS will continue to be in high demand throughout the next ten years, with expected growth of service provision in multidisciplinary primary healthcare and increased provision of outreach programs involving specialists, allied health, mental health, dental and telehealth services to rural and remote areas.
11FROM 90 TO 100: PL ANNING FOR THE HEALTH NEEDS OF COUNTRY AUSTRALIA IN 2028
Introduction and methods
Many rural and remote communities in Australia are adversely affected by inadequate access to comprehensive healthcare services, owing to factors such as clinician shortages; poor workforce retention; and, the closure and downgrading of rural hospitals due to economic rationalism. While it is known that healthcare service provision in the bush is suboptimal,(2, 4) service supply and demand gaps have not recently been forecast specifically for rural and remote Australia. As such, the purpose of this paper is to forecast over the next decade rural and remote population changes; the likely burden of chronic disease; the provision of health services; and workforce availability in order to inform service priorities. Results are intended to assist planning for the RFDS, governments, communities and other service providers to better meet the health needs of rural and remote communities ten years from now. Specifically, the RFDS seeks to determine if demand for its current services and new service offerings is likely to grow, remain static or decline over the course of the next decade.
While the Australian population has a diverse ethnicity,(3) much of the population lives in metropolitan areas, and only 2.3% live in remote or very remote Australia.(4, 5) Based on 2014–15 self-reported data, more than 47% of Australians have at least one chronic condition,(6) with people living in rural and remote areas and Indigenous Australians having significantly increased chronic disease prevalence and risk. CVD accounts for a large proportion of deaths, with data indicating that death rates appear to increase with remoteness.(5) In a recent AIHW report,(7) suicide, self-inflicted injuries and anxiety disorders were the leading causes of burden of disease in young people (15–24 years old). The high prevalence of youth mental illness is concerning, something which our healthcare system is struggling to reduce.
The shortage of healthcare professionals in rural and remote communities has been described on the global level as an intractable problem that poses a challenge to equitable healthcare delivery.(9–12) Rural and remote Australian communities have been reported as sicker, poorer and less educated, with poorer access to healthcare than urban populations. This ‘inverse care’ situation results in those with the greatest health needs often having the poorest access to healthcare.(13)
It is within this context that the RFDS operates, providing a 24-hour, seven-days-a-week (24/7) aeromedical retrieval service, supported by a 24/7 telehealth system, to patients who live, work or travel in rural and remote Australia, are unable to access normal medical services, and who experience a medical emergency requiring definitive care in a tertiary hospital. Patients requiring definitive care in a tertiary hospital are transported via a primary evacuation1 (PE) or inter-hospital transfer2 (IHT), often referred to collectively as an aeromedical retrieval.(2) Increasingly, the RFDS is moving non-emergency patients by road, with 70 342 patients transported by road in 2016-17. The RFDS also provides extensive primary healthcare services, including, although not limited to, general practice (GP) and nursing clinics, medical specialist outreach clinics, dental health clinics and telehealth services.
1 Primary evacuation: ‘The provision of emergency medical services to victims of illness or accident who are in a serious or potentially life threatening condition who are beyond the normal medical infrastructure and who require transport and/or medical and nursing care during transport to the nearest suitable hospital (including all fixed wing air transport services directly related to these emergency medical services) but excluding transfers from one hospital to another’.(1)
2 Inter-hospital transfer: ‘Transfer of patients between hospitals designated as normal medical infrastructure to get specialist treatment and life-saving surgery required’.(1)

12 ROYAL FLYING DOCTOR SERVICE OF AUSTRALIA
Additionally, this report seeks to test the following hypotheses, and to outline action needed to better meet health service needs in rural and remote areas in a decade’s time:
> Rural and remote service provision will continue to be significantly poorer than metropolitan areas per 100 000 population ten years from now; and
> Rural and remote workforce supply will continue to be significantly lower than metropolitan areas per 100 000 population ten years from now.
Data included in this report covers the whole geography of Australia, including metropolitan, rural and remote areas. The term ‘rural and remote’ is defined as all areas outside Australia’s major cities. This includes areas that are classified as inner and outer regional (RA2 and RA3, respectively) and remote or very remote (RA4 and RA5, respectively) under the Australian Statistical Geography Standard-Remoteness Areas (ASGS) classification system. The ASGS was used as it provides good classification, since it pertains to resource allocation per 100 000 population.
To provide population health projections and workforce predictions for rural and remote areas in 2028, trends from reported data from 2001 to 2017 were identified and extrapolated. Data were then mapped to demonstrate predicted trends from 2018 to 2028.
To gain clinical perspectives of perceived health services gaps over the next ten years, the RFDS undertook a survey of clinicians currently working in rural and remote areas.
To estimate population growth, Australian Bureau of Statistics (ABS) forecasting reports were used.(14) This method was implemented to provide a projection of population growth based on specific assumptions, including future levels of fertility, mortality, internal migration and overseas migration over the projection period. This report was not designed to repeat the work already completed by the ABS, but rather to incorporate population measurements since the 2016 census and then apply projections to the year 2028. This is used to provide general estimates of population change.
The RFDS provides critical health services to areas of great need, particularly places where, because of low population numbers, traditional methods of health service delivery under the Medical Benefits Schedule (MBS) are not viable, as well areas where there is unmet need for clinical services. To provide data on non-MBS methods of medical service provision, data from RFDS clinical records management systems was extracted and used. These included patient demographic information, medical history, diagnosis, location, service provider and type, and extensive about treatment.
To determine service usage, those patients who accessed a service as part of the MBS and the Pharmaceutical Benefits Scheme (PBS) were included. The MBS is a listing of the Medicare services subsidised by the Australian Government.(15) As per the MBS: ‘The Schedule is part of the wider Medicare Benefits Scheme managed by the Department of Health and administered by Department of Human Services’.(15) The PBS aims to provide ‘timely, reliable and affordable access to necessary medicines for Australians’, which involves government subsidies for the cost of medicine for most medical conditions. Most of the listed medicines are dispensed by pharmacists, and used by patients at home.(16) In principle, this system allows clinicians and patients to access healthcare where the service is provided, which is believed to be predominately in metropolitan areas of Australia. This data was included with the knowledge that many patients cared for by the RFDS are not able to readily access MBS or PBS services.
The number of services was defined as: a tally of the number of Medicare services that were performed by a registered provider for items in the MBS or PBS for which a claim has been processed. In practice, services included those conducted by service providers within a specific ASGS area, as detailed below. Of importance, some patients may not have received the service in their place of residence, and may have instead travelled to larger metropolitan areas.

13FROM 90 TO 100: PL ANNING FOR THE HEALTH NEEDS OF COUNTRY AUSTRALIA IN 2028
To determine service provision, all healthcare staff currently registered with the Australian Health Practitioner Regulation Agency (AHPRA) were included for analysis3. This data included healthcare provider type, current registration status, demographic information and principal location of practice. Only practitioners with non-restricted registration were included in the analysis. Those on probation or in training were excluded. The principal place of service was used, as many clinicians do not necessarily work just in their place of AHPRA registration and do travel to see patients, as with the RFDS clinical teams.
To help validate these quantitative data sources, a survey was conducted, aimed at determining the clinical perspective of the health service needs in rural and remote Australia. This was distributed via Survey Monkey to the National Rural Health Alliance, health colleges and societies, and tertiary universities. Key stakeholders were invited to redistribute the survey via members’ newsletters and social media sites (refer to the Appendix, which details the survey). This survey was not approached using a rigorous research or academic method and was only used to gain general clinical perspectives. As such, survey results should only be used as a guide.
Finally, each data point was analysed to inform forecasts of RFDS services in a decade’s time, through service models of patient transports by road and air, primary care and allied health services.
To determine the provision of RFDS services, the RFDS Service Planning and Operational Tool (SPOT)4 was used. SPOT was designed for exploring healthcare coverage in rural and remote Australia. It was developed by Operational Research in Health (ORH) in 2018 for use by the RFDS. SPOT works from a geographical distribution of ‘demand’ and a set of healthcare facilities that provide cover for a range of services. SPOT calculates the proportion of demand covered by those facilities within a user-specified drive time. Demand is represented by population levels in different categories (e.g. Indigenous Australians aged over 55 years) as well as some specific RFDS demand types (e.g. PEs). The tool was used to assess the current coverage provided for different services provided by the RFDS. It was used to identify ‘gaps’ in healthcare coverage for different demand/service pairings and can suggest the best new service locations for improving coverage.
To map health workforce supply and demand, health provider to population ratios were used, expressed as the number of health services per 1000 population. This was then expressed per Statistical Area Level 3 (SA3). SA3 represents a standard framework for the analysis of data at the regional level. In aggregate, SA3s cover the whole of Australia without gaps or overlaps, and do not cross state/territory borders. SA3s are often the functional areas of regional towns and cities with a population more than 20 000, or clusters of related suburbs around urban commercial and transport hubs within the major urban areas. The regional breakups have been designed to reflect regional identity. These are areas with both geographic and socio-economic similarities.(18, 19)
This method was designed to provide a general indicator on the stock of health services relative to the population, and to ultimately determine current gaps or limitations in provision. Further, it is relatively easy to calculate and understand and can be used to make comparisons over countries and across time.
This study used a combination of descriptive statistics, t-test and Chi-square analysis, with significance determined at p<0.05.
3 AHPRA is the official Australian Government, compulsory registration board.(17)
4 SPOT only includes data for remote and very remote areas of Australia. If a local government area (LGA) extends into outer or inner regional areas, only the proportion living in remote and very remote regions of the LGA are included in the analysis in this report.

14 ROYAL FLYING DOCTOR SERVICE OF AUSTRALIA
Chapter 1: The Australian Population and health status
> The 2016 Australian Census counted 23.4 million people living in Australia, an 8.8% increase since the 2011 census.
> The leading non-Indigenous ancestries were English (36.0%), Irish (11.0%), Scottish (9.3%) and Chinese (5.6%).
> Rural and remote areas encompass the majority of Australia’s land mass, however comprise only 29% of the population.
> Indigenous Australians comprise approximately 2.8% (n=649 171) of the total Australian population, although they comprise almost half the population in remote areas.
> In 2014–15, more than 11 million Australians (47%) had at least one chronic condition, with people living in rural and remote areas and Indigenous Australians having significantly increased chronic disease prevalence and risk.
> Cardiovascular disease (CVD) and its comorbidities, such as diabetes mellitus, are the leading contributors of death in rural and remote populations.
> Between 2015 and 2017, almost half of all RFDS aeromedical retrievals were in response to issues associated with the circulatory system (n=11 371), and injuries or poisonings (n=13 705).
> Between 2016 and 2018, the top three reasons for patients visiting an RFDS primary healthcare clinic in Queensland were: diseases of the skin; diseases of the musculoskeletal system; and, diseases of the circulatory system.

15FROM 90 TO 100: PL ANNING FOR THE HEALTH NEEDS OF COUNTRY AUSTRALIA IN 2028
1.1 The Australian population
The 2016 Australian Census counted 23.4 million people living in Australia, which was an increase of 8.8% since the 2011 census.(3) The Australian population consists of a varied ethnicity. This report categorises patients as Indigenous (Aboriginal and Torres Strait Islander) and non-Indigenous. Indigenous Australians comprise approximately 2.8% (n=649 171)(3) of the total Australian population, although they comprise almost half of the population of remote areas,(4) while non-Indigenous Australians most commonly live in metropolitan areas. Based on recent census data,(3) the leading non-Indigenous ancestry was English (36.0%), Irish (11.0%), Scottish (9.3%) and Chinese (5.6%).
1.2 Defining rural and remote Australia
The term ‘rural and remote’ includes all areas outside Australia’s major cities. This includes areas that are classified as inner and outer regional (RA2 and RA3 respectively) and remote or very remote (RA4 and RA5 respectively) under the Australian Statistical Geography Standard (ASGS)5.
Rural and remote parts of Australia encompass the majority of Australia’s land mass(4) however, based on 2013 estimates, almost 71% of the population (n=16 678 000) reside in Australia’s major cities. A little over 27% (n=6 342 000) of Australians reside in regional areas with just 2.3% (n=540 300) living in remote or very remote Australia.(5)
1.3 The health status of the Australian population
The Australian population experiences constant change, which has important implications for the healthcare system. While some of these changes span all age groups, ethnicities and geographies, others tend to emerge based on specific locations and access to healthcare.(20)
Based on 2014–15(6) data, more than 11 million (47%) Australians had at least one chronic condition, with people living in rural and remote areas and Indigenous Australians having significantly increased chronic disease prevalence and risk. According to the AIHW in Australia’s Health 2018(7) and Australia’s Health 2016,(6) coronary heart disease (CHD) was the leading underlying cause of death in Australia, followed by dementia and Alzheimer’s disease, and cerebrovascular disease (mainly stroke). The fourth leading underlying cause of death in 2013 and 2018 was lung cancer, with the fifth being chronic obstructive pulmonary disease (COPD).(6, 7) Good gains have been made in reducing overall Australian chronic disease prevalence, with estimates indicating that after accounting for population increases and ageing, the burden of disease for the Australian population decreased between 2003 and 2011, from 211 to 190 disability-adjusted life years (DALYs)6 per 1000 people.(6)
CVD accounted for almost 20 000 deaths in all areas, from major cities to very remote areas in 2018(7) which was consistent with 2013(6) data. Dementia and cerebrovascular diseases are ranked higher among diseases causing death in major cities and inner regional and outer regional areas compared with the more remote areas,(5) due to longer life spans. Conversely, diabetes mellitus has been ranked higher as a cause of death among people living in remote and very remote areas compared with regional and major city areas, due to poor glucose control leading to micro and macrovascular damage.(21, 22) Furthermore, the leading causes of death for rural and remote Indigenous Australians were CVD, cancer, injury, diabetes and respiratory diseases.(5)
5 The ASGS allocates one of seven remoteness categories to an area (major city, inner regional, outer regional, remote, very remote, migratory-offshore-shipping, and no usual address), based on its distance from a range of population centres. Each of these remoteness categories are also defined by population characteristics. The remoteness structure of the ASGS uses the same principles of the earlier remoteness classification system—the Australian Standard Geographical Classification System Remoteness Areas (ASGC-RA)—which was formerly used to define remoteness structure. Although the ASGS remoteness areas have been defined using a different base unit, the remoteness areas from the ASGC and the ASGS are generally comparable, according to the ABS.
6 Disability-adjusted life years (DALYs) are defined as the measure of overall disease burden, expressed as the number of years lost due to ill health, disability or early death.

16 ROYAL FLYING DOCTOR SERVICE OF AUSTRALIA
Evidence demonstrates that death rates increase with remoteness. The death rate in very remote areas has been estimated(5) at 8.4 per 1000 population compared with 5.5 in major cities; the age-standardised death rate was highest in very remote areas (8.4 per 1000 population), followed by remote, outer regional and inner regional areas (6.1 per 1000 population) and major cities (5.5 per 1000 population). Further, five-year relative survival decreases with increasing remoteness. It was highest for people living in major cities of Australia (67%) and lowest for people living in remote and very remote areas (63%).(5) This trend is concerning and warrants a response of health systems to provide better care in rural and remote Australia.
In a recent AIHW report,(7) it was found that suicide, self-inflicted injuries and anxiety disorders were the leading causes of disease burden in young people (defined as 15–24 years old): among young males it was found to be suicide and self-inflicted injuries; while in young females it was found to be anxiety and depressive disorders. This is consistent with young working-age adults (defined as 25–44 years old) who also experience anxiety disorders as the leading cause of burden.(8)
1.4 RFDS services and population health trends
The RFDS operates a 24/7 aeromedical retrieval service, supported by a 24/7 telehealth system, to patients who live, work or travel in rural and remote Australia, are unable to access normal medical services, and who experience a medical emergency requiring definitive care in a tertiary hospital.
The RFDS conducted 60 943 aeromedical retrievals7 from July 2015 to June 2017 (2 years), equalling an average of 83 transfers per day. Of these, 23.9% were Indigenous patients and 76.0% were non-Indigenous patients, as detailed in Table 1.1. Furthermore, males (56.2%) were more likely (p<0.05) to be transported than females (43.8%) for any illness, with patient ages ranging from <1 to 99 years of age.
Table 1.1. Total aeromedical retrievals per year by Indigenous status
Ethnicity (%) FY 2015/2016 FY 2016/2017 Total
Indigenous 7363 (23.8) 7237 (24.1) 14 600 (23.9)
Non-Indigenous 19 510 (63.2) 19 443 (64.7) 38 953 (63.9)
Unknown 4011 (13.0) 3379 (11.2) 7390 (12.1)
Grand total 30 884 30 059 60 943
* Note percentages have been rounded to one decimal place.
The top five reasons for an RFDS aeromedical retrieval are detailed in Figure 1.1, with nearly half (41.1%) including issues associated with the circulatory system (n=11 371), and injuries and poisoning (n=13 705). Males were significantly more likely to a have an injury or poisoning diagnosis (p<0.05), disease of the circulatory system (p<0.05) or disease of the digestive system (p<0.05) than females. There was not a significant difference in the number of males and females that had diseases of the respiratory system (p>0.05).
7 Including retrievals, IHTs, combined retrievals and IHTs, and repatriation/convalescence

17FROM 90 TO 100: PL ANNING FOR THE HEALTH NEEDS OF COUNTRY AUSTRALIA IN 2028
Figure 1.1. Diagnostic reason for RFDS aeromedical retrievals
Number
Females
Males
Grand total
0 3000 6000 9000 12000 15000
Pregnancy, childbirthand the puerperium
Diseases of therespiratory system
Diseases of thedigestive system
Diseases of thecirculatory system
Injury andpoisoning
026872774
3487
47302187
2541
20081477
11371
8130
137055572
73723997
The RFDS provides extensive primary healthcare services throughout Australia including, although not limited to, GP and nursing clinics. The types of services differ in response to configuration of other local health services in particular regions. The RFDS is in the process of collating its national primary care data. Here, RFDS Queensland (Qld) data is used to illustrate activity in lieu of national data.
The RFDS Queensland Section treated 37 563 patients through primary healthcare services from 1st May 2016 until the 31st May 2018 (2 years), including general practice patients (n=31 610), and medical specialist outreach patients (n=5931). Further, the following clinics were provided: Medicare-Rural and Remote Medical Benefits Scheme Clinics (n=14), Men’s Business program (n=2), and Child Health New Directions program (n=3). There were 13 446 Indigenous patients (35.8 %), 20 851 non-Indigenous (55.5%), and 3267 (8.7%) non-identified, with 18 117 (48.2%) males, 19 425 (51.7%) females, and 23 (0.06%) other.
The top five patient diagnostic reasons for presentations at these health services were: diseases of the skin and subcutaneous tissue (n=5132); diseases of the musculoskeletal system and connective tissue (n=4663); diseases of the circulatory system (n=4506); factors influencing health status and contact with health services (n=3860) such as immunisations, to discuss a problem other than a disease or injury, and for a situation or problem that influences the person's health status (that is not currently an illness or injury); and, endocrine, nutritional and metabolic diseases (n=3037). All other conditions are detailed in Table 1.2. The top five diagnoses are also detailed in Figure 1.2 to allow comparisons between the RFDS aeromedical and primary healthcare data.

18 ROYAL FLYING DOCTOR SERVICE OF AUSTRALIA
Table 1.2. RFDS Queensland primary healthcare patient diagnosis and count8
ICD8 code description Total
Diseases of the skin and subcutaneous tissue 5132
Diseases of the musculoskeletal system and connective tissue 4663
Diseases of the circulatory system 4506
Factors influencing health status and contact with health services 3860
Endocrine, nutritional and metabolic diseases 3037
Diseases of the respiratory system 2796
Diseases of the genitourinary system 2488
Diseases of the digestive system 2331
Symptoms, signs and abnormal clinical and laboratory findings, not elsewhere classified 1919
Mental and behavioural disorders* 1457
Diseases of the ear and mastoid process 1017
Injury, poisoning and certain other consequences of external causes 951
Diseases of the nervous system 636
Pregnancy, childbirth and the puerperium 625
Certain infectious and parasitic diseases 608
Diseases of the eye and adnexa 603
Diseases of blood and blood-forming organs and certain disorders involving the immune mechanism
545
Neoplasms 341
Certain conditions originating in the perinatal period 38
Congenital malformations, deformations and chromosomal abnormalities 9
Codes for special purposes 1
Grand total 37 563
* This data excludes dedicated mental health clinics and dental programs.
8 ICD: International Statistical Classification of Diseases and Related Health Problems.

19FROM 90 TO 100: PL ANNING FOR THE HEALTH NEEDS OF COUNTRY AUSTRALIA IN 2028
Figure 1.2. Total patient diagnostic reason for RFDS Queensland primary healthcare clinics
Number
Females
Males
Grand total (n)
Endocrine, nutritionaland metabolic diseases
Factors includinghealth status and contact
with health services
Diseases of the musculoskeletal system
and corrective tissue
Diseases of thecirculatory system
Diseases of the skin andsubcutaneous tissue
0 1000 2000 3000 4000 5000 6000
14021633
3037
3860
45061982
2523
18472010
4663
2596
51322533
24062254
* Note this figure does not include RFDS Queensland specific mental health outreach programs, which will be discussed below.
Males were significantly (p<0.05) more likely than females to have: diseases of the skin and subcutaneous tissue (14.3% male versus 13.0% female); diseases of the musculoskeletal system and connective tissue (13.3% male versus 11.6% female); diseases of the circulatory system (13.9% male versus 10.2% female); injury, poisoning and certain other consequences of external causes (3.2% male versus 1.9% female); and diseases of the eye and adnexa (1.9% male versus 1.5% female).
Conversely, females were significantly (p<0.05) more likely than males to have: endocrine, nutritional and metabolic diseases (8.4% female versus 7.7% male); diseases of the genitourinary system (8.5% female versus 4.6% male); symptoms, signs and abnormal clinical and laboratory findings, not elsewhere classified (5.4% female versus 4.8% male); mental and behavioural disorders (4.1% female versus 3.6% male); and, as expected, pregnancy, childbirth and the puerperium.
There were non-significant (p>0.05) differences between genders associated with: diseases of the respiratory system; diseases of the digestive system; diseases of the ear and mastoid process; diseases of the nervous system; certain infectious and parasitic diseases; diseases of blood and blood-forming organs and certain disorders involving the immune mechanism; and congenital malformations, deformations and chromosomal abnormalities.
When comparing this data to a recent Bettering the Evaluation and Care of Health (BEACH) report,(23) which included the majority (68.6%) of GPs from metropolitan areas, there were similarities in the presentation. This included similarities in the gender profile, with females comprising 57% of encounters. The top conditions managed, in order of prevalence, were respiratory diseases and conditions of the musculoskeletal system, skin and circulatory system. The RFDS, conversely, treated mainly skin conditions, followed by musculoskeletal and circulatory system complaints. This data indicates that there are differences in the types and prevalence of leading disease types between metropolitan and rural and remote areas.

20 ROYAL FLYING DOCTOR SERVICE OF AUSTRALIA
Between 1st May 2016 and 31st May 2018 (2 years), RFDS Queensland conducted 28 770 consultations through drought outreach, the Cairns Head Space and local social and emotional wellbeing programs. These included 11 710 (40.7%) males, 17 020 (59.2%) females, and 22 (0.08%) intersex, with 12 (0.04%) missing gender. The average age was 38 years old, ranging from 1 to 97 years old. There were 16 173 Indigenous and 9590 non-Indigenous patients. The top five mental health clinics included Longreach (patients=7822), Cairns (patients=9216), Aurukun (patients=5513), Coen (patients=2225), and Mossman Gorge (patients=1455).
1.5 Summary
The Australian population has a varied ethnicity, with the majority of people living in metropolitan areas. While the rural and remote parts of Australia encompass most of Australia’s land mass, only a minority, 29%, of the population lives in these areas.
CHD is currently the leading underlying cause of death in Australia, followed by dementia and Alzheimer’s disease, and cerebrovascular disease (mainly stroke). Current available data indicates that CVD and its comorbidities, such as diabetes mellitus, are the leading contributors of death in rural and remote populations.
The disease profile of those who received an RFDS aeromedical retrieval indicated nearly half the diagnoses were associated with the circulatory system and injuries and poisoning, followed by diseases of the digestive system, diseases of the respiratory system, and pregnancy, childbirth and the puerperium. Conversely, the primary care data indicates that the leading clinical diagnoses included diseases of the skin and subcutaneous tissue, diseases of the musculoskeletal system and connective tissue, diseases of the circulatory system, factors influencing health status and contact with health services, endocrine, nutritional and metabolic diseases. Furthermore, the data indicates significant differences between the disease profile of males and females.
The next chapter (Chapter 2) will provide further detail of current RFDS services, including geographical patient mapping.

21FROM 90 TO 100: PL ANNING FOR THE HEALTH NEEDS OF COUNTRY AUSTRALIA IN 2028
Chapter 2: The RFDS in 2018
> The RFDS provides essential healthcare services to rural and remote Australians, where low population densities and distance from larger towns make traditional service models unviable.
> In 2016–17, the RFDS had 336 358 patient contacts through primary healthcare and dental clinics, aeromedical retrievals and telehealth consultations.
> The RFDS Service Planning and Operational Tool (SPOT) indicates that there are still service provision gaps in the provision of health services for rural and remote populations.

22 ROYAL FLYING DOCTOR SERVICE OF AUSTRALIA
2.1 Role of the RFDS in rural and remote Australia
Patients in rural and remote areas who require definitive care in a tertiary hospital are transported via an RFDS PE or IHT, hereafter referred to as an aeromedical retrieval.(2) The rationale for a PE is that a person is injured or ill and requires acute care, but their location is beyond reasonable access to normal medical infrastructure. That is, no other effective care option exists. IHTs move a patient from one hospital to another where the patient’s care needs exceed those available at the first hospital. For both PEs and IHTs, back-of-aircraft medical and nursing skills and equipment are configured to the individual patient’s need. Non-emergency patients are also transported by road, with 70 342 patients transferred in 2016–17.
In addition to aeromedical retrievals, the RFDS provides extensive primary healthcare services in rural and remote areas. By providing services to people who, because of geographic factors, are unable to access services under the MBS, the RFDS plays a pivotal role in providing universal access to health services, including on behalf of the Commonwealth.
The RFDS is a federated health charity, with services delivered through RFDS ‘Sections’ and ‘Operations’, comprising RFDS Central Operations (includes South Australia (SA) and Northern Territory (NT)), RFDS Queensland (Qld) Section, RFDS South Eastern (SE) Section9 (includes New South Wales (NSW)), RFDS Tasmanian (Tas) Section, RFDS Victorian (Vic) Section, RFDS Western Operations (includes Western Australia (WA)). Each of the RFDS Sections and Operations has responsibility for the delivery of health services to the communities it serves through the establishment of effective systems and maintenance of efficient operations. The Sections and Operations are coordinated at a national level by the RFDS of Australia—Federation Company (Federation Office).
In 2016–17, the RFDS had 336 358 patient contacts with rural and remote Australians through primary health and dental health clinics, aeromedical retrievals and telehealth consultations. With a fleet of 69 aircraft, operating from 23 aviation bases spread across all Australian states and territories, except the Australian Capital Territory (ACT), the RFDS serviced 7 150 000 square kilometres of Australia and flew over 26 million kilometres.(24) A further 70 576 patients were transported by RFDS road transport services over this time. Activity levels are detailed by financial year in Table 2.1
Figure 2.1 RFDS bases (aeromedical and road transport)
QLD
NT
WA
NSW
SA
V I C
TA S
Kalgoorlie
Meekatharra
Alice Springs
Mount Isa
Darwin
Broken Hill
Marla
Mildura
Dubbo
Sale
Charleville RomaBallera
Longreach
Moomba
Marree
Horsham
Shepparton
WangarattaBallarat
Andamooka
Port Augusta
Melbourne Morwell
Wonthaggi
Perth
Port Hedland
Broome
Townsville
Brisbane
Sydney
Bundaberg
Rockhampton
Launceston
Cairns
AdelaideWodonga
9 The SE Section of the RFDS also provides aeromedical retrieval services to patients in Tas and Vic

23FROM 90 TO 100: PL ANNING FOR THE HEALTH NEEDS OF COUNTRY AUSTRALIA IN 2028
Table 2.1. RFDS services and patient contacts, 2016-17
2016/17 PER DAY 2015/16 2014/15 2013/14 2012/13
Total patient contacts 336,358 944 282,877 292,523 282,000 295,156
Aeromedical retrievals 36,799 101 37,252 64,673 54,705 51,651
Patient road transportations 70,576 193 53,159 26,952 – –
Primary health care clinics 17,094 48 9,323 15,248 16,096 15,819
Episodes of dental care 10,832 30 8,975 9,845 9,861 6,913
Telehealth consultations 88,541 243 62,372 92,776 82,305 89,516
Staff numbers (headcount) 1,462 n/a 1,358 1,224 1,144 1,163
Staff FTE (full-time emplyment) 1,220 n/a 1,072 1,059 978 957
Medical Chests 2,338 n/a 2,245 2,359 2,532 2,568
The RFDS notes the National Aboriginal Community Controlled Health Organisation (NACCHO) and its state-based organisations provide a pivotal service to rural and remote communities. NACCHO supports the Aboriginal Medical Service (AMS) which is a primary healthcare service operated by local Aboriginal communities. The RFDS works in close partnership with many remote branches of the AMS, and respects and promotes the principle of community control.
2.2 Geographical analysis of the RFDS, gaps and opportunities
2.2.1 Geographical analysis methods (SPOT)
SPOT is designed for exploring healthcare coverage in remote and very remote Australia. It was developed in 2016 by ORH for use by the RFDS.
Working from a geographical distribution of ‘demand’ and a set of healthcare facilities that provide cover for a range of services, SPOT calculates the proportion of demand covered by those facilities within a user-specified drive time. Demand is represented by population levels in different categories (e.g. Indigenous over 55) as well as some specific RFDS demand types (e.g. PEs).
The tool can also be used to assess the current coverage provided for different services provided bythe RFDS, or by non-RFDS providers, or both. It can thus be used to identify ‘gaps’ in healthcare coverage for different demand/service pairings and will suggest the best new service locations for improving coverage.
SPOT has been used by the RFDS to identify areas of low service provision. This then allows targeted interventions to these areas by clinical need, whether for GP clinics, mental health or dental services. SPOT has been used in this report to geographically represent current clinical provision and demand.
2.2.2 RFDS aeromedical retrievals in rural and remote Australia
As detailed, the RFDS conducted 60 943 aeromedical retrievals from July 2015 until June 2017 (2 years), equalling an average of 83 retrievals per day. Of these, 23.9% were Indigenous patients and 63.6% were non-Indigenous patients. Figure 2.1 details the locations of the most urgent retrievals from July 2015 to June 2017.
24 ROYAL FLYING DOCTOR SERVICE OF AUSTRALIA
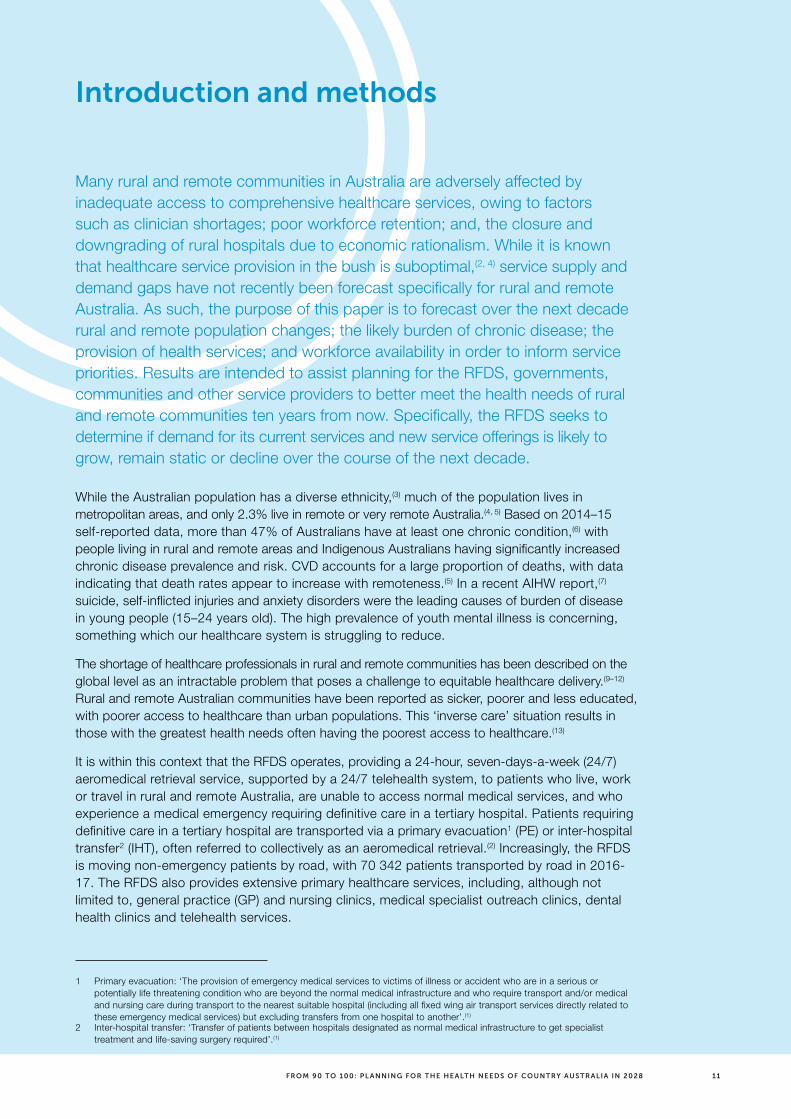
Figure 2.2 RFDS aeromedical retrievals by Indigenous status and location (July 2015 – June 2017)
* Please note that the larger the dot size, the more retrievals conducted from this location.
* This map is intended to show demand for the most urgent aeromedical retrievals. As such, this map includes data only for PEs and not IHTs. This impacts the presentation of activity, particularly in Qld, NSW and Vic, where a substantial number of less urgent IHTs are provided.
2.2.3 RFDS primary healthcare services in rural and remote Australia
In addition to aeromedical retrievals, the RFDS provides extensive primary healthcare services to rural and remote Australians. By providing services to people who, because of geographic factors, are unable to access services under the MBS, the RFDS plays a pivotal role in the provision of universal access to primary healthcare.
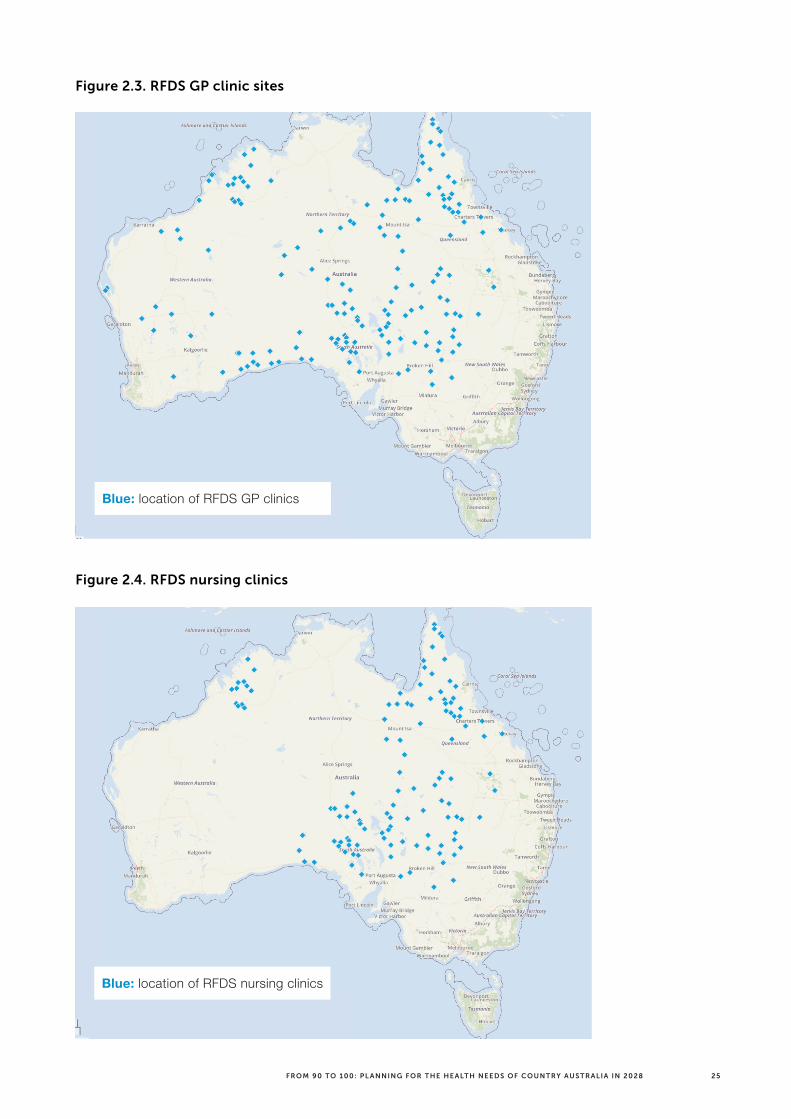
RFDS primary healthcare services are provided predominantly through GP, nursing and dental health clinics with more than 15 000 clinics delivered in 2016–17. The following paragraphs give a general description of each service, followed by a geographic map detailing supply and demand.
GP and nursing clinics
GP and nursing clinics are held on a regular basis in remote in rural and remote locations, with the frequency of clinic visits depending on local needs. The RFDS provided 17 094 GP and nursing clinics in 2016–17. Figures 2.3 and 2.4 detail current locations of RFDS GP and nursing clinics. Outside of these regular clinics, medical advice is also provided through the 24/7 remote consultation (telehealth) services, with 88 541 consultations conducted in the 2016–17 financial year.
Red: Indigenous patient evacuations
Blue: Non Indigenous
25FROM 90 TO 100: PL ANNING FOR THE HEALTH NEEDS OF COUNTRY AUSTRALIA IN 2028
Figure 2.3. RFDS GP clinic sites
Figure 2.4. RFDS nursing clinics
Blue: location of RFDS GP clinics
Blue: location of RFDS nursing clinics
26 ROYAL FLYING DOCTOR SERVICE OF AUSTRALIA
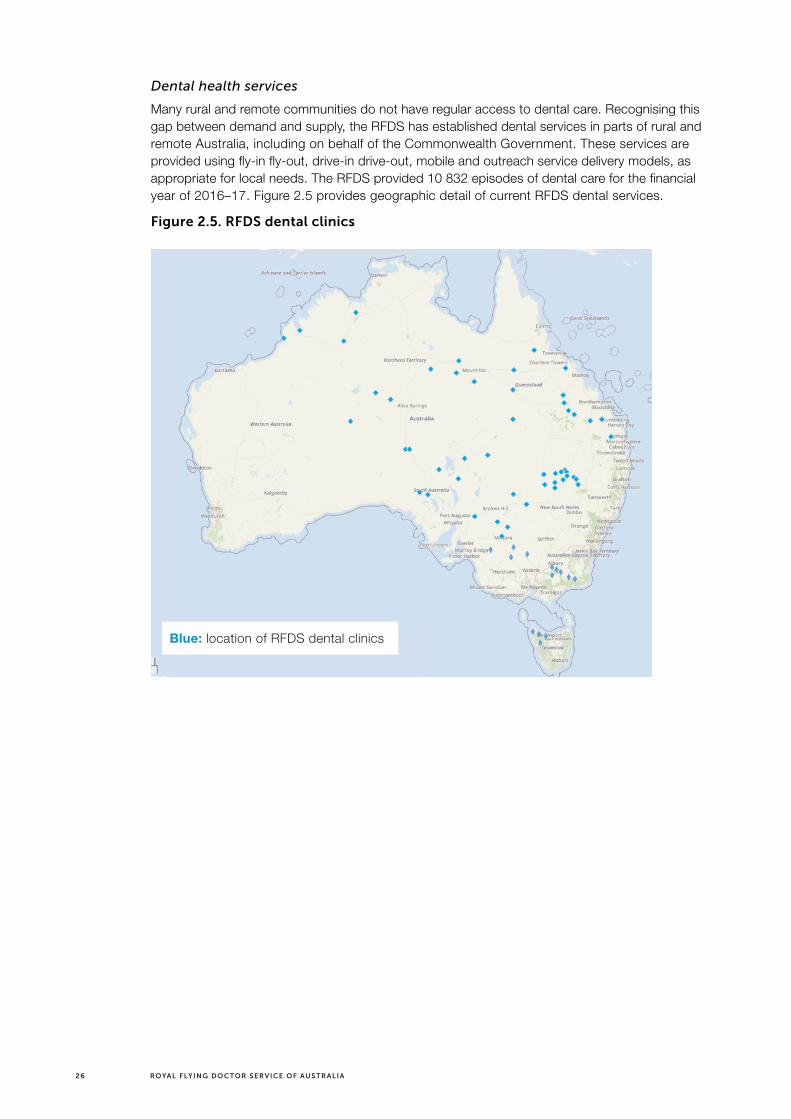
Dental health services
Many rural and remote communities do not have regular access to dental care. Recognising this gap between demand and supply, the RFDS has established dental services in parts of rural and remote Australia, including on behalf of the Commonwealth Government. These services are provided using fly-in fly-out, drive-in drive-out, mobile and outreach service delivery models, as appropriate for local needs. The RFDS provided 10 832 episodes of dental care for the financial year of 2016–17. Figure 2.5 provides geographic detail of current RFDS dental services.
Figure 2.5. RFDS dental clinics
Blue: location of RFDS dental clinics

27FROM 90 TO 100: PL ANNING FOR THE HEALTH NEEDS OF COUNTRY AUSTRALIA IN 2028
Medical chests
People located in remote areas and areas isolated from medical services can apply to the RFDS to become custodians of a medical chest: a secure package of pharmaceutical items used under the direction of an RFDS clinician. Medical chests can be provided to remote communities located more than 80 kilometres, or separated by geographic features such as regular flooding, from primary healthcare, such as hospitals and health centres to ensure access to critical pharmaceutical items. Figure 2.6 details the locations of the RFDS medical chests.
Figure 2.6. RFDS Medical chests
* This map does not include low numbers of medical chests in the eastern regions, Victoria or Tasmania.
Other services
The RFDS also operates a non-emergency patient ground transport, remote telephone consultations, other telehealth services such as videoconferencing (telehealth locations detailed in Table 2.2), outreach programs, health promotion and education activities, clinic charter services, repatriation services, evacuations by charter aircraft from tour vessels along the Kimberly coast, and assistance with staffing other aeromedical services that provide rescue activities.
The RFDS has long experience in moving patients, including ground transportation. Of note, as small rural and remote hospitals are being closed or downgraded, more patients are being moved by the RFDS road transports. As such, moving patients by ground will continue to increase in demand as more ‘hospital in home’ occurs. It is expected that ground transportation will continue to grow in the next ten years.
Blue: location of RFDS medical chests

28 ROYAL FLYING DOCTOR SERVICE OF AUSTRALIA
Table 2.2. RFDS telehealth locations and total calls received, 2016-17
Base and location Telehealth calls*
Central Operations Port Augusta 3487
Andamooka 706
Marla 424
Marree 819
Total 5436
Queensland Section Brisbane 5429
Bundaberg 5359
Cairns 8343
Charleville 1680
Mount Isa 6209
Rockhampton 6195
Townsville 4617
Total 37 832
South Eastern Section
Broken Hill 6346
Total 6346
Western Operations
Broome 5461
Derby 7082
Jandakot 10 537
Kalgoorlie 6908
Meekatharra 4707
Port Hedland 3611
Total 38 306
Victorian Section
Balranald 4
Dareton 20
Kerang 54
Mildura 255
Nhill 23
Robinvale 63
Swan Hill 2
Underbool 3
Warracknabeal 3
Heathcote 2
Total 429
Grand total 88 349
* The four types of telehealth calls were: 1) patient’s matter resolved during consult; 2) country health service taking RFDS medical advice in patient management (i.e. remote area nurse and/or AMS); 3) medical specialist consultation; 4) patient-initiated call ultimately requiring primary evacuation.

29FROM 90 TO 100: PL ANNING FOR THE HEALTH NEEDS OF COUNTRY AUSTRALIA IN 2028
CASE STUDY > A PATIENT PERSPECTIVE: WHAT THE RFDS PRIMARY CARE CLINICS ARE SEEING
Graphic: Shannon Forrest
Shannon’s story
White Cliffs, a small town 93 kilometres north of Wilcannia, is just one of many clinics we operate. The Flying Doctor team visits the clinic every week for general primary healthcare appointments. A dentist and a member of the mental health team also visit fortnightly, while specialists visit depending on patient demand.
One of the patients shares his story of why RFDS clinics are so important to those in the outback:
Shannon Forrest relies on the regular White Cliffs clinic for general healthcare for himself and his family. On the day we visited the clinic, he was in for a check-up following a disturbing incident with serious heart palpitations the previous week. ‘My heart was pounding out of my chest; it was not normal,’ recalls Shannon. He was so concerned he phoned the clinic for an appointment. ‘It had all stopped by the time I got on the bed [for examination]. So I’m here today to take blood tests.’
Far more frightening was the time the family was on a hill taking photos of lightning. ‘There were no trees around and it was late in the afternoon,’ says Shannon, who lives with his family in a dugout (underground house) at White Cliffs. ‘The lightning hit the car first and seemed to spray onto us. We all had thongs on and I think that saved us! The camera doesn’t work anymore though.’
Shannon drove them straight to the clinic, which was still open. ‘My wife, myself and my son were able to race in here,’ says Shannon. ‘I felt really sick, like migraine headaches.’ Fortunately, the family all recovered from the shock. ‘We’d all be knackered if there wasn’t a clinic here,’ he says. ‘It’d be no good driving to Wilcannia if you needed to see a doctor in an emergency.’

30 ROYAL FLYING DOCTOR SERVICE OF AUSTRALIA
CASE STUDY > A PATIENT PERSPECTIVE: WHAT THE RFDS ORAL HEALTH CLINICS ARE SEEING
Graphic: Flying Doctor Dental Clinic in Wedderburn
Elvina’s Story
This year, the Flying Doctor Dental Clinic was requested to visit the rural community of Wedderburn. Without its own dentist, and the closest clinic 50 kilometres away in Boort, the town’s Development Association sought the assistance of the RFDS to provide oral health care for the town’s residents. Previous attempts to recruit a permanent dentist for the town had been unsuccessful.
President of the Development Association of Wedderburn, Greg Deimos, saw the Flying Doctor Dental Clinic as he travelled to Melbourne. He wrote down the phone number from the side of the truck and called RFDS Victoria and arranged for the Flying Doctor Dental Truck to visit the community.
With a unique and challenging case, Wedderburn resident Elvina Heath was happy to see a dentist in her home town, since, as a full-time carer for her husband, who has motor neurone disease, she wasn’t able to travel. Elvina reported that she had much pain and discomfort, but after seeing the Flying Doctor dentist she was given the treatment she needed, close to home. Elvina said, ‘If the Flying Doctor Dental Clinic didn’t come to Wedderburn, I wouldn’t have seen a dentist.’

31FROM 90 TO 100: PL ANNING FOR THE HEALTH NEEDS OF COUNTRY AUSTRALIA IN 2028
Figure 2.7. All rural and remote clinics, GPs and hospitals (inclusive of RFDS)
* This map includes all the Australian registered healthcare clinics, GPs and hospitals, as per HealthDirect. This includes all RFDS, AMS and state health services.
** This map aims to demonstrate the extensive reach that the RFDS currently has to rural and remote areas of Australia. However, there still appears to be service gaps.
2.3 Summary
This chapter provided high-level detail on the services of the RFDS. The maps indicate that there are significant gaps in health service provision for rural and remote populations, with many still required to travel to access care. The next chapter (Chapter 3) will discuss the projected Australian needs in 2028, based on current service provision, demand and population growth.

32 ROYAL FLYING DOCTOR SERVICE OF AUSTRALIA
Chapter 3: Projecting Australian health needs in the year 2028
> The Australian population is projected to grow steadily at around 1.6% per year over the next decade, reaching approximately 29.4 million in 2028.
> The population of remote and very remote areas grew by 2.0% (0.2% annually) in the decade 2007 (n=484 207) to 2017 (n=493 752), and is predicted to continue growth at this rate over the next decade, increasing to 504 724 by 2028.
> It is expected that people aged 65 years and over will make up 22% of the population in 2061 and 25% in 2101, up from the current 15.6% in 2018.
> It is anticipated that as people live longer, they will also develop a greater prevalence of chronic disease, which will be even more apparent in an increasingly ageing population.
> It is projected that 13.8 million people will be living with at least one chronic disease by 2028, up from 11.8 million in 2018.
> Neurological diseases have increased by 3.7% per year from 2003 through to 2011, indicating that without intervention this prevalence will continue to grow until 2028.
> In 2009–11, rural and remote people had higher mortality rates (1.4 times) compared to people in metropolitan areas, with coronary heart disease (CHD) between 1.2 and 1.5 times more prevalent in rural and remote areas.

33FROM 90 TO 100: PL ANNING FOR THE HEALTH NEEDS OF COUNTRY AUSTRALIA IN 2028
3.1 Total population forecast
The Australian population is growing at a constant rate. This chapter is designed to provide a projection of population growth based on specific assumptions, including future levels of fertility, mortality, internal migration and overseas migration over the projection period, based on ABS forecasting reports.(14)
The Australian population was measured at 23.4 million people in 2016. The latest detailed reports indicate that the population is projected to increase to between 36.8 and 48.3 million people by 2061. Recent growth estimates appear to be varied, although the ABS reported an average growth rate from 1992 to 2012 of 1.3% per year, with just over half resulting from net overseas migration and just under half from natural causes. Growth rates from 2016 to 2017 were slightly higher than this figure at 1.6%, mainly due to an increase in net overseas migration (63.2%) over natural increases (36.8%).(26) In 2028, the population is projected to be around 29.4 million with a percentage growth of 1.4% from the subsequent year.
Overall, Australia’s population is expected to continue to age over the next decade. This is believed to be due to a reduction in the ‘replacement of fertility’ (or average child per mother) combined with increasing life expectancy. In the year 2018, people aged 65 years and over made up 15.6% of Australia's population. This is projected to increase to 22% in 2061 and to 25% in 2101, as detailed in Figure 3.1. With these increases it is expected that as people live longer, they will also develop and manage a greater prevalence of chronic disease, thus resulting in increased health service utilisation and demand.
The median age (the age compared to which half the population is older and half is younger) of the Australian population has increased by 3.0 years over the last two decades, from 34 years in 1995 to 37 years in 2015.(27) This figure is projected to increase to between 38.6 years and 40.5 years in 2031 and to between 41.0 years and 44.5 years in 2061.(14) The 2018 median age was 37.2,(28) which is estimated to grow to a median age of 39 in 2028.
Figure 3.1. Projected ten-year growth in the 65 and older age group
Per
cen
t
Years
2018 2019 2020 2021 2022 2023 2024 2025 2026 2027 2028
85 years and over65 years and over
2
15.6
2
15.8
2
16.1
2.1
16.3
2.1
16.6
2.1
16.8
2.1
17.1
2.2
17.4
2.2
17.7
2.3
17.9
2.4
18.2
0
5
10
15
20
25

34 ROYAL FLYING DOCTOR SERVICE OF AUSTRALIA
3.2 Rural and remote population forecast
Very remote and remote areas of Australia grew by 2.0% between 2007 (n=484 207) and 2017 (n=493 752), compared to a growth of 18.5% in all other areas between 2007 (n=20.3 million) and 2017 (n=24.1 million). This equals an average yearly increase of 0.2% in very remote and remote areas compared to 1.8% in outer and inner regional areas and major cities. Remote population changes are detailed in Figures 3.2, 3.3 and 3.4, which indicate that the remote and very remote population decreased by 0.5% from 2016 to 2017. However, it is expected that the population will steadily grow by about 0.2% per year until 2028, equalling an increase from 493 752 in 2017 to 504 724 in 2028.
Figure 3.2. Changes in the very remote population from 2007–17, and projections to 2028
Years
Very Remote Australia
2028
2027
2026
2025
2024
2023
2022
2021
2020
2019
2018
2017
2016
2015
2014
2013
2012
2011
2010
2009
2008
2007
Peo
ple
180000
185000
195000
190000
200000
210000
205000
215000
* The year 2013 was impacted by the mining boom downturn.
Figure 3.3. Changes in the remote population from 2007–17, and projections to 2028
Years
Remote Australia
2028
2027
2026
2025
2024
2023
2022
2021
2020
2019
2018
2017
2016
2015
2014
2013
2012
2011
2010
2009
2008
2007
Peo
ple
280000
290000
285000
295000
305000
300000
310000
* The year 2013 was impacted by the mining boom downturn.

35FROM 90 TO 100: PL ANNING FOR THE HEALTH NEEDS OF COUNTRY AUSTRALIA IN 2028
Figure 3.4. Population changes by Australian regional area (SA3), 2016–2018
Adapted from: Australian Bureau of Statistics.(28)
3.3 Australian chronic disease burden to 2028
Chronic diseases are currently the leading cause of poor health and death in Australia. Based on 2014–15 data,(6) more than 11 million Australians have a least one chronic condition, with many having two or more. This was consistent with the recent Australia’s Health report,(7) which found that 50% of Australians are estimated to have at least one of the following chronic conditions: cancer, CVD, mental health conditions, arthritis, back pain and problems, COPD, asthma and diabetes.
According to the Australian Burden of Disease Study,(29) cancer, CVD, mental health and substance use disorders, musculoskeletal disorders, and injuries account for around two-thirds of the disease burden in Australia. This result is consistent with recent data indicating that the three chronic conditions that contribute most to the disease burden in Australia in 2018 were cancer, CHD and mental illness.(7) These results were also consistent with RFDS data(2) which shows nearly half (41.1%) of aeromedical retrievals were associated with injuries and poisoning (n=13 705) and the circulatory system (n=11 371). This is pertinent given that research consistently shows that CVD burden of disease (up to 31%) could be prevented by reducing exposure to modifiable risk factors such as tobacco use, harmful alcohol use, high body mass index, physical inactivity and high blood pressure.(30)
In 2011, there were 201 years of healthy life lost due to premature death or living impeded by disease or injury for every 1000 people in Australia, measured in Disability Adjusted Life Years (DALYs). This is equivalent to 4.5 million DALYs in total, and between 2003 and 2011, Australia has seen a 6.9% increase in the number of DALYs, s from 4.2 to 4.5 million. When considering the increasing age of the population, overall burden decreased from 211 to 190 DALYs per 1000 people, equalling a decrease of 10%. This improvement came from decreased fatal burden rates, and reducing deaths from CVD and injuries. Table 3.3 indicates that there was change in the

36 ROYAL FLYING DOCTOR SERVICE OF AUSTRALIA
overall burden between 2003 and 2011, with significant changes in infants and those aged 55–89, but higher for those aged 95 or more. The increase in the number of DALYs experienced by those aged 55–89 is due to the increased population in this group relative to 2003.(30)
Table 3.1. Number and rates of DALYs, by age, 2003 and 2011
Age group (years) DALYs 2003 DALYs 2011
Crude DALYs rate 2003
Crude DALYs rate 2011
DALYs difference between 2003 and 2011
Under 1 111 785 105 556 449 363 -86
1–4 44 514 40 377 44 35 -9
5–9 50 897 52 356 38 38 0
10–14 65 360 66 829 48 48 0
15–19 130 162 122 996 96 85 -11
20–24 149 757 155 520 111 96 -15
25–29 166 061 179 548 123 108 -15
30–34 199 664 186 549 132 121 -11
35–39 209 321 211 392 144 134 -10
40–44 253 754 244 891 167 154 -13
45–49 265 675 271 747 190 176 -14
50–54 281 766 313 167 217 210 -7
55–59 303 800 326 527 266 244 -22
60–64 298 573 373 670 347 305 -42
65–69 310 032 358 448 436 376 -60
70–74 348 886 352 671 558 485 -73
75–79 378 387 343 938 711 616 -95
80–84 321 241 351 869 886 792 -94
85–89 201 337 271 608 1073 998 -75
90–94 90 441 126 801 1241 1225 -16
95–99 21 143 33 729 1265 1361 96
100+ 2666 4236 1157 1388 231
Totals 4 205 222 4 494 425 9699 9358 -341
Adapted from: Australian Burden of Disease Study 2011; Table S3.1.5.(29)
When comparing the actual 2003 and 2011 DALYs by disease group, it was found that most were lower than expected, thus indicating an overall improvement in disease burden. CVD was lower in 2011 than in 2003, and much lower than predicted. However, mental health increased in line with predictions.(29)
Table 3.2 details the expected and actual DALYs between 2003 and 2011,(30) and the predicted 2028 DALYs. Figure 3.5 details the top predicted diseases for DALYs, which include cancer, CVD, mental health, musculoskeletal and injury. Neurological diseases have increased by 3.7% per year from 2003 to 2011, and with an ageing population, it is likely that without intervention this trend will continue. Rural and remote areas had significantly (p<0.05) more DALYs compared to metropolitan areas, including more cancer, injury and mental health burden of disease.

37FROM 90 TO 100: PL ANNING FOR THE HEALTH NEEDS OF COUNTRY AUSTRALIA IN 2028
Tab
le 3
.2. A
ctu
al D
ALY
in 2
00
3 a
nd
20
11, a
nd
pre
dic
ted
in 2
02
8
Dis
ease
gro
up
Act
ual
200
3 D
ALY
Act
ual
201
1 D
ALY
Diff
eren
ce
bet
wee
n 2
003
and
201
1 ac
tual
s
Pre
dic
ted
yea
rly
chan
ge
fro
m 2
011
to 2
028
(%)
Pre
dic
ted
202
8 (%
)*
2011
DA
LY p
er
1000
: M
ajo
r ci
ties
**
2011
DA
LY p
er
1000
: R
ura
l an
d
rem
ote
**
2028
DA
LY
pre
dic
ted
per
100
0:
Maj
or
citi
es
2028
DA
LY
pre
dic
ted
per
100
0:
Ru
ral &
rem
ote
Can
cer
767
210
833
250
66 0
401.
091
0 51
6.8
(17.
0)32
.837
.638
.444
.0
Car
dio
vasc
ula
r72
5 87
865
7 20
3-6
8 67
5-1
.352
3 13
3.6
(-20
.4)
24.8
37.6
19.7
29.9
Men
tal
480
736
542
554
61 8
181.
461
9 33
1.9
(24.
2)25
.621
.831
.827
.1
Mu
scu
losk
elet
al52
4 40
352
1 28
6-3
117
-0.1
514
509.
3 (-
1.3)
2125
.220
.724
.9
Inju
ry37
0 26
039
4 45
424
194
0.8
445
733.
02 (1
3.0)
1531
.717
.035
.8
Res
pir
ato
ry34
3 11
437
4 98
531
871
1.1
442
710.
9 (1
8.1)
15.4
19.6
18.2
23.1
Neu
rolo
gic
al21
6 23
730
6 40
990
172
3.7
498
024.
5 (6
2.5)
1213
.219
.521
.5
Gas
tro
inte
stin
al12
8 61
414
3 13
614
522
1.3
173
995.
3 (2
1.6)
5.7
8.2
6.9
10.0
Infa
nt/
con
gen
ital
121
076
119
951
-112
5-0
.111
7 56
0.4
(-2.
0)5
7.6
4.9
7.4
En
do
crin
e86
395
106
097
19 7
022.
314
7 96
3.8
(39.
5)4.
17.
65.
710
.6
Ora
l84
525
98 9
3614
411
1.8
129
559.
4 (3
1.0)
3.7
5.8
4.8
7.6
Hea
rin
g/v
isio
n79
153
97 0
5517
902
2.3
135
096.
8 (3
9.2)
3.9
45.
45.
6
Ski
n66
524
76 9
5110
427
1.7
99 1
08.4
(28.
8)3.
43.
74.
44.
8
Infe
ctio
ns
84 7
9073
235
-11
555
-2.0
48 6
80.6
(-33
.5)
2.9
5.1
1.9
3.4
Kid
ney
/uri
nar
y46
926
59 3
4412
418
2.6
85 7
32.3
(44.
5)2.
35.
93.
38.
5
Blo
od
/met
abo
lic45
247
50 4
9352
461.
361
640
.8 (2
2.1)
22.
52.
43.
1
Rep
rod
uct
ive/
mat
ern
al34
136
39 0
8849
521.
649
611
.0 (2
6.9)
1.6
1.7
2.0
2.2
Ave
rag
e24
7 36
626
4 37
817
012
130
0 52
8.6
(19.
5)10
.714
.012
.215
.8
Ad
apte
d fr
om:
Aus
tral
ian
Bur
den
of D
isea
se S
tud
y 20
11;
Tab
le S
3.1.
6.(2
9)
* Th
is e
stim
ate
is b
ased
on
year
ly p
erce
ntag
e in
crea
ses
and
may
var
y d
epen
din
g on
pop
ulat
ion
grow
th a
nd t
arge
ted
inte
rven
tions
.

38 ROYAL FLYING DOCTOR SERVICE OF AUSTRALIA
Figure 3.5. Predicted prevalent DALY diagnosis in 2028 for all Australia
Cancer 21%
Cardiovascular 12%
Mental 14%
Musculoskeletal 12%Injury 10%
Respiratory 10%
Neurological 11%
Gastrointestinal 4%
Infant 3%
Endocrine 3%
Due to neurological disorders being more prevalent in older adults, with a longer life expectancy, there is an unprecedented increase in the number of people affected by neurological disorders.(31) This is currently an area of need, which should be considered in policy development. This is particularly the case in remote areas where there are fewer services designed for neurological disease burden management.
3.4 Rural and remote Australia chronic disease burden
People living in rural and remote areas tend to have a lower life expectancy and higher prevalence of disease and injury, coupled with poorer access to health services compared to metropolitan areas.(2, 7) In 2015, age-standardised potentially avoidable death rates increased with remoteness, with people living in very remote areas having a death rate over 2.5 times higher than people living in major cities (256 per 100 000 population compared with 96 per 100 000 population).(7) Figure 3.6 highlights that people living in rural and remote Australia have much higher DALYs compared to those living in major cities inner regional areas.
There are many potential reasons for this, reflecting both social and geographical factors, such as reduced educational and employment opportunities, income, and healthcare provision and thus access. Those living in rural and remote areas face more occupational and physical risks, including farming and mining injuries and, transport accidents – for example, the Australian Health Status Report(30) details the rate of death due to a land motor vehicle accident was four times higher in rural and remote areas.(2) This, coupled with higher rates of tobacco smoking, drug use and alcohol misuse all contribute to poorer health outcomes.(2, 7, 30)

39FROM 90 TO 100: PL ANNING FOR THE HEALTH NEEDS OF COUNTRY AUSTRALIA IN 2028
Figure 3.6. Total burden of disease by remoteness area and age group, rate and rate ratio between very remote areas and major cities, 2011
1,800
1,600
1,400
1,200
1,000
800
600
400
200
0
DALY
Age group (years)
70–74 75–79 80–84 85+65–69
Rate ratio
RemoteOuter regions
Major citiesInner regional
Very remote
Rate Ratio
1.7
1.6
1.5
1.4
1.3
1.2
1.1
1.0
Source: Australian Institute of Health and Welfare.(29)
Mortality rates and causes differ in rural and remote areas as compared to metropolitan areas. In 2009–11, rural and remote areas had higher mortality rates (1.4 times) than people in metropolitan areas, with CHD between 1.2 and 1.5 times more prevalent in rural and remote areas. The leading comorbidity associated with CVD is diabetes mellitus, with rural and remote patients being between 2.5 and 4 times more likely to have diabetes mellitus compared with people in major cities. In 2017, 7696 rural and remote Australians underwent an RFDS aeromedical retrieval for CVD, with many of the patients having comorbidities such as hypertension and diabetes mellitus.
The self-reported 2014–15 National Health Survey (NHS)(32) compared people living in metropolitan areas with those in regional and remote areas, with the latter having increased prevalence of arthritis, back pain, asthma and COPD. Table 3.3 details the prevalence of chronic disease by Australian geographical location, while Table 3.4 details the leading reason for an RFDS aeromedical retrieval for the 2014–15 financial year. There appears to be consistency when comparing the NHS to the RFDS aeromedical data, including a high prevalence of CVD (and associated comorbidities) and diseases of the respiratory system, such as COPD.
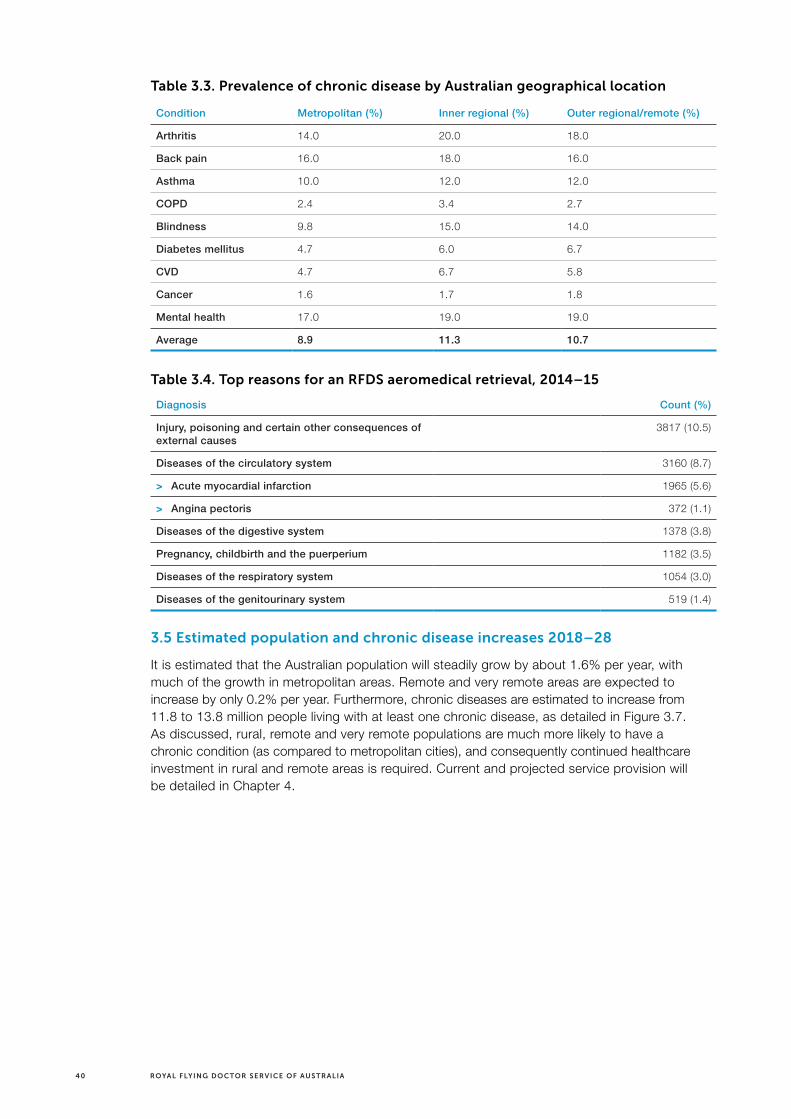
40 ROYAL FLYING DOCTOR SERVICE OF AUSTRALIA
Table 3.3. Prevalence of chronic disease by Australian geographical location
Condition Metropolitan (%) Inner regional (%) Outer regional/remote (%)
Arthritis 14.0 20.0 18.0
Back pain 16.0 18.0 16.0
Asthma 10.0 12.0 12.0
COPD 2.4 3.4 2.7
Blindness 9.8 15.0 14.0
Diabetes mellitus 4.7 6.0 6.7
CVD 4.7 6.7 5.8
Cancer 1.6 1.7 1.8
Mental health 17.0 19.0 19.0
Average 8.9 11.3 10.7
Table 3.4. Top reasons for an RFDS aeromedical retrieval, 2014–15
Diagnosis Count (%)
Injury, poisoning and certain other consequences of external causes
3817 (10.5)
Diseases of the circulatory system 3160 (8.7)
> Acute myocardial infarction 1965 (5.6)
> Angina pectoris 372 (1.1)
Diseases of the digestive system 1378 (3.8)
Pregnancy, childbirth and the puerperium 1182 (3.5)
Diseases of the respiratory system 1054 (3.0)
Diseases of the genitourinary system 519 (1.4)
3.5 Estimated population and chronic disease increases 2018–28
It is estimated that the Australian population will steadily grow by about 1.6% per year, with much of the growth in metropolitan areas. Remote and very remote areas are expected to increase by only 0.2% per year. Furthermore, chronic diseases are estimated to increase from 11.8 to 13.8 million people living with at least one chronic disease, as detailed in Figure 3.7. As discussed, rural, remote and very remote populations are much more likely to have a chronic condition (as compared to metropolitan cities), and consequently continued healthcare investment in rural and remote areas is required. Current and projected service provision will be detailed in Chapter 4.

41FROM 90 TO 100: PL ANNING FOR THE HEALTH NEEDS OF COUNTRY AUSTRALIA IN 2028
Figure 3.7. Population growth by geographical location and chronic disease prevalence
* Much of the growth in rural and remote populations is expected to be in the rural population, with minor growth in the remote and very remote areas (i.e. 0.2% per year).
This indicates that although the rural and remote population will not grow as quickly as major cities, growth nonetheless will occur in both the number of people and, more significantly, the rate of chronic illness they will suffer. There will be some change in the type and complexity of illness that are most prevalent, particularly in relation to increasing levels of age-related conditions. Service provision will need to increase in some areas, and overall need to adjust to meet these changing needs. This is discussed further in relation to project workforce supply in the next chapter (Chapter 4).
Metro areas
Rural and remotePopulation total
Chronic disease >1
Linear (Population total)
Linear (Rural and remote)
Linear (Chronic disease >1)
0
5
10
15
20
25
30
35
2018 2019 2020 2021 2022 2023 2024 2025 2026 2027 2028
25.2
17.3
11.8
7.9
25.6
17.5
12.0
8.1
26.0
17.8
12.2
8.2
26.4
18.1
12.4
8.3
26.8
18.4
12.5
8.4
27.3
18.7
12.8
8.6
27.7
19.0
13.0
8.7
28.1
19.2
13.2
8.9
28.9
19.8
13.5
9.1
29.4
20.1
13.8
9.3
28.5
19.5
13.3
9.0
Year

42 ROYAL FLYING DOCTOR SERVICE OF AUSTRALIA
Chapter 4: Australian workforce availability now and future capacity to meet rural and remote patient needs
> When comparing the areas of low supply of health services to the areas of high supply, there is a significant difference in provision, with the majority (p<0.05) of the low supply areas in rural and remote locations.
> There are significant (p<0.05) differences in healthcare worker provision, which are projected to continue, with the majority of major cities having provision well over the estimated minimum benchmark, as compared to rural and remote areas where levels are well below.
> In 2028 there is projected to be:
— less than a fifth the number of GPs in remote as compared to metropolitan areas (43 as compared to 255 per 100 000 population respectively);
— a twelfth the number of physiotherapists in remote as compared to metropolitan areas (276 as compared to 23 per 100 000 population);
— half the number of pharmacists in remote as compared to metropolitan areas (113 as compared to 52 per 100 000 population); and,
— a third the number of psychologists in remote as compared to metropolitan areas (104 as compared to 34 per 100 000 population).

43FROM 90 TO 100: PL ANNING FOR THE HEALTH NEEDS OF COUNTRY AUSTRALIA IN 2028
4.1 Australian health workforce mapping
To map health workforce supply and demand, health provider to population ratios were used, expressed as the number of health services per 1000 population. This was designed to provide a general indicator on the stock of health services relative to the population, and to ultimately determine current gaps or limitations in provision. This method was used as it is relatively easy to calculate and understand, and can be used to make comparisons over countries and across time.
4.1.1 Methods
Mapping by SA3 (Statistical Area Level 3) represents a standard framework for the analysis of data at the regional level. In aggregate, SA3s cover the whole of Australia without gaps or overlaps, and do not cross state/territory borders. SA3s are often the functional areas of regional towns and cities with a population more than 20 000, or clusters of related suburbs around urban commercial and transport hubs within the major urban areas. The regional breakups have been designed to reflect regional identity. These are areas with both geographic and socio-economic similarities.(18)
Number of services was defined as a count of the number of Medicare services that were performed by a registered provider for items in the MBS for which a claim has been processed. In practice, services included those conducted by service providers within each ASGS area. Of importance, some patients may not have received the service in their ASGS of residence and may have travelled to metropolitan areas or did not get the service at all.
The included geographical maps detail areas of high and low provision, with red areas being low provision as compared to dark blue areas, which have the highest provision relative to the total.
It should be noted that dark blue shading does not necessarily indicate an oversupply of services, rather the highest provision per population compared to other geographical areas. To date there has been limited published literature which details the recommended or optimal numbers of clinicians by type and population ratio. This is a substantial limitation in the literature and warrants significant development in the future to inform investment priorities and enhance service planning processes.
As this analysis is associated with provision per 100 000 it does not consider distances required to travel, or the ability of clinicians to actually see patients (i.e. closed-book practices). Furthermore, analysis of service provision is based primarily on the MBS as the key data source and as such does not fully reflect services provided outside of the MBS. This data and maps should therefore be used as a guide only to indicate broad trends, and further demonstrates the need for services, such as those delivered by the RFDS, outside of the MBS where this method is not viable.
4.1.2 Medical service provision
There are significant service provision differences in geographical areas within Australia. The majority (p<0.05) of the low supply areas are found in rural and remote locations as detailed graphically in Figure 4.1, Tables 4.2 and 4.3.
To enable targeted policy intervention for different services, geographical representations by service type are presented in Figures 4.2 to 4.9. Of concern is that some rural and remote areas of Australia, especially Tasmania, have consistently low rates of service provision for many or all service types analysed.

44 ROYAL FLYING DOCTOR SERVICE OF AUSTRALIA
Figure 4.1. Overall medical service provision, by SA3, in 2016–17
Table 4.1. Top areas of low medical service supply in 2016–17
Region (SA3 name) Services per 1000 people ASGC code
Central Highlands (Tas) 2103.2 Outer regional
Far North 3129.8 Outer regional
Serpentine—Jarrahdale 2243.4 Inner regional
Daly—Tiwi—West Arnhemland 2270.2 Very remote
Lower Murray 2289.7 Outer regional
Pilbara 2539.8 Very remote
Esperance 2687.7 Remote
East Arnhemland 2732.7 Very remote
Barwon—West 2854.5 Inner regional
Manjimup 3291.9 Outer regional
South Perth 3309.3 Major city
Wollondilly 3390.4 Inner regional
Mundaring 3413.2 Major city
Wheat Belt—South 3867.3 Outer regional
Wheat Belt—North 3819.8 Outer regional
Outback—North 3671.1 Very remote
Goldfields 3711.1 Very remote
Meander Valley—West Tamar 3974.4 Outer regional
Kenmore—Brookfield—Moggill 3889.5 Major city
Average 2994.7 3.1
Low provision High provision

45FROM 90 TO 100: PL ANNING FOR THE HEALTH NEEDS OF COUNTRY AUSTRALIA IN 2028
Table 4.2. Top areas of high medical service supply in 2016–17
Region (SA3 name) Services per 1000 people ASGC code
Yarra 48 728.1 Major city
Brisbane Inner 32 523.2 Major city
Adelaide City 32 272.4 Major city
Ryde—Hunters Hill 23 298.8 Major city
Melbourne City 20 395.6 Major city
Holland Park—Yeronga 15 659.7 Major city
Southport 15 493.8 Major city
Sydney Inner City 15 452.3 Major city
Fremantle 15 374.1 Major city
Hobart Inner 14 158.2 Major city
Norwood—Payneham—St Peters 13 808.5 Major city
Perth City 12 906.9 Major city
Richmond—Windsor 12 560.9 Major city
Beenleigh 12 495.3 Major city
Cairns—South 12 398.9 Outer regional
Noosa 12 383.5 Major city
Broadbeach—Burleigh 12 303.3 Major city
Brisbane Inner—North 11 958.2 Major city
Blacktown 11 884.4 Major city
South Canberra 11 864.8 Major city
Average 17 896.05 1.1

46 ROYAL FLYING DOCTOR SERVICE OF AUSTRALIA
Figure 4.2. GP services, by SA3, in 2016–17
* GP services include: attendances, after-hours and emergency attendances, chronic disease services, health assessments and GP-based mental health services.
The provision of GPs throughout Australia has been improving, although there are still significant gaps in remote and very remote areas of Australia. This is especially true of the Esperance region (WA), Pilbara region (WA), Central Highland (Tas), Cape York region (Qld), Dalrymple region (Qld) and Arnhem Land (NT).
Low provision High provision

47FROM 90 TO 100: PL ANNING FOR THE HEALTH NEEDS OF COUNTRY AUSTRALIA IN 2028
Figure 4.3. Nursing services, by SA3, in 2016–17
* This data includes practice nursing and Indigenous healthcare workers.
Nursing appears to be the most evenly distributed service, although there are significant areas of relatively poor provision. The stand-out areas include Tasmania, Esperance region (WA), Dalrymple region (Qld), Far Central West region (Qld) and Southern-Central NSW.
Low provision High provision

48 ROYAL FLYING DOCTOR SERVICE OF AUSTRALIA
Figure 4.4. Allied health (non-mental health) services, by SA3, in 2016–17
* Includes all allied health professionals except for mental health, which is detailed below.
The provision of allied health is poor in all rural and remote areas of Australia. Key areas of concern include Tasmania, Far Central West and Northern Qld, NT and north-west WA.
Low provision High provision

49FROM 90 TO 100: PL ANNING FOR THE HEALTH NEEDS OF COUNTRY AUSTRALIA IN 2028
Figure 4.5. Allied mental health services, by SA3, in 2016–17
* Includes psychologists, social workers and occupational therapists.
The provision of mental health service is very poor in rural and remote areas, with the majority of the provision concentrated in metropolitan areas. This is concerning given the growing rates of mental illness in the bush.(8)
Low provision High provision

50 ROYAL FLYING DOCTOR SERVICE OF AUSTRALIA
Figure 4.6. Optometry services, by SA3, in 2016–17
The provision of optometry services is very poor in rural and remote areas, with the majority of the provision concentrated in metropolitan areas. This is concerning given the growing rates of macrovascular and microvascular conditions in the bush.(8, 33)
Low provision High provision

51FROM 90 TO 100: PL ANNING FOR THE HEALTH NEEDS OF COUNTRY AUSTRALIA IN 2028
Figure 4.7. Dental services, by LGA, in 2016–17*
* This map is reported in Local Government Area (LGA) due to limitations in mapping dental provision by SA3.
The provision of dental services is inadequate in rural and remote areas, with the majority of the provision concentrated in inner regional and metropolitan areas. Rural and remote residents have worse oral health, which in part could be explained by the limited access to dental services, as compared to metropolitan areas.(34, 35)
Low provision High provision

52 ROYAL FLYING DOCTOR SERVICE OF AUSTRALIA
Figure 4.8. Imaging services, by SA3, in 2016–17
* Imaging includes: Diagnostic imaging (bulk-billed); and all other diagnostic imaging: CT, MRI, nuclear, PET, ultrasound and PIP breast imaging.
The provision of imaging services is very poor in rural and remote areas, with the majority of the provision concentrated in metropolitan areas. This is concerning given the growing rates of chronic disease in the bush, which requires diagnostic imaging for management and diagnosis.(36) Areas of key concern include Tasmania, Esperance region (WA), Kambalda and region (WA), Kimberly regions, NT and Northern Qld.
Low provision High provision

53FROM 90 TO 100: PL ANNING FOR THE HEALTH NEEDS OF COUNTRY AUSTRALIA IN 2028
Figure 4.9. Pathology services, by SA3, in 2016–17
* Pathology includes: basic tests, bulk-billed, chemical, cytology, genetics, haematology, immunology, and infertility and pregnancy.
The provision of pathology services is generally adequate, except for Tasmania, Esperance region (WA), and south-western regions of Vic.
Low provision High provision

54 ROYAL FLYING DOCTOR SERVICE OF AUSTRALIA
4.2 Health workforce projections for the year 2028
The health workforce has been growing at a faster rate than the Australian population, due primarily to efforts to increase numbers to respond to increased demand for health services and the ageing population. The provision of health services across Australia’s vast landscape, and particularly to rural and remote populations, is an ongoing issue, related to distribution.(10) The current health workforce is highly reliant on immigration for its clinical staff, especially nurses and doctors, and while the recruitment of international graduates has helped with shortages, there are still significant shortages in rural and remote areas.(37)
This section is designed to provide growth estimates and supply and demand limitations of the health workforce in 2028. The 2011 Australian census data(37) was used as it was the last complete dataset at the time of publication (the 2016 Census of Population and Housing was in the process of being finalised). To help reduce any limitations, AHPRA data was also used to estimate yearly workforce growth rates. These rates were then applied to subsequent years, by total population as compared to health workforce.
The health workforce is projected to increase in line with population growth and improve slightly per 100 000 people. However, it was found that workforce distribution is still projected to be an issue unless further policy interventions are successfully implemented. Specifically, it is projected that the majority of clinicians per 100 000 people will continue to be located in metropolitan areas in the year 2028, as detailed in Table 4.3. The following sections are designed to provide an estimate of provision per clinical area, including medicine, nursing and midwifery, physiotherapy, psychology and pharmacy.
The benchmarks discussed in this report are the estimated minimum number of health professionals required per clinical area, developed based on a review of current literature,(38-42) and represent a standard per 100 000 population to strive towards. Using this method, there are shown to be significant (p<0.05) differences in the distribution of healthcare professionals, with the majority of major cities having provision well over the minimum benchmark, and rural and remote areas of Australia having provision well under, as detailed in Table 4.3. This indicates that there remain significant issues associated with the distribution of healthcare professionals between metropolitan and rural and remote areas, and without intervention, this is not expected to change over the next decade.

55FROM 90 TO 100: PL ANNING FOR THE HEALTH NEEDS OF COUNTRY AUSTRALIA IN 2028
Tab
le 4
.3. S
um
mar
y o
f h
eal
thc
are
are
a p
er
100
00
0 o
f p
op
ula
tio
n b
y A
SG
C l
oc
atio
n
Hea
lth
care
are
aA
SG
C c
od
eB
ench
mar
k*20
11–1
220
15–1
620
20-2
120
27–2
8**
Ave
rag
eB
ench
mar
k p
erce
nta
ge
Gen
eral
Pra
ctit
ion
erM
ajor
city
11
022
823
924
825
524
422
1.9
Reg
iona
l are
a (in
clud
ing
inne
r an
d o
uter
)11
312
413
314
013
011
8.2
Rem
ote
(incl
udin
g ve
ry r
emot
e)16
2736
4332
29.1
Sp
ecia
lists
M
ajor
city
100
208
214
238
243
226
226.
0
Reg
iona
l are
a (in
clud
ing
inne
r an
d o
uter
)13
914
415
015
914
814
8.0
Rem
ote
(incl
udin
g ve
ry r
emot
e)
2834
4152
3939
.0
Nu
rsin
g a
nd
mid
wif
ery
Maj
or c
ity12
5011
1611
8212
7113
6112
3398
.6
Reg
iona
l are
a (in
clud
ing
inne
r an
d o
uter
)10
7011
0411
6212
8411
5592
.4
Rem
ote
(incl
udin
g ve
ry r
emot
e)12
1711
9412
5412
5912
3198
.5
Ph
ysio
ther
apis
tM
ajor
city
5021
524
326
027
624
949
8.0
Reg
iona
l are
a (in
clud
ing
inne
r an
d o
uter
)10
712
113
013
812
424
8.0
Rem
ote
(incl
udin
g ve
ry r
emot
e)18
2022
2321
42.0
Psy
cho
log
y M
ajor
city
4579
9499
104
9420
8.9
Reg
iona
l are
a (in
clud
ing
inne
r an
d o
uter
)44
4959
6855
122.
2
Rem
ote
(incl
udin
g ve
ry r
emot
e)29
3032
3431
71.1
Ph
arm
acis
tM
ajor
city
7510
210
410
811
310
714
2.7
Reg
iona
l are
a (in
clud
ing
inne
r an
d o
uter
)77
7779
8078
104.
0
Rem
ote
(incl
udin
g ve
ry r
emot
e)51
5152
5252
69.3
* A
ben
chm
ark
is t
he m
inim
al r
equi
rem
ent
estim
ated
per
clin
ical
are
a. T
he e
stim
ates
wer
e ga
ined
: A
ustr
alia
n M
edic
al W
orkf
orce
Ad
viso
ry C
omm
ittee
,(38) A
ustr
alia
n in
stitu
te o
f Hea
lth a
nd W
elfa
re,(3
9) R
ural
Hea
lth W
est,
(40) M
aier
CB
, B
arne
s H
, A
iken
LH
, B
usse
R.,
(41) T
enna
nt M
, K
ruge
r E
.(42)
** B
ased
on
hist
oric
al p
roje
ctio
ns w
ithou
t co
nsid
erat
ions
for
futu
re t
arge
ted
pol
icy
inte
rven
tions
.

56 ROYAL FLYING DOCTOR SERVICE OF AUSTRALIA
The AIHW has recently released similar workforce estimates to those illustrated in Table 4.3. The methods used by the Australia’s Health 2018 report(8) differ from the methods used in this report. The AIHW report also differs from the recently published Department of Health estimates,(43) with the differences appearing to be related to the data sources used. The current RFDS report included part-time and full-time employees and excluded those clinicians in training or on probation. This was then compared to MBS and PBS data-mapping, to determine the actual place of service provision by clinical type. Although these reports differ in total numbers, each report has similar findings, including that provision decreases with remoteness, and that allied health provision is particularly poor in rural and remote areas. A coordinated approach may be beneficial for future publications.
The shortage of GPs and specialists in rural and remote areas is a problem that poses serious challenges to equitable healthcare delivery.(9) In 2011–12, the per capita ratio of GPs to population in major cities (227.8 per 100 000) was twice that of regional areas (113.0 per 100 000), and considerably higher than the ratio of GPs in remote areas (16.0 per 100 000). These findings are consistent with 2017–18 data, which indicated that there were 243 GPs per 100 000 population in major cities, 28 per 100 000 in regional areas, and 31 per 100 000 in remote areas.(44) It is projected that these figures will increase in 2027–28 to 255 per 100 000, 140 per 100 000, and 43 per 100 000 in major cities, regional areas and remote areas, respectively. By comparison, the number of employed medical specialists per 100 000 population in inner regional, outer regional and remote/very remote areas in 2015 were 82.7, 61.5 and 34.2 respectively.(39) The majority of Australia’s specialists work in major cities, and as such access in rural and remote areas need to be promoted via extended outreach, which can be facilitated by organisations such as the RFDS. These findings and projections indicate a significant gap in service provision in rural and remote areas as compared to major cities, with rural and remote areas being significantly below workforce service benchmark recommendations.
Registered nurses are the largest and geographically most evenly distributed of all health disciplines in Australia. While numbers of other health professionals decrease with increased remoteness, registered nurse numbers are stable based on per population ratios.(11) In 2011–12, the per capita ratio in major cities was 1116 per 100 000, and in regional and remote areas, 1070 per 100 000, and 1217 per 100 000, respectively. These findings are consistent with 2017–18 data that indicated that there were 1205 per 100 000 nursing and midwifery professionals in major cities, 1128 per 100 000 in regional areas, and 1217 per 100 000 in remote areas.(45) It is projected that these figures will increase in 2027–28 to 1361 per 100 000, 1284 per 100 000, and 1259 per 100 000 in major cities, regional areas and remote areas, respectively. These findings and projections indicate that service provision in rural and remote areas is only slightly less than major cities.
The allied health workforce is also not evenly distributed, with the majority working in major cities. Take for example, physiotherapists. While physiotherapist numbers have been increasing, factors that include population growth and an ageing population have similarly seen an increase in demand for physiotherapy services and growth has been mainly focused in the major cities. In 2011–12, there were 215 physiotherapists per 100 000 population in major cities, as compared to 107 per 100 000 and 18 per 100 000 in regional and remote areas, respectively. This increased in 2017–18 to 253 physiotherapists per 100 000 population in major cities, as compared to 126 and 21 in regional and remote areas.(46) Furthermore, based on historical growth estimates, it is predicted that this trend will continue in 2027–28, with 276, 138 and 23 physiotherapists per 100 000 in major cities, regional areas and remote areas, respectively.
Compared with those who live in the major cities, people in Australia’s rural and remote areas have reduced access to medicines (prescribed and non-prescribed), less advice about the use of medicines and poorer access to professional pharmacy services. As with so many other issues in the rural and remote health sector, there is a gradient of deficit as one moves from major cities through regional areas to remote and very remote places.(12) In 2011–12 there were 102 pharmacists per 100 000 people in major cities, as compared to 77 and 51 pharmacists per 100 000 in regional and remote areas, respectively. This figure increased in major cities and regional areas in 2017–18 to 106 and 78, although it did not increase in remote areas.
57FROM 90 TO 100: PL ANNING FOR THE HEALTH NEEDS OF COUNTRY AUSTRALIA IN 2028
It is predicted that in 2027–28 there will be 113 pharmacists per 100 000 people in major cities as compared to 80 and 52 pharmacists per 100 000 people in regional and remote areas.(47) This indicates that the majority of the growth and provision will be geared towards major cities. This is concerning, as the standard of healthcare for rural and remote areas should be equal to the standard available in metropolitan areas. Community pharmacy is an essential part of a healthcare team dedicated to providing valuable primary healthcare services across Australia.
Mental health disorders make up a large percentage of the Australian burden of disease, and rural and remote populations face diverse mental health issues but often have limited access to services. In 2011–12 there were 79 psychologists per 100 000 people in major cities, compared to 44 and 29 in regional and remote areas. This figure increased in 2017–18 to 96 psychologists per 100 000 in major cities, as compared to 54 and 31 in regional and remote areas.(49) It is predicted that these figures will continue to grow in 2027–28 to 104, 68 and 34 per 100 000 people in major cities, regional areas and remote areas, respectively. This data indicates that there will be a significant shortage of psychologists in rural and remote areas. This is concerning as the rates of suicide are significantly higher in rural and remote areas compared to metropolitan areas.(2)
With new investment from the Commonwealth Government, the RFDS will be increasing its mental health provision to include increases in psychologist and social worker outreach clinics, and telehealth capacity from January 2019.
4.2.1 Projecting demand for RFDS services in 2028
While there are areas of low service provision in rural and remote areas, trends to date indicate that for aeromedical retrievals and primary healthcare services as currently delivered by the RFDS, overall activity is not expected to increase drastically, as detailed in Figures 4.10 and 4.11 and Tables 4.4 and 4.5

58 ROYAL FLYING DOCTOR SERVICE OF AUSTRALIA
Figure 4.10. RFDS aeromedical retrieval biyearly growth predictions per leading diagnosis
Diseases of the circulatory system
Diseases of the digestive system
Injury and poisoning Diseases of the respiratory system
Pregnancy, childbirth and puerperium
Total trend
0
4000
2000
6000
8000
10000
12000
14000
16000
2024–262022–242020–222018–202016–18 2026–28
Aeromedical
Num
ber
Figure 4.11. RFDS primary healthcare biyearly growth predictions per leading diagnosis
Diseases of musculoskeletal system and connective tissue
Diseases of the circulatory system
Diseases of the skin and subcutaneous tissue
Factors influencing health status and contact with health services
Endocrine, nutritional and metabolic diseases
Total trend
0
2000
1000
3000
4000
5000
6000
2024–262022–242020–222018–202016–18 2026–28
Primary healthcare
Num
ber

59FROM 90 TO 100: PL ANNING FOR THE HEALTH NEEDS OF COUNTRY AUSTRALIA IN 2028
Table 4.4. RFDS aeromedical retrieval biyearly growth predictions per leading diagnosis
Diagnosis (top five) 2016–18 2018–20 2020–22 2022–24 2024–26 2026–28
Injury and poisoning 13 705 13 760 13 815 13 870 13 926 13 981
Diseases of the circulatory system 11 371 11 416 11 462 11 508 11 554 11 600
Diseases of the digestive system 4730 4749 4768 4787 4806 4825
Diseases of the respiratory system 3487 3501 3515 3529 3543 3557
Pregnancy, childbirth and the puerperium 2774 2785 2796 2807 2819 2830
Combined diagnosis total 62 834 63 085 63 338 63 591 63 845 64 101
* Does not include increased DALY.** Only includes raw patient numbers based on population growth estimates.*** Does not consider current and planned policy interventions, just population/diagnosis estimates.
Table 4.5. RFDS primary healthcare biyearly growth predictions per leading diagnosis
Diagnosis (top five) 2016–18 2018–20 2020–22 2022–24 2024–26 2026–28
Diseases of the skin and subcutaneous tissue 5132 5153 5173 5194 5215 5235
Diseases of the musculoskeletal system and connective tissue
4663 4682 4700 4719 4738 4757
Diseases of the circulatory system 4506 4524 4542 4560 4579 4597
Factors influencing health status and contact with health services
3860 3875 3891 3907 3922 3938
Endocrine, nutritional and metabolic diseases 3037 3049 3061 3074 3086 3098
Combined diagnosis total 37 563 37 713 37 864 38 016 38 168 38 320
* Does not include increased DALY.** Only includes raw patient numbers based on population growth estimates.*** Does not consider current and planned policy interventions, just population/diagnosis estimates.
As shown in this report however, there are a number of locations that are significantly underserved by current services (including MBS services) which may warrant consideration as areas of priority for RFDS services. This is further discussed in Chapter 5. Further, projected increases in the rates of chronic illness and aged-related conditions indicates that the RFDS and other healthcare providers will need to adapt to respond.
It is predicted that with the decentralisation of health networks and the closure of regional hospitals,(50) and the ageing population,(51) the demand for RFDS IHTs will grow significantly throughout the next ten years. This has been illustrated by RFDS Victoria and Central Operations increasing transfers by road from 12 000 in 2012 to 70 342 in 2018, as illustrated in Figure 4.12. This trend is predicted to continue to increase.
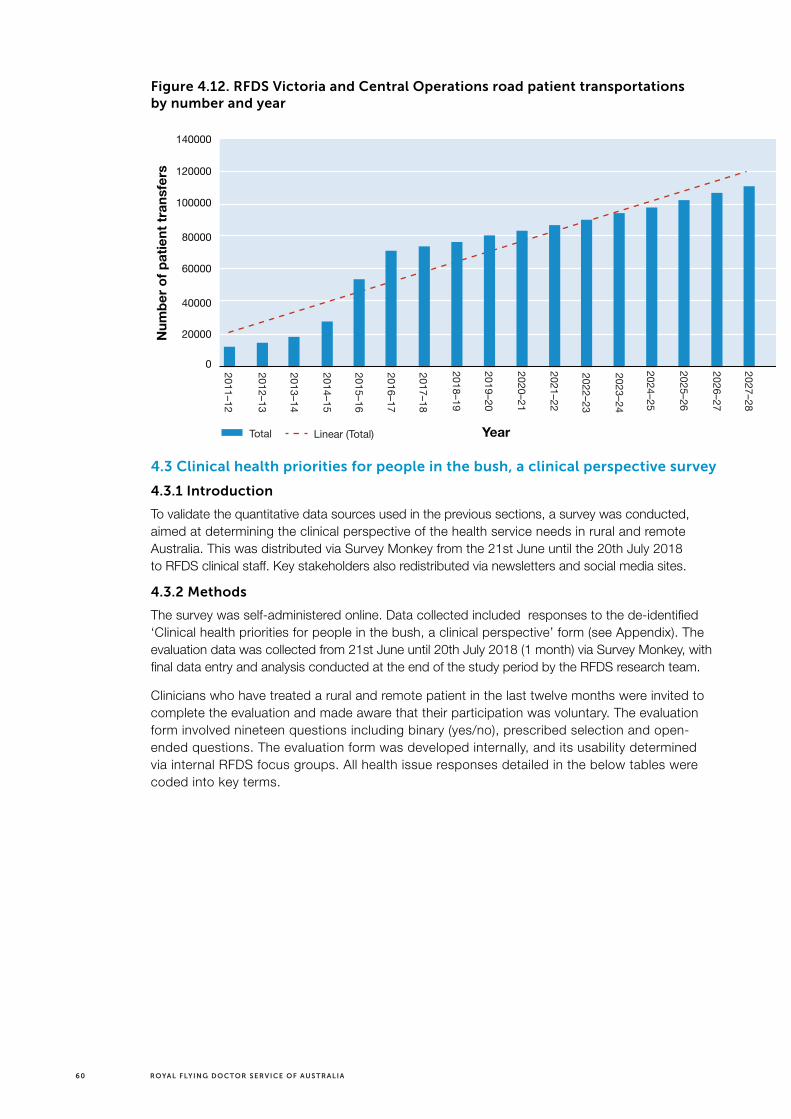
60 ROYAL FLYING DOCTOR SERVICE OF AUSTRALIA
Figure 4.12. RFDS Victoria and Central Operations road patient transportations by number and year
4.3 Clinical health priorities for people in the bush, a clinical perspective survey
4.3.1 Introduction
To validate the quantitative data sources used in the previous sections, a survey was conducted, aimed at determining the clinical perspective of the health service needs in rural and remote Australia. This was distributed via Survey Monkey from the 21st June until the 20th July 2018 to RFDS clinical staff. Key stakeholders also redistributed via newsletters and social media sites.
4.3.2 Methods
The survey was self-administered online. Data collected included responses to the de-identified ‘Clinical health priorities for people in the bush, a clinical perspective’ form (see Appendix). The evaluation data was collected from 21st June until 20th July 2018 (1 month) via Survey Monkey, with final data entry and analysis conducted at the end of the study period by the RFDS research team.
Clinicians who have treated a rural and remote patient in the last twelve months were invited to complete the evaluation and made aware that their participation was voluntary. The evaluation form involved nineteen questions including binary (yes/no), prescribed selection and open-ended questions. The evaluation form was developed internally, and its usability determined via internal RFDS focus groups. All health issue responses detailed in the below tables were coded into key terms.
Total Linear (Total)
0
40000
20000
60000
80000
100000
120000
140000
2025–26
2024–25
2023–24
2022–23
2021–22
2020–21
2019–20
2018–19
2017–18
2016–17
2015–16
2014–15
2013–14
2012–13
2011–12
2027–28
2026–27
Num
ber
of
pat
ient
tra
nsfe
rs
Year

61FROM 90 TO 100: PL ANNING FOR THE HEALTH NEEDS OF COUNTRY AUSTRALIA IN 2028
4.3.3 Results
Participation in this survey was good (n=52), with a 100% completion rate by those who met the inclusion criteria. The majority of responders were female (72.55%), and of non-Indigenous status (100%). The clinical experience of the participants included those with more than 16 years (63.5%), 11 to 16 years (19.2%), 6 to 10 years (11.5%) and 1 to 5 years (5.8%). The majority of the participants (67%) were from a nursing and/or midwifery (42%) and a medical (25%) background, with the remainder detailed in Figure 4.13.
Figure 4.14. Survey participants clinical role
0 2 16141210864
Percentage of participants
Clin
ical
ro
le
Residentmedical officer
Obstetrician andgynecologist
Dietitian
Occupational therapist
Eye health clinician
Psychiatrist
Gastroenterologist
Social workerIndigenous
health workerEmergency Doctors (registrar/consultant)
Midwife
Paramedic
Nurse
Psychologist
Remote area nurse
General practitioner
Nurse and midwife
Responders indicated that the provision of healthcare within their communities was neither good nor poor (27%), good (35%) or very good (19%), with the remainder indicating poor (13.5%), and very poor (6%) provision. Results indicate that the provision of primary healthcare overall was perceived as adequate, with the majority indicating good (40%) and very good provision (18%), with the remainder indicating neither good nor poor (30%), poor (8%) or very poor (4%) provision.
Pathology access overall was perceived as having good (44%) and very good (22%) service provision. Pharmaceutical access was also perceived favourably, with the majority indicating good (37%) and very good provision (35%). Diagnostic imaging provision was perceived as: very poor (13%), poor (24%), neither good nor poor (28%), good (22%), and very good (13%).
Dental service provision was perceived as inadequate, with the majority indicating poor (34%) and very poor service provision (20%), and the remainder indicating neither good or bad (16%), good (24%) or very good provision (6%). This was also reflected in perceptions of mental health service provision, with the majority indicating poor (38.5%) and very poor (23%) provision.

62 ROYAL FLYING DOCTOR SERVICE OF AUSTRALIA
Participants indicated that the most important health issues for people living in their communities included: chronic disease (n=28), equitable access to healthcare (n=21), poor mental health provision and access (n=19), and travelling distance required to access healthcare (n=16). Further responses are detailed in Table 4.6.
Table 4.6. Participant responses – the most important health issues for people in their rural and/or remote community
Response category Number of associated responses
Chronic disease 28
Equitable access to healthcare generally 21
Mental health provision and access 19
Travelling distance to healthcare 16
Specialist provision and access 13
Access to essential services, such as housing, fresh food and water 5
Maternity and neonatal care provision and access 4
Dental provision and access 4
General practitioner access and provision 3
Substance abuse 3
Employment and wages 2
Discrimination 2
Allied health provision and access 2
Domestic violence 2
Health literacy 2
Pharmaceutical provision and access 1
Diagnostic imaging access and provision 1
Access to palliative care 1
Disempowerment 1
Participants indicated that money should be invested into health literacy education (n=23), improved mental health service provision (n=23), and improving access to primary healthcare (n=21). Further responses are detailed in Table 4.7.

63FROM 90 TO 100: PL ANNING FOR THE HEALTH NEEDS OF COUNTRY AUSTRALIA IN 2028
Table 4.7. Participant responses – areas where money should be spent to improve rural and remote Australian health
Response category Number of associated responses
Health literacy education 23
Improved mental health service provision 23
Improved access to primary healthcare 21
Improving health infrastructure 8
Reducing transport barriers 5
Improved maternity and neonatal care 5
Telehealth provision 5
Improved specialist services 5
Improved access to fresh food and water 4
Increasing rural and remote workforce numbers 4
Improved housing 3
Improving employment and wages 3
Health epidemiology research 2
Improving Allied Health provision 1
Improved dental provision and access 1
Improved social worker provision 1
Participants indicated that the most important health issues that people will face in the next ten years included the growth in mental illness and poor mental health service provision (n=22), substance abuse and addiction (n=15) and ageing and reduced life expectancy (n=14). Further responses are detailed in Table 4.8.

64 ROYAL FLYING DOCTOR SERVICE OF AUSTRALIA
Table 4.8. Participant responses – the most important health issues that people in rural and remote areas will face in the next ten years
Response category Number of associated responses
Growth in mental illness and poor mental health service provision
22
Substance abuse and addiction 15
Ageing and reduced life expectancy 14
High obesity and reduced health literacy 12
Diabetes 9
High travelling times to access healthcare 9
Cardiovascular disease 6
Growth in chronic disease 5
High living costs 4
Cancer treatment 3
Poor rural and remote workforce provision 3
Childs health 3
Neurological conditions associated with chronic disease and ageing
3
Healthcare funding 3
Renal disease 2
Domestic violence 2
Reduced employment 2
Adequate housing 2
Growth in infectious disease 1
Participants indicated that the perceived best policy drivers to help distribute clinical workers to rural and remote areas of Australia included compulsory or additional placements in rural and remote areas (n=13), retention incentives (n=12) and increased remuneration (n=11). Further responses are detailed in Table 4.9.

65FROM 90 TO 100: PL ANNING FOR THE HEALTH NEEDS OF COUNTRY AUSTRALIA IN 2028
Table 4.9. Participant responses – the best policy drivers to help distribute clinical workers to rural and remote areas of Australia
Response category Number of associated responses
Compulsory or additional placements/education in rural and remote areas
13
Retention incentives 12
Increased remuneration 11
Increase telehealth 6
Paid leave for education 4
Funding of travelling health clinics 4
Financial support for rural and remote clinicians to attend training 4
Out of scope training 4
Medicare incentives 3
Recruitment of rural and remote students 3
Population health screening incentives 3
Improved housing and accommodation 2
Increased paid leave for personal relief 2
Flexible working hours 2
Rural and remote tertiary training centres 1
4.4 Discussion and conclusion
Almost a third of the Australian population lives outside of metropolitan areas. Despite this figure, rural and remote areas are significantly underserved by healthcare compared to metropolitan areas. This indicates that the availability of healthcare tends to vary inversely with the need of the population served.(52, 53) This survey indicated that primary healthcare was perceived as adequate. This indicates that progress has been made since renewed interest and policy intervention in rural and remote health since the early 1990s.(13) Although primary healthcare was perceived as adequate, there were specific areas that were deemed as having limited or poor provision. This included dental and mental health services.
The findings of this survey are consistent with prior literature(54) indicating that dental provision is inadequate with the majority of responders indicating poor and very poor service provision. Dental healthcare in rural communities shares many of the dilemmas faced by other health services in providing services to large geographical areas with dispersed populations. As discussed, the RFDS helps improve this service provision by providing mobile dental clinics to rural and remote areas.
This survey demonstrated that mental health service provision in the bush is perceived as being very poor, with many identifying the need to reduce suicide rates in rural and remote areas. This is consistent with a recent AIHW report,(7) which indicated that suicide and self-inflicted injuries and anxiety disorders were a leading cause of burden of disease. Furthermore, this is consistent with recent research indicating that rural and remote communities have complex and diverse mental health needs and inadequate mental health services and infrastructure.(55) As a result of recent budget decisions by the Commonwealth Government, the RFDS is in the process of expanding mental health services in rural and remote Australia.

66 ROYAL FLYING DOCTOR SERVICE OF AUSTRALIA
Participants indicated that money should be invested into health literacy education, in addition to mental health service provision, and improving health infrastructure. This is important as it pertains to chronic disease generally, although also relates specifically to mental health. As reported by McLennan,(56) 38% of adult Australians with a mental disorder received help, while Bayer and Peay(57) reported of those with a ‘serious’ mental disorder, such as an organic brain disorder, psychosis, psychoneurosis or depressive state, only 20–50% receive treatment. As most of the mental health services are located in metropolitan areas, rural and remote patient access to appropriate mental health care is more difficult. Attendance is also reduced in rural and remote patients due to the stigma of seeking treatment.(58, 59)
Telehealth potentially provides an innovative and cost-effective means for connecting rural and remote communities to specialist mental health practitioners, services and supports, irrespective of physical location. The RFDS currently provides extensive telehealth services, including remote (telephone) consultations, in areas where there are no or limited medical services, and specialist clinics via videoconference in some locations.
Diagnostic imaging availability was perceived by many survey responders as being poor. This is again likely, in part, due to the rural and remote population being spread across such a large landmass, resulting in a deprivation of even basic general radiography services. Some argue that people who are isolated from such mainstream diagnostic services should be prepared to travel to access them. As detailed by Smith.(60) that ‘argument, however, is fragile under some circumstances and fails to take into account the costs (in terms of both money and time) and the disadvantage of having to travel long distances to have, for example, a wrist X-ray that then turns out to be normal’. Videoconferencing in combination with tele-radiography could be used as a means of providing education and supervision to limited license X-ray operators, as well as in assessing the quality of the images they produced and providing them with constructive feedback.(61) This would also provide increased employment opportunities for rural and remote populations.
Participants indicated that the best perceived policy drivers to help distribute clinical workers to rural and remote areas of Australia include compulsory or additional placements in rural and remote areas, retention incentives and increased remuneration. Workforce supply within a health service is a function of both recruitment and retention. Results from this survey indicate that there is still a perception that, consistent with the analysis presented in this report, rural and remote health workforce numbers are inadequate, and that current incentives do not appear to be attracting or retaining clinicians to the bush.
This clinical survey is consistent with the RFDS patient-based survey titled ‘Health care access, mental health, and preventive health: Health priority survey findings for people in the bush’,(65) which indicated access to general health services was identified as the most important health consideration of country people, with almost one third of responses (32.5%) identifying general health access as a key priority. This comprised general access to medical services (13.1%), access to specialists (10.6%), access to GPs (4.6%), access to hospitals (2.3%), access to diagnostic tests (1.4%) and access to allied health services (0.5%). Addressing mental health (12.2%) and drug and alcohol problems (4.1%) were the second and third priorities, respectively. The results of these clinical and patient perspective surveys confirm that there are still perceptions of significant healthcare provision shortfalls in the bush.

67FROM 90 TO 100: PL ANNING FOR THE HEALTH NEEDS OF COUNTRY AUSTRALIA IN 2028
Chapter 5: Conclusion and Recommendations
5.1 Findings and Future Service Planning for the RFDS
As shown in this report, the Australian population is estimated to be 29.4 million by the year 2028, with the population of remote areas predicted to grow steadily, albeit at a much lower rate, of 0.2% per year over the next decade. The proportion of the population aged over 65 is projected to increase significantly and the number of Australians living with at least one chronic disease is estimated to increase from 11.8 million in 2018 to 13.8 million by 2028. Cancer, disorders of mental health and CVD are predicted to be the most prevalent. Of importance, it is expected that without intervention, the health of those in rural and remote areas will remain worse than those in metropolitan areas, and country Australians will be impacted most by growing rates of chronic disease. Of interest, there is currently an unprecedented increase in the prevalence and impact of age-related neurological conditions, such as dementia and Alzheimer’s, which is likely to continue over the next decade with an ageing population, and our health system must adapt to respond.
Data presented in this report indicate that in the next decade there will be significant shortages of essential health services in rural and remote Australia, well below the estimated minimum benchmark. For example, in 2028 there is projected to be:
> less than a fifth the number of GPs in remote as compared to metropolitan areas (43 in remote areas and 140 in regional areas, as compared to 255 in metropolitan areas per 100 000 population);
> a twelfth the number of physiotherapists (23 in remote areas and 138 in regional areas, as compared to 276 in metropolitan areas per 100 000 population);
> half the number of pharmacists (52 in remote areas and 80 in regional areas, as compared to 113 in metropolitan areas per 100 000 population);
> a third the number of psychologists (34 in remote areas and 68 in regional areas, as compared to 104 in metropolitan areas per 100 000 population).
Of key concern, it is clearly shown that populations in rural and remote areas have higher rates, and will continue to have increased chronic disease prevalence, and increased morbidity and mortality over the next decade. There is therefore a pertinent need to address these workforce disparities as a matter of priority.
An enormous body of literature has been built up over many years on the recruitment and retention of doctors and other health professionals in rural and remote areas.(62) There are many policy levers that can affect workforce recruitment and retention. Specifically, there are work-related, personal and lifestyle-related factors influencing initial job location and ongoing retention. These factors influence health workers differently depending on the context, including the political, socio-economic and cultural environment.(63) The worker often makes decisions to stay or leave a geographic area based on multifactorial variables, with any dissatisfaction leading to seeking employment elsewhere.(64) There are specific policy interventions that can be considered, such as changes in scopes of practice for rural and remote clinical staff, while focusing on workforce retention. The RFDS intends to make further comment on recruitment and retention strategies for the rural and remote health workforce in a future publication.

68 ROYAL FLYING DOCTOR SERVICE OF AUSTRALIA
For regions of low healthcare service supply, the provision of the following services may require increasing:
> GP services: Increased telehealth provision, and additional GP clinics, to treat those unable to attend traditional GP clinics.
> Specialists: The RFDS may look at extending its specialist outreach programs via scheduling specialist clinics in rural and remote Australia where access is poor.
> Nursing and midwifery: Increased provision of nurse consultant opportunities.
> Allied health: The allied health shortage in rural and remote areas is of concern. The RFDS may seek to increase provision through multidisciplinary primary health clinics.
> Psychology and social work: Increased telehealth provision and increased mental health clinics.
> Pharmacy: Increased provision through multidisciplinary primary health clinics and telehealth.
> Imaging: Diagnostic imaging provision has been identified as very poor in rural and remote areas. The RFDS may consider partnering with providers to increase provision of essential imaging in rural and remote Australia, aimed at reducing the travel times patients are experiencing. Furthermore, videoconferencing in combination with tele-radiography may be a potential option.
> Pathology: Pathology collection and processing could be improved in rural and remote areas by the continued expansion of point-of-care (POC) testing. Blood glucose is regularly conducted via AMS POC testing, although the funding and development of other devices would be beneficial, such as wide funding of HbA1c POC testing.
Increasing the provision of these services could include working to raise the benchmarks in remote areas to the following:
> GPs: from 27 to 110 per 100 000;
> Specialists: from 34 to 100 per 100 000;
> Nurses and midwives: from 1194 to 1250 per 100 000;
> Physiotherapists: from 20 to 50 per 100 000;
> Psychologists: from 30 to 45 per 100 000;
> Pharmacists: from 51 to 75 per 100 000.
Further, the RFDS may consider addressing the underserved needs of specific geographic areas as follows (SA3 regions):
> Central Highlands (Tas);
> Far North (Northern Qld);
> East and West Arnhemland (NT);
> Lower Murray (NSW);
> Pilbara (WA); and
> Esperance (WA).

69FROM 90 TO 100: PL ANNING FOR THE HEALTH NEEDS OF COUNTRY AUSTRALIA IN 2028
Of note, there is currently a good distribution of nurses and midwives across geographical areas and this is predicted to continue over the next decade (1259 in remote areas and 1284 in regional areas, as compared to 1361 in metropolitan areas per 100 000 population). The nursing and midwifery workforce already in place in rural and remote areas provides a platform to continue to build upon. Ensuring ongoing support, opportunities for professional development, and appropriate or enhanced scopes of practice will be necessary to best harness this opportunity.
Findings of this report indicate that population and health outcome projections for rural and remote Australia will require the RFDS to continue current services, while also preparing for an ageing population and more prevalent chronic diseases. Evidence presented shows that while there are areas of low service provision in rural and remote areas, RFDS emergency aeromedical retrievals will continue to be required but are not expected to increase significantly over the next decade. However, it is predicted that with the decentralisation of health networks, the closure of regional hospitals and the ageing population, the demand for RFDS IHTs will grow significantly throughout the next ten years.(66)
In regards to RFDS primary healthcare (mainly GP and nursing clinics), there is not predicted to be a significant increase in overall activity over the next decade. However, these services will need to evolve, to respond to more complex and age-related illnesses. Furthermore, while allied health services are not a traditional focus of the RFDS, there is a measurable need to increase the provision of these services in rural and remote areas, including physiotherapy, mental health services, pharmacy and diagnostic imaging, and demand for such services is likely to continue growing. There is an opportunity for the RFDS to respond by increasing the multidisciplinary nature of the RFDS primary healthcare offering over the next decade, through a carefully considered allied health strategy.
As detailed in this report, the RFDS already provides an extensive primary healthcare service and aeromedical retrieval service. These outreach services improve access to health services for widely dispersed and isolated populations and often co-exist with other integrated and comprehensive services. The need for these established services is not expected to change over the next decade, rather they will need to adapt to respond to the more complex health needs of an ageing population, consequently needing to increase in frequency in some locations and potentially broadened in the services delivered.
It is well established that in many rural and remote communities, there is insufficient demand (due to small population numbers) for permanently located health services such as primary healthcare clinics or specialist services, and this situation is not expected to change over the next decade. When services cannot be easily be accessed in these areas, patients may forgo a service and the associated health intervention or assessment: this can have a negative impact on the health and longevity of rural and remote Australians. Options such as reliable and coordinated telehealth services should be further considered over the next decade to overcome these challenges and further build an innovative and efficient model of service delivery, specifically to areas of under-provision. For example the RFDS may consider options to expand its current telehealth consultation services (supported by the tele-pharmacy (medical chest) program) to incorporate other services.
70 ROYAL FLYING DOCTOR SERVICE OF AUSTRALIA
Chapter 6: Future research and service planning
The objective of this report was to determine population growth and predicted health outcomes including chronic disease growth until 2028, and to determine whether rural and remote service provision would be significantly lower than metropolitan areas. This report has confirmed that there are significantly lower health service provision in rural and remote areas of Australia, per 100 000 population and, without intervention, this is expected to continue. Based on continued population and chronic disease growth estimates, it is predicted that unless these gaps are drastically reduced, the populations living in these areas will have increased morbidity and mortality compared to metropolitan areas.
Metropolitan methods of healthcare provision in rural and remote areas are not realistic,(67) and this reflects the ongoing need for innovative, flexible and mobile services like the RFDS. Future changes should be based on and developed in a multifactorial and multidisciplinary manner, incorporating the best available evidence from patient-centred research with the needs and preferences of individuals, communities, health professionals, policymakers, funding agencies and professional organisations prioritised, and underpinned by sound theoretical and conceptual principles. Regardless of the method chosen, any change should consider that the delivery of healthcare in rural and remote communities occurs in complex and dynamic settings which are uniquely responsive to social, political, economic and clinical factors.(52, 53, 67)
To date there has been limited published literature which details the recommended or optimal numbers of clinicians that should be available in a given area by type and population ratio. This is a substantial limitation in the literature and warrants significant development in the future to inform investment priorities and enhance service planning processes.
The primary limitation of this report was that the data only included those patients that received a medical service. It is suspected that some rural and remote patients required to travel more than 60 minutes may not have done so for lower acuity complaints. This is validated in part by recent research,(65) which indicated that some patients (31.3%) would be required to travel 1 to 5 hours for non-emergency treatment. Future research should also further consider the impact of non-traditional methods for delivering medical services in rural and remote areas of Australia, including telehealth and primary health clinics, as well as medical services such as pre/post-natal care and aged care provision.

71FROM 90 TO 100: PL ANNING FOR THE HEALTH NEEDS OF COUNTRY AUSTRALIA IN 2028
References1. Aspex Consulting. Royal Flying Doctor Service traditional services–systems development: paper
on classification, counting and measurement. East Melbourne: Aspex Consulting, 2014.
2. Gardiner FW, Bishop L, Gale L, Ransom A, Laverty M. The Royal Flying Doctor Service: Responding to injuries in remote and rural Australia. Injury. 2018;In review.
3. Australian Bureau of Statistics. Census of population and housing: Reflecting Australia—stories from the Census, 2016. Cat no. 2071.0. Canberra: ABS, 2017 [Available from: http://www.abs.gov.au/ausstats/[email protected]/Lookup/by%20Subject/2071.0~2016~Main%20Features~Snapshot%20of%20Australia,%202016~2].
4. Bishop L, Gale L, Laverty M. Responding to injuries in remote and rural Australia. Canberra: Royal Flying Doctor Service, 2016.
5. Garvan Research Foundation. Medical research and rural health Garvan report 2015. Darlinghurst: Garvan Research Foundation, 2015.
6. Australian Institute of Health and Welfare. Australia’s health 2016. Canberra: AIHW, 2016.
7. Australian Institute of Health and Welfare. Australia’s health 2018: In brief. Cat. no. AUS 222. Canberra: AIHW, 2018.
8. Australian Institute of Health and Welfare. Australia’s health 2018. Australia’s health series no. 16. AUS 221. Canberra: AIHW, 2018.
9. Kwan MMS, Kondalsamy-Chennakesavan S, Ranmuthugala G, Toombs MR, Nicholson GC. The rural pipeline to longer-term rural practice: general practitioners and specialists. PLos One. 2017;12(7):e0180394.
10. Australian Government Department of Health. National strategic framework for rural and remote health. Canberra: Australian Government Department of Health, 2016 [Available from: http://www.health.gov.au/internet/main/publishing.nsf/content/national-strategic-framework-rural-remote-health].
11. Lenthall S, Wakerman J, Opie T, Dunn S, Macleod M, Dollard M, et al. Nursing workforce in very remote Australia, characteristics and key issues. Aust J Rural Health. 2011;19(1):32–7.
12. National Rural Health Alliance. Access to medicines and pharmacy services in rural and remote Australia. Discussion Paper. Canberra: National Rural Health Conference Australian Journal of Rural Health, 2014.
13. Wakerman J, Humphreys J, Wells R, Kuipers P, Entwistle P, Jones J. A systematic review of primary health care delivery models in rural and remote Australia 1993–2006. Canberra: Australian National University, 2006.
14. Australian Bureau of Statistics. Population projections, Australia, 2012 (base) to 2101. Cat. no. 3222.0. Canberra: ABS, 2013 [Available from: http://www.abs.gov.au/ausstats/[email protected]/Latestproducts/3222.0Main%20Features32012%20(base)%20to%202101?opendocument&tabname=Summary&prodno=3222.0&issue=2012%20(base)%20to%202101&num=&view=].
15. Australian Government Department of Health. MBS online. Canberra: Australian Government Department of Health, 2018 [Available from: http://www.mbsonline.gov.au/internet/mbsonline/publishing.nsf/Content/Home].
16. Australian Government Department of Health. About the PBS. Canberra: Australian Government Department of Health, 2018 [Available from: http://www.pbs.gov.au/info/about-the-pbs].
17. Australian Health Practitioner Regulation Agency. Who we are. Canberra: AHPRA, 2017 [Available from: http://www.ahpra.gov.au/About-AHPRA/Who-We-Are.aspx].
18. Australian Bureau of Statistics. ASGS Volume 1—Main structure and greater capital city statistical areas Australia. Cat. No. 1270.0.55.001. Canberra; 2011.

72 ROYAL FLYING DOCTOR SERVICE OF AUSTRALIA
19. Australian Government Department of Health. Rural classification reform—frequently asked questions. Canberra: Australian Government Department of Health, 2018 [Available from: http://www.doctorconnect.gov.au/internet/otd/publishing.nsf/Content/Classification-changes].
20. Australian Institute of Health and Welfare. Population groups. Canberra: AIHW, 2018 [Available from: https://www.aihw.gov.au/reports-statistics/population-groups].
21. Gardiner FW, Nwose EU, Bwititi P, Crockett J, Wang L. Blood glucose and pressure controls in diabetic kidney disease: narrative review of adherence, barriers and evidence of achievement. Journal of Diabetes and its Complications. 2018;32(1):104–12.
22. Gardiner FW, Nwose EU, Bwititi PT, Crockett J, Wang L. Services aimed at achieving desirable clinical outcomes in patients with chronic kidney disease and diabetes mellitus: A narrative review. SAGE Open Medicine. 2017;5:2050312117740989.
23. Britt H, Miller GC, Henderson J, Bayram C, Harrison C, Valenti L, et al. General practice activity in Australia 2015–16. Sydney: Sydney University; 2016.
24. Blackman A, Franklin RC, Rossetto A, Gray DE. Transforming farm health and safety: The case for business coaching. Journal of Agricultural Safety and Health. 2015;21(1):35–46.
25. The National Aboriginal Community Controlled Health Organisation. About us. NACCHO [Available from: https://nacchocommunique.com/about/].
26. Australian Bureau of Statistics. Australian demographic statistics, Sep 2017. Cat. no. 3101.0. Canberra: ABS, 2018 [Available from: http://www.abs.gov.au/AUSSTATS/[email protected]/Lookup/3101.0Main+Features1Sep%202017?OpenDocument].
27. Australian Bureau of Statistics. Feature article: Population by age and sex, Australia, states and territories. Canberra: ABS, 2015 [Available from: http://www.abs.gov.au/ausstats/[email protected]/featurearticlesbyCatalogue/7A40A407211F35F4CA257A2200120EAA?OpenDocument].
28. Australian Bureau of Statistics. Population by age and sex, regions of Australia, 2016. Cat. no. 3235.0. Canberra: ABS, 2017 [Available from: http://www.abs.gov.au/ausstats/[email protected]/0/151AA7593B394934CA2573210018DA4A?Opendocument].
29. Australian Institute of Health and Welfare. Australian burden of disease study: Impact and causes of illness and death in Australia 2011. Canberra: AIHW, 2016.
30. Australian Institute of Health and Welfare. Australia’s health 2016. Canberra: AIHW; 2016.
31. GBD 2015 Neurological Disorders Collaborator Group. Global, regional, and national burden of neurological disorders during 1990–2015: A systematic analysis for the Global Burden of Disease Study 2015. The Lancet Neurology. 2015;16(11):877–97.
32. Australian Bureau of Statistics. National health survey: First results, 2014–15. Canberra: ABS, 2015.
33. Gardiner FW, Nwose EU, Bwititi PT, Crockett J, Wang L. Adherence to blood pressure and glucose recommendations in chronic kidney disease hospital inpatients. Journal of the American Society of Hypertension. 2017;12(3):291–300.
34. Barnett T, Hoang H, Stuart J, Crocombe L. The relationship of primary care providers to dental practitioners in rural and remote Australia. BMC Health Services Research. 2017;17(1):515.
35. Barnett T, Hoang H, Stuart J, Crocombe L, Bell E. Utilisation of oral health services provided by non-dental health practitioners in developed countries: a review of the literature. Community Dent Health. 2014;31.
36. Gardiner FW. Medical stewardship: pathology evidence based ordering to reduce inappropriate test ordering in a teaching hospital. J Hosp Admin. 2016;5(1):73–80.
37. Australian Bureau of Statistics. Australian social trends, April 2013. Cat. no. 4102.0. Canberra: ABS, 2013 [Available from: http://www.abs.gov.au/AUSSTATS/[email protected]/Lookup/4102.0Main+Features20April+2013].
38. Australian Medical Workforce Advisory Committee. The general practice workforce in Australia. Sydney: AMWAC, 2000.
39. Australian institute of Health and Welfare. Medical practitioners workforce 2015. Canberra: AIHW, 2015.

73FROM 90 TO 100: PL ANNING FOR THE HEALTH NEEDS OF COUNTRY AUSTRALIA IN 2028
40. Rural Health West. Rural and remote primary health care workforce planning—What is the evidence? Perth: Rural Health West, 2014.
41. Maier CB, Barnes H, Aiken LH, Busse R. Descriptive, cross-country analysis of the nurse practitioner workforce in six countries: size, growth, physician substitution potential. BMJ Open. 2016;6(9):e011901.
42. Tennant M, Kruger E. Dentist-to-population and practice-to-population ratios: in a shortage environment with gross mal-distribution what should rural and remote communities focus their attention on? Rural and Remote Health. 2013;13(4):2518.
43. Australian Government Department of Health. Health workforce summaries. Canberra: Australian Government Department of Health, 2018.
44. Medical Board of Australia. Statistics. Canberra, 2018 [Available from: http://www.medicalboard.gov.au/News/Statistics.aspx].
45. Nursing and Midwifery Board of Australia. Statistics. Canberra: Nursing and Midwifery Board of Australia, 2018 [Available from: http://www.nursingmidwiferyboard.gov.au/About/Statistics.aspx].
46. Physiotherapy Board of Australia. Statistics. Canberra: Physiotherapy Board of Australia, 2018 [Available from: http://www.physiotherapyboard.gov.au/About/Statistics.aspx].
47. Pharmacy Board of Australia. Statistics. Canberra: Pharmacy Board of Australia, 2018 [Available from: http://www.pharmacyboard.gov.au/About/Statistics.aspx].
48. Dunbar JA, Hickie IB, Wakerman J, Reddy P. New money for mental health: will it make things better for rural and remote Australia? MJA. 2007;186(11):587–9.
49. Psychology Board of Australia. Statistics. Canberra: Psychology Board of Australia, 2018. Available from: http://www.psychologyboard.gov.au/About/Statistics.aspx.
50. Humphreys JS, Wakerman J, Wells R. What do we mean by sustainable rural health services? Implications for rural health research. Aust J Rural Health. 2006;14(1):33–5.
51. Australian Institute of Health and Welfare. Older Australia at a glance. Canberra: AIHW, 2017.
52. Buykx P, Humphreys J, Wakerman J, PAshen D. Systematic review of effective retention incentives for health workers in rural and remote areas: towards evidence–based policy. Aust J Rural Health. 2010;18(3).
53. Wakerman J, Humphreys JS, Wells R, Kuipers P, Entwistle P, Jones J. Primary health care delivery models in rural and remote Australia—a systematic review. BMC Health Services Research. 2008;8(276):1–10.
54. Steele L, Pacza T, Tennant M. Rural and remote oral health, problems and models for improvement: a Western Australian perspective. Aust J Rural Health. 2000;8(1):22–8.
55. Bryant L, Garnham B, Tedmanson D. Tele-social work and mental health in rural and remote communities in Australia. International Social Work. 2018;61(1):143–55.
56. McLennan A. Mental health and wellbeing: profile of adults, Australia, 1997. Canberra: ABS, 1998.
57. Bayer JK, Peay MY. Predicting intentions to seek help from professional mental health services. Aust N Z J Psychiatry. 1997;31(4):504–13.
58. Fuller J, Edwards J, Procter N, Moss J. How definition of mental health problems can influence help seeking in rural and remote communities. Aust J Rural Health. 2001;8(3):148–53.
59. Gardiner F, Gardiner E. Similarities between military and medical service: stigma of seeking mental health assistance. J R Army Med Corps. 2018 [epub ahead of print].
60. Smith T. We can and do make a difference by improving medical radiation services in rural and remote locations. J Med Radiat Sci. 2017;64(4):Editorial.
61. Rawle M, Oliver T, Pighills A, Lindsay D. Improving education and supervision of Queensland X–ray operators through video conference technology: a tele–radiography pilot project. J Med Radiat Sci. 2017;64(1):244–50.

74 ROYAL FLYING DOCTOR SERVICE OF AUSTRALIA
62. Humphreys J, Wakerman J, Kuipers P, Wells B, Russell D, Siegloff S, et al. Improving workforce retention: developing an integrated logic model to maximise sustainability of small rural & remote health care services. Canberra: Australian Primary Health Care Research Institute, 2009.
63. World Health Organization. The world health report 2006: working together for health. Geneva: WHO, 2006.
64. Humphreys J, Jones J, Jones M, Hugo G, Bamford E, Taylor D. A critical review of rural medical workforce retention in Australia. Aust Health Rev. 2001;24(4):91–102.
65. Bishop L, Ransom A, Laverty M. Health care access, mental health, and preventive health: health priority survey findings for people in the bush. Canberra: Royal Flying Doctor Service of Australia, 2017.
66. Gardiner FW, McCuaig R, Arthur C, Carins T, Morton A, Laurie J, et al. The prevalence and pregnancy outcomes of intrahepatic cholestasis of pregnancy: a retrospective clinical audit review. Obstetric Medicine. 2018;In review.
67. Wakerman J, Humphreys JS, Wells R, Kuipers P, Jones JA, Entwistle P, et al. Features of effective primary health care models in rural and remote Australia: a case-study analysis. MJA. 2009;191(2):88–91.

75FROM 90 TO 100: PL ANNING FOR THE HEALTH NEEDS OF COUNTRY AUSTRALIA IN 2028
Appendix: Clinical health priorities for people in the bush, a clinical respective

76 ROYAL FLYING DOCTOR SERVICE OF AUSTRALIA


78 ROYAL FLYING DOCTOR SERVICE OF AUSTRALIA

79FROM 90 TO 100: PL ANNING FOR THE HEALTH NEEDS OF COUNTRY AUSTRALIA IN 2028

80 ROYAL FLYING DOCTOR SERVICE OF AUSTRALIA