ency-education.com/exams - tomohna.org€¦ · ency-education.com/exams
Upload
phungthuanCategory
view
214download
1
YksikköNimiYhteystiedot
Muistio
19.4.2008
Intermediate 4 -5 Key (20 points maximum) ‘
NAME OF THE STUDENT:_________________________
Grade:______ Age:_________
School:________________________________
Professor’s name:________________________________
Class:_____ D
INSTRUCTIONS FOR THE STUDENT
WRITE YOUR ANSWERS LEGIBLY. PRINT IF YOUR HANDWRITING IS NOT VERY CLEAR
1
QuickTime™ and aTIFF (Uncompressed) decompressor
are needed to see this picture.
QuickTime™ and aTIFF (Uncompressed) decompressor
are needed to see this picture.

ANSWER IN THE SPACE PROVIDED
YOU HAVE 90 MINUTES TO COMPLETE THIS ACTIVITY
SHOW WORK IF ASKED TO DO SOME CALCULATIONS
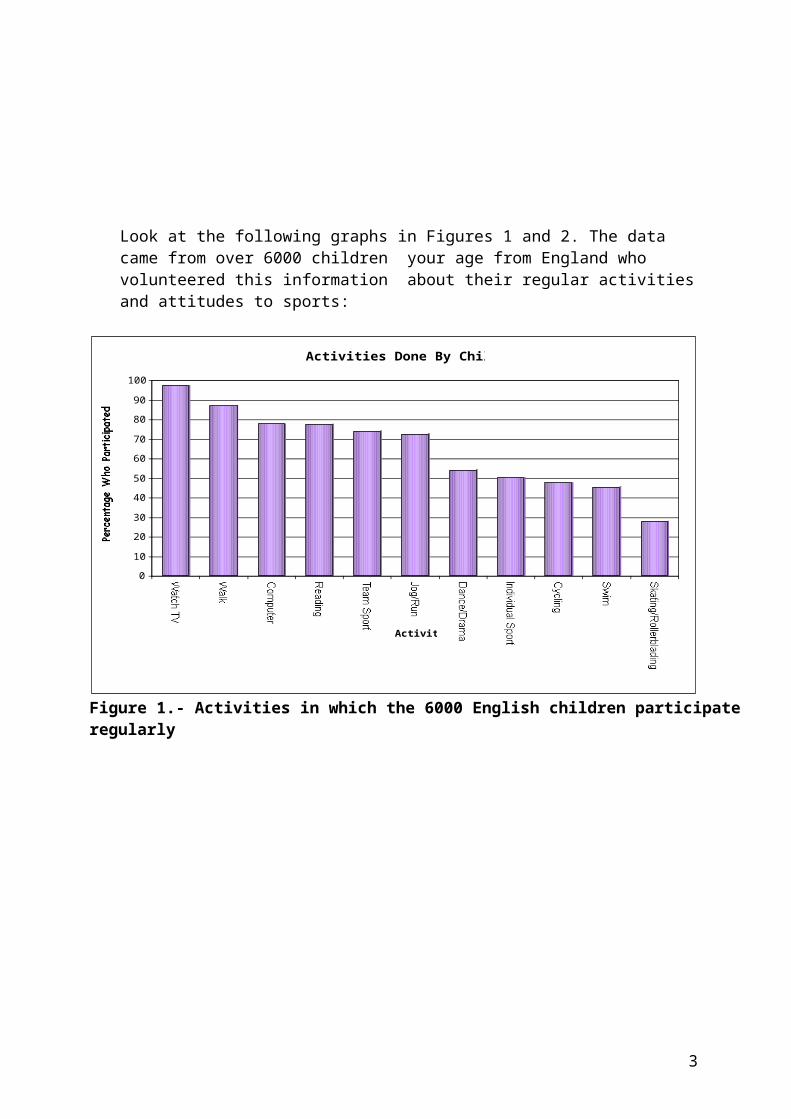
Look at the following graphs in Figures 1 and 2. The data came from over 6000 children your age from England who volunteered this information about their regular activities and attitudes to sports:
2
Activities Done By Children
0
10
20
30
40
50
60
70
80
90
100
Watch TV Walk ComputerReading Team SportJog/Run Dance/DramaIndividual SportCycling Swim Skating/Rollerblading
Activity
Percentage Who Participated
Figure 1.- Activities in which the 6000 English children participate regularly
Figure 2.- Attitudes to sports of the 6000 English children.
1. Approximately what percentage of those English children swim regularly ? (1 point) Approximately 45% ( Figure 1 )
2. Do all those English children watch TV? (1 point)
3

Not all, but almost all of them, 97% approximately (Figure 1)
3. Which is the modal activity? (1 point) Watching TV
4. If your class was asked which activities they regularly took part in, would the results be similar to the ones shown above for the English children? If not, what would be different? If yes, what would explain the similarities? Draw a bar graph to illustrate the percentage of students in your class that you think do each of those activities in Figure 1 regularly. Alternatively, you may draw your graph by marking in Figure 1. Just make sure that it is clear which is South Africa, which England. Write your comments in the space below. ( 2points)
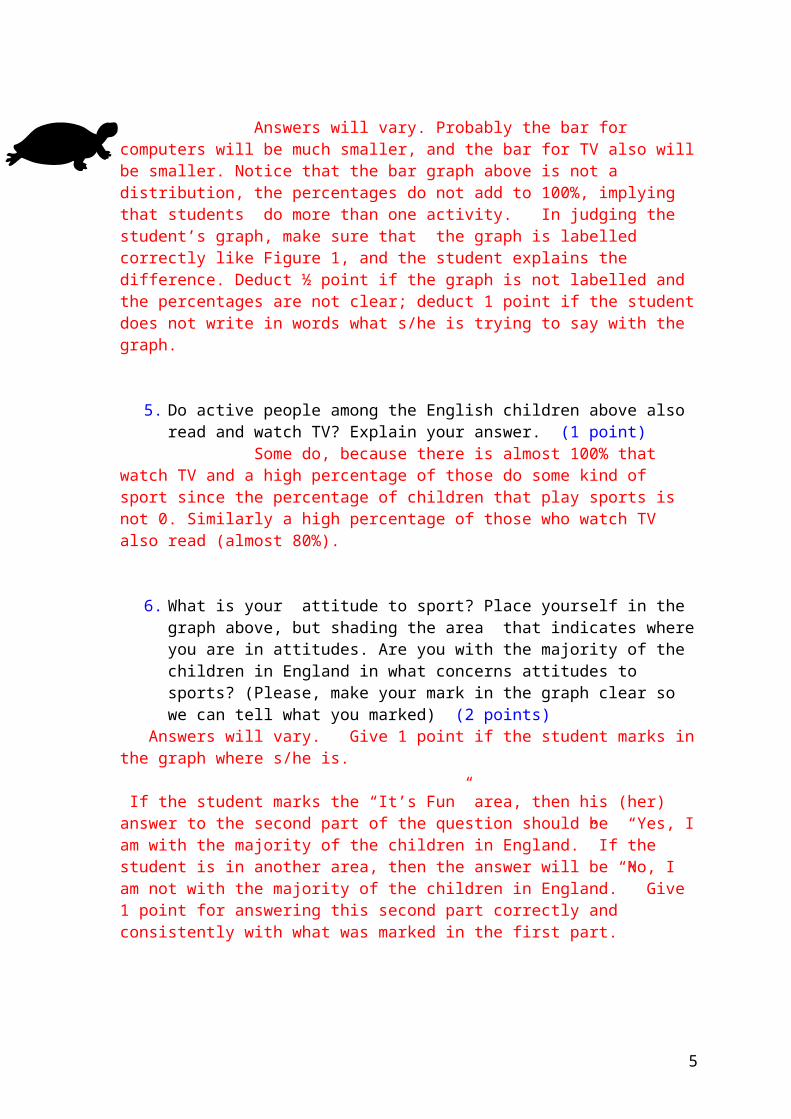
Answers will vary. Probably the bar for computers will be much smaller, and the bar for TV also will be smaller. Notice that the bar graph above is not a distribution, the percentages do not add to 100%, implying that students do more than one activity. In judging the student’s graph, make sure that the graph is labelled correctly like Figure 1, and the student explains the difference. Deduct ½ point if the graph is not labelled and the percentages are not clear; deduct 1 point if the student does not write in words what s/he is trying to say with the graph.
5. Do active people among the English children above also read and watch TV? Explain your answer. (1 point)
Some do, because there is almost 100% that watch TV and a high percentage of those do some kind of sport since the percentage of children that play sports is not 0. Similarly a high percentage of those who watch TV also read (almost 80%).
6. What is your attitude to sport? Place yourself in the graph above, but shading the area that indicates where you are in attitudes. Are you with the majority of the children in England in what concerns attitudes to sports? (Please, make your mark in the graph clear so we can tell what you marked) (2 points)
Answers will vary. Give 1 point if the student marks in the graph where s/he is.
If the student marks the “It’s Fun” area, then his (her) answer to the second part of the question should be “Yes, I am with the majority of the children in England.” If the student is in another area, then the answer will be “No, I am not with the majority of the children in England.” Give 1 point for answering this second part correctly and consistently with what was marked in the first part.
4
7.- What is the main reason those children in England participate in sports? Do you think that represents all children in England? (1 point) Give ½ point for saying that the majority of children participate in sports because it is fun. Give an additional ½ point if the student recognizes that the pie chart in Figure 2 does not represent all children in England, because the 6000 children volunteered their response, they were not selected at random from the population of all children in England.
Below is Table 1, showing the total average calories from food needed each day by boys and girls based on age and activity level. Select the cells in the tables where you belong. Do you think this table represents the calories that South African children need? Explain. (1 point)
Answers will vary. Give one point if the student marks the cell where s/he thinks s/he is. Do not give full credit if the age is not consistent with the age given on the front page.
5

Table 1.- Calories needs of children
Remember, the more active you are the more calories you use.
6

8. We have designed a calorie diary below for a day in your life. Using the information to the left fill in the calories you use up on a typical day. Can you spot what usual activities have been left out of this diary? Write those activities here(2 points)
1 point for filling in all the calories (see numbers in red below). Add another point if the student notices some
other activity in his/her life that is not added in the diary below (for example, the student probably thinks that playing should be in the diary or mentions that some of these are not his/her activities.)
Midnight - 7am. 7am — 8am 8am — 9am 9am — 4pm 5.30pm — 9pm 4pm — 5.30pm 9pm — Midnight
Calories Used:
Calor ies Used :
Calor ies Used:
Calor ies Used :
Calor ies Used :
Calor ies Used :
Calor ies Used:
Do the calories you use correspond to what Table 1 says you require? Are you different or similar to the average person your age? (2 points) Give one point for saying that the calories calculated in the diary above add up to 2262.5. The second part of the answer will vary and will depend on what cell the student marked in Table 1. For example, if the student marked
7
420 230 130 770 322.5 210 180

that he is a boy age 9-13 and needs 2000-2600, then the calories calculated in the diary should be enough. Give one more point for this part.
Notice that the student might reason that since some activities are missing, it is hard for him/her to say.
9.- The number of calories that we need can be obtained from food we eat. Thus calories information in food is very important if we want to make sure that we don’t consume more calories than needed. Shown below are the calories of sandwiches of popular fast food places. Using all the places and all the sandwiches in each, compare the calories of the chicken and been (should have said beef) sandwiches. Use some summary statistic to compare them.
(2 point) It would make sense that the student computes the average calories of each type of sandwich. We will compute the average calories of all the sandwiches that have the chicken word in it and the average calories of all the other sandwiches. Give one point for doing the computations For chickenAverage calories= (500+440+550+710+480+350)/6 = 505For beefAverage calories= (260+320+420+530+560+640+730+870+960+330+380+270+310+570+530+490)/16 = 510.625Give one point for the conclusion. So the beef sandwiches have about 5 more calories than the chicken ones.
Table 2
8
QuickTime™ and aTIFF (Uncompressed) decompressorare needed to see this picture.
QuickTime™ and aTIFF (Uncompressed) decompressor
are needed to see this picture.

10.- How many chicken sandwiches a day, approximately, would you have to eat to obtain all the calories that you said you needed in Table 1. ?
(1 point). Answers will vary. If the student said, for example, that he needed 2000-2600 calories in table 1, then the student should say here that he needs 4 to 5 chicken sandwiches a day. Give full credit if the student’s answer is consistent.
9

11.- Nutrition, exercise and health are major issues in the quality of life of a country. You would like to conduct a survey to find out whether students your age eat enough for their level of activity. Write down below the questions that you would ask them to collect data that would allow you to answer those questions. About how many students would you ask? Why? How would you select the students? (3 points)
Give 1 point for relevant questions: i.e, student should write questions relevant to finding how much other students eat and what do they do during the day. That is, the student should show that s/he is using what s/he learned in this exam.
Give 1 point for a number of students that is not too small, and the student should reason that s/he will ask a large number because s/he wants the sample to be sufficient to draw conclusions for all children.
Give 1 point for saying that the sample should be chosen at random for it to be representative of the whole population of students his/her age.
10