LONZA ANNUAL REPORT FINANCIAL REPORT REMUNERATION …
148
LONZA ANNUAL REPORT FINANCIAL REPORT REMUNERATION REPORT CORPORATE GOVERNANCE REPORT 2014
Transcript of LONZA ANNUAL REPORT FINANCIAL REPORT REMUNERATION …
LONZA ANNUAL REPORTFINANCIAL REPORTREMUNERATION REPORTCORPORATE GOVERNANCE REPORT
2014

About the CoverLonza’s footprint comprises approximately 90 sites in nearly 30 countries around the world. The cover pictures show our facilities in Portsmouth, NH (USA), in Singapore and in Visp (CH), as well as our headquarters in Basel (CH), and rep-resent our strong presence globally.
Singapore
Visp (CH) Basel (CH)
Portsmouth, NH (USA)

LONZA ANNUAL REPORTFINANCIAL REPORT REMUNERATION REPORTCORPORATE GOVERNANCE REPORT
2014

3 LONZA ANNUAL REPORT 2014
REMUNERATION REPORT
Compensation and Performance Overview 2014 98Compensation-Setting Process 99Compensation Components 102Compensation of the Board of Directors 102Compensation of the Executive Committee 106Share Ownership of the Members of the Board of Directors and the Executive Committee 120Employee Share Purchase Plan (ESPP) 120Guide to Compensation Approvals by the Annual General Meeting 2016 121Report of the Statutory Auditor 123
CORPORATE GOVERNANCE REPORT
Group Structure and Shareholders 126Capital Structure 128Board of Directors 131Executive Committee 142Compensation, Shareholdings and Loans 146Shareholders’ Participation Rights 146Changes of Control and Defense Measures 147Auditors 148Information Policy and Key Reporting Dates 149
FINANCIAL REPORT
Consolidated Financial StatementsConsolidated Balance Sheet 6Consolidated Income Statement 7Consolidated Statement of Comprehensive Income 7Consolidated Cash Flow Statement 8Consolidated Statement of Changes in Equity 9 Notes to the Consolidated Financial Statements 10Report of the Statutory Auditor 83
Financial Statements of Lonza Group LtdBalance Sheet – Lonza Group Ltd 84Income Statement – Lonza Group Ltd 85Notes to the Financial Statements – Lonza Group Ltd 86Proposal of the Board of Directors 88Report of the Statutory Auditor 89
Supplementary Financial InformationInvestor Information 90Statement of Value Added 92Free Cash Flow 93Core Results 94
FINANCIAL OVERVIEW
HOME [ CLICK THE ARTICLES TO NAVIGATE ]

5 LONZA ANNUAL REPORT 2014
FINANCIAL REPORT
Consolidated Financial StatementsConsolidated Balance Sheet 6Consolidated Income Statement 7Consolidated Statement of Comprehensive Income 7Consolidated Cash Flow Statement 8Consolidated Statement of Changes in Equity 9Notes to the Consolidated Financial Statements 10Report of the Statutory Auditor 83
Financial Statements of Lonza Group LtdBalance Sheet – Lonza Group Ltd 84Income Statement – Lonza Group Ltd 85Notes to the Financial Statements – Lonza Group Ltd 86Proposal of the Board of Directors 88Report of the Statutory Auditor 89
Supplementary Financial InformationInvestor Information 90Statement of Value Added 92Free Cash Flow 93Core Results 94
FINANCIAL REPORT
[ CLICK THE ARTICLES TO NAVIGATE ]

6 LONZA ANNUAL REPORT 2014
CONSOLIDATED BALANCE SHEET
Assets 1
million CHF 2 Note 2014 2013
Non-current assetsProperty, plant and equipment 5 2 466 2 494Intangible assets 4 877 807Goodwill 4 1 130 1 042Other non-current assets 21 28Deferred tax assets 20 47 100Investments in associates / joint ventures 6 17 13Other investments 7 6Non-current loans and advances 13 1 69Total non-current assets 4 566 4 559
Current assetsInventories 7 898 747Trade receivables 9 622 559Current tax receivables 7 24Other receivables, prepaid expenses and accrued income 10 139 175Current advances 13 0 3Cash and cash equivalents 11, 13 209 306Total current assets 1 875 1 814
Total assets 6 441 6 373
At 31 December See the accompanying notes to the consolidated financial statements
1
2
Total Equity and Liabilities 1
million CHF 2 Note 2014 2013
EquityShare capital 24 53 53Share premium 311 310Treasury shares 24 (77) (80)Retained earnings and reserves 1 843 1 843Total equity attributable to equity holders of the parent 2 130 2 126Non-controlling interest 0 0Total equity 2 130 2 126
LiabilitiesDeferred tax liabilities 20 256 393Non-current provisions 12 47 56Employee benefit liability 22 727 364Other non-current liabilities 36 30Non-current debt 13 1 693 2 245Total non-current liabilities 2 759 3 088Current provisions 12 38 43Other current liabilities 14 647 508Current tax payables 77 86Trade payables 15 262 286Current debt 13 528 236Total current liabilities 1 552 1 159Total liabilities 4 311 4 247
Total equity and liabilities 6 441 6 373
FINANCIAL REPORT

7 LONZA ANNUAL REPORT 2014
CONSOLIDATED STATEMENT OF COMPREHENSIVE INCOME
million CHF 1 Note 2014 2013
Profit for the period 237 87
Other comprehensive income
Items that will not be reclassified to profit or loss:Re-measurements of net defined benefit liability 22 (352) 128 Income tax on items that will not be reclassified to profit or loss 20.2 103 (249) (45) 83
Items that are or may be reclassified subsequently to profit or loss:Exchange differences on translating foreign operations 131 (48) Cash flow hedges (12) 1 Income tax on items that are or may be reclassified to profit or loss 20.2 (4) 115 2 (45)
Other comprehensive (loss) / income for the period, net of tax (134) 38 Total comprehensive income for the period 103 125
Total comprehensive income attributable to:Equity holders of the parent 103 125 Non-controlling interest 0 0 Total comprehensive income for the period 103 125
CONSOLIDATED INCOME STATEMENT
million CHF 1 Note 2014 2013
Sales 2 3 640 3 584Cost of goods sold (2 566) (2 758)Gross profit 1 074 826
Marketing and distribution (239) (228)Research and development 21 (101) (111)Administration and general overheads (294) (212)Other operating income 18 45 43Other operating expenses 18 (62) (65)Result from operating activities (EBIT) 423 253Financial income 19.1 150 44Financial expenses 19.2 (210) (163)Net financing costs (60) (119)Share of loss of associates / joint ventures 6 (84) (29)Profit before income taxes 279 105
Income taxes 20 (42) (18)Profit for the period 237 87
Attributable to:Equity holders of the parent 237 87Non-controlling interest 0 0Profit for the period 237 87
CHF CHF
Basic earnings per share 25 4.56 1.67Diluted earnings per share 25 4.54 1.67
See the accompanying notes to the consolidated financial statements
1
FINANCIAL REPORT

8 LONZA ANNUAL REPORT 2014
million CHF 1 Note 2014 2013
Purchase of property, plant and equipment 5 (158) (194)Purchase of intangible assets 4 (22) (17)Proceeds from sale of tangible and intangible assets 8 14Business combinations, net of cash acquired 0 (4)Disposal of subsidiaries, net of cash disposed of 0 6Purchase of unconsolidated investments (3) (1)Proceeds from sale of other assets 2 19Decrease in loans and advances 2 3Increase in loans and advances (6) (21)Interest received 8 6Dividends received 2 2Net cash used for investing activities (167) (187)
Repayment of straight bond 13 0 (300) Issue of straight bond 13 0 299 Repayment of syndicated loan 13 (195) (130) Repayment of acquisition bridge financing 13 (104) (244)Proceeds from / (repayment of) borrowings 13 (14) 39Increase in other liabilities 3 3Decrease in other liabilities (1) (6) Dividends paid 25 (112) (112)Sale of treasury shares 2 0 Net cash used for financing activities (421) (451)
Effect of currency translation on cash 8 (7)
Net decrease in cash and cash equivalents (97) (123)Cash and cash equivalents at 1 January 306 429Cash and cash equivalents at 31 December 209 306
See the accompanying notes to the consolidated financial statements
1
CONSOLIDATED CASH FLOW STATEMENT
million CHF 1 Note 2014 2013
Profit for the period 237 87 Adjustments for non-cash items:
– Income taxes 20 42 18– Net financing costs 19 60 119– Share of loss of associates / joint ventures 6 84 29– Depreciation of property, plant and equipment
(excl. impairment) 5 250 254– Amortization of intangibles 4 49 55– Reversal of impairment 3,5 (1) 0– Impairment losses on property, plant,
equipment and intangibles 3,5 16 85– Increase of provisions 12 14 39– Decrease of employee benefit liability (8) (60)– Loss on disposal of property, plant
and equipment 2 7– Amortization of other liabilities / assets 1 0– Share-based payments 11 10
Income taxes paid (39) (47)Interest paid (61) (87)Total before change in net working capital 657 509Increase inventories (111) (21)(Increase) / decrease trade receivables (45) 52Increase / (decrease) trade payables (6) 18(Increase) / decrease other net working capital 68 (7)Use of provisions 12 (33) (12)Decrease of other payables net (47) (17)Net cash provided by operating activities 483 522
FINANCIAL REPORT

9 LONZA ANNUAL REPORT 2014
CONSOLIDATED STATEMENT OF CHANGES IN EQUITY
million CHF 1 Note Attributable to equity holders of the parent Non-controlling
interest
Total equityShare
capitalShare
premiumRetained earnings
Hedging reserve
Translation reserve
Treasury shares Total
At 31 December 2012 53 310 2 352 1 (529) (84) 2 103 (1) 2 102
Profit for the period 0 0 87 0 0 0 87 0 87– Remeasurement of defined benefit liability 0 0 83 0 0 0 83 0 83– Exchange differences on translating foreign
operations 0 0 0 0 (45) 0 (45) 0 (45)
Other comprehensive income, net of tax 0 0 83 0 (45) 0 38 0 38Total comprehensive income for the period 0 0 170 0 (45) 0 125 0 125
Dividends 25 0 0 (112) 0 0 0 (112) 0 (112)Recognition of share-based payments 23 0 0 10 0 0 0 10 0 10Transfer of employee shares 0 0 (4) 0 0 4 0 0 0Changes in non-controlling interests 0 0 0 0 0 0 0 1 1At 31 December 2013 53 310 2 416 1 (574) (80) 2 126 0 2 126
Profit for the period 0 0 237 0 0 0 237 0 237 – Remeasurement of defined benefit liability 0 0 (249) 0 0 0 (249) 0 (249)– Exchange differences on translating foreign
operations 0 0 0 0 125 0 125 0 125– Cash flow hedges 0 0 0 (10) 0 0 (10) 0 (10)
Other comprehensive income, net of tax 0 0 (249) (10) 125 0 (134) 0 (134)Total comprehensive income for the year 0 0 (12) (10) 125 0 103 0 103
Dividends 25 0 0 (112) 0 0 0 (112) 0 (112)Recognition of share-based payments 23 0 0 11 0 0 0 11 0 11Transfer of employee shares 0 0 (2) 0 0 2 0 0 0Sale of treasury shares less taxes 0 1 0 0 0 1 2 0 2At 31 December 2014 53 311 2 301 (9) (449) (77) 2 130 0 2 130
Translation Reserve The translation reserve of the consolidated statement of changes in equity comprises all foreign exchange differences arising from the translation of the financial statements of foreign entities including the impact on translating monetary items that form a net investment in a foreign operation.
See the accompanying notes to the consolidated financial statements
1
FINANCIAL REPORT

10 LONZA ANNUAL REPORT 2014
NOTES TO THE CONSOLIDATED FINANCIAL STATEMENTS
1 ACCOUNTING PRINCIPLES
Lonza Group Lonza Group Ltd and its subsidiaries (hereafter “the Group” or “Lonza”) operate under the name Lonza. Lonza Group Ltd is a limited liability company incorporated and domiciled in Switzerland. The Group is headquartered in Basel, Switzerland. Lonza is one of the world’s leading suppliers to the pharmaceutical, healthcare and life science industries. Products and services span its customers’ needs from research to final product manufacture. It is the global leader in the production and support of chemical and biological active pharmaceutical ingredients. Lonza is also the world leader in microbial control, providing innovative, chemistry-based and related solutions to destroy or selectively inhibit the growth of harmful microorganisms. Its activities encompass the areas of water treatment, personal care, health and hygiene, industrial preserva-tion, materials protection, and wood protection.
Basis of Preparation The consolidated financial statements for 2014 and 2013 are reported in Swiss francs (CHF), rounded to millions, and based on the annual accounts of Lonza Group Ltd (Company) and its subsidiaries at 31 December, which have been drawn up according to uniform Group accounting principles. The consolidated accounts are prepared in accordance with the International Financial Reporting Standards (IFRS) and with Swiss law. They are prepared on the historical cost basis, except that derivative financial instruments are stated at their fair values and the employee benefit liability is stated at the fair value of plan assets less the present value of the defined benefit obligation.
Reclassifications Certain reclassifications have been made to prior fiscal year amounts or balances to conform to the presenta-tion in the current fiscal year.
Changes in Accounting Standards There were no new standards or amendments to existing standards that had a significant impact on the Group’s consolidated financial statements.
The following new and revised standards have been issued, but are not yet effective. They have not been applied early in these con-solidated financial statements. Their impact on the consolidated financial statements of Lonza has not yet been comprehensively analyzed. The expected effects as disclosed below reflect a first assessment by Group management.
Standard / Interpretation Effective date Planned application by Lonza
Amendment to IAS 19 – Defined Benefit Plans: Employee Contributions * 1 July 2014 Reporting year 2015Annual Improvements (2010–2012 cycle) * 1 July 2014 Reporting year 2015Annual Improvements (2011–2013 cycle) * 1 July 2014 Reporting year 2015Amendments to IAS 1 – Disclosure Initiative * 1 January 2016 Reporting year 2016Amendments to IFRS 11 – Acquisitions of Interests in Joint Operations * 1 January 2016 Reporting year 2016Amendments to IAS 16 and IAS 38 – Clarification of Acceptable Methods of Depreciation and Amortization * 1 January 2016 Reporting year 2016Amendments to IFRS 10 and IAS 28 – Sale or Contribution of Assets Between an Investor and its Associate or Joint Venture * 1 January 2016 Reporting year 2016Annual Improvements (2012– 2014 cycle) * 1 January 2016 Reporting year 2016IFRS 15 – Revenue from Contracts with Customers ** 1 January 2017 Reporting year 2017IFRS 9 – Financial instruments ** 1 January 2018 Reporting year 2018
No or no significant impact is expected on the consolidated financial statements The Group is currently assessing the impact of adopting these standards
*
**
FINANCIAL REPORT
Click Note

11 LONZA ANNUAL REPORT 2014
Principles of Consolidation The consolidated financial state-ments represent the accounts for the year ended 31 December of Lonza Group Ltd and its subsidiaries. Subsidiaries are those entities controlled, directly or indirectly, by Lonza Group Ltd. Control is achieved when the Group is exposed, or has rights, to variable returns from its involvement with the entity and has the ability to affect those returns through its power over the entity. Consolidation of a subsidiary begins when the Group obtains control over the subsidiary and ceases when the Group loses control of the subsidiary. Changes in ownership interests in subsidiaries are accounted for as equity transactions if they occur after control has already been obtained and if they do not result in a loss of control. The significant subsidiaries included in the consolidated financial statements are shown in note 31.
The full consolidation method is used, whereby the assets, liabili-ties, income and expenses are incorporated in full, irrespective of the extent of any non-controlling interest. Payables, receivables, income and expenses between Lonza-consolidated companies are eliminated. Intercompany profits included in year-end inventories of goods produced within Lonza are eliminated, as well as unreal-ized gains on transactions between subsidiaries. Unrealized losses are also eliminated unless the transaction provides evidence of an impairment of the asset transferred.
The Group’s interests in equity-accounted investees comprise interests in associates and joint ventures, as disclosed in note 6. Associates are those entities in which the Group has significant influence, but not control or joint control, over the financial and operating policies. A joint venture is an arrangement in which the Group has joint control, whereby the Group has rights to the net assets of the arrangement, rather than rights to its assets and obligations for its liabilities. Associates and interests in joint ventures are accounted for in the consolidated financial statements using the equity method of accounting. They are recognized ini-tially at cost, which includes transaction costs. Subsequent to the initial recognition, the consolidated financial statements include the Group’s share of the profit and loss and other comprehensive income of equity-accounted investees, until the date on which significant influence or joint control ceases. Dividends paid dur-ing the year reduce the carrying value of the investments.
Segment Reporting For the purpose of segment reporting, the Group’s Executive Committee (EC) is considered to be the Group’s Chief Operating Decision Maker. The determination of the Group’s operating segments is based on the organizational units for which information is reported to the EC on a regular basis. The information provided is used as the basis of the seg-ment revenue and profit disclosures reported in note 2. Selected
segment balance sheet information and performance measures are also routinely provided to the EC. The Group has two segments, Pharma&Biotech and Specialty Ingredients. Revenues are primar-ily generated from the sale of products. The Pharma&Biotech seg-ment also derives revenues from the sale or licensing of products or technology to third parties. Residual operating activities from certain global activities are reported as “Corporate”. These include the EC and global group functions for communications, human resources, finance (including treasury and taxes), legal, environ-mental and safety services. Transfer prices between operating segments are set on an arm’s-length basis. Operating assets and liabilities consist of property, plant and equipment, goodwill and intangible assets, trade receivables / payables, inventories and other assets and liabilities, such as provisions, which can be reasonably attributed to the reported operating segments. Non-operating as-sets and liabilities mainly include current and deferred income tax balances, post-employment benefit assets / liabilities and financial assets / liabilities such as cash, investments and debt.
Revenue Recognition Sales are recognized when the significant risks and rewards of ownership of the assets have been trans-ferred to a third party and are reported net of sales taxes and rebates. Rebates to customers are recognized in the same period that the related sales are recorded. Revenue from termination fees is recorded in the income statement in the period in which the termination occurs. The percentage of completion (POC) method is applied for development projects and defined long-term contracts in the Pharma&Biotech segment that have the economic substance of a construction contract. The stage of completion of a contract is determined on the basis of the estimated total contract costs. Revenue from the sale of rights is recognized upon transfer of rights or on an accrual basis, depending on whether the transaction in substance is a sale or a licensing arrangement. Interest income is recognized on a time-proportion basis using the effective interest method. Dividend income is recognized when the right to receive payment is established.
Foreign Currencies Items included in the financial statements of each of the Group’s entities are measured using the currency of the primary economic environment in which the entity oper-ates (“the functional currency”). The consolidated financial state-ments are presented in Swiss francs (CHF), which is the Group’s presentation currency. For consolidation purposes the balance sheet of foreign consolidated companies is translated to CHF with the rate on the balance sheet date. Income, expenses and cash flows of the foreign consolidated companies are translated into CHF using the monthly average exchange rates during the year (unless this average is not a reasonable approximation of the cumulative effect of the rates prevailing on the transaction dates,
FINANCIAL REPORT
Click Note

12 LONZA ANNUAL REPORT 2014
in which case income and expenses are translated at the dates of the transactions). Exchange rate differences arising from the different exchange rates applied in balance sheets and income statements are recognized in other comprehensive income. In the individual company’s financial statements, transactions in foreign currencies are translated at the foreign exchange rate applicable at the date of the transaction. Monetary assets and liabilities denominated in foreign currencies at the balance sheet date are translated at the foreign exchange rate ruling at that date. All resulting foreign exchange gains and losses are recognized in the individual company’s profit or loss statement, except when they arise on monetary items that form a part of the Group’s net investment in a foreign entity. In such a case, the exchange gains and losses are recognized in other comprehensive income.
Derivative Financial Instruments and Hedging Derivative fi-nancial instruments are initially recognized in the balance sheet at their fair value. The method of recognizing the resulting gain or loss is dependent on whether the derivative contract is designed to hedge a specific risk and qualifies for hedge accounting. On the date a derivative contract is entered into, the Group designates derivatives that qualify as hedges for accounting purposes as either a hedge of the fair value of a recognized asset, liability or firm commitment (fair value hedge), a hedge of a forecasted transaction (cash flow hedge) or a hedge of a net investment in a foreign entity. Changes in the fair value of derivatives that are fair value hedges are recognized in the income statement, along with any changes in the fair value of the hedged asset or liability that is attributable to the hedged risk. Changes in the fair value of derivatives in cash flow hedges that are highly effective are recognized in other comprehensive income. The gain or loss relating to the ineffec-tive portion is recognized immediately in the income statement. Where the forecasted transaction results in the recognition of an asset or liability, the gains and losses previously included in other comprehensive income are included in the initial measurement of the asset or liability. Otherwise, amounts recorded in other comprehensive income are transferred to the income statement and classified as revenue or expense in the same period in which the forecasted transaction affects the income statement.
Certain derivative instruments, while providing effective eco-nomic hedges under the Group’s policies, do not qualify for hedge accounting. Changes in the fair value of any derivative instru-ments that do not qualify for hedge accounting are recognized immediately in the income statement.
When a hedging instrument expires or is sold, or when a hedge no longer meets the criteria for hedge accounting, any cumula-tive gain or loss existing in other comprehensive income at that
time remains in equity and is recognized in the income statement, when the committed or forecasted transaction is ultimately rec-ognized in the income statement.
However, if a forecasted or committed transaction is no longer expected to occur, the cumulative gain or loss that was recognized in other comprehensive income is immediately transferred to the income statement.
The purpose of hedge accounting is to match the impact of the hedged item and the hedging instrument in the income state-ment. To qualify for hedge accounting, the hedging relationship must meet several strict conditions with respect to documentation, probability of occurrence, hedge effectiveness and reliability of measurement. At the inception of the transaction, the Group documents the relationship between hedging instruments and hedged items, as well as its risk management objective and strategy for undertaking various hedge transactions.
This process includes linking all derivatives designated as hedges to specific assets and liabilities or to specific firm commitments or forecasted transactions. The Group also documents its assess-ment, both at the hedge inception and on an ongoing basis, as to whether the derivatives that are used in hedging transactions are highly effective in offsetting changes in fair values or cash flows of hedged items.
The fair value of derivatives (forward exchange contract, FX swaps, commodity swaps and interest rate swaps) is estimated by dis-counting the difference between the contractual forward price and the current forward price for the residual maturity of the contract using a credit-adjusted risk-free rate. Current forward prices are provided by banks or other financial service providers.
Property, Plant and Equipment Property, plant and equipment are stated at cost less accumulated depreciation and accumulated impairment losses. The assets are depreciated on a component basis over their estimated useful lives, which vary from 10 to 50 years for buildings and structures, and 5 to 16 years for produc-tion facilities, machinery, plant, equipment and vehicles. Fixed assets are depreciated using the straight-line method over their estimated useful lives. Subsequent expenditure incurred to re-place a component of an item of property, plant and equipment that is accounted for separately, including major inspection and overhaul expenditure, is capitalized. Other subsequent expen-diture is capitalized only when it increases the future economic benefits embodied in the item of property, plant and equipment. Borrowing costs incurred with respect to qualifying assets are capitalized and included in the carrying value of the assets. All
FINANCIAL REPORT
Click Note

13 LONZA ANNUAL REPORT 2014
other expenditure is recognized in the income statement as an expense as incurred. The residual values and the useful life of items of property, plant and equipment are reviewed and adjusted, if appropriate, at each balance sheet date.
Leases Financial leases, which effectively constitute assets pur-chased with long-term financing, are carried as fixed assets at their purchase price and are written off over their estimated useful lives if the leased assets are transferred to the lessee at the end of the lease term. If there is no reasonable certainty that the lessee will obtain ownership by the end of the lease term, the asset is fully depreciated over the shorter of the lease term and its useful life. The corresponding liabilities are included in non-current and current debt. The finance lease gives rise to a depreciation expense for depreciable assets as well as a finance expense for each accounting period. For the purpose of classifying a lease of land and buildings, lease of the land and of the buildings are evaluated separately. Lease payments under an operating lease are recognized as an expense in the income statement on a straight-line basis over the lease term.
Intangible Assets Purchased intangible assets with a finite useful life are stated at cost less accumulated amortization and accumu-lated impairment losses. Intangible assets acquired in a business combination are recognized at their fair value. Intangibles include software, licenses, patents, trademarks and similar rights granted by third parties, capitalized product development costs and capital-ized computer software development costs. Costs associated with internally developed or maintained computer software programs are recognized as an expense as incurred. Costs that are directly associated with the production of identifiable and unique software products controlled by the Group, and that will probably gen-erate future economic benefits exceeding costs beyond one year, are recognized as intangible assets. Those direct costs include the software development employee costs and an appropriate portion of relevant overheads. Intangible assets are amortized using the straight-line method over their estimated useful lives, which is the lower of the legal duration and the economic useful life. Useful lives vary from 3 to 5 years for software, 5 to 30 years for patents, trademarks and similar rights and 4 to 16 years for development costs. All intangible assets in Lonza have finite useful lives, except for trademarks acquired in 2011 through the Arch business combi-nation and 2007 through the Cambrex business combination. The Group considers that these trademarks have an indefinite useful life as they are well established in the respective markets and have a history of strong performance. The Group intends and has the ability to maintain these trademarks for the foreseeable future.
Goodwill and Business Combinations Business combinations are accounted for using the acquisition method. The consideration transferred in a business combination is measured at fair valueat the date of acquisition and includes the cash paid plus the fair value at the date of exchange of assets, liabilities incurred or as-sumed and equity instruments issued by the Group. The fair value of the consideration transferred also includes contingent consider-ation arrangements at fair value. Directly attributable acquisition-related costs are expensed in the period the costs are incurred and the services are received and reported within administration and general overhead expenses. At the date of acquisition, the Group recognizes the identifiable assets acquired, the liabilities assumed and any non-controlling interest in the acquired business. The identifiable assets acquired and the liabilities assumed are initially recognized at fair value. Where the Group does not acquire 100 % ownership of the acquired business, non-controlling interests are recorded as the proportion of the fair value of the acquired net assets attributable to the non-controlling interest. Goodwill is recorded as the surplus of the consideration transferred over the Group’s interest in the fair value of the acquired net assets. Any goodwill and fair value adjustments are recorded as assets / liabilities of the acquired business in the functional currency of that business.
When the initial accounting for a business combination is in-complete at the end of a reporting period, provisional amounts are recognized. During the measurement period, the provisional amounts are retrospectively adjusted and additional assets and liabilities may be recognized to reflect new information obtained about the facts and circumstances that existed at the acquisi-tion date which, had they been known, would have affected the measurement of the amounts recognized at that date. The mea-surement period does not exceed 12 months from the date of acquisition. Goodwill is not amortized but is tested annually for impairment. Changes in ownership interests in subsidiaries are accounted for as equity transactions if they occur after control has already been obtained and if they do not result in a loss of control.
Goodwill may also arise upon investments in associates and joint ventures, being the surplus of the cost of investment over the Group’s share of the fair value of the net identifiable assets. Such goodwill is recorded within investments in associates and joint ventures.
FINANCIAL REPORT
Click Note

14 LONZA ANNUAL REPORT 2014
Inventories Inventories are reported at the lower of cost (pur-chase price or production cost) or market value (net realizable val-ue). In determining net realizable value, any costs of completion and selling costs are deducted from the realizable value. The cost of inventories is calculated using the weighted average method. Prorated production overheads are included in the valuation of inventories. Adjustments are made for inventories with a lower market value or which are slow moving. Unsalable inventory is fully written off. Costs include all expenditures related directly to specific projects and an allocation of fixed and variable over-heads incurred in the Group’s contract activities based on normal operating capacity.
Receivables Trade receivables are recognized at the original in-voice amount less allowances made for doubtful accounts. An allow-ance for doubtful accounts is recorded for the difference between the carrying value and the estimated recoverable amount where there is objective evidence that the Group will not be able to collect all amounts due. These estimates are based on specific indicators, such as the aging of customer balances, specific credit circumstanc-es and the Group’s historical experience, also taking into account economic conditions. Expenses for doubtful trade receivables are recognized in the consolidated income statement within cost of goods sold. Long-term accounts receivable are discounted to take into account the time value of money, where material.
Financial Assets Loans and advances and other financial assets are non-derivative financial assets with fixed or determinable pay-ments that are not quoted in an active market. They arise when the Group provides money, goods or services directly to a debtor with no intention of trading the receivable. They are classified as current with maturities not longer than 12 months and as non-current with maturities greater than 12 months after the balance sheet date. Loans and advances are carried at amortized costs us-ing the effective interest method. Realized and unrealized gains and losses are recorded in the income statement in the period in which they arise. The Group derecognizes a financial asset when the contractual rights to the cash flows from the asset expire, or it transfers the rights to receive the contractual cash flows in a transaction in which substantially all the risk and rewards of ownership of the financial asset are transferred. Any interest in such transferred financial that is created or retained by the Group is recognized as a separate asset or liability.
Cash and Cash Equivalents Cash and cash equivalents include cash in hand, in postal and bank accounts, as well as short-term deposits and highly liquid funds, that have an original maturity of less than three months.
Impairment Assets that are subject to amortization and depre-ciation are reviewed for impairment whenever events or changes in circumstances indicate that the carrying amount may not be recoverable. Goodwill and intangible assets with indefinite useful lives are tested for impairment annually, and whenever there is an indication that the assets may be impaired. An impairment loss is recognized for the amount by which the asset’s carrying amount exceeds its recoverable amount. The recoverable amount is the higher of an asset’s fair value less costs to sell and value in use. For the purposes of assessing impairment, assets are grouped at the lowest levels for which there are separately identifiable cash flows (cash-generating units).
Calculation of recoverable amount – In assessing value in use, the estimated future cash flows are discounted to their present value using a pre-tax discount rate that reflects current market assess-ments of the time value of money and the risks specific to the asset.
Reversal of impairment – An impairment loss is reversed if the subsequent increase in recoverable amount can be related objec-tively to an event occurring after the impairment loss was recog-nized. An impairment loss in respect of goodwill is not reversed. In respect of other assets, an impairment loss is reversed if there has been a change in the estimates used to determine the recover-able amount. An impairment loss is reversed only to the extent that the asset’s carrying amount does not exceed the carrying amount that would have been determined, net of depreciation or amortization, if no impairment loss had been recognized.
Deferred Taxes Tax expense is calculated using the balance-sheet liability method. Additional deferred taxes are provided wherever temporary differences exist between the tax base of an asset or liability and its carrying amount in the consolidated accounts for the year.
Deferred tax assets and liabilities are recognized for the future tax consequences attributable to differences between the financial statement carrying amounts of existing assets and liabilities and their respective tax bases and, for deferred tax assets, operating loss and tax credit carry-forwards.
FINANCIAL REPORT
Click Note

15 LONZA ANNUAL REPORT 2014
terest expense and other expenses related to defined-benefit plans are recognized in profit or loss. While the net interest expense is disclosed within financial expenses, the other expenses related to defined-benefit plans are allocated to the different functions of the operating activities. When the benefits of a plan are changed or when a plan is curtailed, the resulting change in benefit that related to past service or the gain or loss on curtailment is recog-nized immediately in profit or loss. The Group recognizes gains and losses on the settlement of a defined-benefit plan when the settlement occurs.
Termination Benefits Termination benefits result from either an entity’s decision to terminate the employment or an employee’s decision to accept an entity’s offer of benefits in exchange for termination of employment. The Group recognizes termination benefits at the earlier date of a) when the Group can no longer withdraw the offer of termination benefits and b) when the Group recognizes costs for a restructuring that is within the scope of IAS37 and involved the payment of termination benefits.
Provisions A provision is recognized in the balance sheet when (i) the Group has a legal or constructive obligation as a result of a past event, (ii) it is probable that an outflow of economic benefits will be required to settle the obligation and (iii) a reliable estimate of the amount of the obligation can be made. If the effect is mate-rial, provisions are determined by discounting the expected future cash flows at a pre-tax rate that reflects current market assessments of the time value of money and the risks specific to the liability.
A provision for restructuring is recognized when the Group has approved a detailed and formal restructuring plan, and the re-structuring has either commenced or has been announced pub-licly. Future operating costs are not provided for.
Provisions for environmental liabilities are made when there is a legal or constructive obligation for the Group that will result in an outflow of economic resources. Provisions are made for remedial work where there is an obligation to remedy environ-mental damage, as well as for containment work where required by environmental regulations.
Deferred tax assets and liabilities are measured using enacted or substantially enacted tax rates in the respective jurisdictions in which Lonza operates that are expected to apply to taxable income in the years in which those temporary differences are expected to be recovered or settled. In assessing the recoverability of deferred tax assets, management considers whether it is probable that some portion or all of the deferred tax assets will not be realized. For transactions and other events recognized in other comprehensive income or directly in equity, any related tax effect is recognized in other comprehensive income or in equity. Liabilities for income taxes, mainly withholding taxes, which could arise on the remit-tance of retained earnings, principally relating to subsidiaries, are only recognized where it is probable that such earnings will be remitted in the foreseeable future.
Employee Benefits Employee-benefit liabilities as stated in the consolidated balance sheet include obligations from defined-benefit pension plans, other post-employment benefits (medical plans) as well as other long-term employee-related liabilities, such as long-term vacation accounts.
Defined-Benefit Plans (Pension and Medical Plans) Most of Lonza’s subsidiaries operate their own pension plans. Generally, they are funded by employees’ and employers’ contributions. In addition, the Group operates three medical plans in the United States. The Group’s net obligation in respect of defined-benefit plans is calculated separately for each plan by estimating the amount of future benefit that employees have earned in the cur-rent and prior periods, discounting that amount and deducting the fair value of any plan assets. The calculation of defined-benefit obligations is performed annually by a qualified external actuary using the projected unit credit method. When the calculation results in a potential asset for the Group, the recognized asset is limited to the present value of economic benefits available in the form of any future refunds from the plan or reductions in future contributions to the plan. To calculate the present value of economic benefits, consideration is given to any applicable minimum funding requirements. Remeasurements of the defined-benefit liability, which comprise actuarial gains and losses and the return on plan assets (excluding interest) and the effect of the asset ceiling (if any, excluding interest), are recognized immediately in other comprehensive income.
The Group determines the net interest expense on the net defined-benefit liability for the period by applying the discount rate used to measure the defined-benefit obligation at the beginning of the annual period to the net defined-benefit liability, taking into ac-count any changes in the net defined-benefit liability during the period as a result of contributions and benefit payments. Net in-
FINANCIAL REPORT
Click Note
16 LONZA ANNUAL REPORT 2014
Debt Debt instruments are initially recorded at cost, which is the proceeds received net of transaction costs. They are subse-quently stated at amortized cost; any difference between the net proceeds and the redemption value is recognized in the income statement over the period of the debt instrument using the ef-fective interest method.
Share Capital Ordinary shares are classified as equity. Incremen-tal costs directly attributable to the issue of new shares or options are shown in equity as a deduction, net of tax, from the proceeds. Where any Group company purchases Lonza Group Ltd’s equity share capital (treasury shares), the consideration paid, including any directly attributable incremental costs (net of income taxes), is deducted from equity attributable to the Group’s equity holders until the shares are cancelled, reissued or disposed of.
Dividend Dividend distribution to Lonza’s shareholders is recog-nized as a liability in the Group’s financial statements in the period in which the dividends are approved by the Lonza shareholders.
Share-Based Compensation The Group operates various equity-settled, share-based compensation plan. The fair value of the employee services received in exchange for the grant of shares and other share-based compensations is recognized as an expense. The total amount to be expensed over the vesting period is determined by reference to the fair value of the shares granted. At each bal-ance sheet date, the entity revises its estimates of the number of shares that are expected to become exercisable. It recognizes the impact of the revision of original estimates, if any, in the income statement, and a corresponding adjustment to equity over the remaining vesting period.
Research and Development Research and development costs are generally charged against income as incurred. Development costs are only capitalized when the related products meet the recognition criteria of an internally generated intangible asset, which mainly require the technical feasibility of completing the intangible asset, the probability of future economic benefits, the reliable measurement of costs and the ability and intention of the Group to use or sell the intangible asset. Fixed assets (buildings, machinery, plant, equipment) used for research purposes are val-ued similarly to other fixed assets. Such assets are capitalized and depreciated over their estimated useful lives. Expenses for research and development include associated wages and salaries, material costs, depreciation on fixed assets, as well as overhead costs.
Other Operating Income and Other Operating Expenses Other operating income and other operating expenses include items not assignable to other functions of the consolidated income state-ment. They mainly include gains and losses from the disposal of intangible assets, property, plant and equipment and other non-current assets, income and expenses from the release and recognition of provisions, income and expense related to restruc-turing, gains and losses from currency-related operating derivative instruments, as well as operating exchange rate gains and losses.
Net Financing Costs Net financing costs comprise interest pay-able on borrowings calculated using the effective interest method, the interest expenses on the net defined-benefit liability, the fi-nance charge for finance leases, dividend income, foreign ex-change gains and losses arising on financial assets and liabilities, gains and losses on hedging instruments that are recognized in the income statement and gains / losses on sale of financial assets. Interest income / expense is recognized in the income statement as it accrues, taking into account the effective yield of the asset or liability or an applicable floating rate. Dividend income is recognized in the income statement on the date that the dividend is declared. Interest income and expense include the amortization of any discount or premium or other differences between the initial carrying amount of an interest-bearing instrument and its amount at maturity calculated on an effective interest rate basis.
FINANCIAL REPORT
Click Note

17 LONZA ANNUAL REPORT 2014
ACCOUNTING ESTIMATES AND JUDGMENTSKey assumptions and sources of estimation uncertainty
Use of Estimates The preparation of the financial statements and related disclosures in conformity with International Financial Reporting Standards requires management to make estimates and assumptions that affect the reported amounts of assets and liabilities. The disclosure of contingent assets and liabilities at the date of the financial statements and revenues and expenses during the period reported. Actual results could differ from those estimates. Estimates are used in impairment tests, accounting for allowances for doubtful receivables, inventory obsolescence, depreciation, employee benefits, taxes, restructuring provisions and contingencies. Estimates and assumptions are reviewed pe-riodically and the effects of revisions are reflected in the financial statements in the period they are determined to be necessary. The key assumptions about the future key sources of estimation uncertainty that entail a significant risk of causing a material adjustment to the carrying value of assets and liabilities within the next financial year are described below.
Impairment Test of Property, Plant and Equipment, Intangible Assets and Goodwill The Group has carrying values with regard to property, plant and equipment of CHF 2 466 million (2013: CHF 2 494 million), goodwill of CHF 1 130 million (2013: CHF 1 042 million) and intangible assets of CHF 877 million (2013: CHF 807 million) (see notes 4 and 5). The intangible assets include trademarks acquired through business combina-tions with a carrying value of CHF 386 million (2013: CHF 350 million), which have an indefinite useful life and are not systematically amortized. Goodwill and intangible assets with indefinite useful lives are reviewed annually for impairment. To assess if any impairment exists, estimates are made of the future cash flows expected to result from the use of the asset and its possible disposal. Actual outcomes could vary significantly from such estimates of discounted future cash flows. Factors such as changes in the planned use of buildings, machinery or equipment, or closure of facilities, the presence or absence of competition, technical obsolescence or lower-than-anticipated sales for prod-ucts with capitalized rights could result in shortened useful lives or impairment. The impairment analysis as explained in note 4 is most sensitive to the discount rate used for the discounted cash flow model, as well as the expected future cash-inflows and the growth rate used for calculation purposes. The key assumptions used to determine the recoverable amount for the different cash-generating units are further explained in note 4.
Pensions Many of the Group’s employees participate in post-employment plans. The calculations of the recognized assets and liabilities from such plans are based upon statistical and actuarial calculations. In particular, the present value of the defined-benefit obligation is influenced by assumptions on discount rates used to arrive at the present value of future pension liabilities and assumptions on future increases in salaries and benefits. Further-more, the Group’s independent external actuaries use statistically based assumptions, covering areas such as future withdrawals of participants from the plan and estimates of life expectancy. At 31 December 2014, the present value of the Group’s defined-benefit obligation was CHF 3 033 million (2013: CHF 2 497 million). The plan assets at fair value amounted to CHF 2 359 million (2013: CHF 2 175 million), resulting, compared with the present value of the pension obligation, in a funded status deficit of CHF 674 million (2013: CHF 322 million) (see note 22). The actuarial assumptions used may differ materially from actual results due to changes in market and economic conditions, higher or lower withdrawal rates or longer or shorter lifespans of participants and other changes in the factors being assessed. These differences could affect the fair value of assets or liabilities recognized in the balance sheet in future periods.
Environmental Provisions Lonza is exposed to environmental liabilities and risks relating to its operations, principally in re-spect of provisions for remediation costs, which at 31 December 2014 amounted to CHF 49 million (2013: CHF 48 million), as disclosed in note 12. Provisions for non-recurring remediation costs are made when there is a legal or constructive obligation and the cost can be reliably estimated. It is difficult to estimate any future action required by Lonza to correct the effects on the environment of prior disposal or release of chemical substances by Lonza or other parties, and the associated costs, pursuant to environmental laws and regulations. The material components of the environmental provisions consist of costs to clean and refur-bish contaminated sites and to treat and contain contamination at sites. The Group’s future remediation expenses are affected by a number of uncertainties that include, but are not limited to, the method and extent of remediation and the percentage of material attributable to Lonza at the remediation sites, rela-tive to that attributable to other parties. The Group permanently monitors the various sites identified as at risk for environmental exposures. Lonza believes that its provisions are adequate, based upon currently available information; however, given the inher-ent difficulties in estimating liabilities in this area, there is no guarantee that additional costs will not be incurred beyond the amounts provided. Due to the uncertainty both of the amount and timing of future expenses, the provisions provided for envi-ronmental remediation costs could be affected in future periods.
FINANCIAL REPORT
Click Note

18 LONZA ANNUAL REPORT 2014
Income Taxes At 31 December 2014, deferred tax assets of CHF 47 million (2013: CHF 100 million), current tax receivables of CHF 7 million (2013: CHF 24 million), deferred tax liabilities ofCHF 256 million (2013: CHF 393 million) and current tax pay-ables of CHF 77 million (2013: CHF 86 million) are included in the consolidated balance sheet. Significant estimates are required in determining the current and deferred assets and liabilities for income taxes. Some of these estimates are based on interpretations of existing tax laws or regulations. Management believes that the estimates are reasonable and that the recognized liabilities for income tax-related uncertainties are adequate. Various internal and external factors may have favorable or unfavorable effects on the income tax assets and liabilities. These factors include, but are not limited to, changes in tax laws, regulations and / or rates, changing interpretations of existing tax laws or regulations and changes in overall levels of pre-tax earnings. Such changes that arise could affect the assets and liabilities recognized in the bal-ance sheet in future periods.
Critical Accounting Judgments in Applying the Group’s Accounting Policies In the process of applying the Group’s ac-counting policies, management has made the following judgments that have the most significant effect on the amounts recognized in the financial statements (apart from those involving estimations, which are dealt with above).
Revenue Recognition The Group has recognized revenue for sales of goods during 2014 to customers who have the right to rescind the sale if the goods do not meet the agreed quality. The Group believes that, based on past experience with similar trans-actions, the quality delivered will be accepted. Therefore, it is ap-propriate to recognize revenue on these transactions during 2014. Moreover, the Group has various contractual agreements which include upfront and milestone payments over a period of several years. Revenue is recognized only when, according to manage-ment’s judgment, risks and rewards have been transferred to the customer and no future performance obligation exists. For certain transactions, recognition of revenue is based on the performance of the conditions agreed in particular contracts, the verification of which requires evaluation and judgments by management.
Intangible Assets The Group considers the trademarks acquired in 2011 through the Arch business combination and in 2007 through the Cambrex business combination to have an indefinite useful life as they are well established in the respective markets and have a history of strong performance. The Group intends and has the ability to maintain these trademarks for the foreseeable future. The assumption of an indefinite useful life is reassessed whenever there is an indication that a trademark may have a defi-nite useful life. In addition, intangible assets with indefinite useful lives are tested for impairment on an annual basis (see note 4).
FINANCIAL REPORT
Click Note

19 LONZA ANNUAL REPORT 2014
2 OPERATING SEGMENTS
2.1 GENERAL INFORMATION
According to the requirements of IFRS 8 “Operating Segments”, Lonza identi-fied the following two market-focused segments: Pharma&Biotech and Specialty Ingredients. These segments are described as follows:
Pharma&Biotech In the Pharma&Biotech segment, Lonza is one of the world’s leading suppliers of active pharmaceutical ingredients (APIs) and biopharmaceu-ticals, as well as research and testing products and services. Lonza manufactures products that are at the forefront of powerful new treatments for cancer, diabetes, immune system disorders, heart conditions, Alzheimer’s and Parkinson’s diseases, inflammation and many other medical diseases and conditions. Lonza customers cover a wide spectrum of clients, from the world’s largest pharmaceutical and biotechnology companies to medical research and testing organizations and small start-ups pioneering breakthrough medical treatments.
Specialty Ingredients In the Specialty Ingredients segment, Lonza is an innova-tive supplier of solutions that promote health, wellness, beauty, nutrition, hygiene and materials protection. Lonza is the world’s largest supplier of microbial control solutions – including disinfectants and sanitizers that protect us from dangerous microbes in hospitals, homes, cafeterias, cruise ships and schools. The Nutrition business is the globe’s largest producer of vitamin B compounds (niacin and nia-cinamide), and it also supplies other specialized nutritional ingredients used in products from human energy drinks to animal feeds. Lonza also offers custom ag-ricultural manufacturing services designed to improve crop yields and food quality. In Personal Care, Lonza is the world’s largest supplier of actives for antidandruff shampoos and a leading provider of natural and organic cosmetic ingredients.
Corporate Corporate includes mainly corporate functions such as finance and accounting, legal, communication, information technology and human resources.
2.2 INFORMATION ABOUT REPORTABLE SEGMENT PROFIT OR LOSS, ASSETS AND LIABILITIES INCLUDING RECONCILIATIONS
In the following table, revenues and profit or loss are disclosed by the two report-able segments and corporate, which includes the costs of the corporate functions, including eliminations, and adds up to the Group total. Lonza does not allocate financing costs, income and expenses from associates and joint ventures as well as taxes to the reportable segments. The information disclosed by operating segments is the same as reported monthly to the Group’s Executive Committee.
FINANCIAL REPORT
Click Note

20 LONZA ANNUAL REPORT 2014
Operating segments (continued)
Year Ended 31 December 2014
million CHF Specialty Ingredients
Pharma& Biotech
Total operating segments
Corporate / Eliminations
Group total
Sales third-party 2 154 1 446 3 600 40 3 640Intersegment sales1 68 51 119 (119) 0Total sales 2 222 1 497 3 719 (79) 3 640Result from operating activities (EBIT) 242 224 466 (43) 423
– Percentage return on sales % 11.2 15.5 12.9 n.a. 11.6
Financial income 150Financial expenses (210)Net financing costs (60)Share of loss of associates / joint ventures (84)Profit before income taxes 279Income taxes (42)Profit for the period 237
Included in result from operating activities (EBIT):– Other operating income 2 12 12 24 13 37– Other operating expenses 2 (15) (12) (27) (21) (48)– Research and development (50) (145) (195) 0 (195)– Depreciation and amortization (109) (151) (260) (39) (299)– Impairment, net of reversal of impairment (4) (11) (15) 0 (15)– Restructuring (expenses) / income (5) 0 (5) (1) (6)– Environmental (expenses) / income 1 0 1 (6) (5)
Core result from operating activities (EBIT) 272 245 517 (42) 475
Total assets 3 555 3 814 7 369 (928) 6 441Total liabilities 143 2 103 2 246 2 065 4 311Total equity 3 412 1 711 5 123 (2 993) 2 130Net financial liabilities (685) 816 131 2 963 3 094Net capital invested 3 2 727 2 527 5 254 (30) 5 224
Return on net capital invested (RONOA) 4 % 12.5 10.7 11.6 n.a. 10.3
Included in total assets:Total property, plant and equipment 948 1 499 2 447 19 2 466
– Additions to property, plant and equipment 76 69 145 13 158Total goodwill and intangible assets 1 382 590 1 972 35 2 007
– Additions to intangible assets 3 6 9 13 22Investments in associates / joint ventures 2 3 5 12 17
– Additions to investments in associates / joint ventures 0 3 3 0 3
Headcount 3 225 4 831 8 056 1 753 9 809Average headcount 3 356 4 904 8 260 1 612 9 872
Intersegment sales were based on prevailing market prices. Excluding restructuring related income / expenses Net capital invested comprises all operating assets and goodwill less operating liabilities. Calculated at historical monthly average rates based on net capital invested excluding goodwill.
1
2
3
4
FINANCIAL REPORT
Click Note

21 LONZA ANNUAL REPORT 2014
Year Ended 31 December 2013
million CHF Specialty Ingredients
Pharma& Biotech
Total operating segments
Corporate / Eliminations
Group total
Sales third-party1 2 108 1 426 3 534 50 3 584Intersegment sales2 44 35 79 (79) 0Total sales1 2 152 1 461 3 613 (29) 3 584Result from operating activities (EBIT) 223 60 283 (30) 253
– Percentage return on sales % 10.6 4.2 8.0 n.a. 7.1
Financial income 44Financial expenses (163)Net financing costs (119)Share of loss of associates / joint ventures (29)Profit before income taxes 105Income taxes (18)Profit for the period 87
Included in result from operating activities (EBIT):– Other operating income3 25 15 40 3 43– Other operating expenses3 (41) (10) (51) (3) (54)– Research and development (58) (157) (215) 0 (215)– Depreciation and amortization1 (109) (163) (272) (37) (309)– Impairment (6) (79) (85) 0 (85)– Restructuring (expenses) / income (6) (51) (57) (5) (62)– Environmental (expenses) / income (6) 0 (6) 0 (6)
Core result from operating activities (EBIT) 254 207 461 (25) 436
Total assets1 3 058 3 510 6 568 (195) 6 373Total liabilities 1 28 2 018 2 046 2 201 4 247Total equity1 3 030 1 492 4 522 (2 396) 2 126Net financial liabilities1 (535) 875 340 2 492 2 832Net capital invested 1, 4 2 495 2 367 4 862 96 4 958
Return on net capital invested (RONOA)5 % 10.1 2.8 6.5 n.a. 5.9
Included in total assets:Total property, plant and equipment 1 049 1 426 2 475 19 2 494
– Additions to property, plant and equipment 126 73 199 0 199Total goodwill and intangible assets 1 270 570 1 840 9 1 849
– Additions to intangible assets 6 8 14 3 17– Additions to intangible assets from acquisitions 0 4 4 0 4
Investments in associates / joint ventures 2 1 3 10 13
Headcount1 3 487 4 978 8 465 1 470 9 935Average headcount1 3 632 5 153 8 785 1 576 10 361
Intersegment sales were based on prevailing market prices. Excluding restructuring related income / expenses. Net capital invested comprises all operating assets and goodwill less operating liabilities. Calculated at historical monthly average rates based on net capital invested excluding goodwill.
2
3
4
5
Restated to reflect transfer of the Visp shared infrastructure from Speciality Ingredients to Corporate. In addition, non-operating assets and liabilities, such as current / deferred tax balances and debt, were transferred from Speciality Ingredients to Corporate, as a result of refinements to the internal reporting structure.
1
FINANCIAL REPORT
Click Note

22 LONZA ANNUAL REPORT 2014
2.3 MEASUREMENT OF OPERATING SEGMENT PROFIT OR LOSS
The accounting principles applied to the operating segments are based on the same accounting principles used for the consolidated financial statements. Lonza evaluates the performance of its operating segments on the basis of the result from operating activities (EBIT) as well as the Core result from operating activities. Intersegment sales and transfers are based on prevailing market prices.
2.4 GEOGRAPHICAL INFORMATION
Year Ended 31 December 2014
million CHF Revenue from external customers (Sales)
Non-current assets
Property, plant and equipment
Intangible assets
Goodwill Other non- current assets
Total
Switzerland 371 917 35 15 2 969Spain 19 133 0 0 0 133Belgium 38 68 0 85 0 153United Kingdom 141 96 72 18 0 186Germany 252 6 36 70 0 112Netherlands 64 0 0 0 0 0Italy 41 0 0 11 0 11Czech Republic 5 74 0 0 0 74Sweden 46 0 0 0 0 0France 132 2 5 11 0 18Rest of Europe 166 1 1 11 0 13Europe 1 275 1 297 149 221 2 1 669
United States 1 549 578 626 900 10 2 114Canada 57 0 0 0 0 0Rest of North America 33 0 0 0 0 0North America 1 639 578 626 900 10 2 114
Brazil 102 10 13 0 4 27Rest of Latin America 30 0 1 0 0 1Latin America 132 10 14 0 4 28
Singapore 46 291 55 0 3 349China 150 276 12 5 0 293Japan 86 1 2 0 0 3India 78 5 0 2 0 7Rest of Asia 109 0 1 0 1 2Asia 469 573 70 7 4 654
South Africa 55 5 5 0 0 10
Australia 30 1 6 2 0 9
Other countries 40 2 7 0 1 10
Total 3 640 2 466 877 1 130 21 4 494
FINANCIAL REPORT
Click Note

23 LONZA ANNUAL REPORT 2014
Year Ended 31 December 2013
million CHF Revenue from external customers (Sales)
Non-current assets
Property, plant and equipment
Intangible assets
Goodwill Other non- current assets
Total
Switzerland 414 952 41 15 2 1 010Spain 19 140 0 0 0 140Belgium 30 72 0 87 0 159United Kingdom 150 95 67 18 0 180Germany 240 9 40 71 0 120Netherlands 62 0 0 0 0 0Italy 52 0 0 11 0 11Czech Republic 3 93 0 0 0 93Sweden 29 0 0 0 0 0France 149 2 6 11 0 19Rest of Europe 138 1 2 12 0 15Europe 1 286 1 364 156 225 2 1 747
United States 1 507 556 559 810 10 1 935Canada 57 0 0 0 0 0Rest of North America 47 0 0 0 0 0North America 1 611 556 559 810 10 1 935
Brazil 101 10 14 0 3 27Rest of Latin America 32 0 1 0 0 1Latin America 133 10 15 0 3 28
Singapore 44 277 52 0 3 332China 137 274 4 4 8 290Japan 81 1 2 0 0 3India 72 6 0 2 0 8Rest of Asia 103 0 0 0 1 1Asia 437 558 58 6 12 634
South Africa 60 4 5 0 0 9
Australia 28 2 7 1 0 10
Other countries 29 0 7 0 1 8
Total 3 584 2 494 807 1 042 28 4 371
2.5 INFORMATION ABOUT MAJOR CUSTOMERS
In 2014 Lonza’s largest customer accounted for 5.9 % and the second, third, fourth and fifth largest customers for 3.4 %, 2.9 %, 2.9 % and 2.8 % in relation to total Group sales, respectively. No other customer accounted for 2.7 % or more of Lonza’s total sales. The first and fourth largest customers related to the Specialty Ingredients segment, while the second, third and fifth largest customers related to the Pharma&Biotech segment.
FINANCIAL REPORT
Click Note

24 LONZA ANNUAL REPORT 2014
In 2013 Lonza’s largest customer accounted for 5.7 % and the second, third, fourth and fifth largest customers for 4.0 %, 2.8 %, 2.7 % and 2.4 % in relation to total Group sales, respectively. No other customer accounted for 2.3 % or more of Lonza’s total sales. The first, third and fourth largest customers related to the Specialty Ingredients segment, while the second and fifth largest customers related to the Pharma&Biotech segment.
3 RESTRUCTURING
Year Ended 31 December 2014
million CHF 1Specialty Ingredients
2Pharma& Biotech
Corporate Total
Impairment of property, plant and equipment 4 11 0 15 Restructuring charges 5 0 1 6 Total 9 11 1 21
Year Ended 31 December 2013
million CHF 3Specialty Ingredients
4Pharma& Biotech
Corporate Total
Impairment of property, plant and equipment 6 79 0 85 Restructuring charges 6 51 5 62 Total 12 130 5 147
Restructuring measures related to the plant in Kouřim (CZ) led to an impairment of property, plant and equipment of CHF 11 million and restructuring costs of CHF 1 million. The impairment loss is classified within cost of goods sold.
In addition, Lonza decided to transfer certain activities from Nanjing (CN) to the plant in Nansha (CN). Therefore, Lonza recognized an impairment of CHF 3 million of the Nanjing-related assets, which is classified within cost of goods sold.
In 2013 Lonza announced that it would concentrate and consolidate its future Microbial Biologics assets and activities at the Visp (CH) site. As a result, the Microbial Biologics plant in Hopkinton, MA (USA) was closed and Hopkinton-related property, plant and equipment of CHF 79 million was impaired. In addition, Lonza recognized restructuring costs related to the phasedown of the Hopkinton site of CHF 46 million. The impairment loss as well as CHF 44 million of the restructuring costs were disclosed within cost of goods sold while CHF 1 million was included within administration and general overheads and CHF 1 million in research and development. In 2014 the new niacin plant in Nansha (CN) commenced operations. The for-mer niacin business at the Guangzhou (CN) site was transferred to Nansha, and therefore certain production equipment in Guangzhou was impaired by CHF 6 million in 2013 (classified in cost of goods sold).
Restructuring charges include restructuring activities related to the Chinese sites and other restructuring measures. The impairment of assets is related to the Chinese sites. The impairment of assets is related to the Kourim (CZ) site (CHF 11 million), the Chinese sites (CHF 1 million) and the Hopkinton (US) site (reversal impairment of CHF 1 million).
1
2
Restructuring charges include the closure of the Swords site and other restructuring measures. Restructuring charges inlcude phasedown of the Hopkinton, MA (USA) site, the closure of the St. Beauzire (FR) site and other restructuring measures.
3
4
FINANCIAL REPORT
Click Note

25 LONZA ANNUAL REPORT 2014
4 INTANGIBLE ASSETS AND GOODWILL
4.1 COST AND ACCUMULATED AMORTIZATION AND IMPAIRMENT
2014
million CHF Goodwill Arch Chemicals Inc. / Cambrex
trademarks
Patents, trademarks, client relationship
Computer software
Development cost
Construction in progress
Total
CostAt 1 January 1 049 350 541 94 91 0 2 125Additions 0 0 10 6 0 6 22Disposals 0 0 (4) (2) (3) 0 (9)Reclassification from property, plant and equipment (note 5) 0 0 0 16 0 0 16Currency translation differences 88 36 46 4 10 0 184At 31 December 1 137 386 593 118 98 6 2 338
Accumulated amortization and impairmentAt 1 January (7) 0 (163) (80) (26) 0 (276)Amortization 0 0 (35) (7) (7) 0 (49)Disposals 0 0 4 2 3 0 9Currency translation differences 0 0 (11) (1) (3) 0 (15)At 31 December (7) 0 (205) (86) (33) 0 (331)Net carrying amount 31 December 1 130 386 388 32 65 6 2 007
2013
million CHF Goodwill Arch Chemicals Inc. / Cambrex
trademarks
Patents, trademarks, client relationship
Computer software
Development cost
Construction in progress
Total
CostAt 1 January 1 063 359 553 88 91 3 2 157Additions 0 0 6 7 4 0 17Disposals 0 0 (3) 0 (4) 0 (7)Business combinations 4 0 0 0 0 0 4Disposal of subsidiary 0 0 (1) 0 0 0 (1)Currency translation differences (18) (9) (14) (1) (3) 0 (45)At 31 December 1 049 350 541 94 91 0 2 125
Accumulated amortization and impairmentAt 1 January (7) 0 (134) (70) (17) 0 (228)Amortization 0 0 (33) (11) (11) 0 (55)Disposals 0 0 1 0 1 0 2Currency translation differences 0 0 3 1 1 0 5At 31 December (7) 0 (163) (80) (26) 0 (276)Net carrying amount 31 December 1 042 350 378 14 65 0 1 849
Intangible assets include software purchased from third parties, related software implementation costs, as well as patents, trademarks, client relationship acquired and development costs. Their amortization is included in the line item “Adminis-tration and general overheads” of the consolidated income statement.
FINANCIAL REPORT
Click Note

26 LONZA ANNUAL REPORT 2014
Trademarks acquired through the Arch Chemicals Inc. (2011) and the Cambrex (2007) acquistions are considered to have indefinite useful lives. As a result, these intangible assets with a carrying amount of CHF 386 million as of 31 December 2014 (2013: CHF 350 million) are not systematically amortized.
Development costs as of 31 December 2014 include internally generated intangible assets of CHF 2 million (2013: CHF 3 million) as well as technology acquired with the Arch Chemical Inc. acquisition of CHF 59 million (2013: CHF 58 million) and the Cambrex aquisition of CHF 4 million (2013: CHF 4 million).
In 2013 the Group paid a contingent purchase price consideration of CHF 4 mil-lion, which was capitalized as goodwill. The obligation to pay this consideration was acquired with the Cambrex business combination in 2007.
4.2 IMPAIRMENT TESTS FOR CASH-GENERATING UNITS CONTAINING GOODWILL AND INTANGIBLE ASSETS WITH INDEFINITE USEFUL LIVES
The Group has identified the following cash-generating units:
Specialty Ingredients The segment’s business units are the cash-generating units used for the impairment testing of goodwill and intangible assets with indefinite useful lives.
Pharma&Biotech The different technologies (Mammalian, Chemical etc.) applied within the segment are the cash-generating units used for the impairment testing of goodwill and intangibles assets with indefinite useful lives.
The following cash-generating units maintain carrying amounts of goodwill as presented below (at year-end exchange rates):
million CHF 2014 2013
Specialty Ingredients (representing a group of cash-generating units) 722 650Consumer Care 4 4Bioscience Solutions / Cell Therapy / Viral Therapeutics (representing a group of cash-generating units) 344 328Mammalian (custom manufacturing and related development services) 26 25Chemical (custom manufacturing and related development services) 34 35Total carrying amounts of goodwill 1 130 1 042
The following cash-generating units maintain carrying amounts of intangible assets with indefinite useful lives as presented below (at year-end exchange rates):
million CHF 2014 2013
Specialty Ingredients (representing a group of cash-generating units) 359 326Bioscience Solutions / Cell Therapy / Viral Therapeutics (representing a group of cash-generating units) 27 24Total carrying amounts of intangible assets with indefinite useful lives 386 350
FINANCIAL REPORT
Click Note

27 LONZA ANNUAL REPORT 2014
The recoverable amount of the above cash-generating units is based on the value-in-use calculation. These cash flow projections for 2015 to 2019 are based on the business strategy review and exclude any future cash inflows and outflows ex-pected to arise from growth potential of future capital expenditure. The cashflow projections beyond the five-year period, as stated in the respective paragraphs of the cash-generating units, are based on the concept of perpetual growth rates, which do not necessarily reflect the Group’s strategic objective targets for the future growth potential of the underlying businesses. The key assumptions and the approach to determining the recovery value of the cash-generating units are based on the following:
The Specialty Ingredients business includes the cash-generating units of Water Treatment, Agro Ingredients, Consumer Care, Industrial Solutions and Wood Protection. These cash-generating units are the combination of the activities ac-quired through the Arch Chemicals acquisition in 2011 as well as the former Life Science Ingredients activities from Lonza. The cashflow projections for 2015–2019 are based on a 4.1 % (2013: 4.9 %) average sales growth. The EBIT margin is as-sumed to increase over the projection period as a result of the continuing benefits from synergies of the Arch acquisition. The cash flow projections beyond the five-year period are based on a 1 % growth rate (2013: 1 %). A pre-tax discount rate of 10.1 % (2013: 10.9 %) has been used in discounting the projected cash flows. Management believes that any reasonably possible change in the key assumptions on which the recoverable amount is based would not cause the carrying amount to exceed its recoverable amount.
The Consumer Care business includes Lonza’s portfolio for human and animal nutrition, personal care as well as hygiene & preservation products. The cashflow projections for 2015–2019 are based on a 4.6 % (2013: 4.8 %) average sales growth. The EBIT margin is assumed to increase over the projection period as a result of the continuing benefits from synergies of the Arch acquisition. The cash flow projections beyond the five-year period are based on a 1 % growth rate (2013: 1 %). A pre-tax discount rate of 9.2 % (2013: 9.6 %) has been used in discounting the projected cash flows. Management believes that any reasonably possible change in the key assumptions on which the recoverable amount is based would not cause the carrying amount to exceed its recoverable amount.
The Bioscience Solutions / Cell Therapy / Viral Therapeutics businesses include the Cambrex Corporation, acquired in 2007, the amaxa business, acquired in 2008 as well as MODA Technology Partners and Vivante GMP Solutions, acquired in May and August 2010, respectively. The cash flow projections for 2015–2019 are based on a 7.9 % (2013: 7.3 %) average sales growth with growing EBIT margins, as the cash-generating units are operating in growing markets and economic re-covery is continuing at a low level. The cash flow projections beyond the five-year period are extrapolated using a 0.5 % growth rate (2013: 0.5 %). A pre-tax discount rate of 8.8 % (2013: 9.9 %) has been used in discounting the projected cash flows. Management believes that any reasonably possible change in the key assumptions on which the recoverable amount is based would not cause the carrying amount to exceed its recoverable amount.
FINANCIAL REPORT
Click Note

28 LONZA ANNUAL REPORT 2014
The Mammalian business is primarily located in the United States, Great Britain and Singapore. Forecasted sales are based on existing contracts and planned uti-lization of equipment based on customer demand over the five-year period. Prices are as per contracts in effect realized and are assumed to stay at current levels. The cashflow projections for 2015–2019 are based on a 6.0 % (2013: 6.3 %) average sales growth, mainly as a result of the increased capacity utilization of the Singa-pore plant. The cash flow projections beyond the five-year period are based on a zero growth rate. A pre-tax discount rate of 8.3 % (2013: 9.7 %) has been used in discounting the projected cash flows. Management believes that any reasonably possible change in the key assumptions on which the recoverable amount is based would not cause the carrying amount to exceed its recoverable amount.
The Chemical business represents primarily the Conjugates, Small Molecules and Peptides custom manufacturing activities. Sales are projected on the basis of the current product portfolio, with production costs varying in line with sales increase. From 2015 until 2019, sales are assumed to grow on average by 2.7 % (2013: 2.1 %) p.a. The cash flow projections beyond the five-year period are extrapolated using a zero growth rate. The cash flows are discounted at a pre-tax discount rate of 7.6 % (2013: 8.4 %). Management believes that any reasonably possible change in the key assumptions on which the recoverable amount is based would not cause the carrying amount to exceed its recoverable amount.
5 PROPERTY, PLANT AND EQUIPMENT
2014
million CHF Land Buildings and structures
Production facilities
Construction in progress
Total
CostAt 1 January 50 1 597 3 592 329 5 568Additions 0 11 49 98 158Disposals (1) (10) (83) (1) (95)Reclassification to intangible assets (note 4) 0 0 0 (16) (16)Transfers / reclassification 0 49 213 (262) 0Currency translation differences 0 46 127 13 186At 31 December 49 1 693 3 898 161 5 801
Accumulated depreciation and impairmentAt 1 January (2) (724) (2 348) 0 (3 074)Depreciation charge (1) (58) (191) 0 (250)Disposals 0 9 76 0 85Impairment losses (note 3) 0 (6) (10) 0 (16)Reversal of impairment losses (note 3) 0 0 1 0 1Currency translation differences 1 (9) (73) 0 (81)At 31 December (2) (788) (2 545) 0 (3 335)Net carrying amount 31 December 47 905 1 353 161 2 466
Insurance value 31 December 0 1 500 4 628 0 6 128
FINANCIAL REPORT
Click Note

29 LONZA ANNUAL REPORT 2014
2013
million CHF Land Buildings and structures
Production facilities
Construction in progress
Total
CostAt 1 January 51 1 542 3 525 378 5 496Additions 0 16 38 145 199Disposals (1) (7) (55) (2) (65)Transfers / reclassification 0 61 129 (190) 0Currency translation differences 0 (15) (45) (2) (62)At 31 December 50 1 597 3 592 329 5 568
Accumulated depreciation and impairmentAt 1 January (1) (674) (2 137) 0 (2 812)Depreciation charge (1) (54) (199) 0 (254)Disposals 0 3 45 0 48Impairment losses (note 3) 0 (3) (82) 0 (85)Currency translation differences 0 4 25 0 29At 31 December (2) (724) (2 348) 0 (3 074)Net carrying amount 31 December 48 873 1 244 329 2 494
Insurance value 31 December 0 1 392 4 472 0 5 864
Commitments for capital expenditure in property, plant and equipment amounted to CHF 42 million at year-end 2014 (2013: CHF 20 million), mainly related to capital expenditures for the Swiss based operations. The carrying amount of property, plant and equipment under finance lease contracts at year-end 2014 amounted to CHF 5 million (2013: CHF 5 million). Depreciation relating to property, plant and equipment under finance leases amounted to CHF 0.2 million (2013: CHF 0.3 million). No assets were pledged for security of own liabilities in 2014 and 2013. The Group’s obligation under finance leases is secured by the lessors’ title to the leased assets.
Leases
1. Lessee
Finance Lease Liabilities – Minimum Lease Payments
million CHF 2014 2013
Not later than 1 year 0 0 Later than 1 year and not later than 5 years 2 2 Later than 5 years 8 8 Total future minimum finance lease payments 10 10 Future finance charges on finance lease payments (5) (5) Present value of minimum finance lease payments 5 5
Present Value of Finance Lease Liabilities
million CHF 2014 2013
Not later than 1 year 0 0 Later than 1 year and not later than 5 years 1 1 Later than 5 years 4 4 Present value of minimum finance lease payments 5 5
FINANCIAL REPORT
Click Note

30 LONZA ANNUAL REPORT 2014
Operating Lease Liabilities – Minimum Lease Payments
million CHF 2014 2013
Not later than 1 year 13 14 Later than 1 year and not later than 5 years 38 42 Later than 5 years 44 45 Total future minimum operating lease payments 95 101
Lonza leases a number of vehicles, buildings, warehouses, factory and office facili-ties under operating leases. These leases run for periods between one and 22 years, all with an option to renew the lease after that date. None of the leases include contingent rentals.
During the year ended 31 December 2014, CHF 14 million (2013: CHF 16 million) was recognized as an expense in the consolidated income statement in respect to operating leases.
The land and building elements of a lease of land and buildings were considered separately for the purpose of lease classification as outlined in IAS 17.
2. LessorThere is an operating lease for which Lonza acts as lessor. This lease falls within the scope of IAS 17 and IFRIC 4 guidance. It consists primarily of a biophar-maceutical manufacturing facility in Visp. The future minimum lease payments under non-cancelable operating leases are zero, because the lease payments are pre-financed by the customer.
6 INVESTMENTS IN ASSOCIATES AND JOINT VENTURES
The following table summarizes the carrying amounts of interests in joint ventures and associates, which are accounted for using the equity method.
Balance Sheet Value
million CHF 2014 2013
Interests in joint ventures 4 2 Interests in associates 13 11 Total 17 13
Net Income Statement Effect
million CHF 2014 2013
Share of loss of joint ventures (86) (31)Share of profit of associates 2 2 Total (84) (29)
FINANCIAL REPORT
Click Note

31 LONZA ANNUAL REPORT 2014
6.1 JOINT VENTURES
Lonza holds a 50 % stake in TL Biopharmaceutical Ltd, as well as in two other individually immaterial companies.
TL Biopharmaceutical Ltd
In May 2009 the biotechnology company TL Biopharmaceutical Ltd, a joint venture between Lonza and Teva, was established to develop, manufacture and market a portfolio of biosimilars. In July 2013 Teva and Lonza announced that, following a strategic review of the Teva-Lonza joint venture, the companies had decided to discontinue their collaboration.
In October 2014 the decision was made to write-off entirely the value of Lonza’s interest in the Teva joint venture, which resulted in a reduction in value of CHF 83 million. The write-off is disclosed as share of loss from associates / joint ventures. Lonza’s share of the loss of TL Biopharmaceutical Ltd amounts to CHF 85 million for 2014 (2013: CHF 30 million) and includes the transfer of currency translation effects on the loan of CHF 2 million from other comprehensive income to the income statement.
The following table summarizes the financial information of TL Biopharmaceutical Ltd:
million CHF 2014 2013
Percentage of ownership % 50 50
Current assets 0 0Non-current assets 0 143Current liabilities (including current debt – CHF 0 million; 2013: CHF 2 million) 9 13Non-current liabilities (including non-current debt – CHF 299 million; 2013: CHF 257 million) 299 257Net assets (100 %) (308) (127)
Group’s share of net assets (50 %) (154) (63)Carrying amount of interest in TL Biopharmaceutical Ltd 0 0
Revenues 0 0Depreciation and amortization (159) (42)Interest expense (5) (5)Income tax expense 0 0Profit and total comprehensive income (100 %) (167) (60)
Group’s share of profit and total comprehensive income (50 %) (83) (30)
A review of the carrying amount of capitalized development costs in October 2014 led to the decision to write-down the asset value entirely, resulting in a write-off of CHF 159 million, for which Lonza recognized its proportional share as mentioned above.
FINANCIAL REPORT
Click Note
32 LONZA ANNUAL REPORT 2014
As of 31 December 2014 Lonza financed the Teva-Lonza joint venture with a loan of CHF 149 million (2013: CHF 129 million) nominal value, of which CHF 149 million (2013: CHF 111 million) is subordinated. The carrying amount of the loan is CHF 0 as of 31 December 2014 (2013: CHF 67 million).
The sales of goods and services from Lonza to TL Biopharmaceutical Ltd in 2014 amounted to CHF 3 million (2013: CHF 11 million).
Other Joint Ventures
The following table analyzes, in aggregate, the carrying amount and share of profit and other comprehensive income of the two joint ventures that are individually immaterial:
million CHF 2014 2013
Carrying amount of interests in other joint ventures 4 2 Share of loss (1) (1)Share of other comprehensive income 0 0
In 2014 the Group received dividends of CHF 0 million (2013: CHF 1 million) from these joint ventures.
6.2 ASSOCIATES
The Group has interests in two individually immaterial associates. The following table analyzes, in aggregate, the carrying amount and share of profit and other comprehensive income of these associates:
million CHF 2014 2013
Carrying amount of interests in associates 13 11Share of profit 2 2Share of other comprehensive income 0 0
In 2014 the Group received dividends of CHF 2 million (2013: CHF 1 million) from associates.
FINANCIAL REPORT
Click Note

33 LONZA ANNUAL REPORT 2014
7 INVENTORIES
million CHF 2014 2013
Inventories 988 823 Value adjustments (90) (76)Total 898 747
million CHF % 2014 % 2013
Raw materials 22 198 25 187Work in progress 8 70 7 50Finished goods 48 433 52 387Other 22 197 16 123Total 100 898 100 747
By Operating Segments
million CHF % 2014 % 2013
Specialty Ingredients 48 435 52 391 Pharma&Biotech 52 463 48 356 Total 100 898 100 747
The 2014 development of inventory value adjustments is shown as follows:
Inventory Write-Downs
million CHF 2014 2013
Raw materials
Work in progress
and finished goods
Other Total Total
At 1 January 10 31 35 76 73Increase 8 208 6 222 185Reversal / Utilization of write-downs (8) (197) (5) (210) (182)Currency translation differences 0 1 1 2 0At 31 December 10 43 37 90 76
The cost of inventories recognized as expenses during the period and included in “Cost of goods sold” amounted to CHF 2 471 million (2013: CHF 2 462 million).
FINANCIAL REPORT
Click Note

34 LONZA ANNUAL REPORT 2014
8 DEVELOPMENT CONTRACTS
In the Pharma&Biotech segment, the percentage of completion (POC) method was applied to account for development contracts as well as a long-term manu-facturing contract with the economic substance of a construction contract. The stage of completion is estimated on the basis of costs incurred, compared with total forecasted costs. This accounting method is applied only to customer contracts with defined payment and delivery dates. Contract costs are usually recognized as an expense in the income statement in the accounting periods in which the work is performed. An expected excess of contract cost over total contract revenue is recognized as an expense as soon as it is apparent that total contract cost may exceed total contract revenue.
million CHF 2014 2013
Contract revenue recognized as revenue in the period 76 59
– Contract costs incurred 22 21– Recognized profits less recognized losses 10 15
Contract costs incurred plus recognized profits less recognized losses 32 36Less progress billings (3) (6)Total net amount due from customers 29 30
Gross amount due from customers for contract work 29 30
Advances received 5 13
9 TRADE RECEIVABLES
million CHF 2014 2013
Receivables from customers 629 568Allowances for credit losses (7) (9)Total 622 559
The Group’s credit risk is diversified due to the large number of entities comprising the Lonza customer base and the dispersion across many different industries and regions. Management has a credit policy in place and the exposure to credit risk is monitored on an ongoing basis. At 31 December 2014, there were no significant concentrations of credit risk. The maximum exposure to credit risk is equal to the carrying amounts.
FINANCIAL REPORT
Click Note

35 LONZA ANNUAL REPORT 2014
Aging of Trade Receivables
million CHF 2014 2013
Not past due 512 440Past due 1 – 30 days 79 61Past due 31 – 120 days 25 48Past due more than 120 days 13 19Total 629 568
Reconciliation of Changes in Allowance Accounts for Credit Losses
million CHF 2014 2013
Balance at the beginning of the year 9 4Write-offs (7) (2)Increase in provision for credit losses 6 7Decrease in provision for credit losses (1) 0Balance at the end of the year 7 9
In general, Lonza does not require collateral in respect of trade and other receivables, but uses credit insurance for country risk where appropriate.
Accounts Receivable Securitization Program
Lonza entered into a securitization program with Market Street Funding LLC and PNC Bank, National Association (“PNC Bank”). Under the program Lonza sells U.S. trade accounts receivable, and certain Canadian trade accounts receiv-able, to Market Street Funding LLC through its wholly owned subsidiary, Arch Chemicals Receivables LLC.
The amount of funding that Lonza can obtain under the program is subject to change based upon the level of eligible receivables, with a maximum funding amount of USD 36 million (2013: USD 55 million).
Under the program, the payment by Market Street Funding LLC for a portion of the purchase price is deferred until the transferred underlying receivables have been completely settled. Lonza’s maximum exposure related to the receivables sold is equal to the deferred purchase price component, which is substantially higher than the average expected credit loss on the receivables. As a result, Lonza continues to recognize all of the transferred receivables in the consolidated balance sheet.
As of 31 December 2014, the consolidated balance sheet includes receivables of USD 73 million (2013: USD 83 million) which Lonza sold to Market Street Funding LLC and for which it obtained funds of USD 33 million (2013: USD 45 million). These are disclosed as “Other current liabilities” (note 14).
FINANCIAL REPORT
Click Note

36 LONZA ANNUAL REPORT 2014
10 OTHER RECEIVABLES, PREPAID EXPENSES AND ACCRUED INCOME
million CHF 2014 2013
Other receivables 54 56Prepaid taxes and social security payments 10 7Prepaid expenses and accrued income 66 85Derivative financial instruments (see note 27.5) 9 27Total 139 175
“Other receivables” include accruals, receivables for taxes (other than income taxes).
11 CASH AND CASH EQUIVALENTS
million CHF 2014 2013
Cash 186 302Time deposits 23 4Total 209 306
12 PROVISIONS
Non-Current Provisions
million CHF Environmental Restructuring Other Total
At 1 January 2014 43 8 5 56Increase 6 0 0 6Used (5) 0 0 (5)Reversed (3) 0 0 (3)Discount effect 1 0 0 1Reclassification (to current provisions) (7) (3) 0 (10)Currency translation differences 2 0 0 2At 31 December 2014 37 5 5 47
Current Provision
million CHF Environ mental Restructuring Other Total
At 1 January 2014 5 37 1 43Increase 2 2 8 12Used (1) (26) (1) (28)Reversed (1) 0 0 (1)Reclassification (from non-current provisions) 7 3 0 10Currency translation differences 0 2 0 2At 31 December 2014 12 18 8 38
FINANCIAL REPORT
Click Note

37 LONZA ANNUAL REPORT 2014
Environmental The non-current environmental provision mainly reflects the fu-ture expenses for environmental remediation and protection for the plants in Visp (CH) and Castleford (UK) as well as for various other plants of the acquired legacy Arch business and is expected to be utilized within ten years. The legacy Arch-related provisions include environmental risks for existing as well as divested plants.
Restructuring The current restructuring provision consists of costs related to the phasedown of the Hopkinton site amounting to CHF 12 million (2013: CHF 24 million) which is further explained in note 3.
In 2011 Lonza initiated VispChallenge, a program to secure the future of the Visp (CH) site, both strategically and economically. The implementation of the planned measures is expected to be completed in 2015. As at 31 December 2014 the related provision for the restructuring program amounted to CHF 8 million (2013: CHF 12 million).
Other Other non-current provisions are mainly associated with asset retirement obligations of the Singapore based operations.
The other current provision is primarily comprised of the expected losses from customer contracts of CHF 5 million.
13 NET DEBT
The net debt comprises:
Non-Current Debt
million CHF 2014 2013
Straight bonds 1 141 1 380Syndicated loan (2011– 2018) 121 314German Private Placement 53 201Other long-term debt due to banks and others:
– Banks and other financial institutions 77 80 – Other 296 373 266 346
Finance lease liabilities 5 4 Total non-current debt 1 693 2 245
Straight Bonds – Fixed Interest Rates
million CHF 2014 2013
3 % CHF 400 million, 2010/2016, due 2 June 2016, issued at 100.721 % 399 3992.25 % CHF 240 million, 2011/2015, due 7 December 2015, issued at 100.47 % 240 2393.125 % CHF 140 million, 2011/2018, due 7 December 2018, issued at 100.56 % 139 1392 % CHF 200 million, 2012/2018, due 11 October 2018, issued at 100.21 % 199 1993 % CHF 105 million, 2012/2018, due 11 October 2022, issued at 100.74 % 105 1051.75 % CHF 300 million, 2013/2019, due 10 April 2019, issued at 100.45 % 299 299Total including current portion 1 381 1 380Less current portion of straight bonds (240) 0Total non-current straight bonds 1 141 1 380
FINANCIAL REPORT
Click Note

38 LONZA ANNUAL REPORT 2014
Current Debt
million CHF 2014 2013
Due to banks and other financial institutions 98 87 Others 30 45
Non-current debt due within one year– Straight bond (2011– 2015) 240 0 – German Private Placement 160 0 – Arch acquisition bridge financing 0 104
Total current debt 528 236
Total debt 2 221 2 481
Syndicated Loan The syndicated loan facility of CHF 700 million, of which CHF 125 million (2013: CHF 320 million) was used as of 31 December 2014, is granted until 9 September 2018 and has floating interest rates (CHF LIBOR + margin, depending on margin grid). Lonza has not hedged the related interest rate risk.
German Private Placement Dual-currency German Private Placement (Schuldscheindarlehen) of EUR 67.5 million and USD 133 million tranches (in total CHF 213 million) carry fixed and floating interest rates (LIBOR / EURIBOR + margin) and are repayable in 2015, 2017 and 2019.
Acquisition Bridge Financing The acquisition of Arch was completely debt-financed. A consortium of banks committed three credit facilities of USD 1 550 million to Lonza, of which USD 1 375 million was raised in October 2011 to acquire the Arch shares and prepay part of the debt. The facilities were at floating interest rates (LIBOR + margin, depending on margin grid). By the end of February 2014 Lonza had fully repaid the remaining balance of the bridge financing facilities. The repayments in 2014 amount to CHF 104 million (2013: CHF 244 million).
The syndicated loan agreement contains a financial covenant that is based on Lonza’s net debt / EBITDA ratio. The Group is in compliance with the covenant as of 31 December 2014.
Loans and Advances (Floating Interest Rates)
million CHF 2014 2013
Non-current loans and advances (1) (69)Current advances 0 (3)Cash and cash equivalents (209) (306)Total loans and advances / cash and cash equivalents (210) (378)
Net debt 2 011 2 103
Loans and advances decreased in 2014 compared with the prior year, as the equity loss from TL Biopharmaceutical Ltd joint venture (see note 6) is recognized as an impairment of the loan granted to TL Biopharmaceutical Ltd.
FINANCIAL REPORT
Click Note

39 LONZA ANNUAL REPORT 2014
Breakdown of Total Debt by Currencies
million CHF 2014 2013Average interest
rates %
%
Average interest
rates % %
CHF 2.38 73 1 618 2.27 72 1 785CNY 0.00 0 0 5.04 1 34 EUR 2.30 4 81 2.30 3 83 USD 2.92 23 520 2.87 24 577 Other 0.00 0 2 0.00 0 2 Total 100 2 221 100 2 481
Breakdown of Loans and Advances by Currencies
million CHF 2014 2013Average interest
rates %
%
Average interest
rates % %
USD 1.60 0 0 1.85 98 70 GBP 0.00 100 1 0.00 1 1 Other 0.00 0 0 0.00 1 1 Total 100 1 100 72
14 OTHER CURRENT LIABILITIES
million CHF 2014 2013
Accrued liabilities and other payables 338 260Derivative financial instruments (see note 27.5) 72 3Liability related to securitization program (see note 9) 33 40Other financial liabilities 189 189Accrued interest payables 15 16Total 647 508
“Accrued liabilities and other payables” include accruals and deferred income, such as down-payments from customers. In “Other financial liabilities”, payments re-ceived from customer funding are included.
FINANCIAL REPORT
Click Note

40 LONZA ANNUAL REPORT 2014
15 TRADE PAYABLES
million CHF 2014 2013
Payables to third parties 262 286 Total 262 286
“Payables to third parties” principally comprise amounts outstanding for trade purchases and ongoing costs. The carrying amount of trade payables approximates their fair value.
16 MATERIAL AND ENERGY COSTS
million CHF 2014 2013
Material costs 1 336 1 566Energy costs 74 75 Total 1 410 1 641
17 PERSONNEL EXPENSES
million CHF 2014 2013
Wages and salaries 762 788 Operating expenses defined-benefit pension plans (note 22) 35 13 Other social security contributions 153 133 Other personnel expenses 38 47 Total personnel cost 988 981
FINANCIAL REPORT
Click Note

41 LONZA ANNUAL REPORT 2014
18 OTHER OPERATING INCOME AND EXPENSES
“Other operating income” and “Other operating expenses” include items not as-signable to the other functions of the consolidated income statement.
Major elements of “Other operating income” in 2014 include: gains from sale of property, plant and equipment, government subsidies, insurance benefits, operating exchange rate gains and income from the reversal of provisions. In 2014 “Other operating expenses” reflect expenses incurred in connection with restructuring and environmental provisions, losses from sale of property, plant and equipment and operating exchange rate losses.
The major elements of “Other operating income” in 2013 include: government subsidies, insurance benefits, operating exchange rate gains and income from the reversal of provisions. “Other operating expenses” in 2013 reflect expenses incurred in connection with restructuring and environmental provisions and operating exchange rate losses.
19 FINANCIAL RESULTS
19.1 INTEREST AND OTHER FINANCIAL INCOME
million CHF 2014 2013
Interest income 9 6Gains from currency related financial derivative instruments 0 38Foreign exchange rate differences 141 0Total 150 44
19.2 INTEREST AND OTHER FINANCIAL EXPENSES
million CHF 2014 2013
Interest expenses (76) (108)Loss from currency related financial derivative instruments (126) 0Foreign exchange rate differences 0 (43)Other financial expenses (8) (12)Total (210) (163)
“Interest expenses” comprise interest expenses on the Group’s debt (refer to note 13), the net defined benefit liabilities (see note 22), the accounts receivable securitiza-tion program (see note 9) as well as other interest.
FINANCIAL REPORT
Click Note

42 LONZA ANNUAL REPORT 2014
20 TAXES
20.1 INCOME TAXES
Major Components of Tax Expenses
million CHF 2014 2013
Current taxes (38) (19)Deferred tax expense relating to the origination and reversal of temporary differences (10) (2)Deferred tax income resulting from tax rate changes 6 3 Total (42) (18)
Lonza Group Ltd and the operating company Lonza Ltd are domiciled in Switzer-land. The maximum rate of all income taxes on companies domiciled in Switzerland is 8 % (2013: 8 %) for holding companies and 22 % for operating companies in the Canton of Valais (2013: 22 %).
Since the Group operates across the world, it is subject to income taxes in several different tax jurisdictions. Lonza uses, as the Group’s tax rate, the ordinary tax rate for a legal entity in the Canton of Valais in Switzerland. The Group’s effective tax rate for 2014 is 15 % (2013: 17 %).
Capital taxes of CHF 14 million (2013: CHF 8 million) are contained in “Admin-istration and general overheads”.
Reconciliation of Tax Expense
million CHF 2014 2013
Profit before income taxes 279 105
Tax at the Group rate (2014: 22 % / 2013: 22 %) 61 23 Deviation from average group tax rate (6) 30 Non-deductible expenses 23 2Tax-free earnings (14) (13)Deferred tax effect from tax rate changes 6 3 Changes in prior year estimates (including valuation allowances) (13) (37)Tax on unremitted earnings (17) 11 Effect of non-recognition of deferred tax assets 1 0 Other 1 (1)Total 42 18
Deferred tax expenses (charged) / credited directly to equity 0 0 Current tax expenses (charged) / credited directly to equity (5) 1
FINANCIAL REPORT
Click Note

43 LONZA ANNUAL REPORT 2014
The components of deferred income tax balances are included in the following captions in the consolidated balance sheet:
Components of Deferred Income Tax Balances
million CHF
Assets
2014
Liabilities
Assets
2013
Liabilities
Current provisions 5 17 6 64 Non-current provisions / Employee benefit liability 269 56 204 63 Intangible assets 1 290 1 277 Inventories, net 3 33 23 26 Property, plant and equipment 16 171 15 176 Other assets 19 37 13 49 Tax loss carry-forwards 82 0 100 0 Netting of deferred tax assets and deferred tax liabilities (348) (348) (262) (262)Total 47 256 100 393
The development of deferred tax (expenses) / income can be explained as follows:
million CHF 2014 2013
Deferred tax assets 47 100 Deferred tax liabilities (256) (393)Net deferred tax liability, at 31 December (209) (293) Less deferred tax liabilities net, at 1 January 293 257 (Increase) / decrease in deferred tax liabilities, net 84 (36) Currency translation differences 15 (8) Movements of deferred tax (assets) / liabilities recognized in other comprehensive income (103) 45 (Expense) / income recognized in income statement (4) 1
Unrecognized Tax Losses: Expiry
million CHF 2014 2013
Within 1 year 0 0 Between 2 to 5 years 42 26 After 5 years 48 40 Unlimited 183 218 Total 273 284
In assessing whether it is probable that future taxable profit will be available to offset these tax loss carry-forwards, management considers a portion of such benefits to be recoverable on the basis of the current situation of the company and the future economic benefits outlined in specific business plans for each relevant subsidiary.
FINANCIAL REPORT
Click Note

44 LONZA ANNUAL REPORT 2014
20.2 DISCLOSURE OF TAX EFFECTS TO EACH COMPONENT OF OTHER COMPREHENSIVE INCOME
million CHF
Before-tax amount
Tax (expense) benefit
2014
Net-of-tax amount
Before-tax amount
Tax (expense) benefit
2013
Net-of-tax amount
Exchange differences on translating foreign operations 131 (6) 125 (48) 2 (46)Cash flow hedges (12) 2 (10) 1 0 1 Remeasurement of defined-benefit liability (352) 103 (249) 128 (45) 83 Other comprehensive income (233) 99 (134) 81 (43) 38
21 RESEARCH AND DEVELOPMENT
Reasearch & Development (R&D) costs include all primary costs directly related to this function, as well as internal services and imputed depreciation. These costs are incurred for: – Development of new products and services – Improvement of existing products and services – Development of new production processes – Improvement of existing production processes – Cost for patents – Purchase price for product and process know-how
to the extent not capitalized
The research and development costs amounted to CHF 195 million (2013: CHF 215 million) and represent the full range of R&D activity. However, the consoli-dated income statement discloses research and development costs of only CHF 101 million (2013: CHF 111 million), as the remainder of such costs are absorbed in “Cost of goods sold” for R&D products and services sold.
FINANCIAL REPORT
Click Note

45 LONZA ANNUAL REPORT 2014
22 EMPLOYEE BENEFIT LIABILITIES
The tables below reconcile the Group’s employee benefit liabilities in the balance sheet as well the related remeasurement in the statement of other comprehensive income:
million CHF 2014 2013
Defined-benefit pension plans (see note 22.1) 674 322Post-employment medical benefits (see note 22.2) 47 34Non-current vacation accrual (Swiss entities) 3 3Other employee benefit liabilities 3 5Total 727 364
million CHF 2014 2013
Remeasurement for:Defined-benefit pension plans (see note 22.1) 344 (122)Post-employment medical benefits (see note 22.2) 8 (6)Total 352 (128)
22.1 DEFINED-BENEFIT PENSION PLANS
The group operates defined-benefit pension plans in various countries, with the major plans in Switzerland, Great Britain and the United States (as described below). For pension accounting purposes, these plans are considered as defined-benefit plans.
Pension Plan in Switzerland The Group’s Swiss pension plan is governed by the Swiss Federal Law on Occupational Retirement, Survivors and Disability Pen-sion Plans (BVG), and is funded through a legally separate trustee-administered pension fund (Pensionskasse der Lonza). The Board of Trustees is responsible for the investment of the assets, which cannot revert to the Company. The cash funding of these plans, which may from time to time involve special payments, is designed to ensure that present and future contributions should be sufficient to meet future liabilities. Furthermore, the Board of Trustees is able to adapt the contributions and benefits.
The plan contains a cash balance benefit formula, accounted for as a defined-benefit plan. Employer and employee contributions are defined in the pension fund rules in terms of an age-related sliding scale of percentages of pay. Under Swiss law, the company guarantees the vested benefit amount as confirmed annually to mem-bers. Interest may be added to member balances at the discretion of the Board of Trustees. The plan benefits are managed by a third-party insurance company and are defined in pension plan rules compliant with the BVG. The risks linked to retirement benefits (disability and death) have been reinsured until 31 December 2016. The investment risk is not reinsured.
FINANCIAL REPORT
Click Note

46 LONZA ANNUAL REPORT 2014
Retirement benefits are based on the accumulated retirement capital (made up of yearly contributions and the interest thereon), which can either be drawn as a life-long annuity or as a lump sum payment or a combination of both. The annuity is calculated by multiplying the retirement capital with the applicable conversion rate defined in the fund rules. The Board of Trustees may adjust the annuity at their discretion subject to the plan’s funded status, including sufficient free funds as determined according to Swiss statutory valuation rules.
Retirement benefits and related plan assets of plan participants with a retirement date on or before 31 December 2007 were transferred to an insurance company. The insurance company guarantees these retirement benefits and bears the invest-ment, death and disability risks.
Pension Plan in the UK The Group operates two major plans in the UK, the Hickson UK Group Pension Scheme and the Lonza Biologics Pension Scheme.
The Hickson UK Group Pension Scheme is the defined-benefit pension plan of the UK Arch business. The much smaller Hickson UK Senior Executive Pension Scheme, is fully merged with this scheme. The plan is closed to new entrants. It operates under UK pension and tax law. Pensions are linked to final salaries and service, and statutory inflation increases apply, except where contractually different.
Ongoing contributions are sufficient to fund current accrual rates, and a deficit recovery plan has been in place for a number of years to recover any shortfall in funding. The fund is managed by a corporate trustee body, which oversees investment strategy and general regulatory compliance. It also maintains a set of assumptions around mortality and returns on investments as well as cost inflation. Currently investments are weighted towards bonds but with a significant equity investment and a small property portfolio.
The Lonza Biologics Pension Scheme provides pensions in retirement and death benefits to members. Pension benefits are linked to a member’s final salary at retirement and their length of service. The Scheme is a registered scheme under UK legislation and is contracted out of the State Second Pension. The Scheme is subject to the scheme funding requirements outlined in UK legislation.
The Scheme was established from June 1996 under trust and is governed by the Scheme’s second definitive trust deed dated January 1998 and the Scheme’s rules dated June 1996 and subsequent amending deeds. The Trustees are responsible for the operation and the governance of the Scheme, including making decisions regarding the Scheme’s funding and investment strategy in conjunction with the Employer.
FINANCIAL REPORT
Click Note

47 LONZA ANNUAL REPORT 2014
Pension Plans in the United States Lonza sponsors several defined-benefit pen-sion plans in the United States, all of which are closed to new participants and the majority of which are frozen with respect to future benefit accruals. The exception relates to one small collectively bargained plan, with only 31 participants as of 1 January 2014 for whom benefit accruals continue. All eligible U.S. employees currently participate under a defined-contribution retirement plan.
The pension benefits for all U.S. pension plan participants (with the exception of the cash balance portion of the Arch pension plan described below) are generally based on final average pay and credited service as of the date of termination or as of the date benefit accruals were frozen (if earlier), and are payable as a lifetime pension. Participants in these plans may commence benefit payments upon at-tainment of normal retirement age, or in some cases, as of an earlier date provided the criteria for early retirement has been met as of the participant’s termination of employment with the Company.
Employees of Arch Chemicals hired after 2007 and before 2012 are covered under an account-based cash balance formula that is credited each year with interest based on the yield on ten-year U.S. Treasury securities. Upon retirement, these employees can elect to receive their benefit as a lump sum (which is generally per-missible upon termination of employment, regardless of age) or a lifetime pension.
The majority of pension benefit payments are paid from a trustee-administered fund; however there are also some small, non-qualified, unfunded plans where Lonza meets the benefit payment obligation as such benefits become due. The qualified defined benefit plans, whose assets are held in a trust, are subject to minimum funding requirements as set out by the Internal Revenue Service (IRS). Responsibility for governance of these qualified plans, including investment deci-sions and contribution schedules, lies with a committee of pension plan fiduciaries appointed by Lonza. Actuarial valuations are completed each year for the plans to determine the contribution requirement. The minimum annual contribution for each plan is equal to the present value of benefits accrued each year (if any), plus expected administrative expenses of the plan to be paid from the trust, plus a rolling amortization of any prior underfunding. The plan sponsor may elect to contribute more than the minimum, in which case the excess amounts may under certain circumstances be used to offset future funding requirements.
FINANCIAL REPORT
Click Note

48 LONZA ANNUAL REPORT 2014
The movement in the net defined-benefit liability over 2013–2014 is as follows:
million CHF Defined-benefit obligation Fair value of plan assets Net defined-benefit liability
At 1 January 2013 2 608 (2 129) 479
Included in profit or lossCurrent service cost 39 0 39Past service credit (15) 0 (15)Gains on settlements (20) 9 (11)Interest expense / (income) 73 (58) 15
Included in other comprehensive incomeRemeasurements loss (gain):
– Actuarial loss (gain) arising from :– Demographic assumptions 1 0 1– Financial assumptions (153) 0 (153)– Experience adjustment 112 0 112
– Return on plan assets excluding interest income 0 (82) (82)Total remeasurements gain (40) (82) (122)
Effect of movements in exchange rates (17) 11 (6)
OtherContributions paid by:
– Employers 0 (57) (57)– Plan participants 17 (17) 0
Benefits paid (148) 148 0At 31 December 2013 2 497 (2 175) 322
– Thereof present value of funded defined-benefit obligation 2 478– Thereof present value of unfunded defined-benefit obligation 19
Included in profit or lossCurrent service cost 36 0 36Past service credit (1) 0 (1)Interest expense / (income) 82 (71) 11
Included in other comprehensive incomeRemeasurements loss (gain):
– Actuarial loss (gain) arising from :– Demographic assumptions 60 0 60– Financial assumptions 334 0 334 – Experience adjustment 30 0 30
– Return on plan assets excluding interest income 0 (80) (80)Total remeasurements loss (gain) 424 (80) 344
Effect of movements in exchange rates 85 (68) 17
OtherContributions paid by:
– Employers 0 (55) (55)– Plan participants 16 (16) 0
Benefits paid (106) 106 0At 31 December 2014 3 033 (2 359) 674
– Thereof present value of funded defined-benefit obligation 3 009 – Thereof present value of unfunded defined-benefit obligation 24
FINANCIAL REPORT
Click Note

49 LONZA ANNUAL REPORT 2014
As a result of a plan amendment of the Swiss plan, the Group recognized a prior service credit of CHF 15 million for the 2013 financial year.
In connection with the closure of the Swords (IE) site, a gain on settlement of CHF 6 million was recognized in 2013. In addition, Lonza offered a one-time
“window” program to former participants in the U.S. pension plans who had not yet commenced benefits, allowing them to choose a one-time immediate lump sum payment (or immediate annuity) of their retirement benefit in lieu of a life-time annuity beginning at retirement age, which resulted in a gain on settlement of CHF 5 million.
The Group expects to pay CHF 51 million in contributions to defined-benefit pension plans in 2015.
The defined-benefit obligation and plan assets are disaggregated by country as follows:
million CHF 2014 2013
CH US UK Rest of the world
Total CH US UK Rest of the world
Total
Present value of defined-benefit obligation 1 632 644 716 41 3 033 1 401 490 573 33 2 497Fair value of plan assets (1 333) (444) (569) (13) (2 359) (1 277) (411) (475) (12) (2 175)
Total net defined-benefit liability 299 200 147 28 674 124 79 98 21 322
The significant actuarial assumptions at the reporting date (expressed as weighted averages) were as follows:
in % 2014 2013CH US UK CH US UK
Discount rate 1.00 3.89 3.58 2.30 4.69 4.39 Future salary increases 1.00 0.00 3.18 1.00 0.00 3.53 Future pension increases n.a. 0.00 2.20 n.a. 0.00 2.49
Assumptions regarding future mortality are based on actuarial advice in accor-dance with published statistics and experience in each territory. These assumptions translate into an average life expectancy in years for a pensioner retiring at age 65:
in years 2014 2013
CH US UK CH US UK
Retiring at the end of the reporting period:– Male 21.4 22.0 21.6 21.4 19.0 21.0– Female 23.9 24.0 24.5 23.9 21.0 23.0
Retiring 20 years after the end of the reporting period:
– Male 23.2 23.0 23.3 23.2 21.0 23.0– Female 25.6 26.0 26.2 25.6 22.0 25.0
FINANCIAL REPORT
Click Note
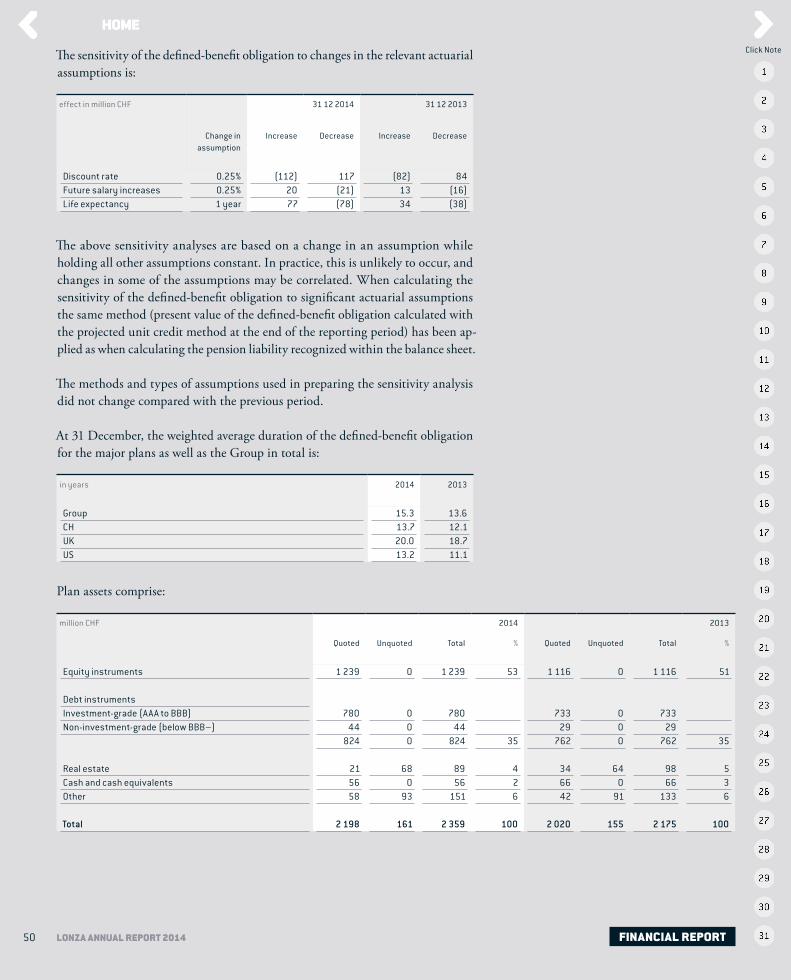
50 LONZA ANNUAL REPORT 2014
The sensitivity of the defined-benefit obligation to changes in the relevant actuarial assumptions is:
effect in million CHF 31 12 2014 31 12 2013
Change in assumption
Increase Decrease Increase Decrease
Discount rate 0.25 % (112) 117 (82) 84Future salary increases 0.25 % 20 (21) 13 (16)Life expectancy 1 year 77 (78) 34 (38)
The above sensitivity analyses are based on a change in an assumption while holding all other assumptions constant. In practice, this is unlikely to occur, and changes in some of the assumptions may be correlated. When calculating the sensitivity of the defined-benefit obligation to significant actuarial assumptions the same method (present value of the defined-benefit obligation calculated with the projected unit credit method at the end of the reporting period) has been ap-plied as when calculating the pension liability recognized within the balance sheet.
The methods and types of assumptions used in preparing the sensitivity analysis did not change compared with the previous period.
At 31 December, the weighted average duration of the defined-benefit obligation for the major plans as well as the Group in total is:
in years 2014 2013
Group 15.3 13.6CH 13.7 12.1UK 20.0 18.7US 13.2 11.1
Plan assets comprise:
million CHF 2014 2013
Quoted Unquoted Total % Quoted Unquoted Total %
Equity instruments 1 239 0 1 239 53 1 116 0 1 116 51
Debt instrumentsInvestment-grade (AAA to BBB) 780 0 780 733 0 733 Non-investment-grade (below BBB–) 44 0 44 29 0 29
824 0 824 35 762 0 762 35
Real estate 21 68 89 4 34 64 98 5Cash and cash equivalents 56 0 56 2 66 0 66 3Other 58 93 151 6 42 91 133 6
Total 2 198 161 2 359 100 2 020 155 2 175 100
FINANCIAL REPORT
Click Note

51 LONZA ANNUAL REPORT 2014
22.2 POST-EMPLOYMENT MEDICAL BENEFITS
Lonza’s post-employment medical benefit plans are not funded and are provided under a defined-benefit plan. They consist of post-retirement healthcare benefits in the United States, such as drug coverage and other medical benefits as well as limited death benefits.
The post-retirement healthcare plans are not open to new members and grand-fathered participants must meet specific age / service requirements to participate.
The movements in the defined-benefit obligation are as follows:
million CHF 2014 2013
At 1 January 34 61
Included in profit or lossCurrent service cost 1 1Past service credit 0 (21)Interest expense 1 2
Included in other comprehensive incomeRemeasurements loss (gain):Actuarial loss (gain) arising from :
– Demographic assumptions 4 0– Financial assumptions 3 (9)– Experience adjustment 1 3
Total remeasurements loss (gain) 8 (6)
Effect of movements in exchange rates 5 0
OtherContributions paid by:
– Plan participants 2 2Benefits paid (4) (5)At 31 December 47 34
In 2013 the plans were amended. As a result of the elimination of prescription drug coverage for certain post-65 year-old retirees, the Group recognized a past service credit of CHF 21 million.
The significant actuarial assumptions were as follows:
in % 2014 2013
Discount rate 3.79 4.69Medical-cost trend rate 7.00 7.50
FINANCIAL REPORT
Click Note

52 LONZA ANNUAL REPORT 2014
The sensitivity of the defined-benefit obligation to changes in the relevant actuarial assumptions is:
effect in million CHF 31 12 2014 31 12 2013
Change in assumption
Increase Decrease Increase Decrease
Discount rate 0.25 % (1) 2 (1) 1Medical-cost trend rate 1.00 % 6 (5) 4 (3)Life expectancy 1 year 1 (2) 1 (1)
For the medical plan the same mortality assumptions are applied as for the pension plans in the United States (see note 22.1). In addition, the sensitivity analyses are based on the same methodology as for the pension plans.
23 SHARE-BASED PAYMENTS Equitysettled share schemes
Employee Share Purchase Plan (ESPP)
In keeping with its vision and culture, Lonza has continuously encouraged em-ployee participation in the company through stock ownership. In 2005, the former Employee Share Purchase Plan was updated. Under the new plan, ESPP Plus, employees were given the opportunity – but not the obligation – to purchase Lonza shares in multiples of three with a price reduction of 30 %. The shares purchased in this manner remain blocked for three years and are eligible for a dividend. After this blocking period, participants are entirely free to do as they wish with the shares. If participants keep their shares for a further two years in a blocked deposit, they will then – after this holding period is over – receive one additional free share for every three shares purchased. Due to cost-saving measures, the reissue of the share purchase plan was interrupted in 2009 and 2013.
In 2014, the former Employee Share Purchase Plan was updated. During November of 2014, the Employee Stock Purchase Plan (ESPP) was offered to the majority of active permanent employees (including Executive Committee members). Under the terms of the 2014 ESPP, employees were given the opportunity to purchase shares of Lonza stock at a price of CHF 77.99. This price represents a discount of 30% from the average weighted price of Lonza shares on the SIX Swiss Stock Exchange for the period from 24 November 2014 to 5 December 2014, which was CHF 111.42. The minimum investment amount is CHF 500 and the maximum investment amount is CHF 3 000. All shares purchased under the 2014 ESPP are blocked from any disposal for a three-year period. During the blocking period, participants are the entitled beneficiaries of the shares and all attached rights. ESPP 2014 does not include any additional free shares.
FINANCIAL REPORT
Click Note
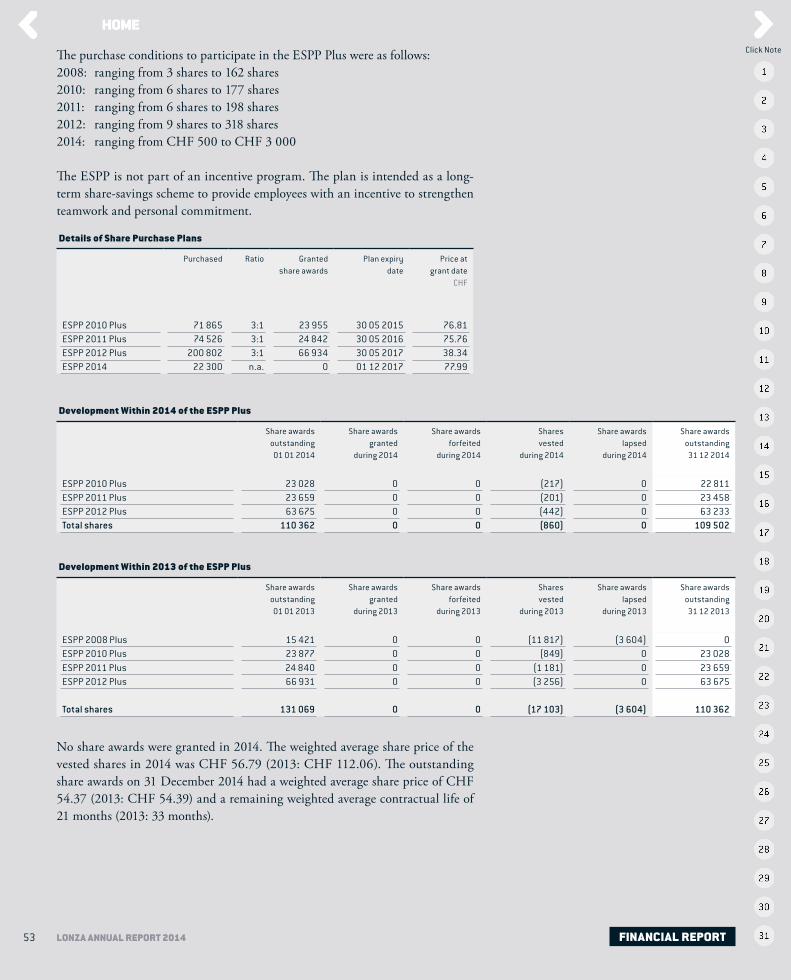
53 LONZA ANNUAL REPORT 2014
The purchase conditions to participate in the ESPP Plus were as follows:2008: ranging from 3 shares to 162 shares2010: ranging from 6 shares to 177 shares2011: ranging from 6 shares to 198 shares2012: ranging from 9 shares to 318 shares 2014: ranging from CHF 500 to CHF 3 000
The ESPP is not part of an incentive program. The plan is intended as a long-term share-savings scheme to provide employees with an incentive to strengthen teamwork and personal commitment.
Details of Share Purchase Plans
Purchased Ratio Granted share awards
Plan expiry date
Price at grant date
CHF
ESPP 2010 Plus 71 865 3:1 23 955 30 05 2015 76.81 ESPP 2011 Plus 74 526 3:1 24 842 30 05 2016 75.76ESPP 2012 Plus 200 802 3:1 66 934 30 05 2017 38.34ESPP 2014 22 300 n.a. 0 01 12 2017 77.99
Development Within 2014 of the ESPP Plus
Share awards outstanding 01 01 2014
Share awards granted
during 2014
Share awards forfeited
during 2014
Shares vested
during 2014
Share awards lapsed
during 2014
Share awards outstanding 31 12 2014
ESPP 2010 Plus 23 028 0 0 (217) 0 22 811ESPP 2011 Plus 23 659 0 0 (201) 0 23 458ESPP 2012 Plus 63 675 0 0 (442) 0 63 233Total shares 110 362 0 0 (860) 0 109 502
Development Within 2013 of the ESPP Plus
Share awards outstanding 01 01 2013
Share awards granted
during 2013
Share awards forfeited
during 2013
Shares vested
during 2013
Share awards lapsed
during 2013
Share awards outstanding 31 12 2013
ESPP 2008 Plus 15 421 0 0 (11 817) (3 604) 0ESPP 2010 Plus 23 877 0 0 (849) 0 23 028ESPP 2011 Plus 24 840 0 0 (1 181) 0 23 659ESPP 2012 Plus 66 931 0 0 (3 256) 0 63 675
Total shares 131 069 0 0 (17 103) (3 604) 110 362
No share awards were granted in 2014. The weighted average share price of the vested shares in 2014 was CHF 56.79 (2013: CHF 112.06). The outstanding share awards on 31 December 2014 had a weighted average share price of CHF 54.37 (2013: CHF 54.39) and a remaining weighted average contractual life of 21 months (2013: 33 months).
FINANCIAL REPORT
Click Note

54 LONZA ANNUAL REPORT 2014
The fair values of shares granted were calculated using the market price at grant date. The discount on the purchase price of shares is expensed at the moment the employees acquire Lonza shares. The fair value of the free shares is expensed on a straight-line basis over the vesting period, based on estimates of shares that will eventually vest. The expected volatility was 20 % in 2014 (2013: 20 %).
Fair Value at Grant Date
CHF
ESPP 2010 1 471 987ESPP 2010 discount 1 655 985ESPP 2011 1 505 624ESPP 2011 discount 1 693 827ESPP 2012 2 053 000ESPP 2012 discount 2 309 625ESPP 2014 discount 2 484 666
A total of 86 785 treasury shares with a par value of CHF 1 each (31 December 2013: 87 645) is reserved for the share purchase plans.
LongTerm Incentive Plan (LTIP)
History and Participation The LTIP is an equity-based plan for a selected seg-ment of key employees, including the Executive Committee.
Objectives The LTIP has been designed to align the interests of key employees with those of Lonza’s shareholders and to serve as a retention tool. LTIP participants are eligible to receive a number of Lonza shares at the end of the vesting period, provided that certain performance conditions are met.
Maximum Equity Awards Under the LTIP, selected key employees are awarded the right to receive a number of registered shares of Lonza in the future. Depend-ing on the level of the job, the maximum equity award grant is between 10 % and 160 % of the annual base salary. Maximum equity award grants are determined at the beginning of the vesting period of three years. Vesting will depend on achieve-ment of the performance conditions and cannot exceed the maximum amount of granted equity awards:
Executive Committee / Senior Management Other participants
Maximum Award of LTIP as % of Base Salary at Grant Date
160 % for Chief Executive Office 150 % for other Executive Committee members 25 % to 75 % for Senior Management 10 % to 25 %
Restriction and Vesting The central feature of the plan is that key employees will only receive title and ownership of the shares after a three-year vesting period and only if the performance metrics required for vesting are fully or partially met.
FINANCIAL REPORT
Click Note

55 LONZA ANNUAL REPORT 2014
Vesting Targets For the 2011 and 2012 LTIP, the performance metrics were EVA and TSR with 50% weight for each metric. For the 2013 LTIP, the performance metrics were Core EPS and TSR with a 50% weight for each measure. For the 2014 LTIP, the performance metrics were Core EPS and Core RONOA with a 50% weight for each measure.
Adjustments of the 2014 LTIP Target Metrics Based on feedback from the invest-ment community, Core EPS and Core RONOA were selected as 2014 LTIP targets to serve as the most appropriate indicators of Lonza’s strategic success. With the payout value directly linked to these key financial metrics, these two absolute mea-sures focus on Lonza’s financial performance that will drive the valuation of Lonza with investors. The value of the LTIP will be ultimately driven by the share price at the time of payout, further linking the LTIP to the interests of the shareholders.
Overview of Vesting Conditions for the LTIP
Total Shareholder Return (TSR1) For years 2011, 2012 and 2013 the vesting of up to 50 % of the granted equity awards is based on the total shareholder return (TSR) achieved during Lonza’s three fiscal years before the end of the vesting period compared with a peer group. The 2011, 2012 and 2013 TSR target is fully reached in the event that Lonza outperforms the average of the peer group (MSCI Chemicals, MSCI Health Care, SPI) on an annualized basis by 9 % on average over three years. At this TSR level, the maximum amount of the granted equity awards vests. If the TSR target is not fully reached, the number of granted equity awards that vest is reduced linearly according to the achieved target of TSR. The threshold target is to achieve the same annualized TSR development as the index of the peer group. If this minimum target is met, 25 % of the granted equity awards will vest. If the threshold is not met, the granted equity awards linked to this performance metric will lapse.
Economic Value Added (EVA2) For the years 2011 and 2012, the vesting of up to 50 % of the remaining granted equity awards is based on the average annual Group Economic Value Added (EVA) growth achieved during Lonza’s three fiscal years at the end of the vesting period. For competitive reasons, Lonza does not further specify the details of the absolute objectives. The actual target and associated proposed payouts will be disclosed in Lonza’s Remuneration Report relating to the year of payout. If the EVA target is not fully reached, the percentage of the granted equity awards from the grant that vest is reduced linearly according to the EVA achievement. The threshold target is to maintain the same level of EVA at the beginning of the performance period. If this minimum target is met, 25 % of the granted equity awards will vest. If the EVA threshold is not met, the granted equity awards linked to this performance metric will lapse.
TSR measures growth in share price with dividends reinvested. This measure is based on an external market view of the company’s success. EVA or Economic Value Added is an estimate of true
“economic” profit, or the amount by which earnings exceed or fall short of the required minimum rate of return that shareholders and lenders could get by investing in other securities of comparable risk. EVA is calculated as follows: Net operating profit after taxes minus cost of capital of net operating assets.
1
2
FINANCIAL REPORT
Click Note

56 LONZA ANNUAL REPORT 2014
Earnings Per Share (EPS) For the year 2013, the vesting of up to 50 % of the granted equity awards is dependent on growth of earnings per share (EPS) achieved during Lonza’s three fiscal years. For competitive reasons, Lonza does not further specify the details of the absolute objectives. The actual target and associated proposed payouts will be separately disclosed in Lonza’s Remuneration Report relating to the year of payout. If the EPS target is not fully reached, the percentage of the granted equity awards from the grant that vest is reduced linearly according to the EPS achievement. The threshold target is to maintain the same level of EPS at the beginning of the performance period. If this minimum target is met, 25 % of the granted equity awards will vest. If the EPS threshold is not met, the granted equity awards linked to this performance metric will lapse.
Core 1 Earnings Per Share (Core EPS) For the year 2014, the vesting of up to 50 % of the granted equity awards is dependent on growth of Core Earnings per Share achieved during Lonza’s three fiscal years (see footnote 1 for definition of Core). Lonza believes that understanding and rewarding Lonza’s performance is enhanced by emphasizing core results during the performance period because core results enable a better comparison over a period of years. For 2014, the Core EPS maxi-mum grant is reached if Lonza meets its Core EPS target within the performance period. If the Core EPS maximum growth is not fully reached, the percentage of the granted equity awards from the share entitlement that vest is reduced lin-early to the threshold of Core EPS at the beginning of the performance period. If this minimum target is met, 25 % of the granted equity awards will vest. If the threshold is not met, granted equity awards related to this performance will lapse. The minimum threshold was determined by the NCC to approximate to the actual Core EPS on 31 December 2013. If such a threshold is not reached the payout will be zero. If this threshold is reached, 25 % of the equity award granted under the Core EPS vesting condition will vest. The maximum was determined to approximate to 150 % of the Core EPS at the threshold level. If such a level of Core EPS is reached, the maximum equity award granted under the Core EPS vesting condition of the granted equity award will vest. For competitive reasons, Lonza does not disclose the absolute Core EPS target at year-end 2016. However, the target was determined by the NCC to approximate to the Core EPS required to meet Lonza’s challenging strategic goals and support Lonza’s three-year plan. Lonza is committed to having the effective payout under the LTIP 2014 approved by the AGM 2017 through the consultative vote relating to the Remuneration Report for the financial year 2016.
Core1 Return on Net Operating Assets (Core RONOA) For the year 2014, the vest-ing of up to 50 % of the granted equity awards is dependent on the growth of Lonza’s Core RONOA during Lonza’s three fiscal years (31 December 2013 to 31 December 2016) (see footnote 1 for definition of Core). The Core RONOA maximum grant is reached if Lonza meets its Core RONOA target within the performance period. If the Core RONOA maximum growth is not fully reached, the percentage of the granted equity awards from the share entitlement that vest is reduced linearly to the threshold of Core RONOA at the beginning of the performance period. If this minimum target is met, 25 % of the granted equity awards will vest. If the threshold is not met, granted equity awards related to this performance will lapse. The minimum threshold was determined by the NCC
Core results exclude certain items such as restructuring charges, impairments and amortization of acquisition-related intangible assets, which can differ significantly from year to year.
1
FINANCIAL REPORT
Click Note

57 LONZA ANNUAL REPORT 2014
to approximate to the actual Core RONOA on 31 December 2013. If such a threshold is not reached the payout will be zero. If this threshold is reached, 25 % of the granted equity awards granted under the Core RONOA vesting condition will vest. The maximum was determined to approximate to 130 % of the Core RONOA at threshold. If such a level of Core RONOA is reached, the maximum equity awards granted under the Core RONOA vesting condition will vest. For competitive reasons, Lonza does not disclose the absolute Core RONOA target at year-end 2016. However, the target was determined by the NCC to approximate to the Core RONOA required to meet Lonza’s challenging strategic goals and sup-port Lonza’s three-year plan. Lonza is committed to having the effective payout under the LTIP 2014 approved by the AGM 2017 through the consultative vote relating to the Remuneration Report for the 2016 financial year.
Treatment of LTIP in Change of Control Situations Under the LTIP rules, if a Change in Control occurs, all unvested granted shares shall immediately vest and the granted price shall be the price at which the shares are sold in the transaction resulting in the Change in Control. The Executive Committee member does not need to terminate his or her employment to receive this Change of Control vesting.
Actual Performance and Payout for the LTIP 2011 and 2012 The minimum of the performance metrics of the 2011 LTIP were not met and the granted equity awards lapsed and no payments were made relating to the 2011 LTIP in 2014. Performance under the 2012 LTIP exceeded the maximum for EVA generating a 100% payout on 50% of the total award. Performance under the 2012 LTIP achieved the maximum target for TSR generating a 100% payout on the remaining 50% of the total award. The total 2012 LTIP payout equals 100%.
Goal-2012 LTIP
Actual Performance
Payout in %
EVA (Economic Value Added) CHF 82 m 100TSR (Total Shareholder Return) exceeded indices by 15.7 % 100
Historical Data on Vesting Conditions The following table shows historical data on vesting conditions for LTIP granted equity awards in the years 2011 to 2014, information used in calculating the fair value of the LTIP grants, and the number of equity awards vesting following the target attainment in the respective year.
Details of Long-Term Incentive Plans
Grant date Share price CHF
Granted equity awards
Fair value at Grant Date
Vesting date
LTIP 2011 01 02 2011 74.35 152 077 5 653 463 31 01 2014LTIP 2012 01 02 2012 49.69 267 031 4 975 783 31 01 2015LTIP 2013 01 02 2013 53.60 204 653 5 484 728 31 01 2016LTIP 2014 01 02 2014 91.15 137 180 6 251 978 31 01 2017
FINANCIAL REPORT
Click Note

58 LONZA ANNUAL REPORT 2014
Vesting Conditions at Grant Date
Market price
CHF
Granted equity awards
Fair value of equity awards
Expected vesting EVA / EPS / RONOA
at grant date
Probability minimum
targets
Volatility employees
Total probability
Total cost at grant date
CHF
LTIP 2011 TSR 74.35 76 038 37.18 100 % 3 % 97 % 2 741 911LTIP 2011 EVA 74.35 76 039 74.35 50 % 100 % 3 % 97 % 2 741 947 LTIP 2012 TSR 49.69 133 515 24.85 100 % 3 % 97 % 3 217 665 LTIP 2012 EVA 49.69 133 516 49.69 25 % 100 % 3 % 97 % 1 608 844 LTIP 2013 TSR 53.60 102 327 26.80 100 % 3 % 97 % 2 660 093LTIP 2013 EPS 53.60 102 327 53.60 50 % 100 % 3 % 97 % 2 660 093LTIP 2014 Core RONOA 91.15 68 590 91.15 50 % 100 % 3 % 97 % 3 032 210LTIP 2014 Core EPS 91.15 68 590 91.15 50 % 100 % 3 % 97 % 3 032 210
Development Within 2014 of the LTIP
Equity awards outstanding 01 01 2014
Equity awards granted
during 2014
Equity awards forfeited
during 2014
Vested equity awards
during 2014
Equity awards lapsed
during 2014
Equity awards outstanding 31 12 2014
LTIP 2011 127 857 0 0 0 (127 857) 0LTIP 2012 276 754 0 0 0 0 276 754LTIP 2013 204 653 0 0 0 0 204 653LTIP 2014 0 137 180 0 0 0 137 180Total equity awards 609 264 137 180 0 0 (127 857) 618 587
Development Within 2013 of the LTIP
Equity awards outstanding 01 01 2013
Equity awards granted
during 2013
Equity awards forfeited
during 2013
Vested equity awards
during 2013
Equity awards lapsed
during 2013
Equity awards outstanding 31 12 2013
LTIP 2010 124 142 0 0 0 (124 142) 0LTIP 2011 127 857 0 0 0 0 127 857LTIP 2012 267 031 9 723 0 0 0 276 754LTIP 2013 0 204 653 0 0 0 204 653Total equity awards 519 030 214 376 0 0 (124 142) 609 264
The estimated fair value of the granted equity awards in 2014 was CHF 45.58 (2013: CHF 26.80). No equity awards vested in 2014. The outstanding granted equity awards on 31 December 2014 had a weighted average share price of CHF 27.31 (2013: CHF 25.27) and a remaining weighted average contractual life of 10 months (2013: 15 months). The costs were calculated using the market price at grant date, including probabilities as per conditions of vesting. The amounts for equity awards are expensed on a straight-line basis over the vesting period, based on estimates of equity awards that will eventually vest.
Fair Value at Grant Date
CHF
LTIP 2011 5 653 463LTIP 2012 4 975 783LTIP 2013 5 484 728LTIP 2014 6 251 978
FINANCIAL REPORT
Click Note

59 LONZA ANNUAL REPORT 2014
Note that the aggregate maximum amount of variable long-term compensation to be granted to the Executive Committee in 2015 will be submitted for the binding approval of shareholders at the Lonza Annual General Meeting 2015 on 8 April 2015.
Extended ShortTerm Incentive Plan (ESTIP)
Relationship to STIP The company provides the members of the Executive Com-mittee and Senior Management with Short-Term Incentive Plans, of which two-thirds is paid in cash (Cash STIP) and one-third in restricted share units (RSUs) (E-STIP) which vest after three years. Performance metrics are defined for each financial year; achievement dermines the payout of STIP. The performance metrics for the STIP (Cash STIP and E-STIP) are the same.
E-STIP
E-STIP
Targeted E-STIP amount as % of base salary
– 26.7 % for the Chief Executive Officer – 25 % for other Executive Committee members – 10 % to 20 % for Senior Management
E-STIP targets weighting
– 50 % Core EBIT (Financial)– 15 % Lonza Sales (Financial)– 15 % Operational Free Cash Flow (Financial)– 20 % Personal targets are linked back to the
financial targets (10 % weighting for Core EBIT, 5 % weighting for Sales and 5 % weighting for Operational Free Cash Flow)
Maximum potential payout
Depending on the financial results achievement, the Cash STIP payout may range between 0 % and 200 % for the financial targets and 0 % and 150 % for personal targets. Total maximum payout opportunity is 190 % (80 % financial × 200 % + 20 % personal × 150 % = 190 %)
Alignment on Share Price The value of the plan is strongly dependent on Lonza’s future share price, thereby further reinforcing the link to shareholders’ interests. The E-STIP is awarded in the form of RSUs, which are subject to a three-year vesting requirement.
Grant Timing The grant of the RSUs under the E-STIP 2014 will take place in April 2015 after the AGM shareholder approval (E-STIP 2013 on 31 March 2014), at which date the number of RSUs will be determined based on the closing stock price of the last business day in March. These RSUs vest after three years.
Dividend and Voting Rights The E-STIP RSUs do not qualify for dividends and voting rights until vested.
Treatment of E-STIP RSUs in Change of Control Situation Under the E-STIP plan rules, if a Change in Control occurs, all unvested RSUs shall immediately vest and the granted price shall be the price at which the shares are sold in the transaction resulting in the Change in Control. The Executive Committee member does not need to terminate his or her employment to receive this Change of Control vesting.
FINANCIAL REPORT
Click Note

60 LONZA ANNUAL REPORT 2014
Non-Vested RSUs
Grant date Share price Granted share units
Vesting date
E-STIP 2011 31 03 2012 46.66 33 205 31 03 2015E-STIP 2012 31 03 2013 61.60 41 405 31 03 2016E-STIP 2013 31 03 2014 90.15 19 771 31 03 2017
Development Within 2014 of E-STIP
Share units outstanding 01 01 2014
Share units granted
during 2014
Share units forfeited
during 2014
Shares units vested
during 2014
Share units lapsed
during 2014
Share units outstanding 31 12 2014
E-STIP 2011 32 001 0 0 0 0 32 001E-STIP 2012 40 526 0 0 (1 961) 0 38 565E-STIP 2013 0 19 771 0 (521) 0 19 250Total 72 527 19 771 0 (2 482) 0 89 816
Development Within 2013 of E-STIP
Share units outstanding 01 01 2013
Share units granted
during 2013
Share units forfeited
during 2013
Shares units vested
during 2013
Share units lapsed
during 2013
Share units outstanding 31 12 2013
E-STIP 2011 33 205 0 0 (1 204) 0 32 001E-STIP 2012 0 41 405 0 (879) 0 40 526Total non-vested share units 33 205 41 405 0 (2 083) 0 72 527
The estimated fair value of the RSUs granted in 2014 was CHF 90.15 (2013: CHF 61.60). The weighted average share price of the vested share unit in 2014 was CHF 67.59 (2013: CHF 52.96). The outstanding share units on 31 December 2014 had a weighted average share price of CHF 62.40 (2013: CHF 55.01) and a remaining weighted average contractual life of 13 months (2013: 22 months).
The fair value was calculated using the market price at grant date. The amounts for share units were expensed on a straight-line basis over the vesting period, based on estimates of share units that will eventually vest. The expected volatility was 3 %.
Fair Value at Grant Date
CHF
E-STIP 2011 1 502 865 E-STIP 2012 2 474 032E-STIP 2013 1 728 885
STIP Achievement in 2014 For Executive Committee members, the financial targets resulted in a 78.93 % achievement (2013: 89.63%)
Note that the aggregate amount of variable short-term compensation (cash STIP and E-STIP) to be paid to the Executive Committee in 2015 for the financial year 2014 will be submitted for the binding approval of shareholders at the AGM 2015 on 8 April 2015.
FINANCIAL REPORT
Click Note

61 LONZA ANNUAL REPORT 2014
Compensation of the Board of Directors
Objective and Benchmarks Based on the analysis performed by the consulting firm New Bridge Street (NBS), the Lonza Nomination and Compensation Com-mittee (NCC) determined that in 2014, the NCC would use benchmark data of Swiss companies (various sectors) that are similar in size to Lonza in determining competitive Board of Directors Compensation. Lonza’s objective is to pay the members of the Board of Directors at the market median of this benchmark group1.
Overall Structure and Level of Compensation The overall structure and level of compensation of the Board of Directors did not change between 2005 and 2012. In 2013, the gross compensation of the Board of Directors was reduced by 20 %. This level of compensation was maintained in 2014. However, based on the competitive benchmark data provided by NBS, the compensation level for the Chairman of the Board of Directors was shown to be below the targeted market median. For 2014, the Chairman’s fee was, therefore, increased to bring the compensation into line with the median of the peer group described above.
For the period from the AGM 2014 to the AGM 2015, the members of the Board of Directors will receive fixed gross compensation for Board of Directors member-ship and additional compensation for committee appointments chairperson and committee memberships as described below:
AGM 2014 to AGM 20152
Position Annual Fee Additional Committee Membership Fee
Additional Committee Chairperson Fee
Board of Directors Member CHF 200 000 CHF 40 000 CHF 80 000Chairman of the Board of Directors CHF 450 000
The compensation of the Chairman of the Board of Directors includes his remu-neration as a member of the Innovation and Technology Committee of the Board of Directors. The Committee Chairperson fee includes the annual fee plus the Additional Chairperson fee for a total of CHF 280 000.
Board of Director compensation is paid in four installments at the end of June, September, December and March; 50% of the compensation is paid in cash and 50% in shares. In 2014, the number of granted shares was calculated based on the average closing share price of the last five business days of each quarter with a dis-count of 20%. The number of shares granted for Board of Directors compensation paid on or after 1 April 2015 will be based on market value and the 20% discount will no longer apply. The shares restrictions lapse after three years of the grant date and are eligible for a dividend. This structure of Board of Director compensation is closely aligned with our shareholders’ interests.
The members of the Board of Directors do not receive variable compensation.
The members of the Board of Directors are reimbursed for travel and other related expenses associated with their responsibilities as members of the Board of Direc-tors of Lonza.
Geberit AG, The Swatch Group SA, Clariant AG, Panalpina Welttransport (Holding) AG, Sika AG, ARYZTA AG, Barry Callebaut AG, Givaudan SA, Sulzer Ltd, Georg Fisher AG, Emmi AG, O C Oerlikon Corporation AG, Logitech International S.A., Actelion Ltd., Sonova Holding AG, Forbo Holding AG, Nobel Biocare Holding AG.
1
Refer to Section 3.3 of the Remuneration Report regarding total compensation (including national employer social contributions) provided to the Board of Directors in financial year 2014. The table to the left represents the time period from AGM 2014 to AGM 2015 and does not include social contributions of the employer.
2
FINANCIAL REPORT
Click Note

62 LONZA ANNUAL REPORT 2014
Development of Compensation for Board of Directors 2014
Grant date Total number of shares
Share priceCHF
Fair values of shares
1 Cash CHF
Total CHF
Blocked until
31 03 2014 3 442 89.98 309 711 275 000 584 711 31 03 201730 06 2014 3 576 96.22 344 083 311 250 655 333 30 06 201730 09 2014 2 966 114.92 340 853 311 250 652 103 30 09 201731 12 2014 3 076 111.28 342 297 311 250 653 547 31 12 2017
Total 13 060 102.37 1 336 944 1 208 750 2 545 694
The amount of CHF 2 545 694 was recognized as an expense in the year 2014.
Development of Compensation for Board of Directors 2013
Grant date Total number of shares
Share priceCHF
Fair values of shares
1 Cash CHF
Total CHF
Blocked until
31 03 2013 8 146 61.33 499 594 165 000 664 594 31 03 201630 06 2013 4 221 69.96 295 301 262 500 557 801 30 06 201630 09 2013 3 961 74.30 294 304 262 500 556 802 30 09 201631 12 2013 3 688 83.98 309 718 275 000 584 718 31 12 2016
Total 20 016 69.89 1 398 915 965 000 2 363 915
The amount of CHF 2 363 915 was recognized as an expense in the year 2013.
Development of Compensation for Board of Directors 2012
Grant date Total number of shares
Share priceCHF
Fair values of shares
1 Cash CHF
Total CHF
Blocked until
31 03 2012 9 715 46.74 454 079 180 000 634 079 31 03 201530 06 2012 13 779 38.57 531 456 175 000 706 456 30 06 201530 09 2012 10 006 49.84 498 699 210 000 708 699 30 09 201531 12 2012 9 885 49.49 489 228 175 000 664 228 31 12 2015
Total 43 385 45.49 1 973 462 740 000 2 713 462
The amount of CHF 2 713 462 was recognized as an expense in the year 2012.
Development of Compensation for Board of Directors 2011
Grant date Total number of shares
Share priceCHF
Fair values of shares
1 Cash CHF
Total CHF
Blocked until
31 03 2011 5 334 77.12 411 358 150 000 561 358 31 03 201430 06 2011 6 845 62.34 426 717 230 000 656 717 30 06 201430 09 2011 8 118 55.78 452 822 180 000 632 822 30 09 201431 12 2011 7 198 54.80 394 450 245 000 639 450 31 12 2014
Total 27 495 61.30 1 685 347 805 000 2 490 347
The amount of CHF 2 490 347 was recognized as an expense in the year 2011.
Recognition in the Consolidated Financial Statements All the equity-settled share-based payments had an impact on the 2014 “Profit before income taxes” amounting to an expense of CHF 11 million (2013: CHF 10 million).
Excluding social security and withholding tax1
FINANCIAL REPORT
Click Note

63 LONZA ANNUAL REPORT 2014
24 CHANGES IN SHARES AND SHARE CAPITAL MOVEMENTS
Number of shares 31 12 2014 Change in year
31 12 2013 Change in year
31 12 2012
Total number of shares 52 920 140 0 52 920 140 0 52 920 140
Treasury sharesShares reserved for share purchase plan (ESPP) 86 785 (860) 87 645 (17 119) 104 764Shares reserved for long-term incentive plan (LTIP) 113 845 0 113 845 0 113 845Free shares 704 998 (38 454) 743 452 (41 678) 785 130Total treasury shares 905 628 (39 314) 944 942 (58 797) 1 003 739
Total shares ranking for dividend at 31 December 52 014 512 39 314 51 975 198 58 797 51 916 401
Transferred shares between January and date of dividend payment of following year n.a 8 382 19 512
Total shares ranking for dividend at date of dividend payment n.a 51 983 580 51 935 913
Share capital movementsShare capital CHF 52 920 140 0 52 920 140 0 52 920 140
The share capital on 31 December 2014 comprised 52 920 140 registered shares with a par value of CHF 1 each (2013: 52 920 140 registered shares with a par value of CHF 1 each), amounting to CHF 52 920 140 (2013: CHF 52 920 140).
Contingent Capital The share capital of Lonza Group Ltd may be increased through the issuance of a maximum of 5 029 860 fully paid in registered shares with a par value CHF 1 each up to a maximum aggregate amount of CHF 5 029 860.
Authorized Capital The Board of Directors shall be authorized to increase, at any time until 9 April 2015, the share capital of Lonza Group Ltd through the issuance of a maximum of 5 000 000 fully paid-in registered shares with a par value of CHF 1 each up to a maximum aggregate amount of CHF 5 000 000. The capital increases in the form of contingent capital and authorized capital may increase the share capital of Lonza Group Ltd by a maximum aggregate amount of CHF 5 029 860. The details and conditions are set out in Articles 4bis to 4quater of the Company’s Articles of Association.
At 31 December 2014, Lonza Group Ltd had a fully paid-in registered capital of CHF 52 920 140 and a contingent capital of CHF 5 029 860.
Reserves in the amount of CHF 26 460 070 (2013: CHF 26 460 070) included in the financial statements of the parent company cannot be distributed.
Dividend A dividend per share of CHF 2.50 (2013: CHF 2.15) is proposed after the balance sheet date.
FINANCIAL REPORT
Click Note
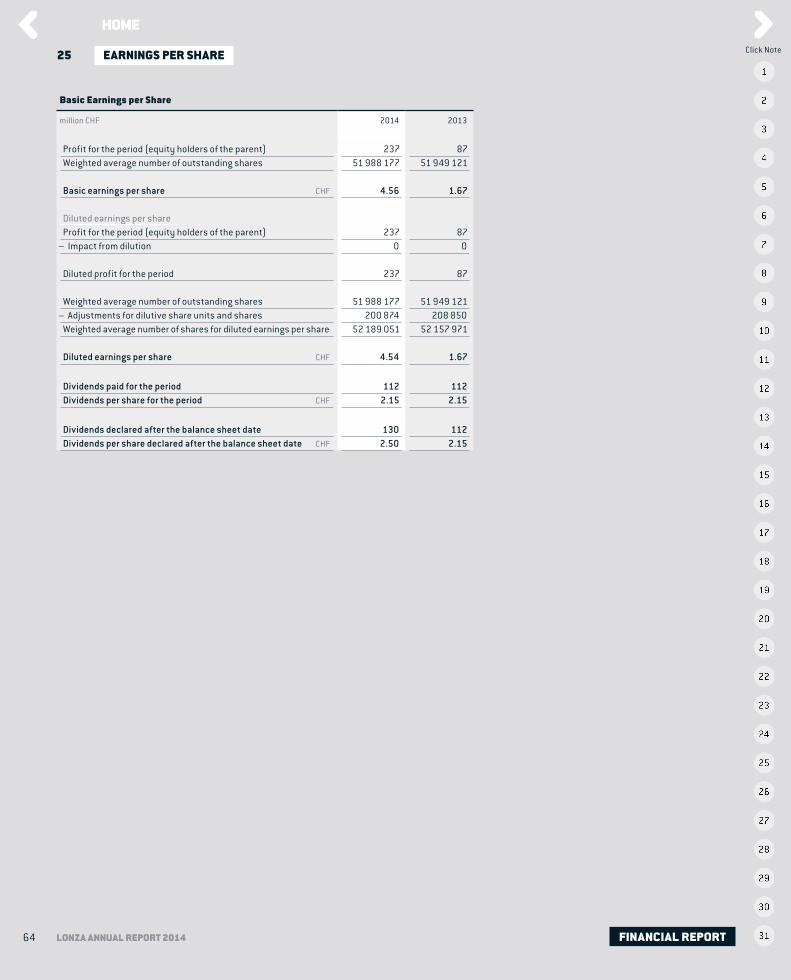
64 LONZA ANNUAL REPORT 2014
25 EARNINGS PER SHARE
Basic Earnings per Share
million CHF 2014 2013
Profit for the period (equity holders of the parent) 237 87Weighted average number of outstanding shares 51 988 177 51 949 121
Basic earnings per share CHF 4.56 1.67
Diluted earnings per shareProfit for the period (equity holders of the parent) 237 87
– Impact from dilution 0 0
Diluted profit for the period 237 87
Weighted average number of outstanding shares 51 988 177 51 949 121– Adjustments for dilutive share units and shares 200 874 208 850
Weighted average number of shares for diluted earnings per share 52 189 051 52 157 971
Diluted earnings per share CHF 4.54 1.67
Dividends paid for the period 112 112Dividends per share for the period CHF 2.15 2.15
Dividends declared after the balance sheet date 130 112Dividends per share declared after the balance sheet date CHF 2.50 2.15
FINANCIAL REPORT
Click Note

65 LONZA ANNUAL REPORT 2014
26 RELATED PARTIES
Identity of Related Parties The Group has a related-party relationship with as-sociates, joint ventures (see note 6), pension and other post retirement plans (see note 22) as well as with the Board of Directors and the members of the Executive Committee.
Transactions with Key Management Personnel
Board of Directors In 2014 payments to acting members of the Board of Direc-tors of Lonza Group Ltd totaled CHF 2.770 million1 (2013: CHF 2.463 million¹), 48.27 % (2013: 56.80 %) of which was received in the form of shares. In previous years the Board of Directors members could choose to be paid i) either 40 % cash and 60 % in shares or ii) 100 % in shares. Since April 2013 the director’s fee is paid 50 % in cash and 50 % in shares. Shares granted are valued at the relevant market price at grant date. The shares vest after three years of the date of the grant and are eligible for a dividend. Members of the Board of Directors and their immediate relatives control 118 739 (2013: 123 424 ) or 0.22% (2013: 0.23 %) of the voting shares of Lonza Group Ltd. None of the directors owns shares in the Group’s subsidiaries or associates.
Executive Committee Compensation One member of the acting members of the Executive Committe left Lonza in 2014. In 2013 three of the acting members of the Executive Committee gave up their functional roles. In addition, a termina-tion agreement was agreed upon in 2013 with a former member of the Executive Committee who left Lonza in 2012. One new member joined the Executive Com-mittee in 2014. The acting members of the Executive Committee received, for their contributions and time served in 2014, CHF 5.210 million1 (2013: CHF 5.022 million¹) in cash and additional benefits as well as 47 861 LTIP shares granted (2013: 82 055 shares) and a not-yet-defined number of E-STIP shares, equivalent to a value of CHF 2.746 million (2013: CHF 2.773 million). Termination benefits according to the termination agreements of the members of the Executive Com-mittee are not included in these amounts.
The compensation for the Board of Directors and the Executive Committee (termination benefits included) was as follows:
million CHF 2014 2013
Short-term benefits 2 5.764 5.113Post-employment benefits 3 0.878 0.973Termination benefits 0.999 5.179Share-based payments 4.084 4.172Total 11.725 15.437
The remuneration is included in “Personnel expenses” (note 17). For additional information, please refer to the Remuneration Report.
Including social security and withholding tax 1
Including incentive payout in March of the following year. Including contribution for social security and pension fund.
2
3
FINANCIAL REPORT
Click Note

66 LONZA ANNUAL REPORT 2014
27 FINANCIAL RISK MANAGEMENT
27.1 OVERALL RISK MANAGEMENT POLICY
Lonza is exposed in particular to credit and liquidity risk as well as to risks from movements in foreign currency exchange rates, interest rates and market prices that affect its assets, liabilities, and forecasted transactions. Lonza’s overall risk manage-ment policy aims to limit these risks through operational and finance activities.
The Board of Directors has overall responsibility for the establishment and oversight of Lonza’s risk management framework. Financial risk management is carried out by a central treasury department (Group Treasury). Group Treasury is responsible for implementing the policy, and identifies, evaluates and hedges financial risks in close cooperation with Lonza’s business units. Group Treasury also has the sole responsibility for carrying out foreign exchange transactions and executing financial derivative transactions with third parties.
Lonza’s risk management policies are established to identify and analyze the risks faced by Lonza, to set appropriate risk limits and controls, and to monitor risks and adherence to limits. Risk management policies and systems are reviewed regularly to reflect changes in market conditions and Lonza’s activities.
Lonza Audit Committee oversees how management monitors compliance with Lonza’s risk management policies and procedures and reviews the adequacy of the risk management framework in relation to the risks faced by Lonza. Lonza Audit Committee is assisted in its oversight role by Internal Audit. Internal Audit undertakes both regular and ad hoc reviews of risk management controls and procedures, the results of which are reported to the Audit Committee.
27.2 CREDIT RISK
Credit risk is the risk of financial loss to Lonza if a customer or counterparty to a financial instrument fails to meet its contractual obligations. It mainly arises from Lonza’s receivables from customers.
Accounts Receivable Lonza’s exposure to credit risk is influenced mainly by the individual characteristics of each customer. Risk control assesses the credit quality of the customer, taking into account its financial position, past experience and other factors. In monitoring customer credit risk, customers are grouped according to their credit characteristics, including geographic location, industry, and existence of previous financial difficulties.
Purchase limits are established for each customer, which represent the maximum open amount without requiring approval from the Audit Committee; these limits are reviewed regularly. For customers domiciled in specific countries with high risk, Lonza has credit risk insurance covering the maximum exposure.
FINANCIAL REPORT
Click Note

67 LONZA ANNUAL REPORT 2014
The maximum credit risk is equal to the carrying amount of the respective assets. There are no commitments that could increase this exposure to more than the carrying amounts. In general, Lonza does not require collateral in respect of trade and other receivables, but uses credit insurance for country risk where appropriate.
Lonza establishes an allowance for impairment that represents its estimate of in-curred losses in respect of trade and other receivables. The allowance is based only on the specific loss component that relates to individually significant exposures. There is no collective impairment recognized.
Financial Instruments and Cash Deposits Credit risk from balances with banks and financial institutions is managed by the Group’s treasury department in ac-cordance with the Group’s treasury policy. The credit rating of Lonza Group’s counterparties must be at least:
Standard & Poor’s: AMoody’s: A1
Counterparty credit ratings are reviewed regularly.
The carrying amount of financial assets represents the maximum credit exposure. The maximum exposure to credit risk at the reporting date was as follows:
million CHF 2014 2013
Loans and receivablesTrade receivables, net 622 559Other receivables 54 56Current advances 0 3Non-current loans and advances 1 69Cash and cash equivalents 209 306Total loans and receivables 886 993
Financial assets at fair value
Financial assets at fair value through profit or loss – held for trading:Currency-related instruments1 9 11Interest-related instruments1 0 15Total financial assets at fair value through profit or loss – held for trading 9 26
Financial assets effective for hedge accounting purposes:Commodity-related instruments1 0 1Total financial assets effective for hedge accounting purposes 0 1
Total financial assets at fair value 9 27
Total 895 1 020
Included in “Other receivables, prepaid expenses and accrued income” (see note 10).
1
FINANCIAL REPORT
Click Note

68 LONZA ANNUAL REPORT 2014
27.3 LIQUIDITY RISK
Liquidity risk is the risk that Lonza will not be able to meet its financial obligations as they fall due. Lonza’s approach to managing liquidity is to ensure that it will always have sufficient liquidity to meet its liabilities when due, under both normal and stressed conditions, without incurring unacceptable losses or risking damage to Lonza’s reputation. Group Treasury maintains flexibility in funding also using bilateral and syndicated credit lines. Lonza has concluded the following lines of credit: Committed credit lines of CHF 977 million (CHF 211 million used as of 31 December 2014). Lines are committed for up to four years. Uncommitted credit lines of CHF 185 million (CHF 0 used as of 31 December 2014) with a maturity of one year.
The table below analyzes the Group’s financial liabilities and derivative financial liabilities in relevant maturity groupings, based on the remaining period at the balance sheet date to the contractual maturity date. The amounts disclosed in the table are the contractual undiscounted cash flows, including interest payments. Balances due within 12 months are equal to their carrying balances, as the impact of discounting is not significant.
31 December 2014
million CHF Carrying amount
1 Contractual cash flows
Between 0 and 6 months
Between 7 and 12 months
Between 1 and 2 years
Between 2 and 3 years
Between 3 and 5 years
Over 5 years
Financial liabilitiesStraight bond (2010–2016) 399 424 12 0 412 0 0 0Straight bond (2011–2015) 240 245 0 245 0 0 0 0Straight bond (2011–2018) 139 158 0 4 4 4 146 0Straight bond (2012–2018) 199 216 0 4 4 4 204 0Straight bond (2012–2022) 105 130 0 3 3 3 6 115Straight bond (2013–2019) 299 326 5 0 5 5 311 0Syndicated loan (2011–2018) 121 130 0 1 1 1 127 0German Private Placement 213 220 2 162 1 8 42 5Other debt due to banks and financial institutions 175 182 101 2 79 0 0 0Other debt due to others 326 370 35 4 8 165 4 154Finance lease liabilities 5 10 0 0 0 0 2 8Total debt 2 221 2 411 155 425 517 190 842 282Trade payables 262 262 262 0 0 0 0 0Other current liabilities 2 646 646 646 0 0 0 0 0Total financial liabilities 3 129 3 319 1 063 425 517 190 842 282
Including interest payments. Including negative fair values of derivative financial instruments according to note 27.5
1
2
FINANCIAL REPORT
Click Note

69 LONZA ANNUAL REPORT 2014
31 December 2013
million CHF Carrying amount
1 Contractual cash flows
Between 0 and 6 months
Between 7 and 12 months
Between 1 and 2 years
Between 2 and 3 years
Between 3 and 5 years
Over 5 years
Financial liabilitiesStraight bond (2010–2016) 399 436 12 0 12 412 0 0Straight bond (2011–2015) 239 251 0 5 246 0 0 0Straight bond (2011–2018) 139 162 0 4 4 4 150 0Straight bond (2012–2018) 199 220 0 4 4 4 208 0Straight bond (2012–2022) 105 133 0 3 3 3 6 118Straight bond (2013–2019) 299 332 5 0 5 5 11 306Syndicated loan (2011–2018) 314 341 2 2 4 4 329 0German Private Placement 201 213 2 3 153 1 49 5Arch acquisition bridge financing 104 106 1 105 0 0 0 0Other debt due to banks and financial institutions 167 177 92 2 14 69 0 0Other debt due to others 311 363 46 4 8 8 151 146Finance lease liabilities 4 10 0 0 0 0 2 8Total debt 2 481 2 744 160 132 453 510 906 583Trade payables 286 286 286 0 0 0 0 0Other current liabilities 2 507 507 507 0 0 0 0 0Total financial liabilities 3 274 3 537 953 132 453 510 906 583
27.4 MARKET RISK
Market risk is the risk that changes in market prices will affect Lonza’s income or the value of its holdings of financial instruments. Lonza is exposed to market risk from changes in currency exchange and interest rates and commodities. The objective of market risk management is to manage and control market risk expo-sures within acceptable parameters, while optimizing the return on risk. Lonza has established a treasury policy of which the objective is to reduce the volatility relating to these exposures. Lonza enters into various derivative transactions based on Lonza’s treasury policy that establishes guidelines in areas such as counterparty exposure and hedging practices. Counterparties to agreements are major interna-tional financial institutions with at least single-A rating. Positions are monitored using techniques such as market value and sensitivity analyses. All such transactions are carried out within the guidelines set by the Audit Committee.
Foreign Exchange Risk The Group operates across the world and is exposed to movements in foreign currencies affecting the Group financial result and the value of Group’s equity. Foreign exchange risk arises because the amount of local currency paid or received for transactions denominated in foreign currencies may vary due to changes in exchange rates (transaction exposures) and because the foreign currency denominated financial statements of the Group’s foreign sub-sidiaries may vary upon consolidation into the Swiss-franc-denominated Group Financial Statements (translation exposures). Foreign exchange risks arise primarily on transactions that are denominated in USD, EUR and GBP.
Including interest payments Including negative fair values of derivative financial instruments according to note 27.5
1
2
FINANCIAL REPORT
Click Note

70 LONZA ANNUAL REPORT 2014
In managing its exposure regarding the fluctuation in foreign currency exchange rates, Lonza has entered into a variety of currency swaps and forward contracts. These agreements generally include the exchange of one currency against another currency at a future date. Lonza adopts a policy of hedging 100 % of the committed contractual exposure. The hedging of the planned contractual exposure depends on Lonza’s view of the market.
The table below shows the impact on post-tax profit if at 31 December a currency had strengthened (+) or weakened (–) versus the Swiss franc, with all other variables held constant as a result of the currency exposures outlined in the tables below:
Currency Sensitivity Post-tax profit
million CHF2014 2013
+ – + –USD + / – 10 % (1.7) 1.7 (4.1) 4.1EUR + / – 10 % (0.7) 0.7 (1.3) 1.3GBP + / – 10 % 3.2 (3.2) 2.6 (2.6)
31 December 2014
million CHF USD GBP EUR DKK SGD CAD Other Total
Trade receivables, net 112 38 88 1 0 4 1 244Other receivables, prepaid expenses and accrued income 4 8 10 0 0 0 0 22Cash and cash equivalents 18 6 16 1 0 0 1 42Non-current debt 1 0 0 (41) 0 0 0 0 (41)Other non-current liabilities 1 0 0 0 0 0 0 1Other current liabilities (33) (6) (43) 0 0 (1) 0 (83)Trade payables (26) (1) (32) 0 0 0 (3) (62)Current debt 1 (3) 0 (40) 0 0 0 0 (43)Gross balance sheet exposure 73 45 (42) 2 0 3 (1) 80
Currency-related instruments (93) (7) 34 0 0 0 0 (66)
Net exposure (20) 38 (8) 2 0 3 (1) 14
The acquisition bridge financing and a part of the German Private Placement were raised in USD by Lonza Swiss Finance Ltd, which granted a USD loan of the same amount to Lonza America Inc. As a result, there is no foreign currency exposure in the consolidated income statement associated with the acquisition bridge financing as well as the USD portion of the German Private Placement.
1
FINANCIAL REPORT
Click Note
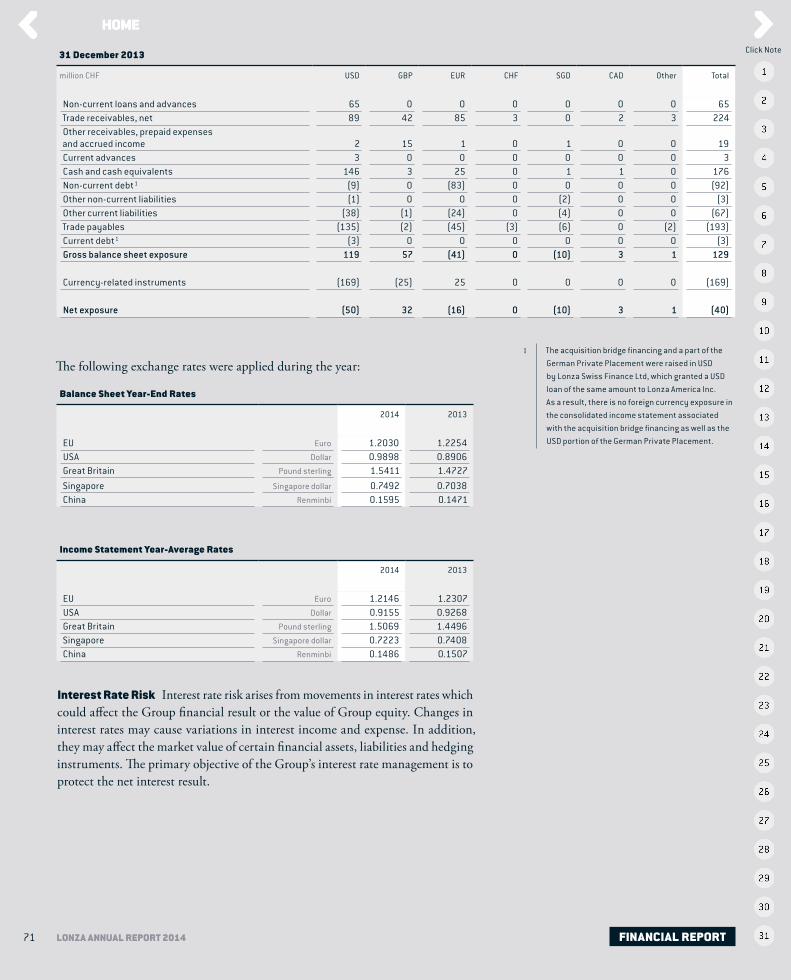
71 LONZA ANNUAL REPORT 2014
31 December 2013
million CHF USD GBP EUR CHF SGD CAD Other Total
Non-current loans and advances 65 0 0 0 0 0 0 65Trade receivables, net 89 42 85 3 0 2 3 224Other receivables, prepaid expenses and accrued income 2 15 1 0 1 0 0 19Current advances 3 0 0 0 0 0 0 3Cash and cash equivalents 146 3 25 0 1 1 0 176Non-current debt 1 (9) 0 (83) 0 0 0 0 (92)Other non-current liabilities (1) 0 0 0 (2) 0 0 (3)Other current liabilities (38) (1) (24) 0 (4) 0 0 (67)Trade payables (135) (2) (45) (3) (6) 0 (2) (193)Current debt 1 (3) 0 0 0 0 0 0 (3)Gross balance sheet exposure 119 57 (41) 0 (10) 3 1 129
Currency-related instruments (169) (25) 25 0 0 0 0 (169)
Net exposure (50) 32 (16) 0 (10) 3 1 (40)
The following exchange rates were applied during the year:
Balance Sheet Year-End Rates
2014 2013
EU Euro 1.2030 1.2254USA Dollar 0.9898 0.8906Great Britain Pound sterling 1.5411 1.4727Singapore Singapore dollar 0.7492 0.7038China Renminbi 0.1595 0.1471
Income Statement Year-Average Rates
2014 2013
EU Euro 1.2146 1.2307USA Dollar 0.9155 0.9268Great Britain Pound sterling 1.5069 1.4496Singapore Singapore dollar 0.7223 0.7408China Renminbi 0.1486 0.1507
Interest Rate Risk Interest rate risk arises from movements in interest rates which could affect the Group financial result or the value of Group equity. Changes in interest rates may cause variations in interest income and expense. In addition, they may affect the market value of certain financial assets, liabilities and hedging instruments. The primary objective of the Group’s interest rate management is to protect the net interest result.
The acquisition bridge financing and a part of the German Private Placement were raised in USD by Lonza Swiss Finance Ltd, which granted a USD loan of the same amount to Lonza America Inc. As a result, there is no foreign currency exposure in the consolidated income statement associated with the acquisition bridge financing as well as the USD portion of the German Private Placement.
1
FINANCIAL REPORT
Click Note

72 LONZA ANNUAL REPORT 2014
Lonza’s policy is to manage interest cost using a mix of fixed and variable rate debt. Group policy is to maintain at least 50 % of its borrowings in fixed-rate instru-ments. In order to manage this mix in a cost-efficient manner, Lonza enters into interest rate swaps and cross-currency interest rate swaps to exchange at specified intervals, the difference between fixed and variable interest amounts calculated by reference to a corresponding notional principal amount. Lonza adopts a policy of having one-third of the debt on a short-term basis and two-thirds of the debt on a long-term basis. The mix between floating and fixed rates depends on the market view of Lonza.
Lonza’s exposure to interest rate risk was as follows, based on significant carrying amounts outlined in note 13:
Borrowings Denominated in
million CHF Total debt 1Debt at fixed interest rates Interest risk exposure
2014 2013 2014 2013 2014 2013
CHF 1 618 1 785 1 001 1 000 617 785USD 520 577 353 319 167 258EUR 81 83 81 83 0 0
The table below shows the impact on post-tax profit if at 31 December interest rates had been 100 basis points higher (+) or lower (–) with all other variables held constant:
Borrowings Denominated in
million CHF Sensitivity Post-tax profit
2014 2013
+ – + –CHF + / – 1 % (5.2) 5.2 (6.5) 6.5USD + / – 1 % (1.4) 1.4 (2.1) 2.1EUR + / – 1 % 0.0 0.0 0.0 0.0
Commodity Price Risk Lonza needs liquefied petroleum gas (LPG) as raw material for a cracker in Visp (CH). Butane, naphtha or propane can be used as feedstock for the cracker. The raw material ultimately used depends on its availability and specifications. The annual demand is approximately 110 000 metric tons. In order to minimize the risk of higher raw material prices, Lonza hedges the butane price risk via swaps. At 31 December 2014, if the butane price had weakened / strengthened by 10 %, with all other variables held constant, other comprehensive income would have been CHF 1 million lower / higher (2013: CHF 1 million lower / higher).
including effects from interest rate swaps and cross currency interest rate swaps.
1
FINANCIAL REPORT
Click Note

73 LONZA ANNUAL REPORT 2014
27.5 OVERVIEW OF DERIVATIVE FINANCIAL INSTRUMENTS
The following table shows the contract or underlying principal amounts and fair values of derivative financial instruments by type of contract at 31 December 2014 and 2013. Contract or underlying principal amounts indicate the volume of business outstanding at the balance sheet date and do not represent amounts at risk. The fair values are determined by using the difference of the prices fixed in the outstanding derivative contracts from the actual market conditions that would have been applied at the year-end if we had to recover these trades.
Financial Instruments at Fair Value Through Profit or Loss – Held for Trading
million CHF Contract or underlying principal amount
Positive fair values
Negative fair values
Total net fair values
2014 2013 2014 2013 2014 2013 2014 2013
Currency-related instruments– Forward foreign exchange rate contracts 27 25 0 0 0 0 0 0 – Currency swaps 155 441 9 11 (19) (2) (10) 9
Total currency-related instruments 182 466 9 11 (19) (2) (10) 9
Interest-related instruments– Interest rate swaps 120 108 0 0 (1) (1) (1) (1)– Cross currency interest rate swaps 579 580 0 15 (41) 0 (41) 15
Total interest-related instruments 699 688 0 15 (42) (1) (42) 14
Total financial instruments at fair value through profit or loss – held for trading 881 1 154 9 26 (61) (3) (52) 23
Financial Instruments Effective for Hedge-Accounting Purposes
million CHF Contract or underlying principal amount
Positive fair values
Negative fair values
Total net fair values
2014 2013 2014 2013 2014 2013 2014 2013
Commodity-related instruments– Butane swap 15 0 0 0 (7) 0 (7) 0 – Naphtha swap 10 9 0 1 (4) 0 (4) 1 – Propane swap 0 8 0 0 0 0 0 0
Total commodity-related instruments 25 17 0 1 (11) 0 (11) 1
Total financial instruments effective for hedge-accounting purposes 25 17 0 1 (11) 0 (11) 1
FINANCIAL REPORT
Click Note
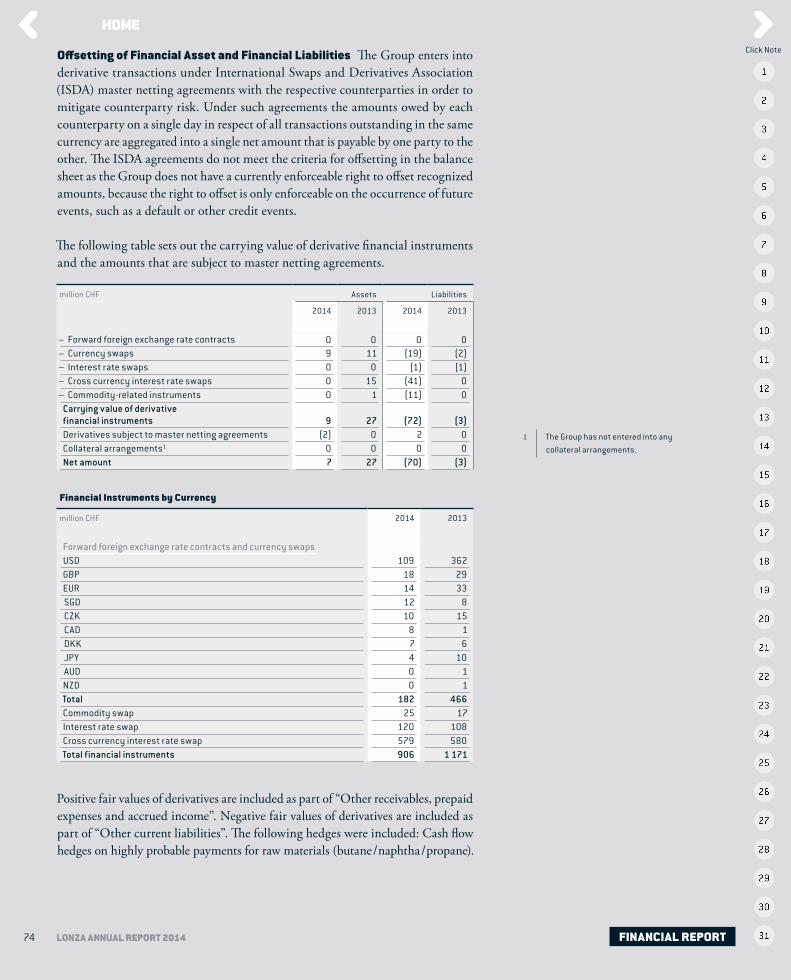
74 LONZA ANNUAL REPORT 2014
Offsetting of Financial Asset and Financial Liabilities The Group enters into derivative transactions under International Swaps and Derivatives Association (ISDA) master netting agreements with the respective counterparties in order to mitigate counterparty risk. Under such agreements the amounts owed by each counterparty on a single day in respect of all transactions outstanding in the same currency are aggregated into a single net amount that is payable by one party to the other. The ISDA agreements do not meet the criteria for offsetting in the balance sheet as the Group does not have a currently enforceable right to offset recognized amounts, because the right to offset is only enforceable on the occurrence of future events, such as a default or other credit events.
The following table sets out the carrying value of derivative financial instruments and the amounts that are subject to master netting agreements.
million CHF Assets Liabilities
2014 2013 2014 2013
– Forward foreign exchange rate contracts 0 0 0 0 – Currency swaps 9 11 (19) (2)– Interest rate swaps 0 0 (1) (1)– Cross currency interest rate swaps 0 15 (41) 0 – Commodity-related instruments 0 1 (11) 0
Carrying value of derivative financial instruments 9 27 (72) (3)Derivatives subject to master netting agreements (2) 0 2 0 Collateral arrangements1 0 0 0 0 Net amount 7 27 (70) (3)
Financial Instruments by Currency
million CHF 2014 2013
Forward foreign exchange rate contracts and currency swapsUSD 109 362 GBP 18 29 EUR 14 33 SGD 12 8 CZK 10 15 CAD 8 1 DKK 7 6 JPY 4 10 AUD 0 1 NZD 0 1 Total 182 466 Commodity swap 25 17 Interest rate swap 120 108 Cross currency interest rate swap 579 580 Total financial instruments 906 1 171
Positive fair values of derivatives are included as part of “Other receivables, prepaid expenses and accrued income”. Negative fair values of derivatives are included as part of “Other current liabilities”. The following hedges were included: Cash flow hedges on highly probable payments for raw materials (butane / naphtha / propane).
The Group has not entered into any collateral arrangements.
1
FINANCIAL REPORT
Click Note
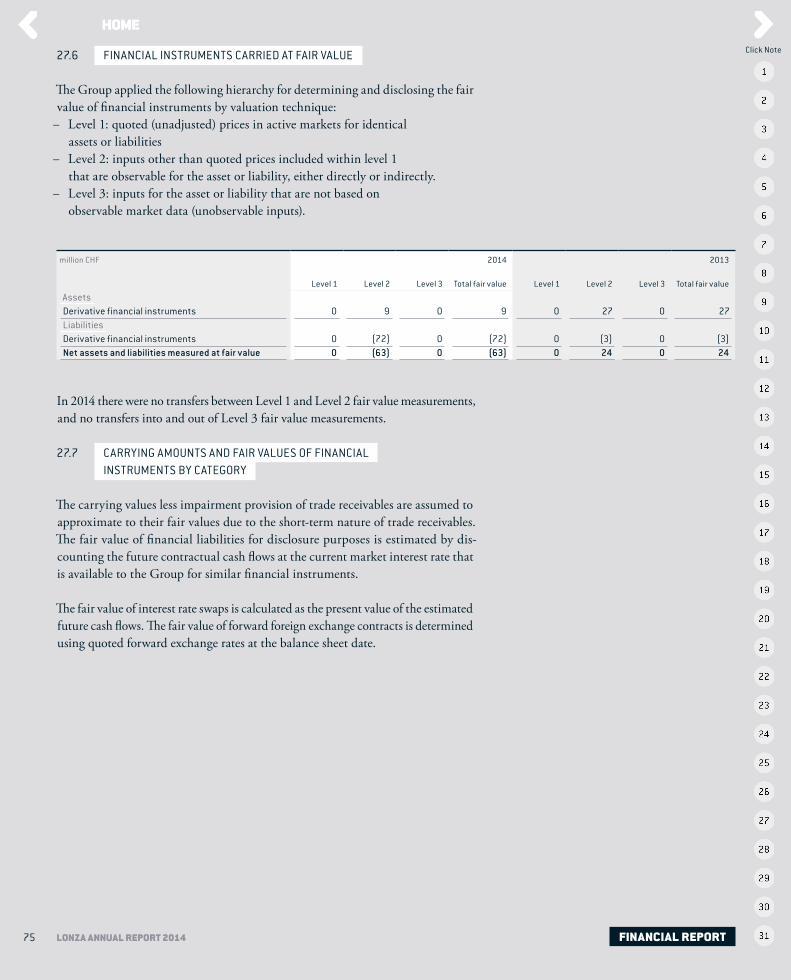
75 LONZA ANNUAL REPORT 2014
27.6 FINANCIAL INSTRUMENTS CARRIED AT FAIR VALUE
The Group applied the following hierarchy for determining and disclosing the fair value of financial instruments by valuation technique: – Level 1: quoted (unadjusted) prices in active markets for identical
assets or liabilities – Level 2: inputs other than quoted prices included within level 1
that are observable for the asset or liability, either directly or indirectly. – Level 3: inputs for the asset or liability that are not based on
observable market data (unobservable inputs).
million CHF
Level 1
Level 2
Level 3
2014
Total fair value
Level 1
Level 2
Level 3
2013
Total fair value
AssetsDerivative financial instruments 0 9 0 9 0 27 0 27 LiabilitiesDerivative financial instruments 0 (72) 0 (72) 0 (3) 0 (3)Net assets and liabilities measured at fair value 0 (63) 0 (63) 0 24 0 24
In 2014 there were no transfers between Level 1 and Level 2 fair value measurements, and no transfers into and out of Level 3 fair value measurements.
27.7 CARRYING AMOUNTS AND FAIR VALUES OF FINANCIAL INSTRUMENTS BY CATEGORY
The carrying values less impairment provision of trade receivables are assumed to approximate to their fair values due to the short-term nature of trade receivables. The fair value of financial liabilities for disclosure purposes is estimated by dis-counting the future contractual cash flows at the current market interest rate that is available to the Group for similar financial instruments.
The fair value of interest rate swaps is calculated as the present value of the estimated future cash flows. The fair value of forward foreign exchange contracts is determined using quoted forward exchange rates at the balance sheet date.
FINANCIAL REPORT
Click Note

76 LONZA ANNUAL REPORT 2014
The table below shows the carrying amounts and fair values of financial instruments by category.
Carrying Amounts and Fair Values of Financial Instruments by Category
million CHF Carrying amount Fair value
31 12 2014 31 12 2013 31 12 2014 31 12 2013
Financial assets – available for saleOther investments – available for sale – carried at cost 7 6 7 6Total financial assets – available for sale 7 6 7 6
Loans and receivablesTrade receivables, net 622 559 622 559Other receivables 54 56 54 56Current advances 0 3 0 3Non-current loans 1 69 1 69Cash and cash equivalents 209 306 209 306Total loans and receivable 886 993 886 993
Financial assets at fair value
Financial assets at fair value through profit or loss – held for trading:Currency-related instruments 9 11 9 11Interest-related instruments 0 15 0 15Total financial assets at fair value through profit or loss – held for trading 9 26 9 26
Financial assets effective for hedge accounting purposes:Commodity-related instruments 0 1 0 1Total financial assets effective for hedge accounting purposes 0 1 0 1
Total financial assets at fair value 9 27 9 27
Financial liabilities at amortized costDebt:
– Straight bonds1 1 381 1 380 1 447 1 440– Other debt 840 1 101 840 1 101
Current liabilities 574 504 574 504Trade payables 262 286 262 286Total financial liabilities at amortized cost 3 057 3 271 3 123 3 331
Financial liabilities at fair value
Financial liabilities at fair value through profit or loss – held for trading:Currency-related instruments 19 2 19 2Interest-related instruments 42 1 42 1Total financial liabilities at fair value through profit or loss – held for trading 61 3 61 3
Financial liabilities effective for hedge accounting purposes:Commodity-related instruments 11 0 11 0Total financial liabilities effective for hedge accounting purposes 11 0 11 0
Total financial liabilities at fair value 72 3 72 3
The fair value of straight bonds for disclosure purposes is Level 1 and is calculated based on the observable market prices of the debt instruments.
1
FINANCIAL REPORT
Click Note

77 LONZA ANNUAL REPORT 2014
27.8 CAPITAL MANAGEMENT
The Board’s policy is to maintain a strong capital base so as to maintain investor, creditor and market confidence and to sustain future development of the business. The Board of Directors monitors both the demographic spread of shareholders and the return on capital, which Lonza defines as total shareholders’ equity, exclud-ing non-controlling interests, and the level of dividends to ordinary shareholders.
The Board seeks to maintain a balance between the higher returns that might be possible with higher levels of borrowing and the advantages and security afforded by a sound capital position. Lonza’s target is to achieve a return on shareholders’ equity of between 10 % and 15 %; in 2014, the return was 10.3 % (2013: 5.9 %). In comparison, the weighted average interest expense on interest-bearing borrowings (excluding liabilities with imputed interest) was 2.5 % (2013: 2.4 %).
From time to time, Lonza purchases its own shares on the market; the timing of these purchases depends on market prices. Primarily, the shares are intended to be used for issuing shares under Lonza’s share programs. Lonza does not have a defined share buy-back plan.
Neither Lonza Group Ltd nor any of its subsidiaries is subject to externally imposed capital requirements.
28 SHARE OWNERSHIP OF THE MEMBERS OF THE BOARD OF DIRECTORS AND THE EXECUTIVE COMMITTEE
Based on information available to Lonza, the members of the Board of Directors and parties closely associated with them1 held, as of 31 December 2014 a total of 118 739 (2013: 123 424) registered shares in Lonza Group Ltd and controlled 0.22 % (2013: 0.23 %) of the share capital. None of the members of the Board of Directors or the Executive Committee owns shares in the Group’s subsidiaries or associates.
The members of the Executive Committee and parties closely associated with them1 held 28 215 (2013: 28 919) shares and controlled 0.05 % (2013: 0.05 %) of the share capital. The individual control rights are proportional to the holdings shown below.
Spouse, children below 18, any legal entities that they own or otherwise control, or any legal or natural person who is acting as their fiduciary.
1
FINANCIAL REPORT
Click Note

78 LONZA ANNUAL REPORT 2014
Share ownership of acting members of the Board of Directors and Executive Committee as of 31 December 2014:
Board of Directors Executive Committee
Lonza shares (numbers) 2014 2013 Lonza shares (numbers) 2014 2013
Rolf Soiron 66 298 63 656 Richard Ridinger 14 000 14 000
Patrick Aebischer 13 977 12 245 Sven Abend 0
Werner Bauer 13 709 12 227 Marc Funk 1 685 1 627
Thomas Ebeling 2 459 977 Toralf Haag 11 489 11 489
Jean-Daniel Gerber 10 734 8 983 Beat In-Albon 1 041 3
Barbara Richmond 510 Stephan Kutzer 1 800
Margot Scheltema 5 608 4 336
Jürgen Steinemann 2 922
Antonio Trius 2 522 1 340
Peter Wilden 19 660
29 ENTERPRISE RISK MANAGEMENT
At their July meeting, the Board of Directors and Executive Committee were informed about the mid-year findings of the risk management process and the results of the risk portfolio management. At the November meeting, the Board of Directors and Executive Committee were provided the full year findings.
As a result of continuous risk remediation efforts and prevention efforts, several risks were fully mitigated and many others were downgraded from the category of major risk to minor risk. On the other hand, the continued global economic pressure, stronger regulatory focus as well as market and customer demand vola-tility in the markets which Lonza operates has led to reprioritization of certain mitigation activities.
The approach of embedding risk management in our routine behavior will be continued and driven in our everyday activity.
As a global innovator and clear technology leader in a number of fields, effective risk management is a challenging and key issue. Changes in personnel in the strategic business fields, operations involving critical chemicals, highly potent compounds and combined biologics and chemicals components, complex information systems and rapid technological advances, as well as the dynamic nature of the relevant markets, demand a critical assessment of the attendant risks on an ongoing basis.
Risk comprehension is a cornerstone of our business and ethical principles. It is also a requirement clearly expected from us, from all of our worldwide customer and particularly those in the Custom Manufacturing area.
FINANCIAL REPORT
Click Note

79 LONZA ANNUAL REPORT 2014
The protection of employees, the environment, production facilities, raw material supplies, distribution channels and information systems from imminent negative influences and the preparation of alternative production scenarios in case of un-foreseen events are prerequisites for the selection of Lonza as a partner.
Financial Risk Management is disclosed in note 27.
30 EVENTS AFTER THE BALANCE SHEET DATE
On 15 January 2015 the Swiss National Bank announced that it was discontinuing the minimum exchange rate of CHF 1.20 per Euro, which resulted in a significant strengthening of the Swiss franc against all major currencies in which Lonza oper-ates. As the Group uses the Swiss franc as presentation currency in its consolidated financial statements, a stronger Swiss franc will have a negative currency translation impact on Lonza’s consolidated results when reported in Swiss francs. The Group’s exposure to foreign currency exchange and interest rates as of 31 December 2014 as well as related sensitivity analyses are disclosed in note 27.4.
The Consolidated Financial Statements 2014 were approved for issue by the Board of Directors on 26 February 2015 and are subject to approval by the Annual Gen-eral Meeting on 8 April 2015.
FINANCIAL REPORT
Click Note

80 LONZA ANNUAL REPORT 2014
31 PRINCIPAL SUBSIDIARIES AND JOINT VENTURES
The principal subsidiaries and joint ventures are shown in the tables below:
Lonza Companies Town / Country Currency 1 Share capital in 000
Holding direct
%
Holding indirect
%
Arch Chemicals (China) Co., Ltd Suzhou, CN USD 19 2 100 %Arch Chemicals Canada Inc. Toronto, CA CAD 10 000 100 %Arch Chemicals Limited Castleford, GB GPB 1 000 100 %Arch Chemicals, Inc. Allendale, US USD 0.1 4 100 %Arch Chemicals Receivables LLC Wilmington, US USD n.a. 100 %Arch Personal Care Products, L.P. South Plainfield, US USD 0.1 5 100 %Arch Protection Chemicals Private Limited Mumbai, IN INR 1 300 4 100 %Arch Quimica Argentina S.R.L. Buenos Aires, AR ARS 9 911 100 %Arch Quimica Brasil Ltda Salto, BR BRL 30 388 100 %Arch Quimica Colombia S.A. Bogotá, CO COP 5 301 6 97 % Arch Timber Protection B.V. Wijchen, NL EUR 27.3 100 %Arch Treatment Technologies, Inc. Atlanta, US USD 0.1 3 100 %Arch UK Biocides Limited Castleford, GB GBP 1 644 100 %Arch Water Products France S.A.S. Amboise, FR EUR 460 100 %Arch Water Products South Africa (Proprietary) Limited Kempton Park, SA ZAR 100 100 %Arch Wood Protection (Aust) Pty Limited Trentham, AU AUD 0.08 3 100 %Arch Wood Protection (M) Sdn. Bhd. Kuala Lumpur, MY MYR 500 100 %Arch Wood Protection (NZ) Limited Auckland, NZ NZD 6 100 100 %Arch Wood Protection Canada Corp. Mississauga, CA CAD 0.1 3 100 %Arch Wood Protection (SA) (Proprietary) Limited Port Shepstone, SA ZAR 3 100 %Arch Wood Protection, Inc. Atlanta, US USD 0.1 3 100 %Gewerbepark Hochrhein GmbH Waldshut-Tiengen, DE EUR 10 400 100 %Hickson Ltd Castleford, GB GBP 108 161 100 %Lonza (China) Investments Co. Ltd Guangzhou, CN USD 75 500 100 % Lonza AG Visp, CH CHF 60 000 100 % Lonza America Inc. Allendale, US USD 8 100 % Lonza Australia Pty Ltd Mt. Waverley, AU AUD 90 100 %Lonza Benelux BV Breda, NL EUR 112 100 %Lonza Biologics Inc. Portsmouth, US USD 1 100 %Lonza Biologics plc Slough, GB GBP 14 500 100 %Lonza Biologics Porriño, S.L. Porriño, ES EUR 10 296 100 %Lonza Biologics Tuas Pte Ltd Singapore, SG USD 25 000 100 % SGD 172 000 Lonza BioPharma AG Visp, CH CHF 550 100 % Lonza Bioproducts AG Basel, CH CHF 100 100 % Lonza Bioscience SARL Saint-Beauzire, FR EUR 8 849 100 %
Abbreviation of currencies in accordance with ISO standards. No shares issued; capital is registered. No par value or not provided by law. Rounded. Limited partnership. 3 % are held by individuals.
1
2
3
4
5
6
FINANCIAL REPORT
Click Note

81 LONZA ANNUAL REPORT 2014
Lonza Companies Town / Country Currency 1 Share capital in 000
Holding direct
%
Holding indirect
%
Lonza Bioscience Singapore Pte Ltd Singapore, SG USD 1 100 %Lonza Biotec sro Kourim, CZ CZK 282 100 100 %Lonza Braine SA Braine-l Alleud, BE EUR 40 000 100 %Lonza (China) Investments Co. Ltd Guangzhou, CN USD 84 000 100 % Lonza Cologne GmbH Cologne, DE EUR 1 502 100 %Lonza Copenhagen ApS Vallensbaek Strand, DK DKK 150 100 %Lonza do Brasil Especialidades Quimicas Ltda. São Paulo, BR BRL 2 99.9 % 1 0.1 %Lonza Europe BV Breda, NL EUR 20.5 2 32 % 1 68 %Lonza Finance Limited St. Helier, Jersey, GB CHF 335 100 % Lonza France Sàrl Levallois-Perret, FR EUR 132 100 %Lonza Group GmbH Waldshut-Tiengen, DE EUR 25 0.40 % 99.6 %Lonza Group UK Limited Slough, GB GBP 17 000 100 %Lonza Guangzhou Ltd Guangzhou, CN USD 12 000 100 %Lonza Guangzhou Nansha Ltd Guangzhou, CN USD 135 500 100 %Lonza Guangzhou Research and Development Center Ltd Guangzhou, CN USD 4 100 100 %Lonza Holding Singapore Pte Ltd Singapore, SG USD 100 000 100 %Lonza Houston Inc. Houston, US USD 1 100 %Lonza Ibérica S.A.U. Barcelona, ES EUR 60 100 %Lonza Inc. Allendale, US USD 697 100 %Lonza India Private Ltd Mumbai, IN INR 23 459 1 100 %Lonza Japan Ltd Tokyo, JP JPY 200 000 100 % Lonza Licences AG Basel, CH CHF 100 100 %
Lonza Liyang Chemical Co. Ltd Liyang, CN USD 3 000 100 %Lonza Microbial Control Asia Pacific Pte Ltd Singapore, SG USD 183 100 %Lonza Milano S.r.l. Treviglio, IT EUR 52 100 %Lonza Nanjing Ltd Nanjing, CN USD 14 000 100 %Lonza Rockland Inc. Rockland, US USD 1 100 %Lonza Sales AG Basel, CH CHF 2 000 100 % Lonza Swiss Finanz AG Basel, CH CHF 100 100 % Lonza Swiss Licences AG Basel, CH CHF 100 100 % Lonza Verviers Sprl Verviers, BE EUR 19 100 %Lonza Walkersville Inc. Walkersville, US USD 1 100 %Lonza Wokingham Limited Wokingham, GB GBP 1 100 %OOO Lonza Rus Moscow, RU RUB 10 100 %TL Biopharmaceutical Ltd Visp, CH CHF 1 000 50 %
Abbreviation of currencies in accordance with ISO standards. Rounded.
1
2
FINANCIAL REPORT
Click Note

83 LONZA ANNUAL REPORT 2014
REPORT OF THE STATUTORY AUDITOR
Report of the Statutory Auditor on the Consolidated Financial Statements to the Annual General Meeting of Lonza Group Ltd, Basel As statutory auditor, we have audited the accompanying consoli-dated financial statements of Lonza Group Ltd, which comprise the balance sheet, income statement, statement of comprehensive income, cash flow statement, statement of changes in equity and notes on pages 6 to 81 for the year ended 31 December 2014.
Board of Directors’ Responsibility
The Board of Directors is responsible for the preparation of the consolidated financial statements in accordance with Internation-al Financial Reporting Standards (IFRS) and the requirements of Swiss law. This responsibility includes designing, implement-ing and maintaining an internal control system relevant to the preparation of consolidated financial statements that are free from material misstatement, whether due to fraud or error. The Board of Directors is further responsible for selecting and applying ap-propriate accounting policies and making accounting estimates that are reasonable in the circumstances.
Auditor’s Responsibility
Our responsibility is to express an opinion on these consolidated financial statements based on our audit. We conducted our audit in accordance with Swiss law and Swiss Auditing Standards as well as International Standards on Auditing. Those standards require that we plan and perform the audit to obtain reasonable assurance whether the consolidated financial statements are free from material misstatement.
An audit involves performing procedures to obtain audit evidence about the amounts and disclosures in the consolidated finan-cial statements. The procedures selected depend on the auditor’s judgment, including the assessment of the risks of material mis-statement of the consolidated financial statements, whether due to fraud or error. In making those risk assessments, the auditor considers the internal control system relevant to the entity’s prepa-ration of the consolidated financial statements in order to design audit procedures that are appropriate in the circumstances, but not for the purpose of expressing an opinion on the effectiveness
of the entity’s internal control system. An audit also includes evaluating the appropriateness of the accounting policies used and the reasonableness of accounting estimates made, as well as evaluating the overall presentation of the consolidated financial statements. We believe that the audit evidence we have obtained is sufficient and appropriate to provide a basis for our audit opinion.
Opinion
In our opinion, the consolidated financial statements for the year ended 31 December 2014 give a true and fair view of the financial position, the results of operations and the cash flows in accordance with International Financial Reporting Standards (IFRS) and comply with Swiss law.
Report on Other Legal RequirementsWe confirm that we meet the legal requirements on licensing ac-cording to the Auditor Oversight Act (AOA) and independence (article 728 CO and article 11 AOA) and that there are no cir-cumstances incompatible with our independence.
In accordance with article 728a paragraph 1 item 3 CO and Swiss Auditing Standard 890, we confirm that an internal control system exists, which has been designed for the preparation of consolidated financial statements according to the instructions of the Board of Directors.
We recommend that the consolidated financial statements submit-ted to you be approved.
KPMG AG
Michael Blume Florin Janine KrappLicensed Audit Expert Licensed Audit ExpertAuditor in Charge
Zurich, 26 February 2015
FINANCIAL REPORT

84 LONZA ANNUAL REPORT 2014
BALANCE SHEET – LONZA GROUP LTD
Assets 1
CHF 2014 2013
Fixed assetsProperty, plant and equipment 668 776 717 353Investments 1 738 621 984 1 738 621 984Long-term loans to subsidiaries and associates 1 292 123 283 1 089 551 106Total fixed assets 3 031 414 043 2 828 890 443
Current assetsReceivables:
– From third parties 47 120 1 725– From subsidiaries and associates 15 056 032 16 077 266
Prepaid expenses:– Third parties 14 477 597 35 181 735– Subsidiaries and associates 32 647 642 3 019 465
Short-term advances:– Subsidiaries and associates 146 426 497 295 989 362
Marketable securities:– Own shares 76 642 416 79 758 906
Cash 181 626 257 562Total current assets 285 478 930 430 286 021
Total assets 3 316 892 973 3 259 176 464
Liabilities and Shareholders’ Equity 1
CHF 2014 2013
Shareholders’ equityShare capital 52 920 140 52 920 140Legal reserve:
– General legal reserve 26 460 070 26 460 070– Reserve from capital contribution 505 293 543 617 058 240– Reserve for own shares 76 642 416 79 758 906
Available earnings brought forward 1 266 391 190 1 079 573 389Profit for the year 174 737 577 183 701 311Total shareholders’ equity 2 102 444 936 2 039 472 056
LiabilitiesLong-term liabilitiesLong-term debt:
– Due to third parties 525 000 000 720 000 000– Due to subsidiaries and associates 196 142 710 180 000 000
Long-term provisions:– Due to third parties 363 317 389 832
Total long-term liabilities 721 506 027 900 389 832
Current liabilitiesPayables and other liabilities:
– Due to third parties 1 453 560 728 331– Due to subsidiaries and associates 484 893 534 124
Accrued expenses:– Due to third parties 92 393 188 18 840 907– Due to subsidiaries and associates 3 423 191 19 559 487
Short-term provisions:– Due to third parties 1 022 793 3 001 988
Short-term debt:– Due to third parties 86 180 000 49 750 000– Due to subsidiaries and associates 307 984 385 226 899 739
Total current liabilities 492 942 010 319 314 576
Total liabilities 1 214 448 037 1 219 704 408
Total liabilities and shareholders’ equity 3 316 892 973 3 259 176 464
Shareholders’ equity as a percentage of total assets % 63.4 62.6
At 31 December1
FINANCIAL REPORT

85 LONZA ANNUAL REPORT 2014
INCOME STATEMENT – LONZA GROUP LTD
CHF 2014 2013
IncomeIncome from investments 152 819 661 211 767 847Interest income 22 268 308 22 098 190Other financial income 62 810 689 37 420 384Other income 7 035 029 1 064 910Total income 244 933 687 272 351 331
ExpensesPersonnel expenses 22 745 764 12 841 409Other administrative expenses 6 601 514 5 932 865Interest expenses 28 659 996 31 458 156Other financial expenses 146 20 846 419Taxes 9 776 968 6 043 410Other expenses 2 112 073 1 298 389Write-offs on property, plant and equipment 299 649 571 652Write-offs on loans 0 9 657 720Total expenses 70 196 110 88 650 020
Profit for the year 174 737 577 183 701 311
FINANCIAL REPORT

86 LONZA ANNUAL REPORT 2014
6 INFORMATION ABOUT THE RISK ASSESSMENT PROCESS in accordance with Art. 663b para. 12 CO
Lonza Group Ltd is fully integrated into the Group-wide risk management process of Lonza Group. The specific risks arising from the type and scope of Lonza Group Ltd’s business activi-ties are covered in the Group-wide risk management process. A detailed description of the risk management process can be found in note 29 of the Consolidated Financial Statements, page 78.
7 OWN SHARES
At 31 December 2014, Lonza Group Ltd held 905 628 of its registered shares with a par value of CHF 1 each (31 December 2013: 944 942), resulting in a reserve for own shares of CHF 76 642 416 (31 December 2013: CHF 79 758 906).
In order to satisfy the exercise of the different share plans in 2014, Lonza Group Ltd delivered 39 314 registered shares at an average market value of CHF 104.25. A total of 200 630 of the registered shares with a par value of CHF 1 each (31 December 2013: 201 490) are reserved for the different share plans. Therefore 704 998 of the registered shares (31 December 2013: 743 452) have no special restriction. At 31 December 2014, the total number of registered shares not entitled to a dividend was 905 628, with a par value of CHF 1 each (2013: 944 942).
8 SHARE CAPITAL
Authorized capital: The Board of Directors is authorized to in-crease, at any time until 9 April 2015, the share capital of Lonza Group Ltd through the issuance of a maximum of 5 000 000 fully paid-in registered shares with a par value of CHF 1 each up to a maximum aggregate amount of CHF 5 000 000. This autho-rized capital was created by the Annual General Meeting held on 9 April 2013. The additional terms and conditions of the autho-rized capital (including the group of beneficiaries who have the right to subscribe for this additional capital) are set out in Article
NOTES TO THE FINANCIAL STATEMENTS – LONZA GROUP LTD
1 CONTINGENT LIABILITIES
At 31 December 2014, indemnity liabilities, guarantees and pledges in favor of third parties totaled CHF 1 342 782 204 (31 December 2013: CHF 2 054 985 666). The company is a member of the Lonza Group value-added-tax group in Switzerland and is thereby jointly and severally liable to the federal tax authorities for value-added-tax debts of that group.
2 LIABILITIES TO PERSONNEL WELFARE INSTITUTIONS
31 December 2014: CHF 697 676 (31 December 2013: CHF 153 520)
3 INVESTMENTS
See list of principal subsidiaries, pages 80 and 81.
4 MAJOR SHAREHOLDERS in accordance with Art. 663c of the Swiss Code of Obligations
See 1.2 Principal Shareholders in Corporate Governance, page 127.
5 DISCLOSURES ON BOARD AND MANAGEMENT COMPENSATION in accordance with Art. 663c
para. 3 of the Swiss Code of Obligations
See note 28 in the Consolidated Financial Statements, page 77 and Remuneration Report, on pages 98 to 121.
FINANCIAL REPORT

87 LONZA ANNUAL REPORT 2014
10 LONG-TERM DEBT
In February 2007, Lonza Group Ltd used the available syndicated loan facility in order to finance the acquisition of the Biopharma and Bioscience businesses from Cambrex. The facility was set up in December 2006 in an amount of CHF 500 million, with a maturity of five years and floating interest rates. In October 2011, Lonza Group Ltd replaced this facility. The 2011 facility was set up in an amount of CHF 700 million, with a maturity of five years and floating interest rates. In June 2010, Lonza Group Ltd issued a 3 % bond of CHF 400 million at an issue price of 100.72 %, with maturity date 2 June 2016.
11 ADDITIONAL NOTES
Exchange gains / losses: Other financial income in 2014 includes net exchange rate gains of CHF 58 852 212 (In 2013: Other financial expenses included net exchange rate losses of CHF 20 846 318).
Own shares: Other financial income in 2014 includes a gain for own shares of CHF 981 989 (In 2013: CHF 34 264 139).
Long-term loans to subsidiaries and associates: Lonza Group Ltd signed subordination agreements of CHF 145 million (2013: CHF 160 million) to subsidiaries and associates.
4ter of the Company’s Articles of Association. Contingent capital: The share capital of Lonza Group Ltd may be increased through the issuance of a maximum of 5 029 860 fully paid-in registered shares with a par value of CHF 1 each up to a maximum aggregate amount of CHF 5 029 860. This contingent capital (also called conditional capital) was created by the Annual General Meeting on 11 April 2005. The additional terms and conditions of the conditional capital (including the group of beneficiaries who have the right to subscribe for this additional capital) are set out in Articles 4bis of the Company’s Articles of Association. According to Article 4quarter of the Company’s Articles of Association, the capital increases in the form of contingent capital and authorized capital may increase the share capital of Lonza Group Ltd by a maximum aggregate amount of CHF 5 029 860.
9 AMOUNT IN RESERVE FROM CAPITAL CONTRIBUTION
In the context of the Corporate Taxation Reform II in Switzerland, the capital contribution principle was implemented with effect from 1 January 2011. The reserves from capital contribution estab-lished from 1 January 1997 to 31 December 2010 which qualify for the capital contribution principle of CHF 839 727 980 were finally approved by the Swiss Federal Tax Authority on 6 Decem-ber 2011. The amount of CHF 747 926 528 was reclassified from Available earnings brought forward to Reserve from capital con-tribution as per 31 December 2011 to reflect the approved amount as Reserve from capital contribution. As of 31 December 2014 the reserves from capital contribution amount to CHF 505 293 543 (31 December 2013: CHF 617 058 240).
FINANCIAL REPORT

88 LONZA ANNUAL REPORT 2014
PROPOSAL OF THE BOARD OF DIRECTORS
Concerning the Appropriation of Available Earnings
CHF 2014 2013
Available earnings brought forward 1 263 274 700 1 074 841 325Decrease reserve for own shares 3 116 490 4 732 064Profit for the year 174 737 577 183 701 311Available earnings at the disposal of the Annual General Meeting 1 441 128 767 1 263 274 700Available earnings carry-forward 1 441 128 767 1 263 274 700
CHF 2014 2013
General legal reserve qualified as reserve from capital contribution 505 293 543 617 058 240Reserve from capital contribution 1 505 293 543 617 058 240
Payment of a dividend (out of reserves from capital contribution) in 2014 of CHF 2.50 (2013: CHF 2.15) per share on the share capital eligible for dividend of CHF 52 014 512 (2013: CHF 51 983 580) 2 (130 036 280) (111 764 697)Available reserve from capital contribution carry-forward 375 257 263 505 293 543
If the Annual General Meeting approves the above proposal from the Board of Directors, the dividend of CHF 2.50 per registered share, net of withholding tax (as per Article 5 Abs 1bis VStG), will be paid as of 14 April 2015.
Rolf Soiron Richard RidingerChairman of the Board Chief Executive Officer
Basel, 26 February 2015
Refer to note 9 to the Financial Statements – Lonza Group Ltd. Depending on the amount of share capital eligible for dividend on the record date of 13 April 2015. No dividend will be paid out on shares held by the Company.
1
2
FINANCIAL REPORT

89 LONZA ANNUAL REPORT 2014
REPORT OF THE STATUTORY AUDITOR
Report of the Statutory Auditor on the Financial Statements to the Annual General Meeting of Lonza Group Ltd, BaselAs statutory auditor, we have audited the accompanying financial statements of Lonza Group Ltd, which comprise the balance sheet, income statement and notes on pages 84 to 88 for the year ended 31 December 2014.
Board of Directors’ Responsibility
The Board of Directors is responsible for the preparation of the financial statements in accordance with the requirements of Swiss law and the company’s articles of incorporation. This responsibil-ity includes designing, implementing and maintaining an internal control system relevant to the preparation of financial statements that are free from material misstatement, whether due to fraud or error. The Board of Directors is further responsible for select-ing and applying appropriate accounting policies and making accounting estimates that are reasonable in the circumstances.
Auditor’s Responsibility
Our responsibility is to express an opinion on these financial statements based on our audit. We conducted our audit in ac-cordance with Swiss law and Swiss Auditing Standards. Those standards require that we plan and perform the audit to obtain reasonable assurance whether the financial statements are free from material misstatement.
An audit involves performing procedures to obtain audit evidence about the amounts and disclosures in the financial statements. The procedures selected depend on the auditor’s judgment, including the assessment of the risks of material misstatement of the finan-cial statements, whether due to fraud or error. In making those risk assessments, the auditor considers the internal control system relevant to the entity’s preparation of the financial statements in order to design audit procedures that are appropriate in the cir-cumstances, but not for the purpose of expressing an opinion on the effectiveness of the entity’s internal control system.
An audit also includes evaluating the appropriateness of the ac-counting policies used and the reasonableness of accounting esti-mates made, as well as evaluating the overall presentation of the financial statements. We believe that the audit evidence we have obtained is sufficient and appropriate to provide a basis for our audit opinion.
Opinion
In our opinion, the financial statements for the year ended 31 December 2014 comply with Swiss law and the company’s articles of incorporation.
Report on Other Legal RequirementsWe confirm that we meet the legal requirements on licensing ac-cording to the Auditor Oversight Act (AOA) and independence (article 728 CO and article 11 AOA) and that there are no cir-cumstances incompatible with our independence.
In accordance with article 728a paragraph 1 item 3 CO and Swiss Auditing Standard 890, we confirm that an internal control system exists, which has been designed for the preparation of financial statements according to the instructions of the Board of Directors.
We further confirm that the proposed appropriation of available earnings complies with Swiss law and the company’s articles of incorporation. We recommend that the financial statements sub-mitted to you be approved.
KPMG AG
Michael Blume Florin Janine KrappLicensed Audit Expert Licensed Audit ExpertAuditor in Charge
Zurich, 26 February 2015
FINANCIAL REPORT

90 LONZA ANNUAL REPORT 2014
INVESTOR INFORMATION
Lonza Group Ltd shares are listed on the SIX Swiss Exchange and were included in the Swiss Leader Index (SLI). Since 21 October 2011, Lonza has had a secondary listing on the SGX Sin-gapore Exchange. The nominal value of the Lonza Group Ltd share is CHF 1. Lonza Group shares closed at the end of 2014 at a price of CHF 112.20, which represents an increase of 32.6 % in 2014.
The most significant news releases, other than results publications, during the course of 2014 were the following:
25 NOVEMBER Lonza Launches New ReGeniStem™ Brightening Skincare Solution for Visibly Brightened Skin and Better-Balanced Skin Tone
3 NOVEMBER Lonza and Celladon Corporation Establish a Strategic Commercial Manufacturing Collaboration for MYDICAR®
30 OCTOBER Bristol-Myers Squibb and Lonza Expand Manufacturing Agreement
25 SEPTEMBER Lonza Launches Worldwide Licensing Options for Its Chemical Microreaction Technology
4 SEPTEMBER Lonza Introduces Services for Rational Vaccine Design and Development to Help Reduce the Cost of Failure and Increase the Chance of Clinical Success
21 AUGUST Lonza Celebrates the 30th Anniversary of Clonetics™ Products, the Pioneer of Primary Cells
14 AUGUST Lonza Launches New Lonzest™ DC Emollient Ester for Excellent Skin Conditioning
17 JULY Lonzagard® RCS™ Family of Spray Disinfectant Combats Norovirus on Land and Sea
11 JUNE Lonza Invests in Single-Use Technology and Facility Upgrades for Clinical Antibody Drug Conjugate (ADC) Manufacturing
2 JUNE Lonza Announces New Addition to Executive Committee
2 APRIL Lonza Announces Executive Committee Changes
17 APRIL Lonza’s Facility in Singapore Received Good Manufacturing Practice (GMP) Certification from the HSA
10 APRIL Lonza and AMYRA Sign Comprehensive Development and Manufacturing Services Agreement for Enzyme-Based Treatment of Celiac Disease
26 MARCH Lonza Completes Successful Implementation of Next-Generation Carniking™ Process
19 MARCH Lonza and BioWa Sign POTELLIGENT® CHOK1SV Cell Line Technology Licensing Agreement with arGEN-X
13 JANUARY Lonza Extends Partnership with Pharmacyclics to Support Manufacturing of Recently Approved Oncology Therapeutic, IMBRUVICA™
9 JANUARY Lonza Signs Exclusive Agreement with Index Ventures for the Development and Manufacture of Biologics for Portfolio Companies
For a comprehensive review of the media releases issued during 2014, refer to www.lonza.com/news
FINANCIAL REPORT
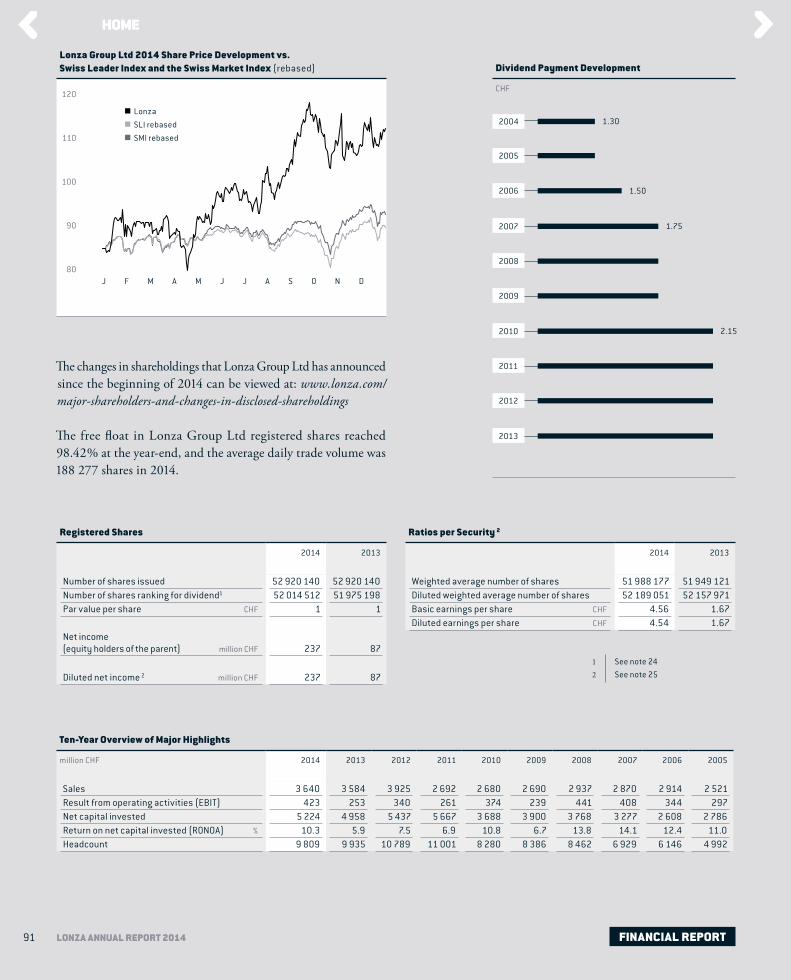
91 LONZA ANNUAL REPORT 2014
Dividend Payment Development
CHF
The changes in shareholdings that Lonza Group Ltd has announced since the beginning of 2014 can be viewed at: www.lonza.com/majorshareholdersandchangesindisclosedshareholdings
The free float in Lonza Group Ltd registered shares reached 98.42 % at the year-end, and the average daily trade volume was 188 277 shares in 2014.
Registered Shares
2014 2013
Number of shares issued 52 920 140 52 920 140Number of shares ranking for dividend1 52 014 512 51 975 198Par value per share CHF 1 1
Net income (equity holders of the parent) million CHF 237 87
Diluted net income 2 million CHF 237 87
Ten-Year Overview of Major Highlights
million CHF 2014 2013 2012 2011 2010 2009 2008 2007 2006 2005
Sales 3 640 3 584 3 925 2 692 2 680 2 690 2 937 2 870 2 914 2 521Result from operating activities (EBIT) 423 253 340 261 374 239 441 408 344 297Net capital invested 5 224 4 958 5 437 5 667 3 688 3 900 3 768 3 277 2 608 2 786Return on net capital invested (RONOA) % 10.3 5.9 7.5 6.9 10.8 6.7 13.8 14.1 12.4 11.0Headcount 9 809 9 935 10 789 11 001 8 280 8 386 8 462 6 929 6 146 4 992
See note 24 See note 25
1
2
1.30 2004
2005
1.50 2006
1.75 2007
2008
2009
2011
2012
2.15 2010
Ratios per Security 2
2014 2013
Weighted average number of shares 51 988 177 51 949 121Diluted weighted average number of shares 52 189 051 52 157 971Basic earnings per share CHF 4.56 1.67Diluted earnings per share CHF 4.54 1.67
Lonza Group Ltd 2014 Share Price Development vs. Swiss Leader Index and the Swiss Market Index (rebased)
120
110
100
90
80
Lonza SLI rebased SMI rebased
J F M A M J J A S O N D
2013
FINANCIAL REPORT
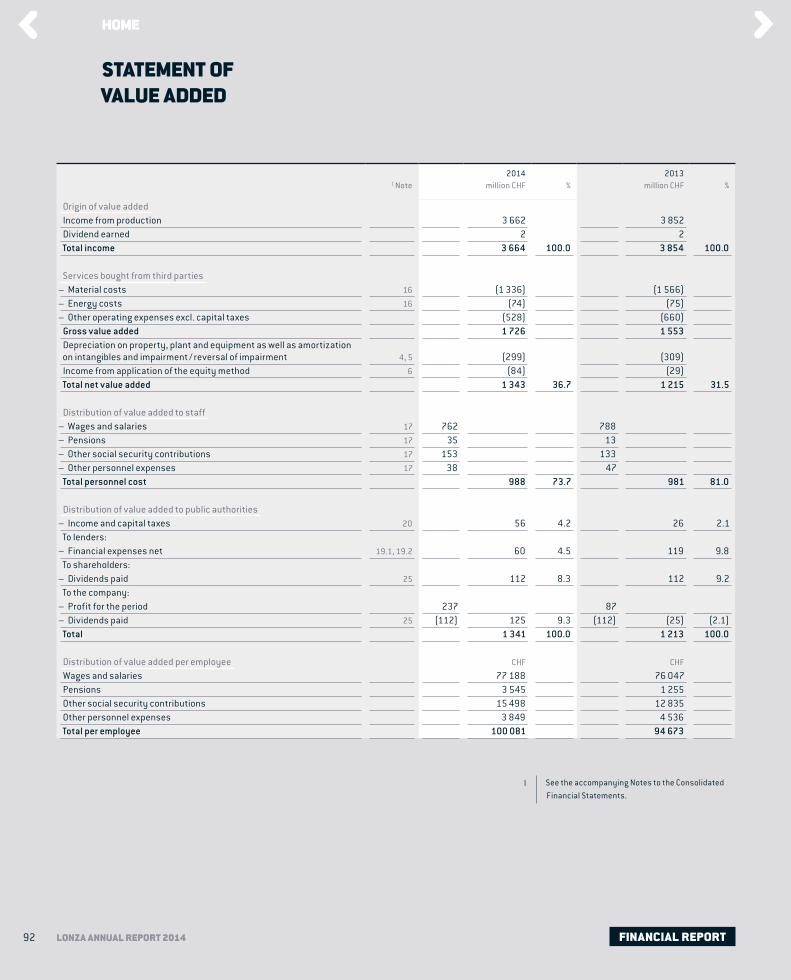
92 LONZA ANNUAL REPORT 2014
STATEMENT OF VALUE ADDED
1 Note2014
million CHF %2013
million CHF %
Origin of value addedIncome from production 3 662 3 852 Dividend earned 2 2 Total income 3 664 100.0 3 854 100.0
Services bought from third parties– Material costs 16 (1 336) (1 566) – Energy costs 16 (74) (75) – Other operating expenses excl. capital taxes (528) (660)
Gross value added 1 726 1 553 Depreciation on property, plant and equipment as well as amortization on intangibles and impairment / reversal of impairment 4, 5 (299) (309)Income from application of the equity method 6 (84) (29)Total net value added 1 343 36.7 1 215 31.5
Distribution of value added to staff– Wages and salaries 17 762 788 – Pensions 17 35 13 – Other social security contributions 17 153 133 – Other personnel expenses 17 38 47
Total personnel cost 988 73.7 981 81.0
Distribution of value added to public authorities– Income and capital taxes 20 56 4.2 26 2.1
To lenders:– Financial expenses net 19.1, 19.2 60 4.5 119 9.8
To shareholders: – Dividends paid 25 112 8.3 112 9.2
To the company:– Profit for the period 237 87 – Dividends paid 25 (112) 125 9.3 (112) (25) (2.1)
Total 1 341 100.0 1 213 100.0
Distribution of value added per employee CHF CHF
Wages and salaries 77 188 76 047 Pensions 3 545 1 255 Other social security contributions 15 498 12 835 Other personnel expenses 3 849 4 536 Total per employee 100 081 94 673
See the accompanying Notes to the Consolidated Financial Statements.
1
FINANCIAL REPORT

93 LONZA ANNUAL REPORT 2014
FREE CASH FLOW
The following is a summary of the free cash flow, using Lonza’s defi-nition. It includes earnings before interest, taxes and depreciation (EBITDA) and subtracts / adds the increase / decrease of operating net working capital, subtracts capital expenditures, acquisitions and adds disposal of fixed assets and subsidiaries as well as changes of other long-term operating assets / liabilities. This key measure is the same as reported monthly to the Executive Committee.
million CHF 2014 2013
EBITDA 737 647Change of operating net working capital (94) 42Capital expenditures in tangible and intangible assets (180) (210)Disposal of tangible assets 10 21Change of other assets and liabilities 3 19Free cash flow 476 519
FINANCIAL REPORT
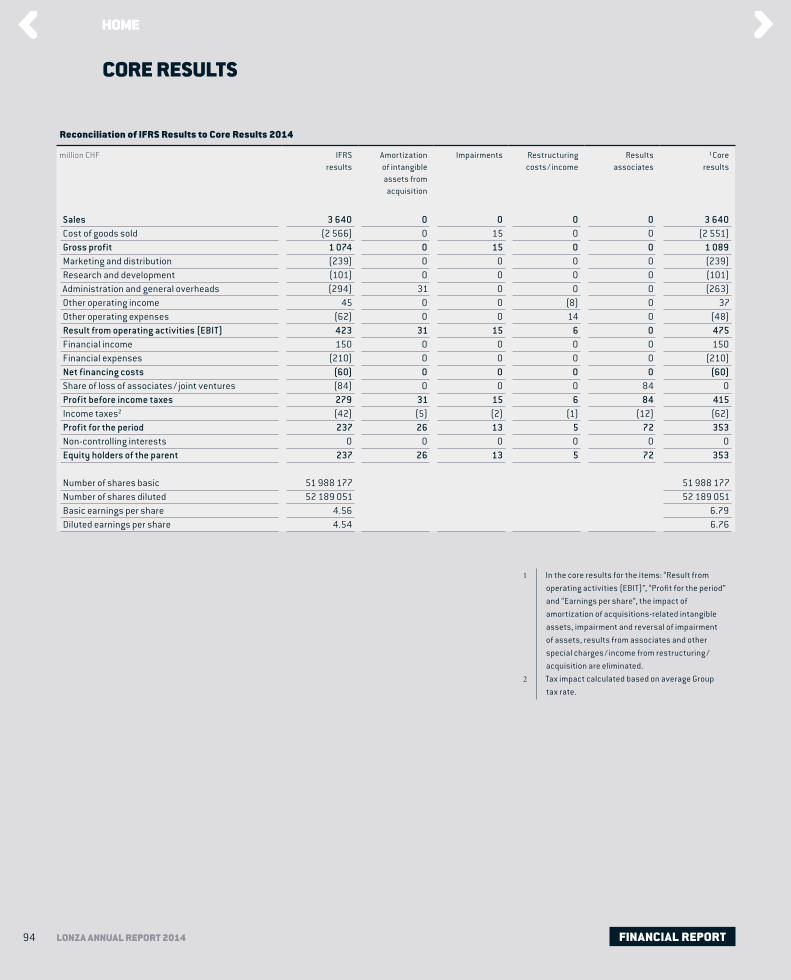
94 LONZA ANNUAL REPORT 2014
CORE RESULTS
Reconciliation of IFRS Results to Core Results 2014
million CHF IFRS results
Amortization of intangible assets from acquisition
Impairments Restructuring costs / income
Results associates
1 Core
results
Sales 3 640 0 0 0 0 3 640Cost of goods sold (2 566) 0 15 0 0 (2 551)Gross profit 1 074 0 15 0 0 1 089Marketing and distribution (239) 0 0 0 0 (239)Research and development (101) 0 0 0 0 (101)Administration and general overheads (294) 31 0 0 0 (263)Other operating income 45 0 0 (8) 0 37Other operating expenses (62) 0 0 14 0 (48)Result from operating activities (EBIT) 423 31 15 6 0 475Financial income 150 0 0 0 0 150Financial expenses (210) 0 0 0 0 (210)Net financing costs (60) 0 0 0 0 (60)Share of loss of associates / joint ventures (84) 0 0 0 84 0Profit before income taxes 279 31 15 6 84 415Income taxes2 (42) (5) (2) (1) (12) (62)Profit for the period 237 26 13 5 72 353Non-controlling interests 0 0 0 0 0 0Equity holders of the parent 237 26 13 5 72 353
Number of shares basic 51 988 177 51 988 177Number of shares diluted 52 189 051 52 189 051Basic earnings per share 4.56 6.79Diluted earnings per share 4.54 6.76
In the core results for the items: “Result from operating activities (EBIT)”, “Profit for the period” and “Earnings per share”, the impact of amortization of acquisitions-related intangible assets, impairment and reversal of impairment of assets, results from associates and other special charges / income from restructuring / acquisition are eliminated. Tax impact calculated based on average Group tax rate.
1
2
FINANCIAL REPORT

95 LONZA ANNUAL REPORT 2014
Reconciliation of IFRS Results to Core Results 2013
million CHF IFRS results
Amortization of intangible assets from acquisition
Impairments Restructuring costs /
income
Impact of Arch
integration costs
Results associates
1 Core
results
Sales 3 584 0 0 0 0 0 3 584 Cost of goods sold (2 758) 0 3 79 44 0 0 (2 635)Gross profit 826 0 79 44 0 0 949 Marketing and distribution (228) 0 0 0 0 0 (228)Research and development (111) 0 0 1 0 0 (110)Administration and general overheads (212) 40 0 1 2 0 (169)Other operating income 43 0 0 0 0 0 43 Other operating expenses (65) 0 0 16 0 0 (49)Result from operating activities (EBIT) 253 40 79 62 2 0 436 Financial income 44 0 0 0 0 0 44 Financial expenses (163) 0 0 0 0 0 (163)Net financing costs (119) 0 0 0 0 0 (119)Share of loss of associates / joint ventures (29) 0 0 0 0 29 0 Profit before income taxes 105 40 79 62 2 29 317 Income taxes2 (18) (7) (16) (12) 0 (5) (58)Profit for the period 87 33 63 50 2 24 259 Non-controlling interests 0 0 0 0 0 0 0 Equity holders of the parent 87 33 63 50 2 24 259
Number of shares basic 51 949 121 51 949 121Number of shares diluted 52 157 971 52 157 971Basic earnings per share 1.67 4.99Diluted earnings per share 1.67 4.97
In the core results for the items: “Result from operating activities (EBIT)”, “Profit for the period” and “Earnings per share”, the impact of amortization of acquisitions-related intangible assets, impairment and reversal of impairment of assets, results from associates and other special charges / income from restructuring / acquisition are eliminated. Tax impact calculated based on average Group tax rate. Nansha-related impairment of CHF 6 million is considered as part of the core results.
1
2
3
FINANCIAL REPORT

9797 LONZA ANNUAL REPORT 2014
Compensation and Performance Overview 2014 98Compensation-Setting Process 99Compensation Components 102Compensation of the Board of Directors 102Compensation of the Executive Committee 106Share Ownership of the Members of the Board of Directors and the Executive Committee 120Employee Share Purchase Plan (ESPP) 120Guide to Compensation Approvals by the Annual General Meeting 2016 121Report of the Statutory Auditor 123
This Remuneration Report provides a comprehensive overview of Lonza’s compensation philosophy, principles and components. The report presents, in accordance with the applicable SIX Swiss Exchange regulations and reporting standards, the structure, governance and details of Board of Directors and Executive Committee members’ compensation.
REMUNERATION REPORT
REMUNERATION REPORT
This Remuneration Report provides a comprehensive overview
of Lonza’s compensation philosophy, principles and components.
The report presents, in accordance with the applicable
SIX Swiss Exchange regulations and reporting standards,
the structure, governance and details of Board of Directors
and Executive Committee members’ compensation.
[ CLICK THE ARTICLES TO NAVIGATE ]

98 LONZA ANNUAL REPORT 2014
COMPENSATION AND PERFORMANCE OVERVIEW 2014
Lonza’s compensation philosophy is designed to attract and retain talent through competitive compensation programs. All compen-sation programs are performance based, linking employee rewards with company performance. Executive compensation is aligned with the short-term and long-term objectives of the company; results are measured based on achievement of specific goals that are aligned with the short-term and long-term objectives. Our performance goals are selected to achieve a balance between de-sired short-term and long-term outcomes. In this way, we encour-age strategic decisions for competitive advantage and discourage executives from taking unnecessary or excessive risks that would threaten the reputation or sustainability of the Company. For 2014, Lonza’s overall financial performance vs. short-term incentive plan (STIP) targets was as follows:
2014 STIP Payout: Financial Targets 1
million CHF 2014 Actual
Performance
Target Weighting
in %
% Achieved Proposed 2014
Payout % (weighted)
Core EBIT 475.4 50 84.41 42.21 Sales (at target FX rates) 3 709.0 15 53.68 8.05 Operational Cash Flow 475.5 15 87.75 13.16
Financial targets account for 80 % of the total STIP weighting; individual performance accounts for the remaining 20 % weight. For Executive Committee members the overall target achievement was 78.93 % (2013: 89.63 %)
1
For the financial year 2014, Lonza’s overall financial performance vs. long-term incentive plan (LTIP) targets for 2012 was deter-mined by the Nomination and Compensation Committee (NCC) to approximate the financial performance required to meet Lonza’s challenging strategic goals and support Lonza’s three-year plan. The 2012 LTIP performance were as follows (plan vested on 31 January 2015):
2012 LTIP Financial Performance2
Actual Performance
Payout in %
EVA (Economic Value Added) CHF 82.0 m 100TSR (Total Shareholder Return3) exceeded indices by 15.7 % 100
As illustrated above, Lonza’s financial performance is benefit-ing from the measurable progress that our teams are making by implementing strategic and transformational initiatives. Lonza’s compensation programs closely align the short- and long-term targets of the company and the remuneration of our Executives. We did not fully achieve our short-term incentive targets for 2014; however, we are beginning to see the benefits of the longer-term initiatives with an LTIP payout for the first time in four years. The following pages describe our remuneration and performance linkage in greater detail.
3-year cycle completed 31 December 2014. Compared with MSCI Chemicals, MSCI Health Care, SPI.
2
3
REMUNERATION REPORT

99 LONZA ANNUAL REPORT 2014
1 COMPENSATION-SETTING PROCESS
1.1 RULES IN THE ARTICLES OF ASSOCIATION RELATING TO REMUNERATION
Lonza’s Articles of Association1 contain rules regarding the approval of compensa-tion by the Shareholders’ Meeting (Article 22)2, the Supplementary amount in the event of changes in the Executive Committee (Article 23), compensation of the members of the Board of Directors and the Executive Committee, including the principles applicable to performance-related compensation (Article 24), the agreement with members of the Board of Directors and the Executive Committee (Article 24) and loans to members of the Board of Directors and the Executive Committee (Article 27).
1.2 RESPONSIBILITIES OF COMPANY’S BODIES RELATING TO REMUNERATION
Board of Directors As outlined in the Organizational Regulations (Article 28)3, the Board of Directors takes decisions on the following matters:a The determination of the remuneration for the members of the Board of Di-
rectors in accordance with the Articles of Association, subject to approval of the compensation of the Board by the Shareholders’ Meeting pursuant to the Articles of Association; and
b The terms of employment for the members of the Executive Committee, based on the proposal of the NCC;
c The preparation of the Remuneration Report.
Nomination and Compensation Committee The Nomination and Compensation Committee (NCC) has the following roles and responsibilities as outlined in the Nomination and Compensation Committee Charter3:a To recommend and review compensation policies and plans for approval by
the full Board of Directors;b To review periodically and make recommendations to the Board of Directors
regarding any variable incentive and the extent to which the plans meet their objectives;
c To advise the Board of Directors on the compensation of non-executive Board of Directors members;
d To review and approve the objectives relevant to the CEO’s compensation, to evaluate the performance on a regular basis and to determine the remunera-tion based on performance, subject to approval of the compensation of the Executive Committee by the Shareholders’ Meeting pursuant to the Articles of Association;
e To review and approve the remuneration proposals for members of the Execu-tive Committee subject to approval by the Shareholders’ Meeting pursuant to the Articles of Association;
f To recommend to the Board of Directors proposals to be submitted to the Annual Shareholders’ Meeting for approval regarding total amounts of compensation of the Board and the Executive Committee pursuant to the Articles of Association;
g To support the Board of Directors in preparing the remuneration report;h To inform the Board of Directors about compensation policies and programs
as well as benchmark compensation of key peer companies.
www.lonza.com/aoa Please also refer to page 121 of this report for information of the approvals of the compensation by the Annual General Meeting 2015.
1
2
www.lonza.com/orgreg3
REMUNERATION REPORT

100 LONZA ANNUAL REPORT 2014
The NCC continuously reviews the aspects of executive compensation and compli-ance with good governance standards. During this year’s review, Lonza considered third-party benchmark data, feedback from shareholders, members of the invest-ment community, policy recommendations provided by institutional shareholder advisory organizations and the Swiss Ordinance Against Excessive Pay for Stock-Exchange-Listed Companies.
The Chief Human Resources Officer and the relevant HR specialists prepare the NCC meeting materials and provide the related materials for such meetings. These individuals have an advisory function without voting rights. The Chief Human Resources Officer acts as secretary to the NCC and attends all NCC meetings.
Shareholders’ Meeting The Shareholders’ Meeting approves annually the com-pensation of the Board of Directors and the Executive Committee in accordance with Article 22 of Lonza’s Articles of Association2.
1.3 NCC AND BOARD MEETINGS
The meetings of the NCC and the Board relating to compensation took place as follows:
January 2014 Meeting The NCC finalized recommendations to the Board of Directors for the target achievement for STIP 2013 and LTIP 2011, as well as the financial STIP targets (Core EBIT, Lonza Sales and Operational Free Cash Flow) for 2014. The NCC recommended to the Board of Directors that Lonza replace the LTIP Key Performance Indicator (KPI) Total Shareholder Return with Core Return on Net Operating Assets (Core RONOA) and to use Core Earnings Per Share (EPS) as the second KPI (see page 112 of this Remuneration Report).
The 2014 financial targets for the 2014 LTIP (Core RONOA and Core EPS) were approved by the Board of Directors.
April 2014 Meeting The NCC reviewed the Executive Committee contracts with the objective of modifying the agreements by year-end. Also, the NCC approved the grant for participants in the 2014 LTIP. A review from the consulting firm New Bridge Street (NBS) provided updated benchmark data for the Board of Directors compensation. At the April 2014 NCC meeting, a decision was made to propose to the Board of Directors to discontinue the 20 % discount for shares granted to the Board of Directors and instead use full market value to determine the number of shares granted to the Board of Directors on or after 1 April 2015. The Board of Directors accepted the recommendations of the NCC.
July 2014 Meeting The NCC reviewed and approved implementation of the 2014 ESPP (Employee Share Purchase Plan) and discussed review of the EC employment agreements. The Board of Directors accepted the recommendations of the NCC.
www.lonza.com/aoa. Please also refer to p. 121 of this Remuneration Report for more information on the approvals of the Annual General Meeting 2015.
2
REMUNERATION REPORT
101 LONZA ANNUAL REPORT 2014
October 2014 Meeting The NCC approved the proposed KPIs for the STIP and LTIP 2015, which remain the same as for the 2014 plans. Also, the NCC ap-proved the revised version of the Executive Committee employment agreements. The Board of Directors approved the revised version of the Executive Committee employment agreements.
December 2014 Meeting The NCC reviewed 2015 compensation recommenda-tions to be submitted to the Annual General Meeting 2015.
January 2015 Meeting The NCC prepared recommendations on the compensa-tion motions to be submitted to the Annual General Meeting 2015. Also, the NCC approved and recommended to the Board of Directors the target achievement for STIP 2014 and LTIP 2012. The Board of Directors discussed the motions regard-ing the compensation of the Board of Directors and the Executive Committee to be submitted to the Annual General Meeting 2015.
The NCC held five meetings in 2014. With the exception of one member who was unable to attend one meeting, all members of the NCC participated in all meetings. The discussions and the decisions of the Board of Directors or the NCC regarding the compensation of the members of the Executive Committee are resolved in the absence of the applicable members of the Executive Committee. All members of the Board of Directors are non-executive members. All members of the Board of Directors took part and voted at its meetings regarding compensation matters.
1.4 EXTERNAL ADVISORS AND BENCHMARKS
As part of the ongoing commitment to review the competitive environment for 2014 compensation, Lonza conducted a market analysis on total compensation for the Board of Directors and Executive Committee with New Bridge Street (NBS)1. Representatives from NBS met with the NCC in October and December 2013 to discuss competitive benchmarking and the objectives of the Lonza compensation systems for both the Board of Directors and the Executive Committee members. Based on the analysis performed by NBS, the NCC made a decision to modify the compensation benchmarks for the Board of Directors and the Executive Com-mittee members. The benchmark companies used for the Board of Directors and the Executive Committee are described in greater details in Sections 3.1 and 4.1.
NBS is part of Aon Hewitt’s Performance, Reward and Talent Group.
1
REMUNERATION REPORT

102 LONZA ANNUAL REPORT 2014
2 COMPENSATION COMPONENTS
The compensation of Lonza employees includes the following components (total compensation):
Base Pay The base pay of Lonza employees is established by assessing the scope of the job within the context of the relevant market, as well as individual perfor-mance. The base pay is in general comparable to the median of similar positions in the pharmaceutical, chemical and general industries. Potential increases in base pay are evaluated on an annual basis and are typically based on relevant market benchmarks and the employee’s performance.
Variable Compensation The variable compensation is designed to provide em-ployees with the opportunity to participate in the company’s overall success and to earn a competitive total compensation. The majority of employees participate in a short-term incentive plan (STIP). Senior management and key employees also participate in a long-term incentive plan (LTIP). The guiding principle for these plans is to motivate and reward employees for the company’s short-term and long-term financial success.
Benefits The benefits programs are defined by country, taking into consideration local legislation as well as competitive market practices within our industry. Benefit packages are reviewed on a regular basis.
Employee Share Purchase Plan An Employee Share Purchase Plan (ESPP) was offered in 2014 to the majority of active employees. See page 52 for information on the 2014 ESPP Plan.
3 COMPENSATION OF THE BOARD OF DIRECTORS
3.1 PRINCIPLES
Objective and Benchmarks Based on the analysis performed by NBS, the NCC determined that in 2014, the NCC would use benchmark data of Swiss companies (various sectors) that are similar in size to Lonza in determining competitive Board of Directors’ Compensation. Lonza’s objective is to pay the members of the Board of Directors at the market median of this benchmark group1.
Overall Structure and Level of Compensation The overall structure and level of compensation of the Board of Directors did not change between 2005 and 2012. In 2013, the gross compensation of the Board of Directors was reduced by 20 %. This level of compensation was maintained in 2014. However, based on the competitive benchmark data provided by NBS, the compensation level for the Chairman of the Board of Directors was shown to be below the targeted market median. For 2014, the Chairman’s fee was, therefore, increased to bring the compensation in line with the median of the peer group described above.
Geberit AG, The Swatch Group SA, Clariant AG, Panalpina Welttransport (Holding) AG, Sika AG, ARYZTA AG, Barry Callebaut AG, Givaudan SA, Sulzer Ltd, Georg Fisher AG, Emmi AG, OC Oerlikon Corporation AG, Logitech International S.A., Actelion Ltd, Sonova Holding AG, Forbo Holding AG, Nobel Biocare Holding AG
1
REMUNERATION REPORT

103 LONZA ANNUAL REPORT 2014
3.2 COMPENSATION COMPONENTS
For the period from the AGM 2014 to the AGM 2015, the members of the Board of Directors will receive fixed gross compensation for Board of Directors mem-bership and additional compensation for committee chairperson and committee memberships as described below:
AGM 2014 to AGM 20151
CHF Annual Fee Additional Committee Membership Fee
Additional Committee Chairperson Fee
Board of Directors Member 200 000 40 000 80 000Chairman of the Board of Directors 450 000
The compensation of the Chairman of the Board of Directors includes his remu-neration as a member of the Innovation and Technology Committee of the Board of Directors.
The compensation of the Committee Chairpersons amounts to CHF 280 000 and includes the additional Committee Membership Fee.
Board of Directors’ compensation is paid in four installments at the end of June, September, December and March; 50 % of the compensation is paid in cash and 50 % in shares. In 2014, the number of granted shares was calculated based on the average closing share price of the last five business days of each quarter with a discount of 20 %. The number of shares granted for Board of Directors’ compen-sation paid on or after 1 April 2015 will be based on market value, and the 20 % discount will no longer apply. The share restrictions lapse after three years of the grant date. Shares are eligible for a dividend. This structure of Board of Director compensation is closely aligned with our shareholders’ interests.
The members of the Board of Directors do not receive variable compensation.
The members of the Board of Directors are reimbursed for travel and other related expenses associated with their responsibilities as members of the Board of Direc-tors of Lonza.
Refer to Section 3.3 regarding total compensation (including national employer social contributions) provided to the Board of Directors in financial year 2014. The table to the left represents the time period from AGM 2014 to AGM 2015 and does not include social contributions of the employer.
1
REMUNERATION REPORT

104 LONZA ANNUAL REPORT 2014
3.3 AGGREGATE COMPENSATION OF THE BOARD OF DIRECTORS
Board of Directors’ Compensation
Cash payment
CHF
Number of shares
2 Value of shares
CHF
3 Social Security
and Taxes
2014
TotalCHF
4 Cash payment
CHF
Number of shares
3 Value of shares
CHF
2013
TotalCHF
Rolf Soiron Chairman of the Board1 207 917 2 535 259 700 43 332 510 949 194 449 3 805 267 039 461 488
Patrick Aebischer 5 131 712 1 611 164 410 28 840 324 962 103 003 1 939 137 862 240 865
Werner Bauer 6 112 842 1 379 140 729 24 720 278 291 87 886 1 396 105 591 193 477
Thomas Ebeling 6 112 842 1 379 140 729 24 720 278 291 87 886 1 396 105 591 193 477
Jean-Daniel Gerber 5 133 223 1 630 166 357 27 110 326 690 128 054 2 375 169 243 297 297
Gerhard Mayr 7 19 835 1 072 65 746 85 581
Jörg Reinhardt 7 18 750 1 146 70 284 89 034
Barbara Richmond 8 63 839 749 79 745 59 645 203 229
Margot Scheltema 5 101 250 1 232 126 353 67 500 295 103 153 750 1 800 126 318 280 068
Jürgen Steinemann 8 84 631 988 105 546 18 540 208 717
Richard Sykes 7 21 875 1 337 81 998 103 873
Antonio Trius 6 90 000 1 100 112 253 60 000 262 253 112 500 1 113 84 184 196 684
Peter Wilden 7 32 928 457 41 121 7 210 81 259 136 087 2 637 185 059 321 146
Total 1 071 184 13 060 1 336 943 361 617 2 769 744 1 064 075 20 016 1 398 915 2 462 990
The increase of Board compensation in 2014 (including the compensation of the Chairman) compared to 2013 is essentially due to the new full disclosure of the employer and employee contributions to social security, which had not been disclosed in 2013 (see footnote 3). In addition, the number of Board members in 2014 was increased from eight to nine (8.75 FTE in 2014; 8.00 FTE in 2013).
No loans or credits were granted to current or former members of the Board of Directors during 2014 (nor in 2013). No loans or credits were outstanding as of 31 December 2014. During 2014, no payments (or waiver of claims) were made to current or former Board members or to persons closely linked to them. No member of the Board of Directors benefits materially from any contract between a Lonza company and a third party.
This compensation includes Mr. Soiron’s committee membership. Mr. Soiron is a member of the Innovation and Technology Committee. The fair values were calculated using the market price at grant date, see note 23 in the Lonza Financial Report 2014. The social security amounts disclosed in this column represents the full costs of the employer and employee social security contributions and withholding tax for 2014. In 2013 the value of the social security was calculated on benefit-related employer contributions. The full impact of the employer social security and the withholding tax for 2013 was CHF 334 439. All compensation amounts given for the Board of Directors refer to gross payments, including social security and withholding tax, except where stated otherwise. The accrual principle is applied. Patrick Aebischer, Jean-Daniel Gerber and Margot Scheltema are chairpersons of a Board Committee. Werner Bauer, Thomas Ebeling and Antonio Trius joined the Board of Directors in April 2013. Gerhard Mayr, Jörg Reinhardt and Richard Sykes left the Board of Directors in April 2013. Peter Wilden left the Board of Directors in April 2014. Barbara Richmond and Jürgen Steinemann joined the Board of Directors in April 2014.
1
2
3
4
5
6
7
8
REMUNERATION REPORT

105 LONZA ANNUAL REPORT 2014
Development of Compensation for Board of Directors 2014
Grant date Total number of shares
Share priceCHF
Fair values of shares
1 Cash CHF
Total CHF
Blocked until
31 03 2014 3 442 89.98 309 711 275 000 584 711 31 03 201730 06 2014 3 576 96.22 344 083 311 250 655 333 30 06 201730 09 2014 2 966 114.92 340 853 311 250 652 103 30 09 201731 12 2014 3 076 111.28 342 297 311 250 653 547 31 12 2017
Total 13 060 102.37 1 336 944 1 208 750 2 545 694
The amount of CHF 2 545 694 was recognized as an expense in the year 2014.
Development of Compensation for Board of Directors 2013
Grant date Total number of shares
Share priceCHF
Fair values of shares
1 Cash CHF
Total CHF
Blocked until
31 03 2013 8 146 61.33 499 594 165 000 664 594 31 03 201630 06 2013 4 221 69.96 295 301 262 500 557 801 30 06 201630 09 2013 3 961 74.30 294 304 262 500 556 802 30 09 201631 12 2013 3 688 83.98 309 718 275 000 584 718 31 12 2016
Total 20 016 69.89 1 398 915 965 000 2 363 915
The amount of CHF 2 363 915 was recognized as an expense in the year 2013.
Development of Compensation for Board of Directors 2012
Grant date Total number of shares
Share priceCHF
Fair values of shares
1 Cash CHF
Total CHF
Blocked until
31 03 2012 9 715 46.74 454 079 180 000 634 079 31 03 201530 06 2012 13 779 38.57 531 456 175 000 706 456 30 06 201530 09 2012 10 006 49.84 498 699 210 000 708 699 30 09 201531 12 2012 9 885 49.49 489 228 175 000 664 228 31 12 2015
Total 43 385 45.49 1 973 462 740 000 2 713 462
The amount of CHF 2 713 462 was recognized as an expense in the year 2012.
Development of Compensation for Board of Directors 2011
Grant date Total number of shares
Share priceCHF
Fair values of shares
1 Cash CHF
Total CHF
Blocked until
31 03 2011 5 334 77.12 411 358 150 000 561 358 31 03 201430 06 2011 6 845 62.34 426 717 230 000 656 717 30 06 201430 09 2011 8 118 55.78 452 822 180 000 632 822 30 09 201431 12 2011 7 198 54.80 394 450 245 000 639 450 31 12 2014
Total 27 495 61.30 1 685 347 805 000 2 490 347
The amount of CHF 2 490 347 was recognized as an expense in the year 2011.
Excluding social security and withholding tax.1
REMUNERATION REPORT

106 LONZA ANNUAL REPORT 2014
4 COMPENSATION OF THE EXECUTIVE COMMITTEE
4.1 PRINCIPLES
Objective and Benchmarks Lonza’s objective is to pay the members of the Execu-tive Committee a base salary in line with the median for the market as described be-low, with the potential for executives to earn above-median compensation through a combination of competitive short-term and long-term incentive programs if the company outperforms its financial targets. These incentive plans are designed to align the Executive Committee’s objectives with the interests of our shareholders. The total compensation (base salary, variable elements and fringe benefits) of the members of the Executive Committee is benchmarked on a regular basis against the relevant industry.
In 2014, based on the benchmarking study completed by NBS, the following peer groups were established to assess total compensation for the Executive Committee.
Peer Groups
Primary Peer Group Secondary Peer Groups
European pharmaceutical / chemical sector businesses (all data adjusted to reflect differences in revenue and market value)1
Swiss companies the same size as Lonza in other sectors 2
US pharmaceutical3 or chemical4 companies similar sized to Lonza
This benchmarking study, together with Towers Watson and Mercer5 benchmark data, was used to review the remuneration of the Executive Committee and the senior management for 2014. As a result of this analysis, the overall structure of compensation for the Executive Committee remained largely unchanged in 2014.
4.2 REMUNERATION COMPONENTS
The compensation of the members of the Executive Committee consists of the following components:
Base Salary The base salary is paid in cash and determined for each position considering the responsibilities of the position and performance of each member of the Executive Committee.
Short-Term Incentive Plans (STIP) The company provides the members of the Executive Committee with Short-Term Incentive Plans, of which two-thirds is paid in cash (Cash STIP) and one-third in restricted share units (RSUs) (E-STIP), which vest after three years. Performance metrics are defined for each financial year; achievement determines the payout of STIP. The performance metrics for the STIP (Cash STIP and the E-STIP) are the same. For more details regarding the Cash STIP, please refer to page 110. The E-STIP ensures the competitiveness of the executive variable compensation and serves as retention for Executive Com-mittee members. E-STIP is awarded in RSUs with a three-year vesting period. For more details regarding the E-STIP, please refer to page 110.
Actelion Ltd, BASF SE, Bayer AG, Clariant AG, Croda International Plc, Evonik Industries AG, Givaudan SA, Novartis AG, Roche Holding Ltd, Sika AG, SGS SA, STADA Arzneimittel AG, Syngenta AG, Wacker Chemie AG. ARYZTA AG, Barry Callebaut AG, Emmi AG, Forbo Holding AG, Geberit AG, Georg Fischer AG, Logitech International S.A., Nobel Biocare Holding AG, OC Oerlikon Corporation AG, Panalpina Welttransport (Holding) AG, Sonova Holding AG, Sulzer Ltd, The Swatch Group SA. Pharma-Actavis, Inc., Alere Inc., Endo Health Solutions Inc., Forest Laboratories, Inc., Hospira, Inc., Life Technologies Corporation, Mylan, Inc., Perrigo Company, Zoetis Inc. Cabot Corporation, Celanese Corporation, Chemtura Corporation, The Clorox Company, Coty Inc., Eastman Chemical Company, FMC Corporation, International Flavors and Fragrances Inc., Methanex Corporation, Sigma-Aldrich Corporation, Westlake Chemical Corporation, W.R. Grace and Company. Towers Watson and Mercer have further consulting mandates within Lonza’s Human Resources Department.
1
2
3
4
5
REMUNERATION REPORT

107 LONZA ANNUAL REPORT 2014
Long-Term Incentive Plans (LTIP) The LTIP was designed to align the interests of the Executive Committee with those of Lonza’s shareholders and to serve as retention for the executives. The LTIP is a 100 % equity-based plan with condi-tional equity awards vesting after three years according to performance conditions. Executive Committee members are awarded the right to receive a number of shares in Lonza in the future, provided that certain performance-related conditions are achieved. For more details regarding the LTIP, please refer to page 112.
Benefits The Executive Committee’s compensation package also includes certain benefits such as a car, expenses allowance, health insurance, 30% discount on ESPP shares according to the plan provisions, pension, and (if applicable) reloca-tion packages, housing allowances and tuition fees.
4.3 AGGREGATE COMPENSATION OF THE EXECUTIVE COMMITTEE
The acting members of the Executive Committee received for their contributions and time served in 2014 CHF 5.210 million (2013: CHF 5.022 million) in cash and benefits, 47 861 LTIP equity awards (2013: 82 055) and a number of E-STIP RSUs (the exact number will be determined in March 2015) equivalent to a value of CHF 2.746 million (2013: 2.773 million).
Executive Committee’s Compensation1
million CHF 2014 2013
Cash payments and benefitsBase salary 2.893 2.917Short-term incentive (cash)2 1.242 1.325Post-employment benefits / other benefits3 1.074 0.780Termination benefits in cash 4 0.999 5.179Share-based paymentsValue of E-STIP RSUs (number of RSUs will be determined in March 2015) 0.565 0.628Value of LTIP equity awards at fair value5 (number of equity awards 2014: 47 861; 2013: 82 055) 2.182 2.145Total 8.955 12.974Ratio of fixed compensation to the performance-related components of compensation (without termination payment) 99.49 % 90.21 %
The slight change in base salary and incentive payments in 2014 to the Execu-tive Committee is due to changes in Executive Committee members and salary increases to current Executive Committee members to bring them in line with benchmark data.
The number of LTIP Equity Awards decreased in 2014 (2014: 47 861, 2013: 82 055) due to the increase in share price on the date of grant of CHF 91.15 (2013: CHF 53.60). Note that the value of LTIP Equity Awards in CHF increased from CHF 2.145 million in 2013 to CHF 2.182 million in 2014 due in part to increases in base salary and changes in Executive Committee members.
2014: 5 members (average 5); 2013: 8 members (average 5.3). STIP 2013: paid in March 2014. The achievement for 2014 was 78.93 % (2013: 89.63 %) and will be paid out in April 2015 after the approval of the Shareholders Meeting. Social Security and pension fund and other benefits. The social security amounts disclosed on this line represents the full costs of the employer social security contribution for 2014. In 2013 the value of the social security benefit was calculated on benefit-related contributions (accrual principle). The full cost of the employer social security for 2013 was CHF 0.796 million. The table shows the fair value of the other benefits. This table discloses the amounts accrued for the years 2013 and 2014. The fair values were calculated using the fair value at grant date according to IFRS2. For more detailed comments, please refer to note 23 in the Consolidated Financial Report, in particular, the fair values are not actual payouts made, but provide information about the expected value of the awards at the grant date. It is possible that given the performance conditions placed on the shares, the eventual value will be higher or lower (or even zero).
1
2
3
4
5
REMUNERATION REPORT

108 LONZA ANNUAL REPORT 2014
The RSUs of the E-STIP and the equity awards of the LTIP have a three-year vesting period. The vesting of the LTIP equity awards is linked to performance conditions and the value at vesting may be higher or lower than at the time of the grant. In case of non-achievement of the performance conditions’ threshold, the LTIP value is zero. The RSUs of the E-STIP automatically vest at the end of the three-year vesting period.
Termination payments and the LTIP equity awards that vested according to the termination agreements are not included in fixed compensation ratio calculations.
No loans or credits were granted to current or former members of the Executive Committee during 2014 (nor in 2013). No loans or credits were outstanding as of 31 December 2014. During 2014, no payments (or waiver of claims) were made to current or former members of the Executive Committee or to persons closely linked to them. No member of the Executive Committee benefits materially from any contract between a Lonza company and a third party.
PERFORMANCE-RELATED VS. FIXED COMPENSATION
Performance-related 3.989 Performance-related 4.098
2014
million CHF
2013
million CHF
Fixed 3.697
47 %50 %
53 %50 %
Fixed 3.967
4.4 HIGHEST COMPENSATION PAID TO A MEMBER OF THE EXECUTIVE COMMITTEE
Highest Compensation The highest compensation to a member of the Executive Committee in 2014 was paid to the CEO. The CEO received CHF 1.777 million (2013: 1.580 million) paid in cash, E-STIP RSUs and benefits and was granted 15 798 (2013: 23 815) LTIP Equity awards for 2014 equivalent to a fair value of CHF 0.720 million (2013: 0.638 million). The vesting of these LTIP equity awards is linked to vesting and performance conditions, therefor the value at vesting may be higher or lower than at the time of grant. In the case of non-achievement of the performance conditions’ threshold, the LTIP value is zero.

109 LONZA ANNUAL REPORT 2014
Compensation of the Highest-Paid Individual (Richard Ridinger, CEO)
million CHF 2014 2013
Base salary 0.915 0.859Short-Term Incentive (cash)1 0.392 0.386Post-employment benefits / other benefits2 0.274 0.142Share-based paymentsValue of E-STIP RSUs (number of RSUs will be determined in March 2015) 0.196 0.193Value of LTIP equity awards at fair value3 (number of equity awards: 2014: 15 798, 2013: 23 815) 0.720 0.638Total4 2.497 2.218Ratio of fixed compensation to the performance-related components of compensation 90.97 % 82.24 %
4.5 COMPENSATION TO DEPARTING MEMBERS OF THE EXECUTIVE COMMITTEE
In 2014, one member of the Executive Committee left the company. According to the terms of the applicable employment agreement, this departing individual will receive total compensation of CHF 0.999 million in cash and benefits until the end of the salary continuation period.
In 2013, three members of the Executive Committee left the company and, as a result of the termination, received termination benefits as outlined under Section 4.3 above. This information was fully disclosed in the 2013 Remuneration Report.For all departing members of the Executive Committee, all outstanding LTIP equity grant awards will vest according to the achievement of performance conditions and according to the applicable LTIP plan rules for each plan year.
4.6 DETAILS OF INCENTIVE PLANS
This subsection describes the plan details of the Short-Term Incentive Plans (STIP) and the Long-Term Incentive Plan (LTIP):
A SHORT-TERM INCENTIVE PLANS (STIP)
History and Participation In 2005, the Board of Directors implemented the cur-rent Cash STIP for the majority of the Group’s employees, including the members of the Executive Committee. Approximately 90 % of our employees participate in short-term incentive plans, either in the Cash STIP program or in a local bonus program.
The STIP for senior managers, including the Executive Committee members, is paid two-thirds in cash (Cash STIP) and one-third in RSUs (E-STIP). These RSUs will vest after three years. The E-STIP was implemented in 2011.
Definition of Targets The performance criteria are set annually based on the company’s short-term objectives and assessed for achievement at the end of the year against the audited financial results. The performance metrics for both elements of the STIP (Cash STIP and E-STIP) are the same.
Incentive (STIP) for the reporting year. The 2013 STIP was paid in March 2014; the 2014 STIP will be paid in April 2015 after AGM shareholder’s approval. Social security and pension fund as well as company car, health insurance and tuition. The social security amounts disclosed on this line represents the full costs of the employer social security contribution for 2014. For 2013, the value of the social security benefit was calculated on benefit related contributions (accrual principle). The full cost of the employer social security for 2013 was CHF 0.207 million. The table shows the fair value of the other benefits. The fair values were calculated using the fair value at grant date according to IFRS2. For more detailed comments, please refer to note 23 in the Consolidated Financial Report, in particular, the fair values are not actual payouts made, but provide information about the expected value of the awards at grant date. It is possible that given the performance conditions placed on the shares, the eventual value will be higher or lower (or even zero). The increase in total compensation reflects the changes in compensation recommended by the external consultants to bring the CEO in line with competitive benchmarking.
1
2
3
4
REMUNERATION REPORT

110 LONZA ANNUAL REPORT 2014
Cash STIP
Objective The STIP plans provide the potential for an annual incentive based on the financial performance of the Group and the performance of the participant.
Payments Timing and Form The Cash STIP for the financial year is paid to the Executive Committee in cash in April 2015 after the AGM shareholder approval.
Cash STIP
Targeted Cash STIP amount as % of base salary
– 53.3 % for the Chief Executive Officer – 50 % for other Executive Committee members
Cash STIP Targets Weighting
– 50 % Core EBIT (Financial)– 15 % Lonza Sales (Financial)– 15 % Operational Free Cash Flow (Financial)– 20 % Personal targets for Executive Committee members are
linked back to the financial targets (10 % weighting for Core EBIT, 5 % weighting for Sales and 5 % weighting for Operational Free Cash Flow).
Maximum Potential Payout
Depending on the financial results achievement, the Cash STIP payout may range between 0 % and 200 % for the financial targets and 0 % and 150 % for personal targets. Total maximum payout opportunity is 190 % (80 % financial × 200 % + 20 % personal × 150 % = 190 %)
Extended ShortTerm Incentive Plan (ESTIP)
Relationship to STIP The E-STIP target is part of the overall STIP concept and accounts for one-third of the aggregate amount of Cash STIP and E-STIP. The E-STIP is paid in the form of RSUs.
E-STIP
Targeted E-STIP amount as % of base salary
– 26.7 % for the Chief Executive Officer – 25 % for other Executive Committee members
E-STIP Targets Weighting Same weighting as Cash STIP
Maximum Potential Payout Same maximum potential payout as Cash STIP
Alignment on Share Price The value of the plan is strongly dependent on Lonza’s future share price, thereby further reinforcing the link to shareholders’ interests. The E-STIP is awarded in the form of RSUs that are subject to a three-year vest-ing period.
Grant Timing The grant of the RSUs to the EC under the E-STIP 2014 will take place in April 2015 after the AGM shareholder approval (E-STIP 2013 on 31 March 2014), at which date the number of RSUs will be determined based on the closing stock price of the last business day in March. These RSUs vest after three years.
Dividend and Voting Rights The E-STIP RSUs do not qualify for dividends and voting rights until vested.
REMUNERATION REPORT
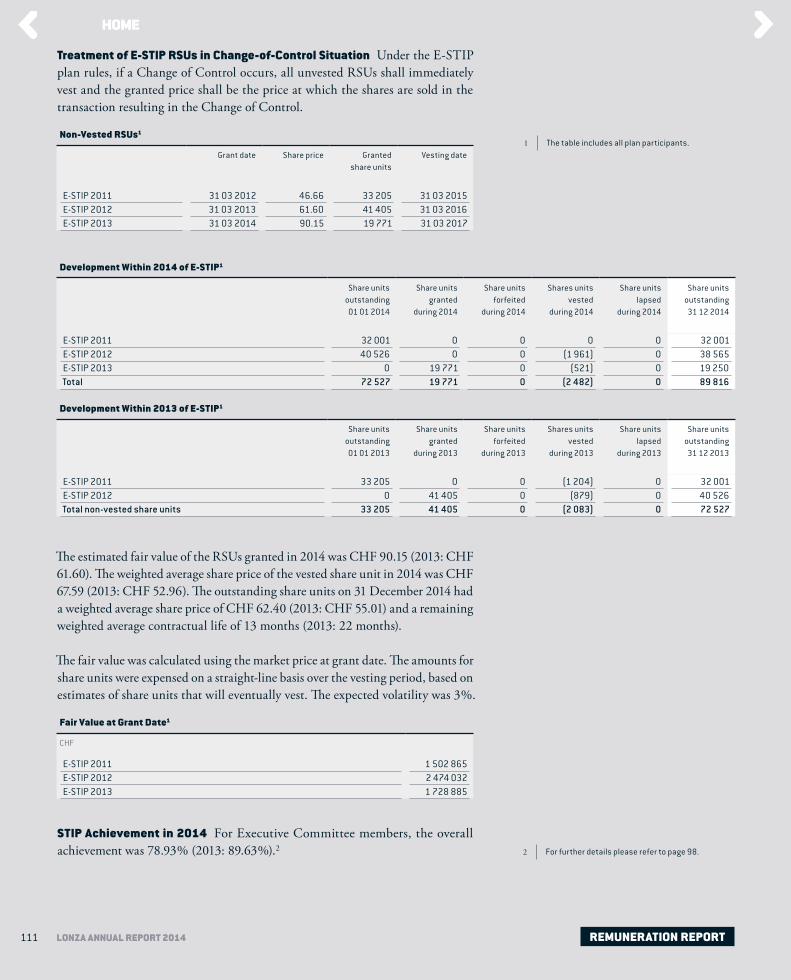
111 LONZA ANNUAL REPORT 2014
Treatment of E-STIP RSUs in Change-of-Control Situation Under the E-STIP plan rules, if a Change of Control occurs, all unvested RSUs shall immediately vest and the granted price shall be the price at which the shares are sold in the transaction resulting in the Change of Control.
Non-Vested RSUs1
Grant date Share price Granted share units
Vesting date
E-STIP 2011 31 03 2012 46.66 33 205 31 03 2015E-STIP 2012 31 03 2013 61.60 41 405 31 03 2016E-STIP 2013 31 03 2014 90.15 19 771 31 03 2017
Development Within 2014 of E-STIP1
Share units outstanding 01 01 2014
Share units granted
during 2014
Share units forfeited
during 2014
Shares units vested
during 2014
Share units lapsed
during 2014
Share units outstanding 31 12 2014
E-STIP 2011 32 001 0 0 0 0 32 001E-STIP 2012 40 526 0 0 (1 961) 0 38 565E-STIP 2013 0 19 771 0 (521) 0 19 250Total 72 527 19 771 0 (2 482) 0 89 816
Development Within 2013 of E-STIP1
Share units outstanding 01 01 2013
Share units granted
during 2013
Share units forfeited
during 2013
Shares units vested
during 2013
Share units lapsed
during 2013
Share units outstanding 31 12 2013
E-STIP 2011 33 205 0 0 (1 204) 0 32 001E-STIP 2012 0 41 405 0 (879) 0 40 526Total non-vested share units 33 205 41 405 0 (2 083) 0 72 527
The estimated fair value of the RSUs granted in 2014 was CHF 90.15 (2013: CHF 61.60). The weighted average share price of the vested share unit in 2014 was CHF 67.59 (2013: CHF 52.96). The outstanding share units on 31 December 2014 had a weighted average share price of CHF 62.40 (2013: CHF 55.01) and a remaining weighted average contractual life of 13 months (2013: 22 months).
The fair value was calculated using the market price at grant date. The amounts for share units were expensed on a straight-line basis over the vesting period, based on estimates of share units that will eventually vest. The expected volatility was 3 %.
Fair Value at Grant Date1
CHF
E-STIP 2011 1 502 865 E-STIP 2012 2 474 032E-STIP 2013 1 728 885
STIP Achievement in 2014 For Executive Committee members, the overall achievement was 78.93 % (2013: 89.63 %).2
The table includes all plan participants.1
For further details please refer to page 98.2
REMUNERATION REPORT

112 LONZA ANNUAL REPORT 2014
B LONG-TERM INCENTIVE PLAN (LTIP)
History and Participation The LTIP is an equity-based plan introduced in 2006 for a selected segment of key employees, including the Executive Committee.
Objectives The LTIP has been designed to align the interests of key employees with those of Lonza’s shareholders and to serve as a retention tool. LTIP participants are eligible to receive a number of Lonza shares at the end of the vesting period, provided that certain performance conditions are met.
Maximum Equity Awards Under the LTIP, selected key employees are awarded the right to receive a number of registered shares of Lonza in the future. Depend-ing on the level of the job, the maximum equity award grant is between 10 % and 160 % of the annual base salary. Maximum equity award grants are determined at the beginning of the vesting period of three years. Vesting will depend on achieve-ment of the performance conditions and cannot exceed the maximum amount of granted equity awards:
Maximum award of LTIP as % of base salary at grant date – 160 % for Chief Executive Officer – 150 % for other Executive Committee members
Restriction and Vesting The central feature of the plan is that key employees will only receive title and ownership of the shares after a three-year vesting period and only if the performance metrics required for vesting are fully or partially met.
Vesting Targets For the 2011 and 2012 LTIP, the performance metrics were EVA and TSR with 50 % weight for each metric. For the 2013 LTIP, the performance metrics were EPS and TSR with 50 % weight for each measure. For the 2014 LTIP, the performance metrics were Core EPS and Core RONOA with 50 % weight for each measure.
Reasons for Change of 2014 LTIP Targets Based on feedback from the invest-ment community, Core EPS and Core RONOA were selected as 2014 LTIP targets to serve as the most appropriate indicators of Lonza’s strategic success. With the payout value directly linked to these key financial metrics, these two measures focus on Lonza’s financial performance that will drive the valuation of Lonza with investors. The value of the LTIP will be ultimately driven by the share price at the time of payout, further linking the LTIP to the interests of the shareholders.
REMUNERATION REPORT

113 LONZA ANNUAL REPORT 2014
Overview of Vesting Conditions for the LTIP
Total Shareholder Return (TSR1) For years 2011, 2012 and 2013 the vesting of up to 50 % of the granted equity awards is based on the total shareholder return (TSR) achieved during Lonza’s three fiscal years before the end of the vesting period compared with a peer group. The 2011, 2012 and 2013 TSR target is fully reached in the event that Lonza outperforms the average of the peer group (MSCI Chemicals, MSCI Health Care, SPI) on an annualized basis by 9 % on average over three years. At this TSR level, the maximum amount of the granted equity awards vests. If the TSR target is not fully reached, the number of granted equity awards that vest is reduced linearly according to the achieved target of TSR. The threshold target is to achieve the same annualized TSR development as the index of the peer group. If this minimum target is met, 25 % of the granted equity awards will vest. If the threshold is not met, the granted equity awards linked to this performance metric will lapse.
Economic Value Added (EVA2) For the years 2011 and 2012, the vesting of up to 50 % of the remaining granted equity awards is based on the average annual Group Economic Value Added (EVA) growth achieved during Lonza’s three fiscal years at the end of the vesting period. For competitive reasons, Lonza does not further specify the details of the absolute objectives. The associated achievement and payouts are disclosed on page 98. If the EVA target is not fully reached, the percentage of the granted equity awards from the grant that vest is reduced lin-early according to the EVA achievement. The threshold target is to maintain the same level of EVA at the beginning of the performance period. If this minimum target is met, 25 % of the granted equity awards will vest. If the EVA threshold is not met, the granted equity awards linked to this performance metric will lapse.
Earnings Per Share (EPS) For the year 2013, the vesting of up to 50 % of the granted equity awards is dependent on growth of earnings per share (EPS) achieved during Lonza’s three fiscal years. For competitive reasons, Lonza does not further specify the details of the absolute objectives. The actual target and associated proposed payouts will be disclosed in Lonza’s Remuneration Report relating to the year of payout. If the EPS target is not fully reached, the percentage of the granted equity awards from the grant that vest is reduced linearly according to the EPS achieve-ment. The threshold target is to maintain the same level of EPS at the beginning of the performance period. If this minimum target is met, 25 % of the granted equity awards will vest. If the EPS threshold is not met, the granted equity awards linked to this performance metric will lapse.
Core 3 Earnings Per Share (Core EPS) For the year 2014, the vesting of up to 50 % of the granted equity awards is dependent on growth of Core Earnings per Share achieved during Lonza’s three fiscal years (see footnote 3 for definition of Core). Lonza believes that understanding and rewarding Lonza’s performance is enhanced by emphasizing core results during the performance period because core results enable a better comparison over a period of years. For 2014, the Core EPS maxi-mum grant is reached if Lonza meets its Core EPS target within the performance period. If the Core EPS maximum growth is not fully reached, the percentage of the granted equity awards from the share entitlement that vest is reduced linearly
TSR measures growth in share price with dividends reinvested. This measure is based on an external market view of the company’s success. EVA or Economic Value Added is an estimate of true “economic” profit, or the amount by which earnings exceed or fall short of the required minimum rate of return that shareholders and lenders could get by investing in other securities of comparable risk. EVA is calculated as follows: Net operating profit after taxes minus cost of capital of net operating assets.
1
2
Core results exclude exceptional items such as restructuring charges, impairments and amortization of acquisition-related intangible assets, which can differ significantly from year to year.
3
REMUNERATION REPORT

114 LONZA ANNUAL REPORT 2014
to the threshold of Core EPS at the beginning of the performance period. If this minimum target is met, 25 % of the granted equity awards will vest. If the thresh-old is not met, granted equity awards related to this performance will lapse. The minimum threshold was determined by the NCC to approximate the actual Core EPS on 31 December 2013. If such a threshold is not reached the payout will be zero. If this threshold is reached, 25 % of the equity award granted under the Core EPS vesting condition will vest. The maximum was determined to approximate 150 % of the Core EPS at threshold. If such a level of Core EPS is reached, the maximum equity award granted under the Core EPS vesting condition of the granted equity award will vest. For competitive reasons, Lonza does not disclose the absolute Core EPS target at year-end 2016. However, the target was determined by the NCC to approximate the Core EPS required to meet Lonza’s challenging strategic goals and support Lonza’s three-year plan. Lonza is committed to having the effective payout under the LTIP 2014 approved by the AGM 2017 through the consultative vote relating to the Remuneration Report for the 2016 financial year.
Core1 Return on Net Operating Assets (Core RONOA) For the year 2014, the vest-ing of up to 50 % of the granted equity awards is dependent on the growth of Lonza’s Core RONOA during Lonza’s three fiscal years (31 December 2013 to 31 December 2016) (see footnote 1 for definition of Core). The Core RONOA maximum grant is reached if Lonza meets its Core RONOA target within the performance period. If the Core RONOA maximum growth is not fully reached, the percentage of the granted equity awards from the share entitlement that vest is reduced linearly to the threshold of Core RONOA at the beginning of the performance period. If this minimum target is met, 25 % of the granted equity awards will vest. If the threshold is not met, granted equity awards related to this performance will lapse. The minimum threshold was determined by the NCC to approximate the actual Core RONOA on 31 December 2013. If such a threshold is not reached, the payout will be zero. If this threshold is reached, 25 % of the granted equity awards granted under the Core RONOA vesting condition will vest. The maximum was determined to approximate 130 % of the Core RONOA at the threshold level. If such a level of Core RONOA is reached, the maximum equity awards granted under the Core RONOA vesting condition will vest. For competitive reasons, Lonza does not disclose the absolute Core RONOA target at year-end 2016. However, the target was determined by the NCC to approximate the Core RONOA required to meet Lonza’s challenging strategic goals and sup-port Lonza’s three-year plan. Lonza is committed to having the effective payout under the LTIP 2014 approved by the AGM 2017 through the consultative vote relating to the Remuneration Report for the 2016 financial year.
Treatment of LTIP of Change of Control Situations Under the LTIP rules, if a Change of Control occurs, all unvested granted shares shall immediately vest and the granted price shall be the price at which the shares are sold in the transaction resulting in the Change in Control. The Executive Committee member does not need to terminate his or her employment to receive this Change of Control vesting.
Core results exclude exceptional items such as restructuring charges, impairments and amortization of acquisition-related intangible assets, which can differ significantly from year to year.
1
REMUNERATION REPORT

115 LONZA ANNUAL REPORT 2014
Actual Performance and Payout for the LTIP 2011 and 2012 The minimum threshold of the performance metrics of the 2011 LTIP were not met and the granted equity awards lapsed and no payments were made relating to the 2011 LTIP in 2014. Performance under the 2012 LTIP exceeded the maximum for EVA generating a 100 % payout on 50 % of the total award. Performance under the 2012 LTIP achieved the maximum target for TSR generating a 100 % payout on the remaining 50 % of the total award. The total 2012 LTIP payout equals 100 %.
Goal-2012 LTIP
Actual Performance
Payout in %
EVA (Economic Value Added) CHF 82 m 100TSR (Total Shareholder Return) exceeded indices by 15.7 % 100
Historical Data on Vesting Conditions The following table shows historical data on vesting conditions for LTIP granted equity awards in the years 2011 to 2014, information used in calculating the fair value of the LTIP grants, and the number of equity awards vesting following the target attainment in the respective year.
Details of Long-Term Incentive Plans1
Grant date Share price CHF
Granted equity awards
Fair value at Grant Date
Vesting date
LTIP 2011 01 02 2011 74.35 152 077 5 653 463 31 01 2014LTIP 2012 01 02 2012 49.69 267 031 4 975 783 31 01 2015LTIP 2013 01 02 2013 53.60 204 653 5 484 728 31 01 2016LTIP 2014 01 02 2014 91.15 137 180 6 251 978 31 01 2017
Vesting Conditions at Grant Date1
Market price
CHF
Granted equity awards
Fair value of equity awards
Expected vesting EVA / EPS / RONOA
at grant date
Probability minimum
targets
Volatility employees
Total probability
Total cost at grant date
CHF
LTIP 2011 TSR 74.35 76 038 37.18 100 % 3 % 97 % 2 741 911LTIP 2011 EVA 74.35 76 039 74.35 50 % 100 % 3 % 97 % 2 741 947 LTIP 2012 TSR 49.69 133 515 24.85 100 % 3 % 97 % 3 217 665 LTIP 2012 EVA 49.69 133 516 49.69 25 % 100 % 3 % 97 % 1 608 844 LTIP 2013 TSR 53.60 102 327 26.80 100 % 3 % 97 % 2 660 093LTIP 2013 EPS 53.60 102 327 53.60 50 % 100 % 3 % 97 % 2 660 093LTIP 2014 Core RONOA 91.15 68 590 91.15 50 % 100 % 3 % 97 % 3 032 210LTIP 2014 Core EPS 91.15 68 590 91.15 50 % 100 % 3 % 97 % 3 032 210
The table includes all plan participants.1
REMUNERATION REPORT

116 LONZA ANNUAL REPORT 2014
Development Within 2014 of the LTIP1
Equity awards outstanding 01 01 2014
Equity awards granted
during 2014
Equity awards forfeited
during 2014
Vested equity awards
during 2014
Equity awards lapsed
during 2014
Equity awards outstanding 31 12 2014
LTIP 2011 127 857 0 0 0 (127 857) 0LTIP 2012 276 754 0 0 0 0 276 754LTIP 2013 204 653 0 0 0 0 204 653LTIP 2014 0 137 180 0 0 0 137 180Total equity awards 609 264 137 180 0 0 (127 857) 618 587
Development Within 2013 of the LTIP1
Equity awards outstanding 01 01 2013
Equity awards granted
during 2013
Equity awards forfeited
during 2013
Vested equity awards
during 2013
Equity awards lapsed
during 2013
Equity awards outstanding 31 12 2013
LTIP 2010 124 142 0 0 0 (124 142) 0LTIP 2011 127 857 0 0 0 0 127 857LTIP 2012 267 031 9 723 0 0 0 276 754LTIP 2013 0 204 653 0 0 0 204 653Total equity awards 519 030 214 376 0 0 (124 142) 609 264
The estimated fair value of the granted equity awards in 2014 was CHF 45.58 (2013: CHF 26.80). No equity awards vested in 2014. The outstanding granted equity awards on 31 December 2014 had a weighted average share price of CHF 27.31 (2013: CHF 25.27) and a remaining weighted average contractual life of 10 months (2013: 15 months). The costs were calculated using the market price at grant date, including probabilities as per conditions of vesting. The amounts for equity awards are expensed on a straight-line basis over the vesting period, based on estimates of equity awards that will eventually vest.
Fair Value at Grant Date1
CHF
LTIP 2011 5 653 463LTIP 2012 4 975 783LTIP 2013 5 484 728LTIP 2014 6 251 978
The table includes all plan participants.1
REMUNERATION REPORT

117 LONZA ANNUAL REPORT 2014
4.7 COMPENSATION IN CASE OF TERMINATION 1
During 2014, the Executive Agreements for all members of the Executive Com-mittee were revised. The Agreements were revised to align them with competitive norms in Switzerland and comply with the Swiss Ordinance Against Excessive Pay for Stock-Exchange-Listed Companies. The following outlines the specific termination-related topics included in the revised Executive Agreements and the STIP, E-STIP and LTIP rules and administrative guidelines and practices.
A Notice Period
All members of the Executive Committee are entitled to a 12-month notice period for company-initiated terminations and employee-initiated terminations.
B Base Pay and Benefits
All members of the Executive Committee who terminate their employment will receive their base pay during the 12-month notice period and will be eligible for the benefits relating to the 12-month notice period, such as lump-sum expenses, pension fund, health and accident insurance, company car, family / children al-lowances according to their respective employment agreement.
C STIP Payouts in the Event of Termination (Cash- and E-STIP)2
Resignation by the Executive Subject to applicable law, if a member of the Executive Committee resigns at any time prior to distribution of Cash-STIP awards such member will not be entitled to any award with respect to the plan year in which he/she is terminated, except if (i) the termination as a result of such resignation occurs after December 31 of the plan year and (ii) the executive was not released from his obligation to work. Subject to applicable law, the departing Executive will forfeit the right to receive a transfer of any unvested E-STIP RSUs.
Termination by the Company Without Cause Any member of the Executive Com-mittee whose employment is terminated by the Company without cause will be entitled to a prorated Cash-STIP payment relating to the notice period. The de-parting Executive will be entitled to vesting of the unvested E-STIP RSUs at the end of the notice period.
Termination by the Company for Cause Any member of the Executive Committee whose employment terminated by the Company for Cause will not be entitled to the STIP payment relating to the current year (year of termination). The departing Executive will forfeit the right to receive a transfer of any unvested E-STIP RSUs.
Cases such as death, disability and retirement are not covered in this section
1
This summary of consequences in case of termination is based on plan rules applicable to STIP 2014.
2
REMUNERATION REPORT

118 LONZA ANNUAL REPORT 2014
STIP in Change of Control Any member of the Executive Committee whose em-ployment is terminated by the Company without cause or who terminates the employment due to good reason (such as his function / duties / responsibilities being altered or the Company or the successor to Lonza Group Ltd failing to confirm to the Executive in writing that no such alteration is intended) within eighteen (18) months following a change in control will be entitled to a STIP payment during the termination notice period (pro-rata) based on actual (to the extent it may be deter-mined) or presumed achievement and, if and to the extent the Executive is released from his / her obligation to work, based on assumed target achievement (100 %).
D LTIP Payouts in the Event of Termination
Resignation by the Executive Any member of the Executive Committee who resigns will forfeit the right to receive a transfer of any unvested LTIP awards.
Termination by the Company Without Cause Any member of the Executive Com-mittee whose employment is terminated by the Company without cause will forfeit the right to receive a transfer of any unvested 2014 LTIP awards if the end of the notice period occurs prior to the end of the performance period. If the end of the notice period occurs on or after the end of the performance period, the Executive is eligible for a payout as determined by the performance against LTIP targets. Unvested shares under the 2012 and 2013 LTIP will vest on a pro rata basis (⅓ after the first year and ⅔ after the second year).
Termination by the Company for Cause Any member of the Executive Committee whose employment is terminated by the Company for Cause will forfeit the right to receive a transfer of any unvested LTIP shares.
LTIP in Change of Control Under the LTIP rules, if a Change of Control occurs, all unvested granted shares shall immediately vest and the granted price shall be the price at which the shares are sold in the transaction resulting in the Change of Control.
REMUNERATION REPORT

119 LONZA ANNUAL REPORT 2014
E Non-Compete Clause
Under the terms of the Executive Agreement, the Executive whose employment is terminated agrees that he will not for a period of six (6) months following the end of the notice period, be partially or fully employed by any entity that mate-rially competes with the Company or any of its affiliates. In case of a breach of the non-competition clause, the Executive shall pay damages to the Company. As compensation for the period of non-competition, the Executive will receive a monthly consideration equal to the Executive’s last monthly base salary minus any new income the Executive earns in the relevant month.
The Company may elect to fully or partially release the terminating Executive Committee member from this non-competition obligation no later than ten (10) months prior to the end of the notice period.
F Claw-back
Any compensation (including fringe benefits) under the Executive Agreement is subject to claw-back or forfeiture if the compensation is not approved by the Shareholders’ Meeting.
REMUNERATION REPORT

120 LONZA ANNUAL REPORT 2014
5 SHARE OWNERSHIP OF THE MEMBERS OF THE BOARD OF DIRECTORS AND THE EXECUTIVE COMMITTEE
Based on information available to Lonza, the members of the Board of Directors and parties closely associated with them1 held, as of 31 December 2014, a total of 118 739 (2013: 123 424) registered shares in Lonza Group Ltd and controlled 0.22 % (2013: 0.23 %) of the share capital. None of the members of the Board of Directors or Executive Committee owns shares in the Group’s subsidiaries or associates.
The members of the Executive Committee and parties closely associated with them
held 28 215 (2013: 28 919) shares and controlled 0.05 % (2013: 0.05 %) of the share capital. The individual control rights are proportional to the holdings shown below.
Share ownership of acting members of the Board of Directors and Executive Com-mittee as of 31 December 2014:
Board of Directors Executive Committee
Lonza shares (numbers) 2014 2013 Lonza shares (numbers) 2014 2013
Rolf Soiron 66 298 63 656 Richard Ridinger 14 000 14 000
Patrick Aebischer 13 977 12 245 Sven Abend 0
Werner Bauer 13 709 12 227 Marc Funk 1 685 1 627
Thomas Ebeling 2 459 977 Toralf Haag 11 489 11 489
Jean-Daniel Gerber 10 734 8 983 Beat In-Albon 1 041 3
Barbara Richmond 510 Stephan Kutzer 1 800
Margot Scheltema 5 608 4 336
Jürgen Steinemann 2 922
Antonio Trius 2 522 1 340
Peter Wilden 19 660
6 EMPLOYEE SHARE PURCHASE PLAN (ESPP)
In keeping with its vision and culture, Lonza encourages employee participation in the company through stock ownership. During November of 2014, the Employee Share Purchase Plan (ESPP) was offered to the majority of active permanent em-ployees (including Executive Committee members). Under the terms of the 2014 ESPP, employees were given the opportunity to purchase shares of Lonza stock at a price of CHF 77.99. This price represents a discount of 30 % from the average weighted price of Lonza shares on the SIX Swiss Stock Exchange for the period from 24 November 2014 to 5 December 2014, which was CHF 111.42. The mini-mum investment amount is CHF 500 and the maximum CHF 3 000. All shares purchased under the 2014 ESPP are blocked from any disposal for a three-year period. During the blocking period, participants are the entitled beneficiaries of the shares and all attached rights.
Spouse, children below 18, any legal entities that they own or otherwise control, or any legal or natural person who is acting as their fiduciary.
1
REMUNERATION REPORT

121 LONZA ANNUAL REPORT 2014
Based on this offering, 1.75 million shares are held in trust in the names of partici-pants in a collective depository managed by Equatex AG. After the expiration of the blocking period (31 December 2017), all shares will be transferred to a private custody account in the participant’s name.
The ESPP is not part of an incentive plan. It is intended as a long-term share-savings scheme to provide employees with an incentive to strengthen personal commitment to and participate in Lonza’s overall strategic success.
More information relating to the financial disclosure of the ESPP can be found in the Financial Footnote on page 52.
7 GUIDE TO COMPENSATION APPROVALS BY THE ANNUAL GENERAL MEETING 2015
The specific compensation components to be approved by shareholders at the 8 April 2015 Lonza Annual General Meeting are as follows:a The maximum aggregate amount of fixed compensation of the Board of
Directors for the period until the Annual General Meeting 2016;b The maximum aggregate amount of fixed compensation of the Executive
Committee for the period between 1 July 2015 and 30 June 2016;c The aggregate amount of variable short-term compensation to be paid to the
Executive Committee in 2015 for the 2014 financial year; andd The maximum aggregate amount of variable long-term compensation granted
to the Executive Committee for 2015.
REMUNERATION REPORT

123 LONZA ANNUAL REPORT 2014
REPORT OF THE STATUTORY AUDITOR
Report of the Statutory Auditor to the General Meeting ofLonza Group Ltd, BaselWe have audited the remuneration report dated 31 December 2014 of Lonza Group Ltd for the year ended 31 December 2014. Our audit was limited to the information according to articles 14–16 of the Ordinance Against Excessive Compensation in Stock Exchange Listed Companies contained in sections 3.3, 4.3, 4.4 and 4.5, on pages 104 to 109 of the Remuneration Report in-cluded in the Lonza Annual Report.
Responsibility of the Board of Directors
The Board of Directors is responsible for the preparation and over-all fair presentation of the remuneration report in accordance with Swiss law and the Ordinance Against Excessive Compensation in Stock Exchange Listed Companies (Ordinance). The Board of Directors is also responsible for designing the remuneration system and defining individual remuneration packages.
Auditor’s Responsibility
Our responsibility is to express an opinion on the accompanying remuneration report. We conducted our audit in accordance with Swiss Auditing Standards. Those standards require that we comply with ethical requirements and plan and perform the audit to ob-tain reasonable assurance about whether the remuneration report complies with Swiss law and articles 14–16 of the Ordinance.
An audit involves performing procedures to obtain audit evidence on the disclosures made in the remuneration report with regard to compensation, loans and credits in accordance with articles 14–16 of the Ordinance. The procedures selected depend on the audi-tor’s judgment, including the assessment of the risks of material misstatements in the remuneration report, whether due to fraud or error. This audit also includes evaluating the reasonableness of the methods applied to value components of remuneration, as well as assessing the overall presentation of the remuneration report.
We believe that the audit evidence we have obtained is sufficient and appropriate to provide a basis for our opinion.
Opinion
In our opinion, the remuneration report for the year ended 31 December 2014 of Lonza Group Ltd complies with Swiss law and articles 14–16 of the Ordinance.
KPMG AG
Michael Blume Florin Janine KrappLicensed Audit Expert Licensed Audit ExpertAuditor in Charge
Zurich, 26 February 2015
REMUNERATION REPORT

125 LONZA ANNUAL REPORT 2014
Group Structure and Shareholders 126Capital Structure 128Board of Directors 131Executive Committee 142Compensation, Shareholdings and Loans 146Shareholders’ Participation Rights 146Changes of Control and Defense Measures 147Auditors 148Information Policy and Key Reporting Dates 149
CORPORATE GOVERNANCE REPORT
CORPORATE GOVERNANCE REPORT
[ CLICK THE ARTICLES TO NAVIGATE ]

126 LONZA ANNUAL REPORT 2014
This Corporate Governance Report presents the structure, rules and processes that form the basis of Lonza’s corporate governance. The Report follows the struc-ture of the SIX Swiss Exchange’s Directive on Information relating to Corporate Governance.
The principles and rules of Lonza’s corporate governance are laid down in the Lonza Articles of Association1 and in the Regulations Governing Internal Organization and Board Committees2, including their Charters. In the implementation of its corporate governance, Lonza follows the Swiss Code of Best Practice for Corporate Governance issued by the Swiss Business Federation economiesuisse.
1 GROUP STRUCTURE AND SHAREHOLDERS
1.1 OPERATIONAL GROUP STRUCTURE
Segments Lonza’s activities are organized into two segments: – The Pharma&Biotech segment covers all offerings directed to pharmaceu tical
markets and includes three business units: Custom Development, Custom Manufacturing and Bioscience Solutions. This all-encompassing segment offers pharmaceutical and biotech industries Lonza’s recognized development and manufacturing know-how and broad technology platform. For further details about the Pharma&Biotech segment and the Custom Manufacturing, Custom Development and Bioscience Solutions business units, see the Pharma&Biotech section of the Lonza Annual Report, Corporate Overview, on pages 42 ff.
– The Specialty Ingredients segment includes consumer-oriented offerings with five business units: Consumer Care, Agro Ingredients, Industrial Solutions, Wood Protection and Water Treatment. For further details about the Specialty Ingredients segment and its five business units, see the Specialty Ingredients section of the Lonza Annual Report, Corporate Overview, on pages 49 ff.
www.lonza.com/aoa www.lonza.com/orgreg
1
2
Chief Strategy Officer3
Corporate
Functions
EXECUTIVE COMMITTEE (EC) CEO — CFO — COO — COO — CSO3
Operational
Units
Segments Business Service
Organizations
Pharma&Biotech Specialty Ingredients
BOARD OF DIRECTORS
CORPORATE GOVERNANCE REPORT

127 LONZA ANNUAL REPORT 2014
Operational Units Lonza’s Operational Units are divided into four units: Pharma&Biotech Operations and Research & Technology, along with Specialty Ingredients Operations and Research & Technology.
Corporate Functions The Corporate Functions include Human Resources, Finance & Controlling, IT, Corporate Development, Engineering, Legal / IP, Logistics and Purchasing, Quality, Corporate Communication and Investor Relations and Envi-ronment Health and Safety.
Business Service Organization The Business Service Organizations are regional units that support Lonza’s market activities and implement corporate guidelines from a regional perspective. They are divided into four regions: EMEA, North America, South America and Asia.
Holding Company and Listed Companies Lonza Group Ltd, with registered office in Basel (CH), is the ultimate parent company of the Lonza Group. Except for Lonza Group Ltd, no company belonging to the Lonza Group is listed. Please refer to Section 2.4, page 127 below for information on the listed shares, the stock exchanges on which Lonza Group Ltd is listed and the market capitalization.
Principal Subsidiaries and Joint Ventures The principal subsidiaries and joint ventures of the Lonza Group are shown on pages 80 and 81 of the Lonza Financial Report 2014.
1.2 SIGNIFICANT SHAREHOLDERS
Pursuant to the information provided to Lonza by its shareholders according to the Swiss Stock Exchange Act (SESTA), the following shareholders held more than 3 % of the share capital as of 31 December 2014:
Principal Shareholders
Number of shares %
BlackRock, Inc., New York, NY (USA) 3 124 779 5.90Schroders Plc, London (UK)1 1 636 841 3.09UBS Fund Management (Switzerland) AG, Basel (CH) 1 608 429 3.04
Lonza knows of no other shareholder(s) that owned more than 3 % of its share capital as of 31 December 2014. To Lonza’s best knowledge, the above-mentioned shareholders are not linked by any shareholders’ agreement or similar arrangement with respect to their shareholdings in Lonza or the exercise of shareholders’ rights. For a full review of the individual disclosure notifications made during 2014 in accordance with Article 20 SESTA, please refer to the SIX Swiss Exchange dis-closure platform2 or the Lonza website3.
1.3 CROSS-SHAREHOLDINGS
Lonza Group Ltd has not entered into any cross-shareholdings.
Schroders Plc announced that it fell below the threshold of 3 % as of 16 January 2015.
1
www.six-exchange-regulation.com/ publications/published_notifications/ major_shareholders_en.html www.lonza.com/major-shareholders-and-changes-in-disclosed-shareholdings
2
3
CORPORATE GOVERNANCE REPORT

128 LONZA ANNUAL REPORT 2014
2 CAPITAL STRUCTURE
2.1 SHARE CAPITAL
As of 31 December 2014, Lonza’s share capital amounted to CHF 52 920 140, fully paid-in and divided into 52 920 140 registered shares with a par value of CHF 1 each. Shareholder Structure
Shareholders
% %
1 2014
Shares %
Shareholders
%
1 2013
Shares %
Switzerland 85.49 26.17 87.99 22.99United Kingdom 1.29 19.05 1.06 28.07USA 4.51 6.34 3.57 7.12Others 8.70 5.94 7.37 5.53Shares in transit 40.79 34.56Treasury shares without voting rights 0.01 1.71 0.01 1.79Total 100.00 100.00 100.00 100.00Total number of shares 52 920 140 52 920 140
Share Register
1 2014 1 2013
Registered shareholders 13 474 14 937Registered shares 31 265 187 34 561042
Share distribution: 1 – 100 5 579 5644 101 – 1 000 6 858 8 083 1 001 – 50 000 959 1 145 50 001 – 100 000 34 30 100 001 – 1 000 000 41 31 over 1 000 000 3 4Total registered shareholders 13 474 14 937
2.2 AUTHORIZED AND CONDITIONAL CAPITAL
Authorized Capital The Board of Directors is authorized to increase, at any time until 9 April 2015, the share capital of Lonza through the issuance of a maximum of 5 000 000 fully paid-in registered shares with a par value of CHF 1 each up to a maximum aggregate amount of CHF 5 000 000. This authorized capital was created by the Annual General Meeting held on 9 April 2013. The additional terms and conditions of the authorized capital (including the group of beneficiaries who have the right to subscribe for this additional capital) are set out in Articles 4ter of the Lonza Articles of Association2.
As of 31 December1
www.lonza.com/aoa 2
CORPORATE GOVERNANCE REPORT

129 LONZA ANNUAL REPORT 2014
Contingent Capital Lonza’s share capital may be increased through the issuance of a maximum of 5 029 860 fully paid-in registered shares with a par value of CHF 1 each up to a maximum aggregate amount of CHF 5 029 860. This contingent capital (also called conditional capital) was created by the Annual General Meeting on 11 April 2005. The additional terms and conditions of the conditional capital (including the group of beneficiaries who have the right to subscribe for this additional capital) are set out in Articles 4bis of the Lonza Articles of Association1.
According to Article 4quater of the Lonza Articles of Association1, the capital increases in the form of contingent capital and authorized capital may increase Lonza’s share capital by a maximum aggregate amount of CHF 5 029 860.
2.3 CHANGES IN CAPITAL
The share capital has not changed in the last three financial years.
2 2014 2 2013 2 2012
Share capital in CHF 52 920 140 52 920 140 52 920 140Registered shares 52 920 140 52 920 140 52 920 140Par value in CHF / share 1 1 1
2.4 SHARES AND PARTICIPATION CERTIFICATES
Lonza registered shares, with a par value of CHF 1 each, are listed on the SIX Swiss Exchange (SIX), with secondary listing on the Singapore Exchange Securities Trading Limited (SGX-ST). In Switzerland they are included in the SIX SMIM (SMI Mid) Index.
Lonza has not issued any participation certificates (Partizipationscheine, non-voting shares).
Security numbers: (i) SIX: 001384101 (valor), ISIN CH0013841017, stock symbol: LONN VX (Telekurs); (ii) SGX-ST stock code: O6Z
On 31 December 2014, Lonza had a market capitalization of CHF 5 937 million (2013: CHF 4 477 million).
2.5 PROFIT-SHARING CERTIFICATES
Lonza has not issued any non-voting equity security (Genussscheine, profit-sharing certificates).
www.lonza.com/aoa 1
As of 31 December2
CORPORATE GOVERNANCE REPORT

130 LONZA ANNUAL REPORT 2014
2.6 LIMITATIONS ON TRANSFERABILITY AND NOMINEE REGISTRATIONS
Purchasers of registered shares declaring that they have acquired these shares in their own name and for their own account will be entered without limitation as shareholders with voting rights in the share register. Persons who do not declare to have acquired the respective shares in their own name and for their own account are considered “nominees” and will be entered with voting rights in the share register up to a maximum of 2 % of the share capital, unless the actually entitled persons are revealed. The details are set out in Article 6 of the Lonza Articles of Associa-tion1. This restriction may only be removed by a resolution of the Shareholders’ Meeting with a quorum in accordance with Swiss law.
2.7 CONVERTIBLE BONDS AND OPTIONS
Convertible Bonds Neither Lonza Group Ltd nor any of its subsidiaries has outstanding convertible bonds.
Options As of 31 December 2014, no options or warrants to acquire shares issued by or on behalf of Lonza Group Ltd were outstanding.
www.lonza.com/aoa 1
CORPORATE GOVERNANCE REPORT

131 LONZA ANNUAL REPORT 2014
3 BOARD OF DIRECTORS
3.1 MEMBERS OF THE BOARD OF DIRECTORS
The Board of Directors is made up of nine non-executive members:
Name Nationality Year of birth Position held Year of initial appointment
Expiration of current term of office
Independence
Rolf Soiron Swiss 1945Chairman of the Board of Directors Member of the Innovation and Technology Committee 2005 2015 Independent
Patrick Aebischer Swiss 1954Vice Chairman of the Board of Directors Chairman of the Innovation and Technology Committee 2008 2015 Independent
Werner Bauer German 1950
Member of the Board of Directors Member of the Innovation and Technology Committee 2013 2015 Independent
Thomas Ebeling German 1959Member of the Board of Directors Member of the Nomination and Compensation Committee 2013 2015 Independent
Jean-Daniel Gerber Swiss 1946Member of the Board of Directors Chairman of the Nomination and Compensation Committee 2011 2015 Independent
Barbara Richmond English 1960Member of the Board of Directors Member of the Audit and Compliance Committee 2014 2015 Independent
Margot Scheltema Dutch 1954Member of the Board of Directors Chairwoman of the Audit and Compliance Committee 2012 2015 Independent
Jürgen Steinemann German 1958Member of the Board of Directors Member of the Nomination and Compensation Committee 2014 2015 Independent
Antonio Trius Spanish 1955Member of the Board of Directors Member of the Audit and Compliance Committee 2013 2015 Independent
The assessment of the independence of the members of the Board of Directors is made pursuant to Article 14 of the Swiss Code of Best Practice for Corporate Gov-ernance. Independent members shall mean non-executive members of the Board of Directors who have never been members of the Executive Committee, or were members thereof more than three years ago, and who have no or comparatively minor business relations with the company. Interim functions of Board members in the Executive Committee in exceptional circumstances for a limited period of time are not taken into consideration.
CORPORATE GOVERNANCE REPORT

132
ROLF SOIRON
LONZA ANNUAL REPORT 2014
3.2 ACTIVITIES AND FUNCTIONS OF THE MEMBERS OF THE BOARD OF DIRECTORS
Rolf Soiron Holds a PhD in history from the University of Basel and a PMD from the Harvard Business School.
Chairman of the Board of Directors of Lonza Group Ltd (since April 2005)
Current activities and functions: – Chairman of the Council of the Foundation of the Graduate Institute of
International and Development Studies, Geneva (since 2014) and Member of the Council (since 2010)
– Member of the Council of the International Committee of the Red Cross, Geneva (since 2010) and Member of the International Committee of the Red Cross, Geneva (since 2009)
– Member of the Board of economiesuisse (since 2009) – Member of the Board of Directors of Jungbunzlauer Holding AG (since 1993)
Former activities and functions: – Chairman of the Board of Directors of Holcim Ltd (2003 – 2014) and member
of the Board (1994 – 2014) – Chairman of the Foundation Council of Avenir Suisse (2009 – 2014) – CEO ad interim of Lonza Group Ltd, Basel (January 2012 – April 2012) – Chairman of the Board of Directors of Nobel Biocare Holding Ltd (2003 – 2010) – Chairman of the Basel University Council (1995 – 2005) – Managing Director of Jungbunzlauer Group (2001 – 2003) – CEO of Jungbunzlauer Group (1993 – 2001) – Sandoz Group – COO and Head of Pharma in Basel (1992 – 1993),
Group Vice-President Agribusiness USA in New York (1988 – 1992) – Protek Group (orthopedic implants) – President and CEO (1983 – 1987) – Sandoz Group – various functions in Human Resources, Finance and
Corporate (1972 – 1983)
CORPORATE GOVERNANCE REPORT

133
PATRICK AEBISCHER
LONZA ANNUAL REPORT 2014
Patrick Aebischer Holds a doctorate in medicine from the University of Geneva. Has received numerous honors, including the Robert Bing Prize of the Swiss Academy of Medicine and the Pfizer Foundation Prize for Clinical Neurosciences.
Vice-Chairman of the Board of Directors of Lonza Group Ltd (since April 2014) and Member of the Board of Directors (since March 2008)
Current activities and functions: – Chairman of the Advisory Board of the Novartis Venture Fund
(since December 2014) – Member of the Foundation Board of the World Economic Forum (since 2013) – Member of the Singapore Biomedical Sciences International Advisory Council
(since 2013) – Member of the Board of Directors of Nestlé Health Science SA (since 2011)1
– President of the Swiss Federal Institute of Technology of Lausanne (EPFL) and Professor of Neurosciences (since 2000)
– Fellow of the American Institute for Medical and Biological Engineering (since 2000)
– Fellow of the Swiss Academy of Medical Sciences (since 1998) – Representative of the EPFL in the board of various Swiss foundations
Former activities and functions: – Founder of three biotechnology companies
Patrick Aebischer will resign from this position in April 2015. Patrick Aebischer has been proposed as member of the Board of Directors of Nestlé SA. His election will be resolved by the Annual General Meeting of Nestlé SA on 16 April 2015.
1
CORPORATE GOVERNANCE REPORT

134
WERNER BAUER
THOMAS EBELING
LONZA ANNUAL REPORT 2014
Werner Bauer Holds a diploma and PhD in Chemical Engineering from the University Erlangen-Nürnberg. Has received several scientific honors, among others the BioAlps Award 2011 and Honorary Senator from the Technical University of Munich.
Member of the Board of Directors of Lonza Group Ltd (since April 2013)
Current activities and functions: – Member of the Board of Directors of Givaudan SA (since 2014) – Member of the Supervisory Board of Bertelsmann SE & Co. KGaA
(since 2012) and Chairman of the Board of Trustees of the Bertelsmann Foundation (since 2011)
– Member of the Supervisory Board of GEA-Group AG (since 2011) – Chairman of the Supervisory Board of Nestlé Deutschland AG (since 2007)
Former activities and functions: – Executive Vice-President of Nestlé S.A., Head of Innovation, Technology, Research and
Development (2007 – 2013) – Executive Vice-President of Nestlé S.A., Head of Technical, Production, Environment,
Research & Development (2002 – 2007) – Various managerial positions of increasing responsibility at Nestlé (1990 – 2002) – Chairman of the Board of Directors of Galderma Pharma SA (2011 – 2014) – Member of the Board of Directors of L’OREAL, France (2005 – 2012) – Member of the Board of Directors of Alcon Inc., Switzerland (2002 – 2010) – Director of the Fraunhofer Institute for Food Technology & Packaging (1985 – 1990) – Professor of Chemical Engineering at the Technical University of Hamburg (1980 – 1985)
Thomas Ebeling Holds a Master’s degree in Psychology from the University of Hamburg. Member of the Board of Directors of Lonza Group Ltd (since April 2013)
Current activities and functions: – Member of the Supervisory Board of Bayer AG (since 2012) – Advisor to TPG Biotech Fund (since 2011) – CEO of ProSiebenSat1. Media AG (since 2009)
Former activities and functions: – CEO of the Novartis Consumer Health Division (2007 – 2008) – CEO of the global Novartis pharmaceuticals business (2000 – 2007) – Head of Novartis Nutrition Division (1998 – 2000) – General Manager of Novartis Nutrition for Germany and Austria (1997 – 1998)
CORPORATE GOVERNANCE REPORT

135
BARBARA RICHMOND
JEAN-DANIEL GERBER
LONZA ANNUAL REPORT 2014
Jean-Daniel Gerber Holds a lic. rer. pol. in economics from the University of Bern. Was awarded an honorary doctorate by the Faculty of Economics and Social Sciences of the University of Bern.
Member of the Board of Directors of Lonza Group Ltd (since April 2011)
Current activities and functions: – Vice President of the Association “Platform Switzerland Europe”
(since January 2015) – Member of the AO Alliance Foundation, Davos (since 2015) – Member of the Board of Directors of Credit Suisse Group Ltd (since 2012)1
– Chairman of the Board of the Swiss Investment Fund for Emerging Markets (SIFEM) (since 2011)
– Chairman of the Swiss Society for Public Good (since 2011)
Former activities and functions: – Director of the State Secretariat for Economic Affairs (SECO) with the title of State
Secretary (2004 – 2011) – Director of the Federal Office for Migration (then Federal Office for Refugees)
in the Federal Department of Justice and Police (1997 – 2004) – Executive Director at the World Bank (1993 – 1997) and Dean of the Executive
Directors of the World Bank Group (1996 – 1997) – Chief of Section for Developing Countries in the former Federal Office
for Foreign Economic Affairs (1991 – 1992)
Barbara Richmond Holds a First Class degree in Management Science from the University of Manchester Institute of Science and Technology in England. Is a Fellow of the Institute of Chartered Accountants in England and Wales.
Member of the Board of Director of Lonza Group Ltd (since April 2014)
Current activities and functions: – Group CFO of Redrow plc (since 2010)
Former activities and functions: – Group CFO of Inchcape plc, (2006 – 2009) – Non-Executive Director and Audit Committee Chair of Scarborough Building Society
until its merger with The Skipton Building Society (2005 – 2009) – Non-Executive Director, Senior Independent Director and Audit Committee Chair of
Carclo Group PLC (2000 – 2006) – Group CFO of Croda International plc (1997 – 2006) with dual role as Group CFO and
President of Active Ingredients and Industrial Chemicals from 2002 to 2006 – Group CFO of Whessoe plc in1993 (1992 – 1997) – Various financial roles in Alstom Group SA (1987 – 1992) – Auditor and management consultant for Arthur Andersen (1981 – 1984)
Jean-Daniel Gerber will not stand for re-election at the Annual General Meeting 2015 of Credit Suisse Group Ltd
1
CORPORATE GOVERNANCE REPORT

136
MARGOT SCHELTEMA
JÜRGEN STEINEMANN
LONZA ANNUAL REPORT 2014
Margot Scheltema Holds a doctorate in international law from the University of Amsterdam and a master of international affairs (MIA) from Columbia University in New York.
Member of the Board of Director of Lonza Group Ltd (since April 2012)
Current activities and functions: – Member of the Central Plan Committee Dutch Planning Bureau
(since April 2014) – Chair of the Monitoring Committee of the Dutch Pension Fund Code
(since September 2014) – Counsel to the Enterprise Chamber of the Amsterdam Court of Appeal
(since 2013) – Member of the Supervisory Board of Warmtebedrijf Rotterdam (since 2011) – Member of the Supervisory Board of TNT Express (since 2011) – Member of the Supervisory Board of Schiphol NV (since 2010) – Member of the Supervisory Board of ASR NV (since 2008) – Member of the Supervisory Board of the Rijksmuseum (since 2007) – Vice-Chair of the Supervisory Board of Triodos Bank (since 2006)
Former activities and functions: – External Member of the Audit Committee of the Dutch pension fund ABP
(2010 to July 2014) – Member of the Supervisory Board of ECN (2009 – 2013) – Member of the AFM External Reporting Committee (2006 – 2012) – Financial Director of Shell Nederland BV (2004 – 2008) – Various managerial positions within the Shell Group (1985 – 2004)
Jürgen Steinemann Holds a degree in Economics and Business Management from the European Business School in Wiesbaden, London and Paris.
Member of the Board of Director of Lonza Group Ltd (since April 2014)
Current activities and functions: – Chief Executive Officer of Barry Callebaut Ltd (since 20091) – Member of the Supervisory Board of Ewald Dörken AG (since 2002) – Member of the Board of the Swiss-American Chamber of Commerce
(since 2011)
Former activities and functions: – Member of the Executive Board and Chief Operating Officer of Nutreco (2001 – 2009) – Chief Executive Officer of Loders Croklaan (1999 – 2001) – Various senior positions in business-to-business marketing and sales with the former
Eridania Béghin-Say Group, ultimately in the “Corporate Plan et Stratégie” unit at the head office in Paris (1990 – 1998)
Mr. Steinemann will step down from his role as CEO of Barry Callebaut Ltd in August 2015.
1
CORPORATE GOVERNANCE REPORT

137
ANTONIO TRIUS
LONZA ANNUAL REPORT 2014
3.3 LIMITATION OF NUMBER OF MANDATES
According to Article 26 of Lonza’s Articles of Association1, no member of the Board of Directors may hold more than: – eight additional mandates in listed and non-listed companies, out of which
not more than four mandates may be in listed companies – five mandates held at the request of Lonza or companies controlled by it – ten mandates in associations, charitable foundations, trusts and employee
welfare foundations.
The Chairperson of the Board of Directors may not hold more than eight additional mandates in listed and non-listed companies, out of which no more than three may be in listed companies.
Mandates shall mean mandates in the supreme governing body of a legal entity that is required to be registered in the commercial register or a comparable for-eign register. Mandates in different legal entities that are under joint control or in the same beneficial ownership are deemed to be a single mandate. Mandates in companies that are controlled by Lonza or that control Lonza are not subject to the limitation set forth above.
www.lonza.com/aoa 1
Antonio Trius Holds a Bachelor in Organic Chemistry from the University of Barcelona, a PhD in Chemistry from the Autonomous University of Barcelona and a PDD in Business Administration from the IESE Barcelona.
Member of the Board of Directors of Lonza Group Ltd (since April 2013)
Current activities and functions: – Member of the Board of Directors of MaxamCorp Holding S.L.
(since July 2014) – Member of the Board of Directors of Azelis SA (since February 2014) – Member of the Supervisory Board of Altana AG (since 2012) – Member of the Board of Directors of Nubiola SL (since 2011)
Former activities and functions: – CEO of Cognis GmbH (2001–2010) – Executive Vice-President Care Chemicals North America (1999–2001) – Vice-President Care Chemicals at Henkel KGaA (1997–1999)
CORPORATE GOVERNANCE REPORT

138 LONZA ANNUAL REPORT 2014
3.4 ELECTIONS AND TERMS OF OFFICE
Each member of the Board of Directors is individually elected by the Annual General Meeting for a term of office of one year until the next Annual General Meeting. Board members may not serve more than nine complete terms of office on the Board of Directors. If deemed in the best interest of the Company, the Board of Directors can extend this limit.
The Chairperson of the Board of Directors is elected by the Shareholders’ Meeting. The Vice-Chairperson is appointed by the members of the Board of Directors. The members of the Nomination and Compensation Committee are elected by the Shareholders’ Meeting on an annual basis. The members of the other Board Com-mittees are appointed by the Board of Directors. The Chairpersons of the Board Committees are nominated by the members of the respective Board Committees, except the Chairperson of the Nomination and Compensation Committee that is elected by the Board in corpore.
3.5 INTERNAL ORGANIZATIONAL STRUCTURE
The Board of Directors consists of the Chairperson, the Vice-Chairperson and the other Board members. In accordance with the Articles of Association1, the number of members must be at least five.
The members of the Board of Directors sat on the following committees in 2014:
Audit and Compliance Committee
Nomination and Compensation Committee
Innovation and Technology Committee
Rolf Soiron Member
Patrick Aebischer Chairman
Werner Bauer Member
Thomas Ebeling Member
Jean-Daniel Gerber Chairman
Barbara Richmond Member
Margot Scheltema Chairwoman
Juergen Steinemann Member
Antonio Trius Member
Audit and Compliance Committee The Audit and Compliance Committee meets and consults regularly with the Executive Committee, the Lonza Audit Services and the external auditors to review the scope and results of their work and their performance, according to the Audit and Compliance Committee Charter1. Among other responsibilities, the Audit and Compliance Committee reviews (i) the ex-ternal auditors’ independence, (ii) the systems of internal control and financial reporting, (iii) the risk management system, (iv) compliance with laws, regulations and policies and (v) Lonza’s financial statements and results (including releases).
www.lonza.com/aoa 1
www.lonza.com/orgreg1
CORPORATE GOVERNANCE REPORT

139 LONZA ANNUAL REPORT 2014
The Audit and Compliance Committee is fully empowered to decide the tasks assigned to it, and it regularly informs the full Board of Directors on all matters discussed and decided in its meetings. Internal and external auditors have full and free access to the Audit and Compliance Committee, which also oversees the Lonza Audit Services.
Nomination and Compensation Committee The Nomination and Compensation Committee is entrusted with responsibilities that include the review and recom-mendation of compensation policies and plans (e.g. incentive compensation and equity plans) and the compensation1 of the members of the Executive Committee. This Committee also makes an assessment to ensure that the area of nomination and compensation is in compliance with the standards set forth in the associated charter. Further, the Nomination and Compensation Committee is evaluating potential members of the Board of Directors. With regard to the tasks assigned to it, the Nomination and Compensation Committee regularly informs the full Board of Directors on all matters discussed in its meetings and submits propos-als for Board decision in accordance with the Nomination and Compensation Committee Charter2.
Innovation and Technology Committee The Innovation and Technology Com-mittee monitors potential technology breakthroughs, supports management in driving innovation projects and provides and facilitates contacts, e.g. with academia and research institutions. With regard to the tasks assigned to it, the Innovation and Technology Committee regularly informs the full Board of Directors on all matters discussed and decided in its meetings, in accordance with the Innovation and Technology Committee Charter2.
Number of Meetings, Duration and Attendance
Board of Directors Audit and Compliance Committee (ACC)
Nomination and Compensation Committee (NCC)
Innovation and Technology Committee (ITC)
Number of meetings
9 (5 ordinary meetings and 4 extraordinary conference calls) 5 5 5
Average durationOrdinary meetings: 7 hours Conference calls: 1 hour 3 hours 3 hours 2 hours
Overall attendanceOrdinary meetings: 100 % Conference calls: 81 % 100 % 93 % 100%
The Regulations Governing Internal Organization and Board Committees2 set out in detail the powers and responsibilities of the Board of Directors, its Committees and the Executive Committee. The standing Board Committees provide support to the Board of Directors in their respective areas of responsibilities.
The Board of Directors meet with all members of the Executive Committee at each ordinary Board meeting for business updates and decisions to be taken. The CEO is a permanent guest of the Innovation and Technology Committee and is regularly invited at the meetings of the Nomination and Compensation Com-mittee. The CFO attends all meetings of the Audit and Compliance Committee.
For more details on the duties and responsibilities of the Nomination and Compensation Committee regarding compensation, please refer to page 99 of the Remuneration Report.
1
www.lonza.com/orgreg2
CORPORATE GOVERNANCE REPORT
140 LONZA ANNUAL REPORT 2014
3.6 AREAS OF RESPONSIBILITY
In accordance with the law and the Lonza Articles of Association1, the Board of Directors is the supreme management body of the Group. The Board of Direc-tors is responsible for the tasks assigned to it according to (i) Article 18 of the Company’s Articles of Association1 and (ii) the Regulations Governing Internal Organization and Board Committees2. The Board of Directors defines the strategic direction and is responsible for the ultimate management of Lonza as well as the supervision of the persons entrusted with Group management. It is responsible for issuing the necessary instructions especially with regard to compliance with the law, the Articles of Association, the regulations and directives. In compliance with law and the Articles of Association, the Board of Directors has – with the exception of non-delegable and inalienable duties – delegated the management of the company to the Executive Committee.
The Board of Directors continues to commit itself to maintaining the highest standards of integrity and transparency in its governance of Lonza. On an an-nual basis, the Board undertakes a self-assessment process. The aim is to achieve continuous improvement in the functioning of the Board.
3.7 INFORMATION AND CONTROL INSTRUMENTS
The Board of Directors ensures that it receives sufficient information from the Executive Committee to perform its supervisory duty and to make the decisions that are reserved for the Board of Director through several means.
Board Information The Regulations Governing Internal Organization and Board Committees2 confer on the CEO the duty to inform the Executive Committee and – together with the Chairman – the Board of Directors on the business ac-tivities and all important business transactions, including risk issues. In addition, during Board meetings, each member of the Board may request information from the other members of the Board, as well as from the members of the Executive Committee present on all affairs of the Company and the Group. Outside of Board meetings, each member of the Board may request from the members of the Executive Committee information concerning the course of business of the Company and the Group.
www.lonza.com/aoa www.lonza.com/orgreg (Article 28)
1
2
CORPORATE GOVERNANCE REPORT

141 LONZA ANNUAL REPORT 2014
Regular Reports to the Board In addition to the documents required to pass resolutions, the Board of Directors receives the following reports: – Monthly reports on the sales and earnings performance of the Group
structured by segments. – Reports on the cash flows, debt and debt-equity ratio, plus other relevant
key figures for the Group on a quarterly basis. – Qualitative assessments of the segments on a quarterly basis. – Reports of the external audits for the full and half-year results (through the
Audit and Compliance Committee). – In cases involving extraordinary events of considerable commercial relevance,
the Board of Directors receives direct, immediate information. – Risk assessment reports submitted at least once per year; they are designed to
provide the Board with a consistent, Group-wide perspective of key risks.
Internal Audit The Board of Directors, through the Audit and Compliance Com-mittee, is supported by Lonza Audit Services. The Lonza Audit Services group comprises eight internal audit positions and reviews financial, operational and process activities of the Group with a risk-based audit program. They continually evaluate the adequacy and effectiveness of the system of internal controls and compliance with policies and procedures, and recommend appropriate action to correct deficiencies as they are identified. In 2014, they delivered 58 internal audit reports to the Audit and Compliance Committee.
Internal Control System Lonza has a system of internal financial and account-ing policies, procedures and controls to provide a reasonable assurance – given the inherent limitations of all internal control systems to be implemented at an appropriate cost – that transactions are executed in accordance with company authorization, that they are properly recorded and reported in the financial state-ments, and that assets are properly safeguarded.
Compliance Instruments In addition to the above-mentioned control instruments, Lonza has implemented various other measures to improve compliance within the Group. The implementation of these measures is supervised by the Audit and Com-pliance Committee. One of these measures is the issuance of a Code of Conduct1 that expresses Lonza’s core principles and values in regard to professional business behavior. It also provides assistance in recognizing, understanding and complying with the laws and ethical standards that govern Lonza’s business activities. The Code of Conduct is available to all employees and information about it has been widely circulated within the Group. Lonza employees have to pass iComply tests in online training courses, dealing with topics such as those addressed by the Code of Conduct, in particular antibribery, insider trading and conflicts of interest. In addition to these measures, Lonza offers a “whistleblower” hotline, which is oper-ated by an external company. Cases disclosed through the “whistleblower” hotline are ultimately reported to the Audit and Compliance Committee.
www.lonza.com/code-of-conduct1
CORPORATE GOVERNANCE REPORT
142 LONZA ANNUAL REPORT 2014
Risk Assessment The Board of Directors carries out risk assessments at least on an annual basis. The objective of the risk assessments is to make the principal risks to which Lonza is exposed more transparent and to improve the risk mitigations. In its 2014 assessment of Group risk, the Board of Directors of Lonza has identified as main risks: the increasing challenges in the GMP quality systems requirements, the retention challenge of skilled employees at certain sites and the dependency on certain customers in specific businesses of the Specialty Ingredient segment.
For more details on risk management policy, financial risks (credit, liquidity and market risks) and enterprise risk management, please refer to financial note 27 on pages 66ff. and note 29 on page 78 of the Consolidated Financial Statements.
4 EXECUTIVE COMMITTEE
The members of the Executive Committee are appointed by the Board of Direc-tors. The Executive Committee performs the duties assigned to it by the Board of Directors under the terms of the Regulations Governing Internal Organization and Board Committees1. It is responsible for leading Lonza and for developing and implementing the Lonza policy and strategy set out by the Board of Directors. The Executive Committee supports and coordinates the activities of the market segments, the operational units, the corporate functions and the business service organizations. The Executive Committee is also responsible for leadership development.
New Composition of Executive Committee On 28 April 2014, Lonza announced the appointment of Marc Funk as Chief Operating Officer Pharma&Biotech Segment, who succeeds Stephan Kutzer. In addition, on 2 June 2014, Lonza an-nounced the appointment of Sven Abend as Chief Strategy Officer and member of the Executive Committee, with primary responsibility for Corporate Strategy and Business Development.
4.1 MEMBERS OF THE EXECUTIVE COMMITTEE
As of 31 December 2014, the Executive Committee consisted of five members.
Name Nationality Year of Birth Function
Richard Ridinger German 1958 Chief Executive Officer
Toralf Haag German 1966 Chief Financial Officer
Beat In-Albon Swiss 1952 Chief Operating Officer Specialty Ingredients Segment
Marc Funk Swiss 1960 Chief Operating Officer Pharma&Biotech Segment
Sven Abend German 1968 Chief Strategy Officer
www.lonza.com/orgreg (Articles 4.1 and 4.3)1
CORPORATE GOVERNANCE REPORT

143
TORALF HAAG
RICHARD RIDINGER
LONZA ANNUAL REPORT 2014
4.2 ACTIVITIES AND FUNCTIONS OF THE MEMBERS OF THE EXECUTIVE COMMITTEE
Richard Ridinger Holds a degree in chemical engineering from the University of Karlsruhe.
Chief Executive Officer and Member of the Executive Committee (since May 2012)
Former activities and functions: – Transfer and integration of Cognis GmbH into BASF (2011) – Member of the Management Board and Executive Vice-President “Care Chemicals”
of Cognis GmbH (2006 – 2010) – SBU Head of “Cognis Care Chemicals” and member of the Cognis Executive
Committee (2002 – 2006) – Vice-President of the global “Care Chemicals Specialties” business of Cognis GmbH
(2000 – 2002) – Director global Skin Care Ingredients Business at Henkel KGaA / Cognis GmbH
(1999 – 2000) – Various positions at Henkel KGaA in R&D, Engineering and Production
Management (1986 – 1999)
Toralf Haag Holds a degree in business administration from the University of Augsburg and a PhD from the University of Kiel.
Chief Financial Officer and Member of the Executive Committee (since August 2005)
Current activities and functions: – Member of the Board of Fr. Sauter AG, Basel (since February 2014) – Member of the Board of scienceindustries (since 2012) – Member of the Board of Vereinigung Schweizer Finanzchefs (VSF)
(since 2009) Former activities and functions: – Chief Financial Officer and Member of the Management Board at Norddeutsche
Affinerie AG, Hamburg (2002 – 2005) – CEO (President) Stamping & Frame Division of The Budd Company Detroit,
a subsidiary of ThyssenKrupp Automotive (2000 – 2001) – Director Finance, M&A and Corporate Development, The Budd Company Detroit
(1997 – 1999) – Assistant to the CEO of Thyssen Handelsunion AG, Düsseldorf (1994 – 1996)
CORPORATE GOVERNANCE REPORT

144
BEAT IN-ALBON
MARC FUNK
LONZA ANNUAL REPORT 2014
Beat In-Albon Holds a PhD in economics from the University of Fribourg.
COO Speciality Ingredients Market Segment (since April 2013) and Member of the Executive Committee (since June 2012)
Functions within Lonza: – COO Life Science Ingredients Division (2012 – March 2013) – Head of Organic Fine & Performance Chemicals at Lonza
(2003 – 2006) – Member of the Lonza Management Committee (1999 – 2006) – Head of Organic Fine Chemicals at Lonza (1998 – 2003) – Joined Lonza in 1983 and held various managerial positions
with Lonza Ltd, Basel
Former activities and functions: – Member of the SGS’s Operations Council (2007 – 2012) – Head of Industrial Services Division at SGS (2009 – 2012) – Head of Life Sciences Services Division at SGS (2007 – 2009) – Member of the Board of Directors of Siegfried Holding Ltd (2011 – 2012)
Marc Funk Holds a Master of Law from the University of Geneva and a Master of Law and Diplomacy from the Fletcher School (Tuft University, MA).
Chief Operating Officer Pharma&Biotech Segment (since May 2014), Chief Legal Officer1 and Member of the Executive Committee (since April 2012)
Functions within Lonza: – Group General Counsel (2009 – 2012) and Board Secretary (2009 – April 2014)
Former activities and functions: – Associate General Counsel of Merck Serono (formerly Serono) (2004 – 2008) – Co-CEO and General Counsel of GeneProt (2000 – 2004)
Marc Funk stepped down from his role as Chief Legal Officer as of March 2015.
1
CORPORATE GOVERNANCE REPORT

145
SVEN ABEND
LONZA ANNUAL REPORT 2014
Sven Abend Holds a PhD in Chemistry from the Christian-Albrechts- Universität in Kiel, and a post-doctorate from the Department of Physics & Astronomy at the University of New York in Stony Brook
Chief Strategy Officer and Member of the Executive Committee (since July 2014)
Former activities and functions: – CEO of Kolb Ltd in Hedingen, Switzerland (2012 – 2014) – Business Manager for Kolb’s divisions focusing on specialty surfactants and
custom manufacturing (2010 – 2012) – Several senior positions in Global Product Management and ultimately as Director of
Corporate Key Account Management at Cognis GmbH in Germany (2003 – 2010) – Project Scientist for the R&D Home & Personal Care business at Unilever in the UK
(2000 – 2003)
4.3 LIMITATION OF NUMBER OF MANDATES
Acccording to Article 26 of the Lonza Articles of Association1, no member of the Executive Committee may hold more than: – one additional mandate in a listed company; – two additional mandates in non-listed companies; – five mandates held at the request of Lonza or companies controlled by it;
and – ten mandates in associations, charitable foundations, trusts and employee
welfare foundations.
Mandates shall mean mandates in the supreme governing body of a legal entity that is required to be registered in the commercial register or a comparable foreign register. Mandates in different legal entities that are under joint control or in the same beneficial ownership are deemed to be a single mandate. Man-dates in companies that are controlled by Lonza or that control Lonza are not subject to the limitation set forth above.
4.4 MANAGEMENT CONTRACTS
Lonza Group Ltd has not entered into management contracts with companies or natural persons not belonging to the Group.
www.lonza.com/aoa 1
CORPORATE GOVERNANCE REPORT

146 LONZA ANNUAL REPORT 2014
5 COMPENSATION, SHAREHOLDINGS AND LOANS
Details of Board and Executive Committee compensation are contained in the Remuneration Report (pages 97ff.)
6 SHAREHOLDERS’ PARTICIPATION RIGHTS
6.1 VOTING-RIGHTS RESTRICTIONS AND REPRESENTATION
Only persons with valid entries in the share register are recognized as shareholders or usufructuaries. A shareholder may only be represented at the Annual General Meeting by a legal representative, another shareholder entitled to vote or the independent proxy. Persons who do not declare to have acquired their shares in their own name and for their own account are considered “nominees” and will be only entered with voting rights in the share register up to a maximum of 2 % of the share capital, unless the actually entitled persons are revealed. The details are set out in Article 6 of the Lonza Articles of Association1. This restriction may only be removed by a resolution of a Shareholders’ Meeting with a quorum in accordance with Swiss law.
Each share has the right to one vote. The shares held by Lonza are not entitled to vote at the Annual General Meeting and bear no dividend.
Lonza may use an electronic voting system for all the resolutions to be taken at its Annual General Meetings. The Articles of Association1 do not contain any other rules on electronic participation in the Shareholders’ Meeting, nor specific rules on the issue of instructions to the independent proxy.
6.2 STATUTORY QUORA
Except as otherwise stipulated by law, an absolute majority of the votes represented at the Annual General Meeting is required for resolutions and elections.
For certain important matters such as a change of the company purpose and domicile, the dissolution of the company without liquidation, and matters relat-ing to capital changes, Article 704 of the Swiss Code of Obligations requires at least two-thirds of the voting rights represented and an absolute majority of the nominal value of shares represented.
www.lonza.com/aoa 1
CORPORATE GOVERNANCE REPORT

147 LONZA ANNUAL REPORT 2014
6.3 CONVOCATION OF SHAREHOLDERS’ MEETINGS
Ordinary Shareholders’ Meetings are called in accordance with the law and the Lonza Articles of Association1. Extraordinary Shareholders’ Meetings must be called upon resolution of a Shareholders’ Meeting or if demanded by one or more shareholders representing at least 5 % of the share capital.
Lonza posts the invitation to shareholders at least 20 days before the Annual General Meeting and publishes it on its website, as well as in the Swiss Official Gazette of Commerce.
6.4 AGENDA
One or more shareholders representing together shares with a par value of CHF 100 000 may request an item to be included in the agenda of a Shareholders’ Meet-ing. The request to include an item must be submitted in writing at least 40 days before the meeting, stating the item to be included and the motions.
6.5 ENTRY IN THE SHARE REGISTER
Purchasers of Lonza shares may submit a request to be entered, without limitation, as shareholders with voting rights in the share register, provided they expressly declare that they have acquired these shares in their own name and on their own account. Special rules exist for persons who do not expressly declare in the entry application that they hold the shares on their own account (nominees) (see Sec-tion 2.6 page 130).
There are no special rules in the Lonza Articles of Association1 concerning a dead-line for entry in the share register. The share register will this year be closed on 30 March 2015 at 5 pm.
7 CHANGES OF CONTROL AND DEFENSE MEASURES
7.1 DUTY TO MAKE AN OFFER
An investor who acquires more than 33 ⅓ % of all voting rights (directly, indirectly or in concert with third parties) whether they are exercisable or not, is required to submit a takeover offer for all shares outstanding (Article 32 SESTA). No special opting-out or opting-up dispositions are contained in the Company’s Articles of Association1.
7.2 CLAUSES ON CHANGE OF CONTROL
The employment agreements of the Executive Committee members contain certain clauses on change of control, which are outlined in the Remuneration Report (pages 118 and 119). In addition, Lonza’s share-based compensation programs (E-STIP and LTIP) provide that unvested awards / blocked shares unconditionally vest upon change of control (see Remuneration Report, pages 111, 114 and 118 f).
www.lonza.com/aoa 1
CORPORATE GOVERNANCE REPORT
148 LONZA ANNUAL REPORT 2014
8 AUDITORS
8.1 DURATION OF THE MANDATE AND TERM OF OFFICE OF THE AUDITOR IN CHARGE
KPMG Ltd, Badenerstrasse 172, 8026 Zurich 4, Switzerland, has held the mandate as the external statutory auditors of Lonza Group Ltd and the Group since 1999.
The auditing company is elected for a term of one year. Michael Blume from KPMG Ltd has been the auditor in charge since April 2014. The Board of Direc-tors proposes that KPMG Ltd be re-elected as auditors for the 2015 business year.
8.2 AUDITING HONORARIUM
Lonza Group paid KPMG Ltd CHF 4.3 million in 2014 (2013: CHF 4.4 million) for professional services rendered in connection with the audit of the Group’s an-nual financial statements and other audit-related activities.
8.3 ADDITIONAL HONORARIUM
KPMG Ltd received a total fee of CHF 0.04 million in 2014 (none in 2013) for services non-related to the audit of Group’s annual financial statements. These services related to tax consulting.
8.4 SUPERVISORY AND CONTROL INSTRUMENTS VIS-À-VIS THE AUDITORS
The Audit and Compliance Committee is responsible for evaluating the perfor-mance and independence of the external auditors on behalf of the Board of Di-rectors. This evaluation occurs at least once a year. The criteria applied for the assessment include professional competence, sufficiency of resources, the ability to provide effective and practical recommendations and coordination of the external auditors with the Audit and Compliance Committee and senior management. In the reporting year, there were two joint meetings between the Audit and Com-pliance Committee and KPMG Ltd. In addition, the external auditors prepare a management letter addressed to the Audit and Compliance Committee once a year, informing them in detail about the result of their audit.
Within the yearly approved budget, there is an amount permissible for non-audit services that the external auditors may perform. Within the scope of the approved and budgeted amount, the Chief Financial Officer can delegate non-audit-related mandates to the external auditors.
The Board of Directors has determined the rotation interval for the auditor in charge to be seven years, as defined by the Swiss Code of Obligations.
CORPORATE GOVERNANCE REPORT

149 LONZA ANNUAL REPORT 2014
The Audit and Compliance Committee reviews Lonza’s financial reporting process on behalf of the Board of Directors. Lonza’s management is responsible for preparing the financial statements and the reporting process, including the system of internal controls. The Audit and Compliance Committee is also responsible for overseeing the conduct of the activities by Lonza management and the external auditors.
The external auditor, KPMG Ltd, is responsible for expressing an opinion on the accounting records and the financial statements prepared in accordance with Swiss law and the Lonza Articles of Association1. KPMG Ltd is also responsible for expressing an opinion on the consolidated financial statements (balance sheet, income statement, statement of comprehensive income, cash flow statement, state-ment of changes in equity and notes) prepared in accordance with the International Financial Reporting Standards (IFRS), which is issued by the International Ac-counting Standards Board (IASB), and with Swiss law.
For the first time, KPMG also audited Lonza Remuneration Report 2014 with respect to the information required by Articles 14 to 16 of the Ordinance Against Excessive Compensation in Stock-Exchange-Listed Companies.
9 INFORMATION POLICY AND KEY REPORTING DATES
Lonza pursues a proactive and professional communication policy. Lonza pub-lishes price-sensitive information in accordance with the obligation to disclose price-sensitive facts as required by the SIX Swiss Exchange. Ad hoc notices are made available on the Lonza website (pull system2). Lonza’s website also provides a service that allows interested parties to receive, via e-mail distribution, free and timely notification of price-sensitive facts (push system3).
Corporate Communications reports directly to the Chief Executive Officer, while Investor Relations reports to the Chief Financial Officer. On basic matters of general corporate policy, Corporate Communications receives its directives from the Executive Committee.
Lonza provides the Annual Report, the Half-Year Results and Full-Year Results (on request only) to shareholders entered in the share register. These reports are also available on the Lonza website4. The invitation to the Annual General Meeting is published on Lonza’s website and in the Swiss Official Gazette of Commerce. It is also sent by mail to the shareholders entered in the share register.
Lonza’s website is regularly updated and provides relevant information such as share price development, news releases and presentations. It also contains an electronic version of the Annual Report 2014.
Media conferences and analyst meetings generally take place at Lonza’s headquar-ters or by conference call. Lonza manages an annual program of investor meetings. Investors, potential investors and financial analysts are also welcomed at Lonza’s headquarters in Basel.
www.lonza.com/aoa www.lonza.com/news www.lonza.com/news-reports-subscription www.lonza.com/financial-reports
1
2
3
4
Anticipated Key Reporting Dates
The list of all corporate events of special interest is subject to change during the year as dates are adjusted and added. Updated information is found on www.lonza.com/investorinformation
Annual General Meeting for the
2014 Financial Year
8 April 2015, 10:00 amCongress Center Basel, Switzerland
Half-Year Report 2015
22 July 2015
Dividend Transfer to Banks
As a rule, Lonza Group Ltd pays the dividend to its shareholders on the fifth business day following the Annual General Meeting.
For Lonza’s contact details, please refer to the inside cover page at the end of this Annual Report.
CORPORATE GOVERNANCE REPORT

150 LONZA ANNUAL REPORT 2014
Forward-Looking Statements
Forward-looking statements contained herein, which can be iden-tified by terms like “believe”, “assume”, “expect” or similar ex-pressions or implied discussion of potential new projects or future revenues, plans or intentions, are qualified in their entirety as there are certain factors that could cause results to differ materially from those anticipated. Investors are cautioned that all forward-looking statements involve risks and uncertainties. In addition to those discussed above, factors that could cause actual results to differ materially include the timing and strength of new product offerings; pricing strategies of competitors; the company’s ability to continue to receive adequate products from its vendors on acceptable terms, or at all, and to continue to obtain sufficient financing to meet its liquidity needs; and changes in the political, social and regula-tory framework in which the company operates, or in economic or technological trends or conditions, including currency fluctuations, inflation and consumer confidence, on a global, regional or national basis. All forward-looking statements are based on data available to Lonza at the time of preparation of this Annual Report. Lonza does not undertake to update any forward-looking statements con-tained in this Annual Report as a result of new information, future events or otherwise.
This publication is accessible online at www.lonza.com. In this re-port, “Lonza” and “the Group” refer to the whole group of Lonza companies, “Lonza Group Ltd” refers to Lonza Holding. Lonza is listed on the SIX Swiss Exchange, with a secondary listing on the Singapore Exchange Securities Trading Limited (“SGX-ST”). Lonza is not subject to the SGX-ST’s continuing listing requirements. Lonza is subject to the listing rules of the SIX Swiss Exchange. By publishing this Annual Report, Lonza fulfills its obligations under the SIX Swiss Exchange, as well as its obligation towards SGX-ST.
Publication Details
Production Corporate Communications, Lonza Group Ltd, Basel, Switzerland | All rights reserved | Editorial completion: February 2015 | Design: LonzaPhotography Julian Salinas, Basel, Switzerland | Laurent Burst, Zug, Switzerland | Thomas Andenmatten, Brig, Switzerland | Lonza employees have contributed other picturesLithography Birkhäuser+GBC AG, Reinach, SwitzerlandPrint Kreis Druck AG, Basel, Switzerland

LONZA ANNUAL REPORT 2014
Anticipated Key Reporting Dates
Annual General Meeting for the Financial Year 20148 April 2015, 10:00 am
Congress Center Basel Switzerland
Half-Year Report 2015: 22 July 2015
Full-Year Report 2015: 27 January 2016
Annual General Meeting for the Financial Year 201522 April 2016
Congress Center Basel, Switzerland
Dividend Transfer to Banks
As a rule, Lonza Group Ltd pays the dividendto its shareholders on the fifth businessday following the Annual General Meeting.
Listing and Security Information
Stock Exchange Listing / Trading
SIX Swiss Exchange, SGX Singapore Exchange
Common Stock Symbols
Bloomberg LONN VXReuters LONN VXTelekurs LONNSGX O6Z
Security Number
Valor 001384101ISIN CH0013841017
Contacts
For publications and further information, please contact:
Global Headquarters
Lonza Group LtdMuenchensteinerstrasse 384002 Basel, SwitzerlandTel +41 61 316 81 11Fax +41 61 316 91 11www.lonza.com
Investor Relations
Tel +41 61 316 85 40Fax +41 61 316 95 [email protected]
Media / Corporate Communications
Tel +41 61 316 87 98Fax +41 61 316 97 [email protected]
Share Register
c/o SIX SAG AGP.O. Box4601 Olten, SwitzerlandTel +41 62 311 61 33Fax +41 62 311 61 [email protected]