Long/Short Equity - Advisorlynx · Top-Down Macro-Economic Investment Analysis ... to a market...
15
Long/Short Equity Ascentia Macro Long/Short Investment Strategy | April 2011
-
Upload
truongngoc -
Category
Documents
-
view
216 -
download
2
Transcript of Long/Short Equity - Advisorlynx · Top-Down Macro-Economic Investment Analysis ... to a market...
Long/Short Equity
Ascentia Macro Long/Short Investment Strategy | April 2011
Introduction
The decades of the 80s and 90s produced historically attractive investment returns while
utilizing ‘traditional’ asset allocation models that focused on ‘style box’ diversification and
‘buy and hold’ strategies.
The financial crisis of 2008 that capped off a decade of ‘lost returns’ has caused the financial
industry to implement new asset allocation models that are designed to increase portfolio
diversification and reduce volatility.
To achieve these goals, asset managers and investors have turned to ‘alternative strategies’
designed to produce ‘non-correlated’ returns, with liquidity and full transparency.
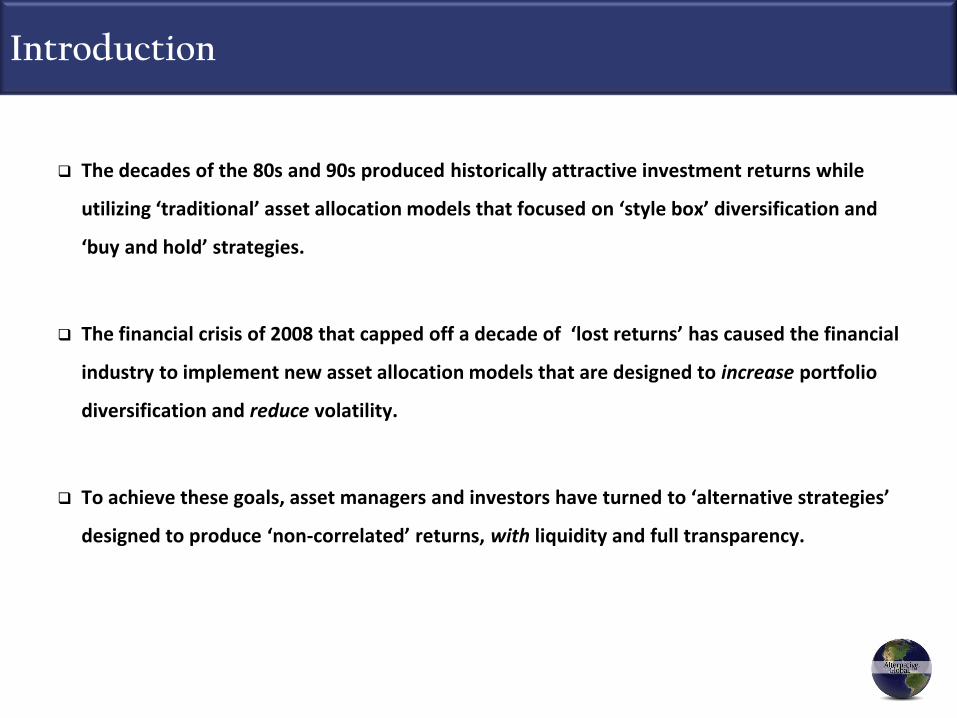
Evolution of Asset Allocation
Risk
Return
Past performance is not indicative of future results
For informational purposes only.
Investment Philosophy
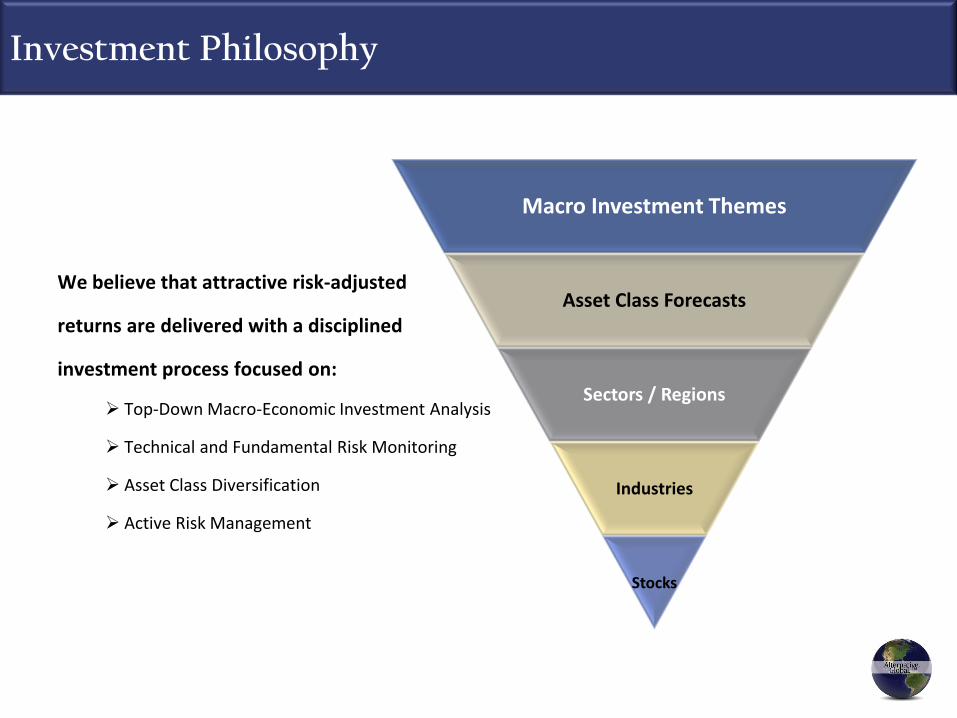
We believe that attractive risk-adjusted
returns are delivered with a disciplined
investment process focused on:
Top-Down Macro-Economic Investment Analysis
Technical and Fundamental Risk Monitoring
Asset Class Diversification
Active Risk Management
Macro Investment Themes
Asset Class Forecasts
Sectors / Regions
Industries
Stocks
The Ascentia Macro Long Short Strategy is designed for investors seeking:
Long Term Capital Appreciation
Capital Preservation in Bear Market Environments
Reduced or Lower Volatility
Low Correlation to Broad Market Indices
A ‘Complement’ to Long Only Investment Strategies
Investment Objectives

Investment Process
1. Evaluate Macro Economic Investment Environment
Secular Market (Bull/Bear) & Cyclical Market (Bull/Bear) Durations
Asset Class Analysis
Region, Country, and Sector Outlooks
2. Determine Optimal Portfolio Exposure
Fundamental Analysis
Technical Analysis
Bull/Bear Gauge guides ‘net’ exposure
3. Construct Portfolio
Productive Trends and Relative Strength
Sector and Region Limits
Single Position Limits
4. Actively Manage Risk
Maintain Asset Class Diversification
Ongoing Attribution Analysis
Hedge Exposure when Indicators Deteriorate
1. Evaluate Macro-Economic Investment Environment
Global Market Assessment:
Maturity of Secular Bull and Bear Markets
• Are these markets young or mature
Maturity of Cyclical Bull and Bear Markets
• Are these markets young or mature
Top Down Research
Investment Themes & Catalysts
Asset Class Forecasts
Regional Strength
Sector Outlook

2. Determine Optimal Portfolio Exposure
Real Interest Rates – Bearish (10%)
Credit Spreads – Bullish (5%)
Economic Models – Bearish (10%)
Stock Ratings- Bullish (5%)
Environmental Risk – Bullish (10%)
Crowd Sentiment – Bearish (10%)
Medium -Term Trend – Bullish (10%)
Long-Term Trend – Bullish (10%)
Volatility Model – Bullish (10%)
Market Timing – Bearish (10%)
Market Breadth – Bullish (5%)
Market Internals – Bullish (5%)
Fundamental Models
Technical Models
0% Long Exposure(Full Hedges)
Partial Exposure(Partial Hedges)
100% Long Exposure(No Hedges)
Bearish 60%
Bearish 10% Bullish 40%
Bullish 90%
Bullish 100% Bearish 100% Bullish 65%
Bearish 35%
Sample Illustrations. Subject to change without notice.
For informational purposes only.
Bull / Bear Gauge
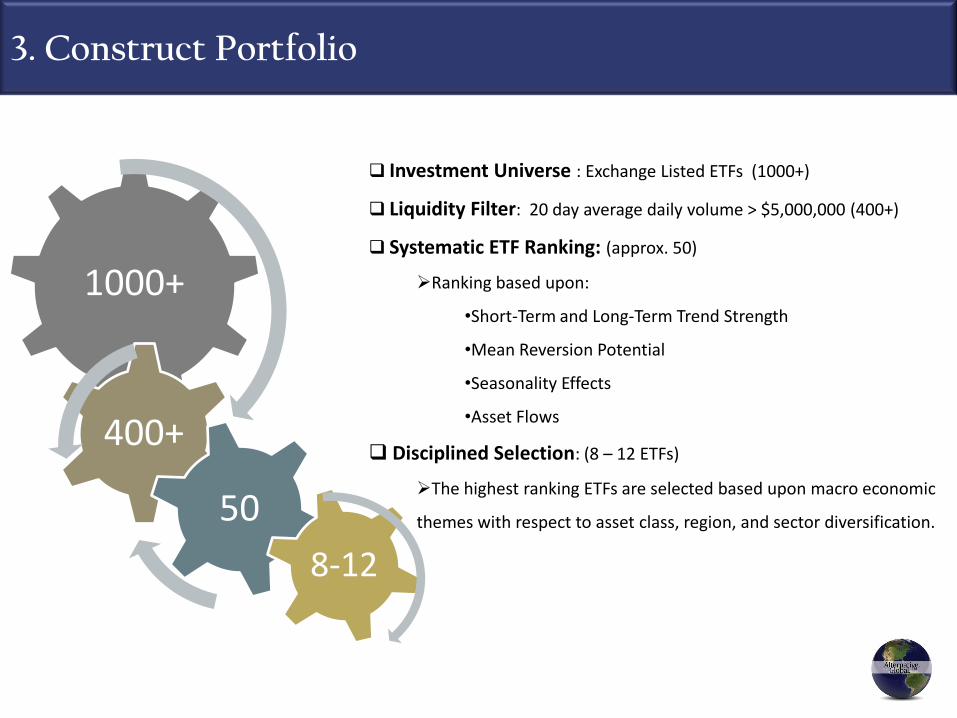
3. Construct Portfolio
1000+
400+
50
8-12
Investment Universe : Exchange Listed ETFs (1000+)
Liquidity Filter: 20 day average daily volume > $5,000,000 (400+)
Systematic ETF Ranking: (approx. 50)
Ranking based upon:
•Short-Term and Long-Term Trend Strength
•Mean Reversion Potential
•Seasonality Effects
•Asset Flows
Disciplined Selection: (8 – 12 ETFs)
The highest ranking ETFs are selected based upon macro economic
themes with respect to asset class, region, and sector diversification.
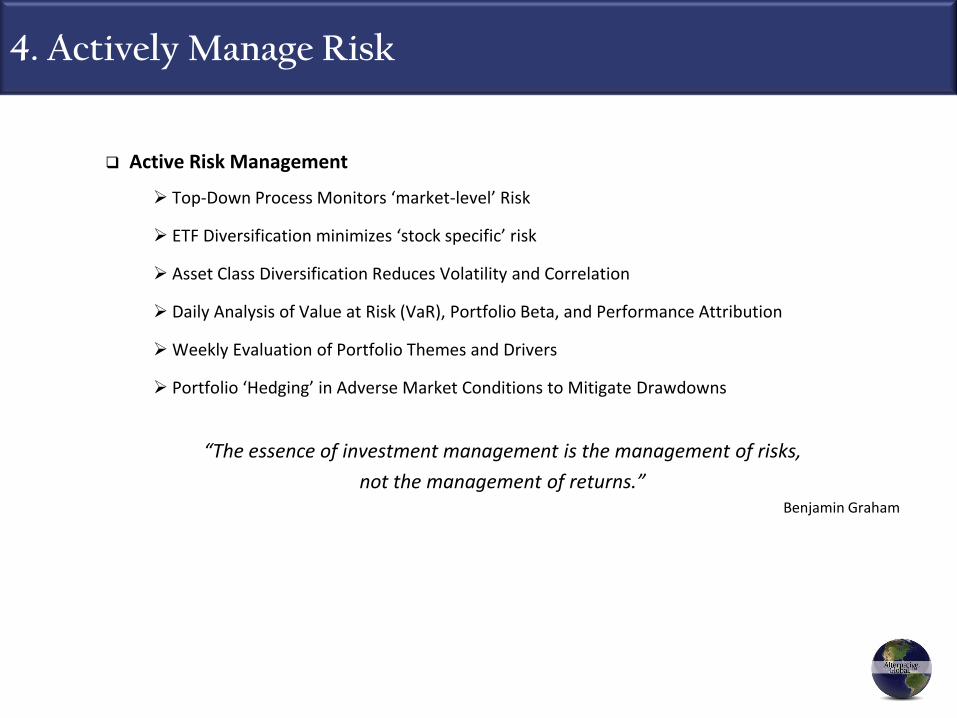
4. Actively Manage Risk
Active Risk Management
Top-Down Process Monitors ‘market-level’ Risk
ETF Diversification minimizes ‘stock specific’ risk
Asset Class Diversification Reduces Volatility and Correlation
Daily Analysis of Value at Risk (VaR), Portfolio Beta, and Performance Attribution
Weekly Evaluation of Portfolio Themes and Drivers
Portfolio ‘Hedging’ in Adverse Market Conditions to Mitigate Drawdowns
“The essence of investment management is the management of risks,
not the management of returns.”Benjamin Graham
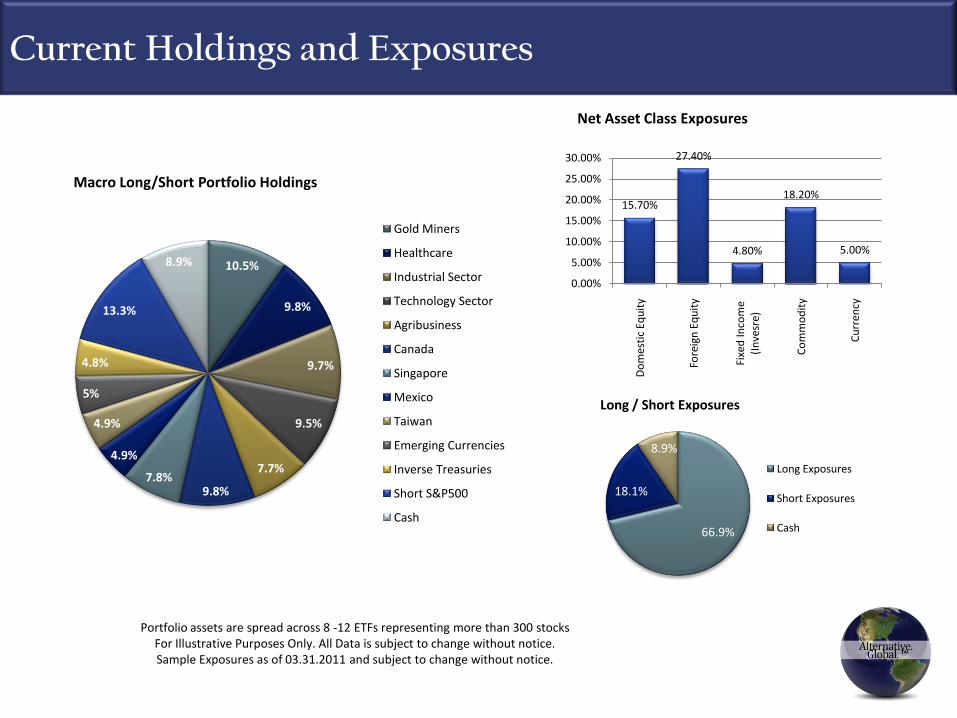
Current Holdings and Exposures
Portfolio assets are spread across 8 -12 ETFs representing more than 300 stocks For Illustrative Purposes Only. All Data is subject to change without notice.Sample Exposures as of 03.31.2011 and subject to change without notice.
10.5%
9.8%
9.7%
9.5%
7.7%
9.8%7.8%
4.9%
4.9%
5%
4.8%
13.3%
8.9%
Gold Miners
Healthcare
Industrial Sector
Technology Sector
Agribusiness
Canada
Singapore
Mexico
Taiwan
Emerging Currencies
Inverse Treasuries
Short S&P500
Cash
Macro Long/Short Portfolio Holdings
66.9%
18.1%
8.9%
Long Exposures
Short Exposures
Cash
Long / Short Exposures
15.70%
27.40%
4.80%
18.20%
5.00%
0.00%
5.00%
10.00%
15.00%
20.00%
25.00%
30.00%
Do
mes
tic
Equ
ity
Fore
ign
Eq
uit
y
Fixe
d In
com
e
(In
vesr
e)
Co
mm
od
ity
Cu
rren
cy
Net Asset Class Exposures
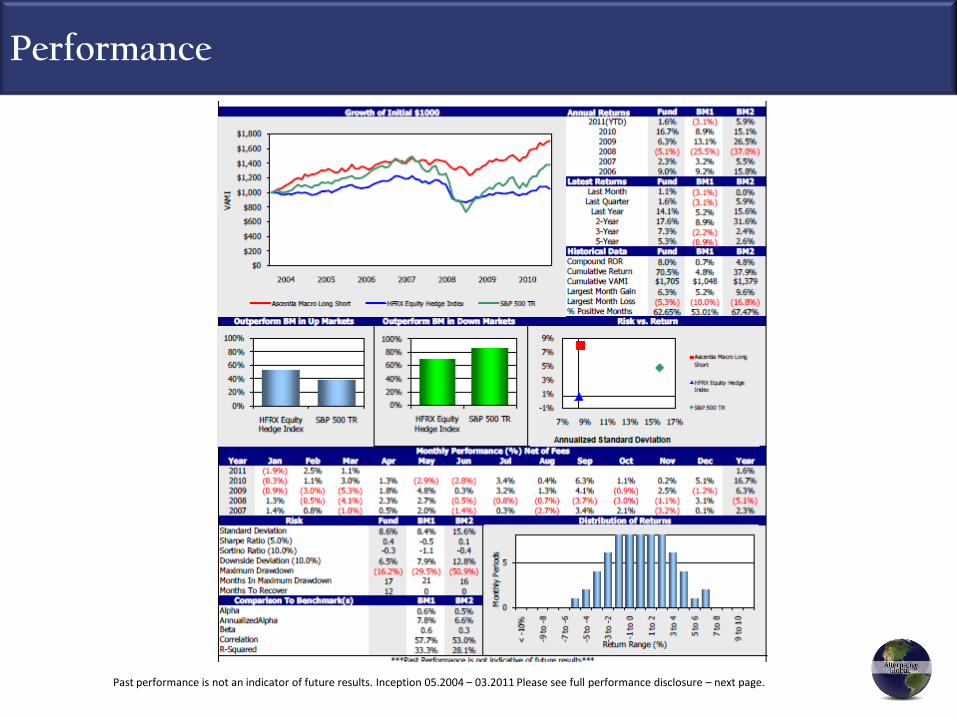
Performance
Past performance is not an indicator of future results. Inception 05.2004 – 03.2011 Please see full performance disclosure – next page.

Performance Disclosure
Performance figures include the actual performance of the Ascentia Macro Long Short model portfolio tracked by Foliofn, an independent onlinebrokerage custodian and financial software provider. The model portfolio does not represent any specific client portfolio. The model portfoliorepresents an investment model of separate portfolios managed by Ascentia Capital Partners, LLC that track the model portfolio. Performance figuresthat are gross of fees do not reflect the deduction of any advisory fees and/or brokerage fees. Performance fees that are net of fees take into accountthe maximum advisory fee charged by Ascentia Capital and the standard brokerage costs charged by Foliofn. Actual investment management fees mayvary by individual account and the performance of a specific individual client account may vary substantially from the model results. Performance resultsinclude the reinvestment of dividends. Any other trading commissions, regulatory fees, or other fees paid by clients are not considered when calculatingpast performance. Foliofn uses a time-weighted performance measure known as the Modified Dietz method. All calculations are based on informationobtained from sources we believe to be accurate, but we cannot guarantee the accuracy of such information. Performance results include only thoseaccounts held at Foliofn that track the Ascentia Macro Trend model portfolio. Accounts held at another brokerage firm may experience differentperformance results. Performance figures prior to June 2005 were achieved using the same investment objectives, utilizing similar policies andstrategies, and managed solely by a former Ascentia principal while at Legacy Advisors, LLC. The selected benchmarks are the S&P 500 Total ReturnIndex and the HFRX Equity Hedge Strategies as they represent a reasonable proxy of domestic equity and hedged equities respectively. Any comparisonto a market index is for comparative purposes only and does not imply any similarity between the model portfolio and the index. The S&P 500 TotalReturn index reflects reinvestment of dividends but does not reflect fees, brokerage commissions, or other expenses of investing. The model portfoliosand strategies are not a substitute for personalized investment advice and investors should consult with an experienced financial advisor beforeinvesting.
The HFRX Equity Hedge Index maintains positions both long and short in primarily equity and equity derivative securities. A wide variety of investmentprocesses can be employed to arrive at an investment decision, including both quantitative and fundamental techniques; strategies can be broadlydiversified or narrowly focused on specific sectors and can range broadly in terms of levels of net exposure, leverage employed, holding period,concentrations of market capitalizations and valuation ranges of typical portfolios. Equity Hedge managers would typically maintain at least 50%, andmay in some cases be substantially entirely invested in equities, both long and short. Hedge Fund Research, Inc. (HFR) utilizes a UCITSIII compliantmethodology to construct the HFRX Hedge Fund Indices. The methodology is based on defined and predetermined rules and objective criteria to selectand rebalance components to maximize representation of the Hedge Fund Universe. HFRX Indices utilize state-of-the-art quantitative techniques andanalysis; multi-level screening, cluster analysis, Monte-Carlo simulations and optimization techniques ensure that each Index is a pure representation ofits corresponding investment focus. Full strategy and regional descriptions (multi-language), as well as the full “HFRX Hedge Fund Indices DefinedFormulaic Methodology” may be downloaded at www.HedgeFundResearch.com. It is not possible to invest directly in an index. Past performance is noindication of future performance.

This material has been prepared for informational purposes only and does not constitute an offer, or a solicitation of an offer, to
buy or sell any security or instrument, or to participate in any investment strategy. This material does not purport to summarize or
contain all of the provisions that would be set forth in any offering memorandum. Any purchase or sale of any securities may be
made only pursuant to a final offering memorandum and/or prospectus. The information contained in this material should not be
construed as a recommendation or solicitation to buy or sell any security, or to participate in any investment strategy. It does not
have regard to specific investment objectives, financial situations, or the particular needs of any specific entity or person. Investors
should make their own appraisal of the risks and should seek their own financial advice regarding the appropriateness of investing
in any securities or participating in any investment strategy. While the information (including any historical returns) in this material
has been obtained from sources deemed reliable, neither Ascentia Capital Partners, LLC nor its affiliates guarantee its accuracy,
timeliness, or completeness. Any opinions expressed herein are statements of our judgment on this date and are subject to
change without notice. All performances showed in this material are based on historical data and may reflect certain assumptions
with respect to fees, expenses, taxes, capital charges, allocations and other factors that affect the computation of returns. These
figures may also be unaudited and subject to material change. Past performance is not indicative of future results.
Disclosure