Shorelines. Wave Definitions Wave Physics Longshore Transport.
Journal of Coastal Research 19 0 000–000 West Palm Beach, Florida Season 0000
Longshore Sediment Transport Rates on aReef-Fronted Beach: Field Data and Empirical ModelsKaanapali Beach, HawaiiDolan Eversole and Charles H. Fletcher
Department of Geology and GeophysicsSchool of Ocean and Earth Science and TechnologyUniversity of Hawaii1680 East West Rd. POST 721Honolulu, HI 96822, [email protected]@soest.hawaii.edu
ABSTRACT
EVERSOLE, D. and FLETCHER, C.H., 2003. Longshore sediment transport rates on a reef-fronted beach: field dataand empirical models Kaanapali Beach, Hawaii. Journal of Coastal Research, 19(0), 000–000. West Palm Beach (Flor-ida), ISSN 0749-0208.
Longshore sediment transport (LST) measured at monthly beach profiles on Kaanapali Beach, Maui is compared tothree predictive models. We observe cumulative net sediment transport rates of approximately 29,379 64400 m3/yrto the north and 22,358 61300 m3/yr to the south for summer and winter respectively. Kaanapali Beach experiencesa net annual rate of 7,021 6700 m3/yr to the north and a gross annual rate of 51,736 65100 m3/yr. Transport models,namely CERC (1984), CERC, 1991 (GENESIS) and KAMPHIUS (1991) predict net annual LST rates at 3 3 103 percent,77 percent and 6 3 103 percent of the observed rates respectively. The success of the Genesis model is attributed toits ability to account for short-term changes in near-shore parameters. The use of CERC (1984) is prone to practicalerrors in its application including use of the recommended K coefficient and wave averaging that may significantlyoverestimate LST. The use of KAMPHIUS (1991) is more sensitive to beach slope and wave period than CERC (1984)and may over-predict transport on steep sloped beaches with high wave energy. Presence of fringing reef significantlyaffects the ability of LST models to accurately predict sediment transport. When applying CERC (1984, 1991) andKAMPHIUS (1991) formulas, functional beach profile area available for sediment transport is assumed much largerthan actually exists in Kaanapali. None of the models evaluated account for the presence of a reef system. This maycontribute to overestimations of LST as they assume the entire profile is mobile sediment. However, the fact thatCERC (1991) underestimates the observed transport implies that environmental parameters employed in these models(such as wave height, direction and period) play a more substantial role than the influence of the reef in model results.
ADDITIONAL INDEX WORDS: Longshore sediment transport, sediment transport modeling, fringing reef, beach pro-files, coastal erosion, Hawaii, beaches.
INTRODUCTION
Many coastal science and engineering studies attempt topredict rates of longshore and cross-shore sediment trans-port. The scope of predictive formulas are largely empiricaland reflect results based on field studies from around theworld (KOMAR and INMAN, 1970; DEAN, 1989; BODGE andKRAUS, 1991; KRAUS et al., 1991; SHORT, 1999). Researchershave found that sediment concentration and transport at thebreaker line is strongly influenced by breaker type and thuswave energy (KANA and WARD, 1980; NIELSEN, 1984; VAN
RIJN, 1993). Field techniques for measuring total and sus-pended longshore sediment transport include sediment trac-er, impoundment and streamer traps. Here we employ theimpoundment technique for comparison with three predictivelongshore transport models.
The near-shore sediment transport system of KaanapaliBeach, Maui is examined using 13 monthly beach surveys.
02120 received and accepted in revision 21 November 2002.
We describe the dominant spatial and temporal patterns ofsediment transport and volume variability and evaluatethree commonly used Longshore Sediment Transport (LST)formulas: (CERC, 1984; KAMPHIUS, 1991; and The ArmyCorps of Engineers (ACOE) Generalized Model For Simulat-ing Shoreline Change (GENESIS) model (CERC, 1991). Wefind the CERC (1991) model fits observations of LST bestwhile the CERC (1984) and KAMPHIUS (1991) models areprone to overestimate the observed longshore transport byroughly an order of magnitude.
ENVIRONMENTAL SETTING
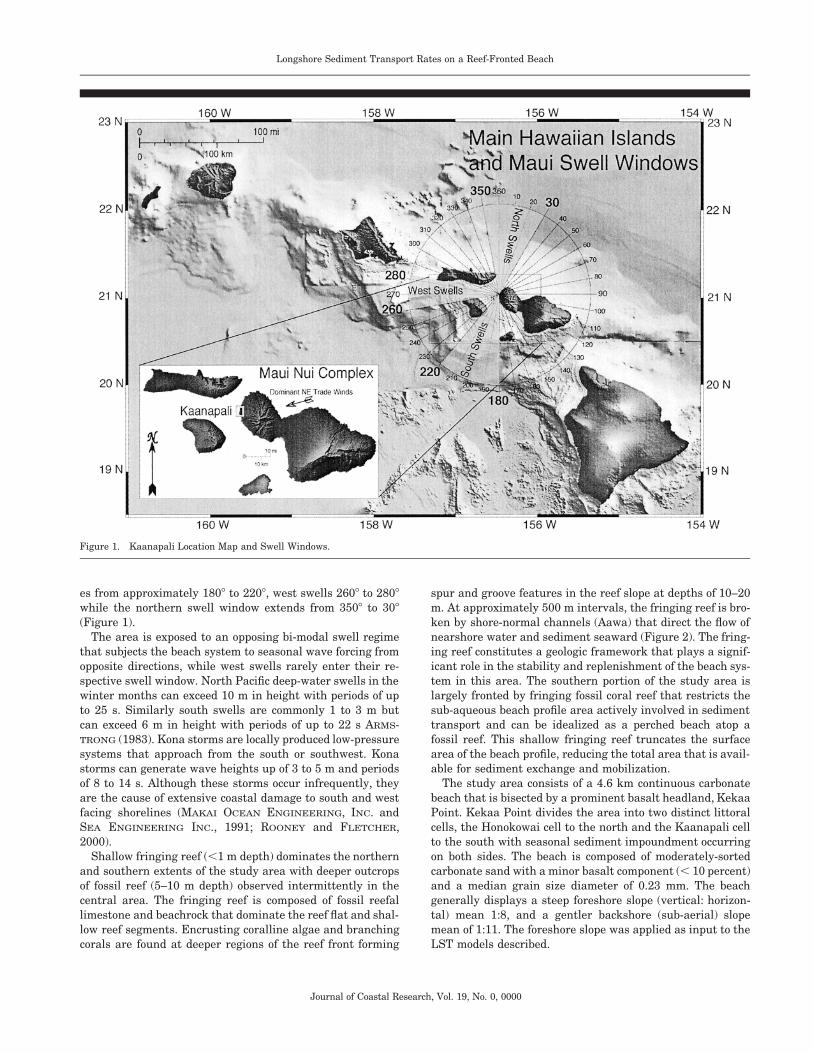
Kaanapali Beach is located on the west coast of the islandof Maui, Hawaii in the lee of the dominant northeast tradewinds. Meteorological conditions of this coast are variable buttypically calm with moderate trade winds and infrequent butstrong onshore storm winds (Kona Storms). The surroundingislands shelter the area from most swells except for threepronounced swell windows. The southern swell window rang-
Longshore Sediment Transport Rates on a Reef-Fronted Beach
Journal of Coastal Research, Vol. 19, No. 0, 0000
Figure 1. Kaanapali Location Map and Swell Windows.
es from approximately 1808 to 2208, west swells 2608 to 2808while the northern swell window extends from 3508 to 308(Figure 1).
The area is exposed to an opposing bi-modal swell regimethat subjects the beach system to seasonal wave forcing fromopposite directions, while west swells rarely enter their re-spective swell window. North Pacific deep-water swells in thewinter months can exceed 10 m in height with periods of upto 25 s. Similarly south swells are commonly 1 to 3 m butcan exceed 6 m in height with periods of up to 22 s ARMS-TRONG (1983). Kona storms are locally produced low-pressuresystems that approach from the south or southwest. Konastorms can generate wave heights up of 3 to 5 m and periodsof 8 to 14 s. Although these storms occur infrequently, theyare the cause of extensive coastal damage to south and westfacing shorelines (MAKAI OCEAN ENGINEERING, INC. andSEA ENGINEERING INC., 1991; ROONEY and FLETCHER,2000).
Shallow fringing reef (,1 m depth) dominates the northernand southern extents of the study area with deeper outcropsof fossil reef (5–10 m depth) observed intermittently in thecentral area. The fringing reef is composed of fossil reefallimestone and beachrock that dominate the reef flat and shal-low reef segments. Encrusting coralline algae and branchingcorals are found at deeper regions of the reef front forming
spur and groove features in the reef slope at depths of 10–20m. At approximately 500 m intervals, the fringing reef is bro-ken by shore-normal channels (Aawa) that direct the flow ofnearshore water and sediment seaward (Figure 2). The fring-ing reef constitutes a geologic framework that plays a signif-icant role in the stability and replenishment of the beach sys-tem in this area. The southern portion of the study area islargely fronted by fringing fossil coral reef that restricts thesub-aqueous beach profile area actively involved in sedimenttransport and can be idealized as a perched beach atop afossil reef. This shallow fringing reef truncates the surfacearea of the beach profile, reducing the total area that is avail-able for sediment exchange and mobilization.
The study area consists of a 4.6 km continuous carbonatebeach that is bisected by a prominent basalt headland, KekaaPoint. Kekaa Point divides the area into two distinct littoralcells, the Honokowai cell to the north and the Kaanapali cellto the south with seasonal sediment impoundment occurringon both sides. The beach is composed of moderately-sortedcarbonate sand with a minor basalt component (, 10 percent)and a median grain size diameter of 0.23 mm. The beachgenerally displays a steep foreshore slope (vertical: horizon-tal) mean 1:8, and a gentler backshore (sub-aerial) slopemean of 1:11. The foreshore slope was applied as input to theLST models described.
Eversole and Fletcher
Journal of Coastal Research, Vol. 19, No. 0, 0000
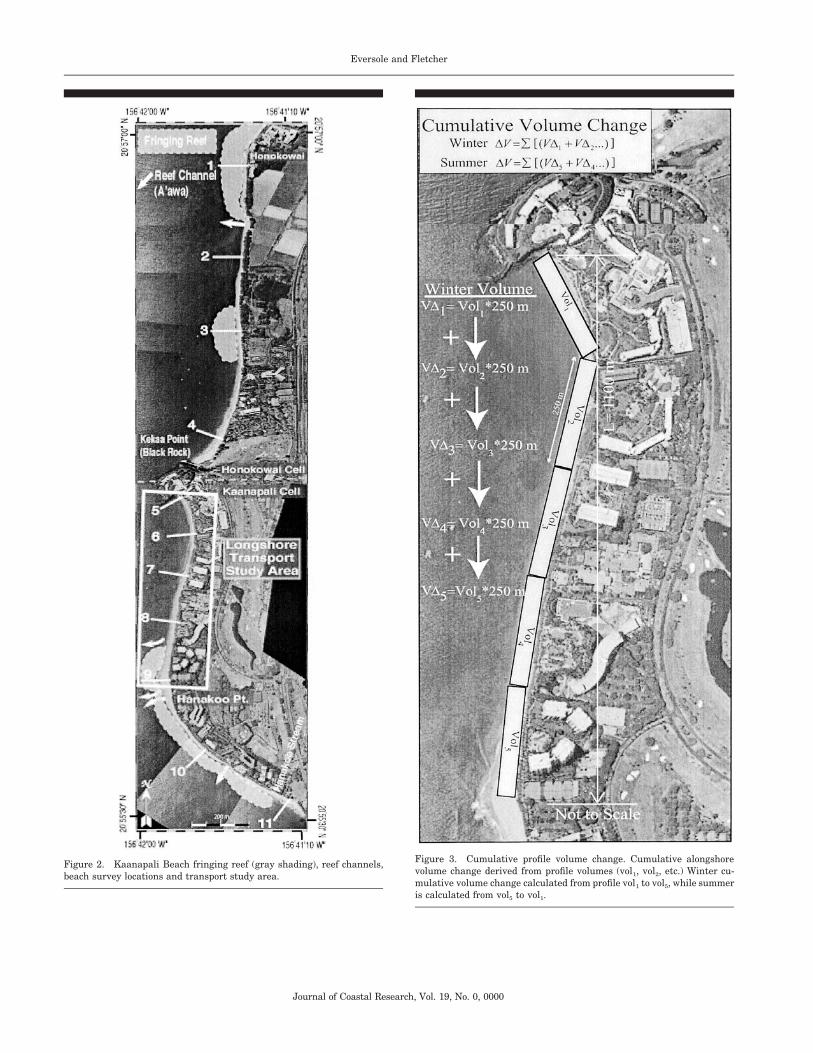
Figure 2. Kaanapali Beach fringing reef (gray shading), reef channels,beach survey locations and transport study area.
Figure 3. Cumulative profile volume change. Cumulative alongshorevolume change derived from profile volumes (vol1, vol2, etc.) Winter cu-mulative volume change calculated from profile vol1 to vol5, while summeris calculated from vol5 to vol1.
Longshore Sediment Transport Rates on a Reef-Fronted Beach
Journal of Coastal Research, Vol. 19, No. 0, 0000
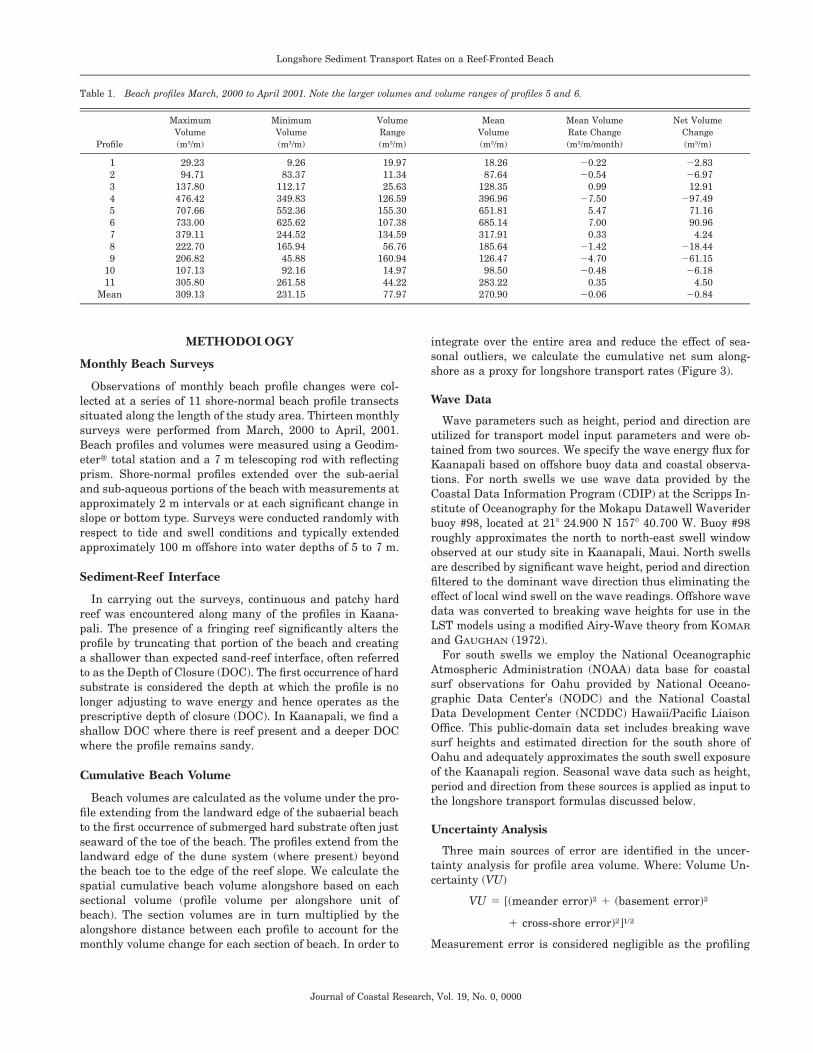
Table 1. Beach profiles March, 2000 to April 2001. Note the larger volumes and volume ranges of profiles 5 and 6.
Profile
MaximumVolume(m3/m)
MinimumVolume(m3/m)
VolumeRange(m3/m)
MeanVolume(m3/m)
Mean VolumeRate Change(m3/m/month)
Net VolumeChange(m3/m)
123456789
1011
29.2394.71
137.80476.42707.66733.00379.11222.70206.82107.13305.80
9.2683.37
112.17349.83552.36625.62244.52165.9445.8892.16
261.58
19.9711.3425.63
126.59155.30107.38134.5956.76
160.9414.9744.22
18.2687.64
128.35396.96651.81685.14317.91185.64126.4798.50
283.22
20.2220.54
0.9927.50
5.477.000.33
21.4224.7020.48
0.35
22.8326.9712.91
297.4971.1690.964.24
218.44261.1526.18
4.50Mean 309.13 231.15 77.97 270.90 20.06 20.84
METHODOLOGY
Monthly Beach Surveys
Observations of monthly beach profile changes were col-lected at a series of 11 shore-normal beach profile transectssituated along the length of the study area. Thirteen monthlysurveys were performed from March, 2000 to April, 2001.Beach profiles and volumes were measured using a Geodim-etert total station and a 7 m telescoping rod with reflectingprism. Shore-normal profiles extended over the sub-aerialand sub-aqueous portions of the beach with measurements atapproximately 2 m intervals or at each significant change inslope or bottom type. Surveys were conducted randomly withrespect to tide and swell conditions and typically extendedapproximately 100 m offshore into water depths of 5 to 7 m.
Sediment-Reef Interface
In carrying out the surveys, continuous and patchy hardreef was encountered along many of the profiles in Kaana-pali. The presence of a fringing reef significantly alters theprofile by truncating that portion of the beach and creatinga shallower than expected sand-reef interface, often referredto as the Depth of Closure (DOC). The first occurrence of hardsubstrate is considered the depth at which the profile is nolonger adjusting to wave energy and hence operates as theprescriptive depth of closure (DOC). In Kaanapali, we find ashallow DOC where there is reef present and a deeper DOCwhere the profile remains sandy.
Cumulative Beach Volume
Beach volumes are calculated as the volume under the pro-file extending from the landward edge of the subaerial beachto the first occurrence of submerged hard substrate often justseaward of the toe of the beach. The profiles extend from thelandward edge of the dune system (where present) beyondthe beach toe to the edge of the reef slope. We calculate thespatial cumulative beach volume alongshore based on eachsectional volume (profile volume per alongshore unit ofbeach). The section volumes are in turn multiplied by thealongshore distance between each profile to account for themonthly volume change for each section of beach. In order to
integrate over the entire area and reduce the effect of sea-sonal outliers, we calculate the cumulative net sum along-shore as a proxy for longshore transport rates (Figure 3).
Wave Data
Wave parameters such as height, period and direction areutilized for transport model input parameters and were ob-tained from two sources. We specify the wave energy flux forKaanapali based on offshore buoy data and coastal observa-tions. For north swells we use wave data provided by theCoastal Data Information Program (CDIP) at the Scripps In-stitute of Oceanography for the Mokapu Datawell Waveriderbuoy #98, located at 218 24.900 N 1578 40.700 W. Buoy #98roughly approximates the north to north-east swell windowobserved at our study site in Kaanapali, Maui. North swellsare described by significant wave height, period and directionfiltered to the dominant wave direction thus eliminating theeffect of local wind swell on the wave readings. Offshore wavedata was converted to breaking wave heights for use in theLST models using a modified Airy-Wave theory from KOMAR
and GAUGHAN (1972).For south swells we employ the National Oceanographic
Atmospheric Administration (NOAA) data base for coastalsurf observations for Oahu provided by National Oceano-graphic Data Center’s (NODC) and the National CoastalData Development Center (NCDDC) Hawaii/Pacific LiaisonOffice. This public-domain data set includes breaking wavesurf heights and estimated direction for the south shore ofOahu and adequately approximates the south swell exposureof the Kaanapali region. Seasonal wave data such as height,period and direction from these sources is applied as input tothe longshore transport formulas discussed below.
Uncertainty Analysis
Three main sources of error are identified in the uncer-tainty analysis for profile area volume. Where: Volume Un-certainty (VU)
2 2VU 5 [(meander error) 1 (basement error)
2 1/21 cross-shore error) ]
Measurement error is considered negligible as the profiling
Eversole and Fletcher
Journal of Coastal Research, Vol. 19, No. 0, 0000
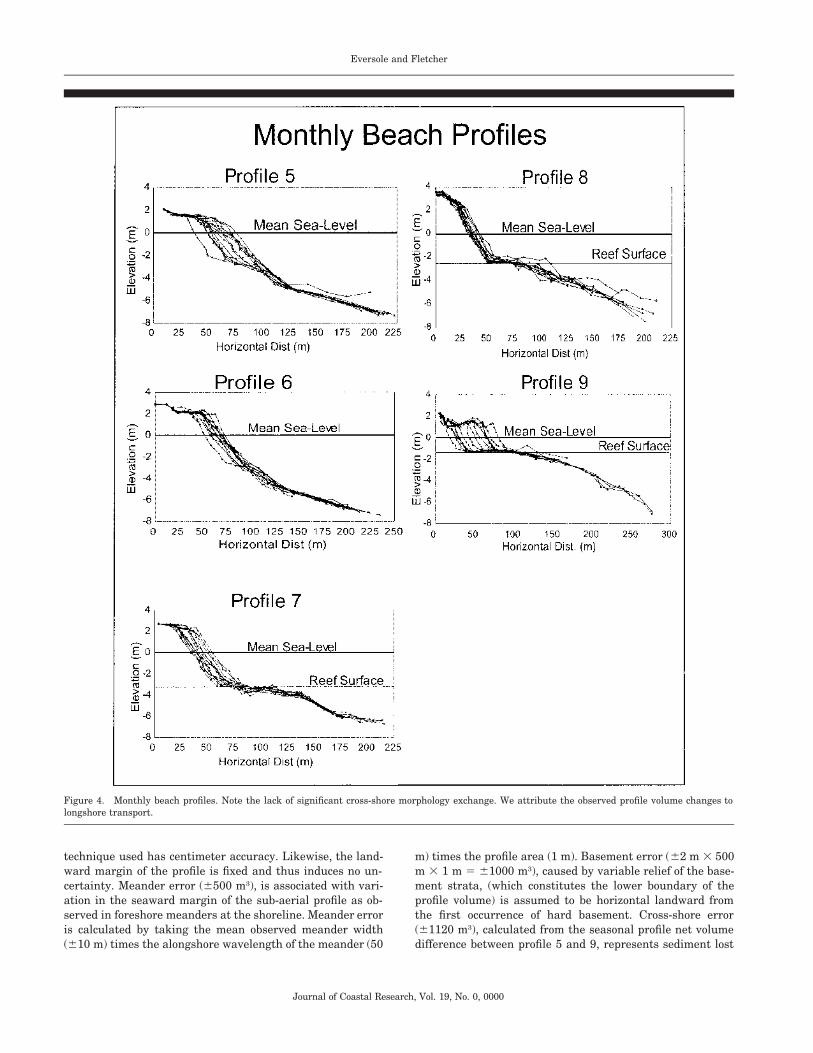
Figure 4. Monthly beach profiles. Note the lack of significant cross-shore morphology exchange. We attribute the observed profile volume changes tolongshore transport.
technique used has centimeter accuracy. Likewise, the land-ward margin of the profile is fixed and thus induces no un-certainty. Meander error (6500 m3), is associated with vari-ation in the seaward margin of the sub-aerial profile as ob-served in foreshore meanders at the shoreline. Meander erroris calculated by taking the mean observed meander width(610 m) times the alongshore wavelength of the meander (50
m) times the profile area (1 m). Basement error (62 m 3 500m 3 1 m 5 61000 m3), caused by variable relief of the base-ment strata, (which constitutes the lower boundary of theprofile volume) is assumed to be horizontal landward fromthe first occurrence of hard basement. Cross-shore error(61120 m3), calculated from the seasonal profile net volumedifference between profile 5 and 9, represents sediment lost
Longshore Sediment Transport Rates on a Reef-Fronted Beach
Journal of Coastal Research, Vol. 19, No. 0, 0000
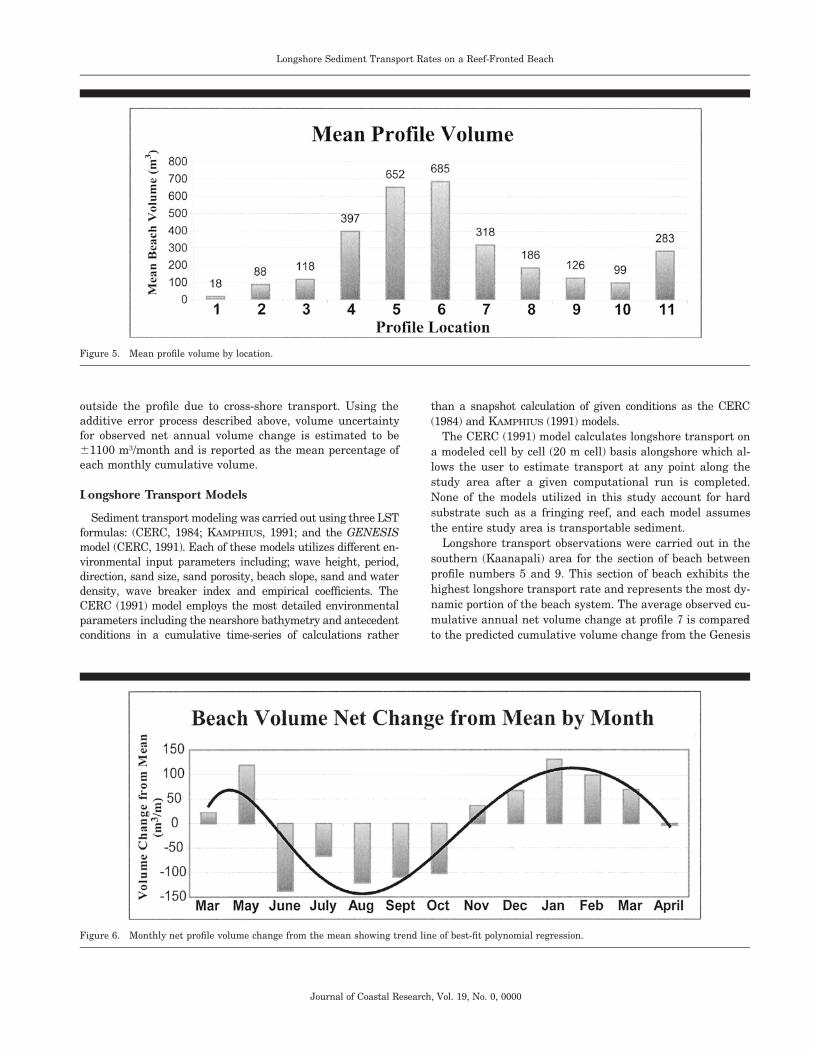
Figure 5. Mean profile volume by location.
Figure 6. Monthly net profile volume change from the mean showing trend line of best-fit polynomial regression.
outside the profile due to cross-shore transport. Using theadditive error process described above, volume uncertaintyfor observed net annual volume change is estimated to be61100 m3/month and is reported as the mean percentage ofeach monthly cumulative volume.
Longshore Transport Models
Sediment transport modeling was carried out using three LSTformulas: (CERC, 1984; KAMPHIUS, 1991; and the GENESISmodel (CERC, 1991). Each of these models utilizes different en-vironmental input parameters including; wave height, period,direction, sand size, sand porosity, beach slope, sand and waterdensity, wave breaker index and empirical coefficients. TheCERC (1991) model employs the most detailed environmentalparameters including the nearshore bathymetry and antecedentconditions in a cumulative time-series of calculations rather
than a snapshot calculation of given conditions as the CERC(1984) and KAMPHIUS (1991) models.
The CERC (1991) model calculates longshore transport ona modeled cell by cell (20 m cell) basis alongshore which al-lows the user to estimate transport at any point along thestudy area after a given computational run is completed.None of the models utilized in this study account for hardsubstrate such as a fringing reef, and each model assumesthe entire study area is transportable sediment.
Longshore transport observations were carried out in thesouthern (Kaanapali) area for the section of beach betweenprofile numbers 5 and 9. This section of beach exhibits thehighest longshore transport rate and represents the most dy-namic portion of the beach system. The average observed cu-mulative annual net volume change at profile 7 is comparedto the predicted cumulative volume change from the Genesis
Eversole and Fletcher
Journal of Coastal Research, Vol. 19, No. 0, 0000
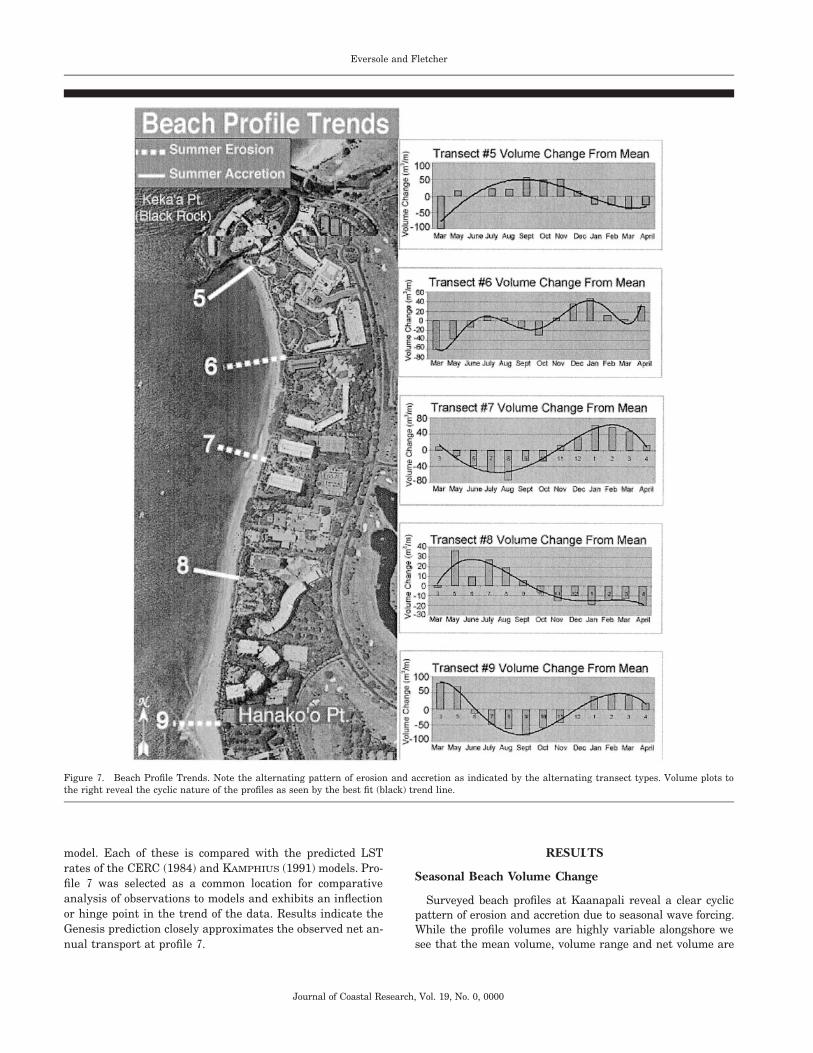
Figure 7. Beach Profile Trends. Note the alternating pattern of erosion and accretion as indicated by the alternating transect types. Volume plots tothe right reveal the cyclic nature of the profiles as seen by the best fit (black) trend line.
model. Each of these is compared with the predicted LSTrates of the CERC (1984) and KAMPHIUS (1991) models. Pro-file 7 was selected as a common location for comparativeanalysis of observations to models and exhibits an inflectionor hinge point in the trend of the data. Results indicate theGenesis prediction closely approximates the observed net an-nual transport at profile 7.
RESULTS
Seasonal Beach Volume Change
Surveyed beach profiles at Kaanapali reveal a clear cyclicpattern of erosion and accretion due to seasonal wave forcing.While the profile volumes are highly variable alongshore wesee that the mean volume, volume range and net volume are
Longshore Sediment Transport Rates on a Reef-Fronted Beach
Journal of Coastal Research, Vol. 19, No. 0, 0000
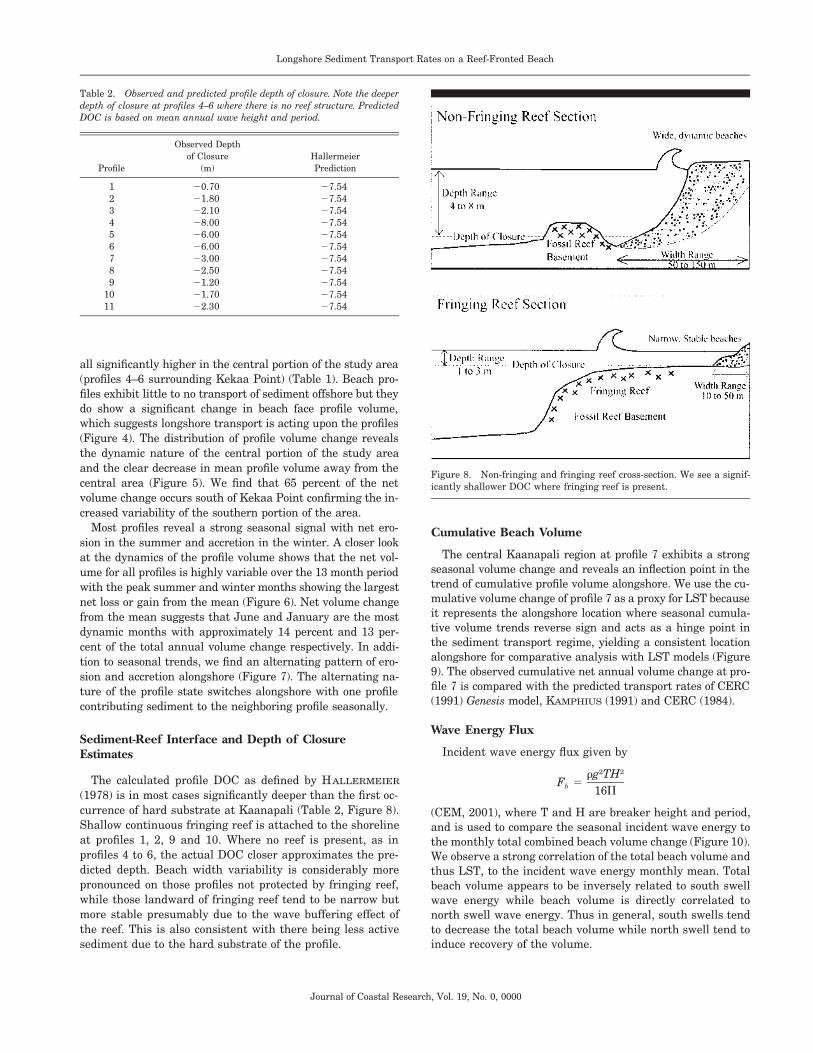
Table 2. Observed and predicted profile depth of closure. Note the deeperdepth of closure at profiles 4–6 where there is no reef structure. PredictedDOC is based on mean annual wave height and period.
Profile
Observed Depthof Closure
(m)HallermeierPrediction
123456789
1011
20.7021.8022.1028.0026.0026.0023.0022.5021.2021.7022.30
27.5427.5427.5427.5427.5427.5427.5427.5427.5427.5427.54
Figure 8. Non-fringing and fringing reef cross-section. We see a signif-icantly shallower DOC where fringing reef is present.
all significantly higher in the central portion of the study area(profiles 4–6 surrounding Kekaa Point) (Table 1). Beach pro-files exhibit little to no transport of sediment offshore but theydo show a significant change in beach face profile volume,which suggests longshore transport is acting upon the profiles(Figure 4). The distribution of profile volume change revealsthe dynamic nature of the central portion of the study areaand the clear decrease in mean profile volume away from thecentral area (Figure 5). We find that 65 percent of the netvolume change occurs south of Kekaa Point confirming the in-creased variability of the southern portion of the area.
Most profiles reveal a strong seasonal signal with net ero-sion in the summer and accretion in the winter. A closer lookat the dynamics of the profile volume shows that the net vol-ume for all profiles is highly variable over the 13 month periodwith the peak summer and winter months showing the largestnet loss or gain from the mean (Figure 6). Net volume changefrom the mean suggests that June and January are the mostdynamic months with approximately 14 percent and 13 per-cent of the total annual volume change respectively. In addi-tion to seasonal trends, we find an alternating pattern of ero-sion and accretion alongshore (Figure 7). The alternating na-ture of the profile state switches alongshore with one profilecontributing sediment to the neighboring profile seasonally.
Sediment-Reef Interface and Depth of ClosureEstimates
The calculated profile DOC as defined by HALLERMEIER
(1978) is in most cases significantly deeper than the first oc-currence of hard substrate at Kaanapali (Table 2, Figure 8).Shallow continuous fringing reef is attached to the shorelineat profiles 1, 2, 9 and 10. Where no reef is present, as inprofiles 4 to 6, the actual DOC closer approximates the pre-dicted depth. Beach width variability is considerably morepronounced on those profiles not protected by fringing reef,while those landward of fringing reef tend to be narrow butmore stable presumably due to the wave buffering effect ofthe reef. This is also consistent with there being less activesediment due to the hard substrate of the profile.
Cumulative Beach Volume
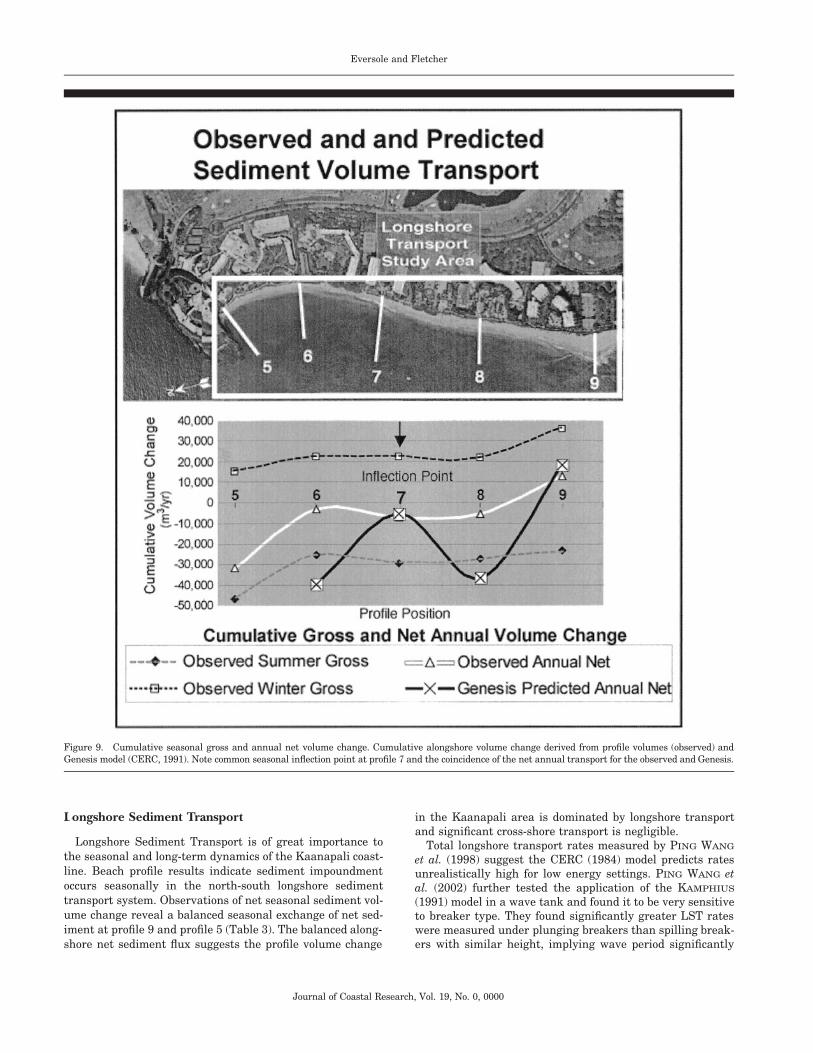
The central Kaanapali region at profile 7 exhibits a strongseasonal volume change and reveals an inflection point in thetrend of cumulative profile volume alongshore. We use the cu-mulative volume change of profile 7 as a proxy for LST becauseit represents the alongshore location where seasonal cumula-tive volume trends reverse sign and acts as a hinge point inthe sediment transport regime, yielding a consistent locationalongshore for comparative analysis with LST models (Figure9). The observed cumulative net annual volume change at pro-file 7 is compared with the predicted transport rates of CERC(1991) Genesis model, KAMPHIUS (1991) and CERC (1984).
Wave Energy Flux
Incident wave energy flux given by
2 2rg THF 5b 16P
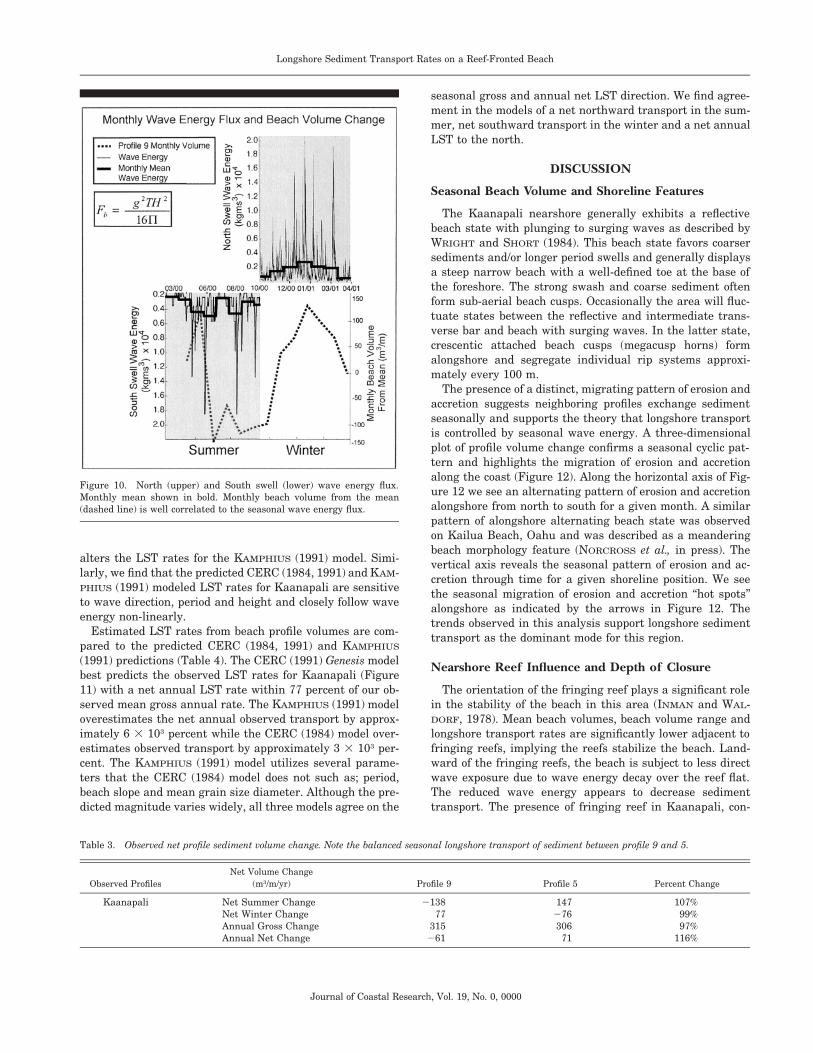
(CEM, 2001), where T and H are breaker height and period,and is used to compare the seasonal incident wave energy tothe monthly total combined beach volume change (Figure 10).We observe a strong correlation of the total beach volume andthus LST, to the incident wave energy monthly mean. Totalbeach volume appears to be inversely related to south swellwave energy while beach volume is directly correlated tonorth swell wave energy. Thus in general, south swells tendto decrease the total beach volume while north swell tend toinduce recovery of the volume.
Eversole and Fletcher
Journal of Coastal Research, Vol. 19, No. 0, 0000
Figure 9. Cumulative seasonal gross and annual net volume change. Cumulative alongshore volume change derived from profile volumes (observed) andGenesis model (CERC, 1991). Note common seasonal inflection point at profile 7 and the coincidence of the net annual transport for the observed and Genesis.
Longshore Sediment Transport
Longshore Sediment Transport is of great importance tothe seasonal and long-term dynamics of the Kaanapali coast-line. Beach profile results indicate sediment impoundmentoccurs seasonally in the north-south longshore sedimenttransport system. Observations of net seasonal sediment vol-ume change reveal a balanced seasonal exchange of net sed-iment at profile 9 and profile 5 (Table 3). The balanced along-shore net sediment flux suggests the profile volume change
in the Kaanapali area is dominated by longshore transportand significant cross-shore transport is negligible.
Total longshore transport rates measured by PING WANG
et al. (1998) suggest the CERC (1984) model predicts ratesunrealistically high for low energy settings. PING WANG etal. (2002) further tested the application of the KAMPHIUS
(1991) model in a wave tank and found it to be very sensitiveto breaker type. They found significantly greater LST rateswere measured under plunging breakers than spilling break-ers with similar height, implying wave period significantly
Longshore Sediment Transport Rates on a Reef-Fronted Beach
Journal of Coastal Research, Vol. 19, No. 0, 0000
Figure 10. North (upper) and South swell (lower) wave energy flux.Monthly mean shown in bold. Monthly beach volume from the mean(dashed line) is well correlated to the seasonal wave energy flux.
Table 3. Observed net profile sediment volume change. Note the balanced seasonal longshore transport of sediment between profile 9 and 5.
Observed ProfilesNet Volume Change
(m3/m/yr) Profile 9 Profile 5 Percent Change
Kaanapali Net Summer ChangeNet Winter ChangeAnnual Gross ChangeAnnual Net Change
213877
315261
14727630671
107%99%97%
116%
alters the LST rates for the KAMPHIUS (1991) model. Simi-larly, we find that the predicted CERC (1984, 1991) and KAM-PHIUS (1991) modeled LST rates for Kaanapali are sensitiveto wave direction, period and height and closely follow waveenergy non-linearly.
Estimated LST rates from beach profile volumes are com-pared to the predicted CERC (1984, 1991) and KAMPHIUS
(1991) predictions (Table 4). The CERC (1991) Genesis modelbest predicts the observed LST rates for Kaanapali (Figure11) with a net annual LST rate within 77 percent of our ob-served mean gross annual rate. The KAMPHIUS (1991) modeloverestimates the net annual observed transport by approx-imately 6 3 103 percent while the CERC (1984) model over-estimates observed transport by approximately 3 3 103 per-cent. The KAMPHIUS (1991) model utilizes several parame-ters that the CERC (1984) model does not such as; period,beach slope and mean grain size diameter. Although the pre-dicted magnitude varies widely, all three models agree on the
seasonal gross and annual net LST direction. We find agree-ment in the models of a net northward transport in the sum-mer, net southward transport in the winter and a net annualLST to the north.
DISCUSSION
Seasonal Beach Volume and Shoreline Features
The Kaanapali nearshore generally exhibits a reflectivebeach state with plunging to surging waves as described byWRIGHT and SHORT (1984). This beach state favors coarsersediments and/or longer period swells and generally displaysa steep narrow beach with a well-defined toe at the base ofthe foreshore. The strong swash and coarse sediment oftenform sub-aerial beach cusps. Occasionally the area will fluc-tuate states between the reflective and intermediate trans-verse bar and beach with surging waves. In the latter state,crescentic attached beach cusps (megacusp horns) formalongshore and segregate individual rip systems approxi-mately every 100 m.
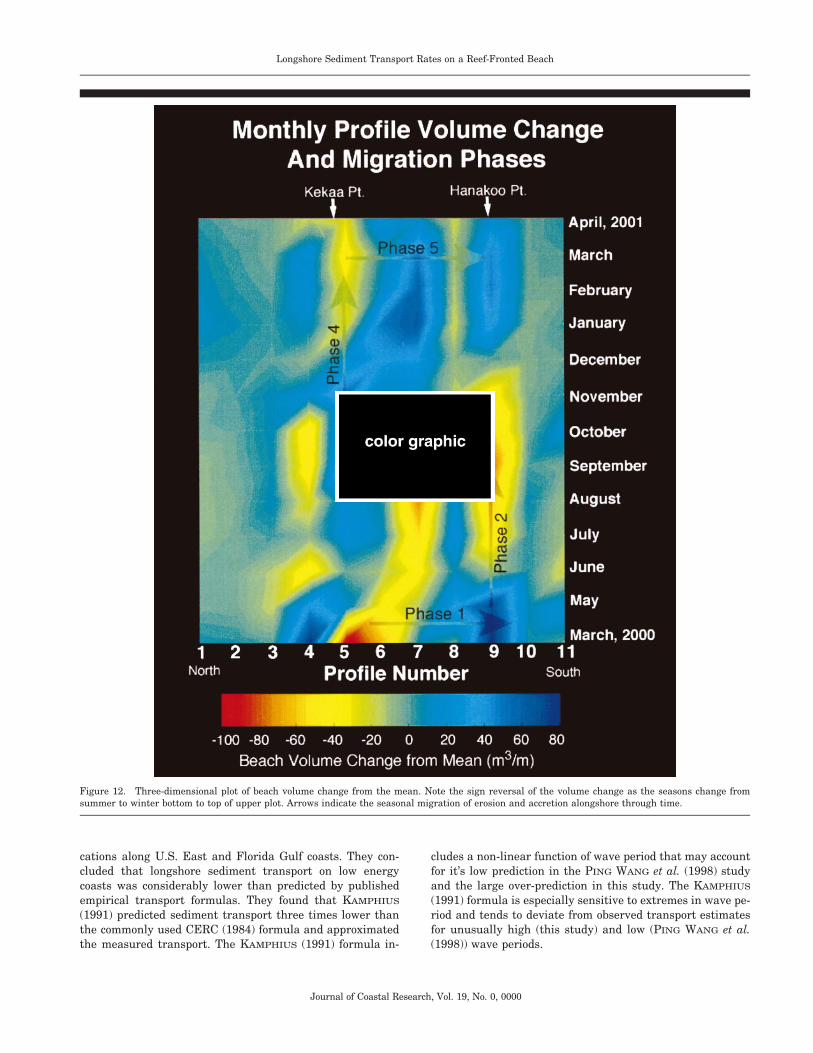
The presence of a distinct, migrating pattern of erosion andaccretion suggests neighboring profiles exchange sedimentseasonally and supports the theory that longshore transportis controlled by seasonal wave energy. A three-dimensionalplot of profile volume change confirms a seasonal cyclic pat-tern and highlights the migration of erosion and accretionalong the coast (Figure 12). Along the horizontal axis of Fig-ure 12 we see an alternating pattern of erosion and accretionalongshore from north to south for a given month. A similarpattern of alongshore alternating beach state was observedon Kailua Beach, Oahu and was described as a meanderingbeach morphology feature (NORCROSS et al., in press). Thevertical axis reveals the seasonal pattern of erosion and ac-cretion through time for a given shoreline position. We seethe seasonal migration of erosion and accretion ‘‘hot spots’’alongshore as indicated by the arrows in Figure 12. Thetrends observed in this analysis support longshore sedimenttransport as the dominant mode for this region.
Nearshore Reef Influence and Depth of Closure
The orientation of the fringing reef plays a significant rolein the stability of the beach in this area (INMAN and WAL-DORF, 1978). Mean beach volumes, beach volume range andlongshore transport rates are significantly lower adjacent tofringing reefs, implying the reefs stabilize the beach. Land-ward of the fringing reefs, the beach is subject to less directwave exposure due to wave energy decay over the reef flat.The reduced wave energy appears to decrease sedimenttransport. The presence of fringing reef in Kaanapali, con-
Eversole and Fletcher
Journal of Coastal Research, Vol. 19, No. 0, 0000
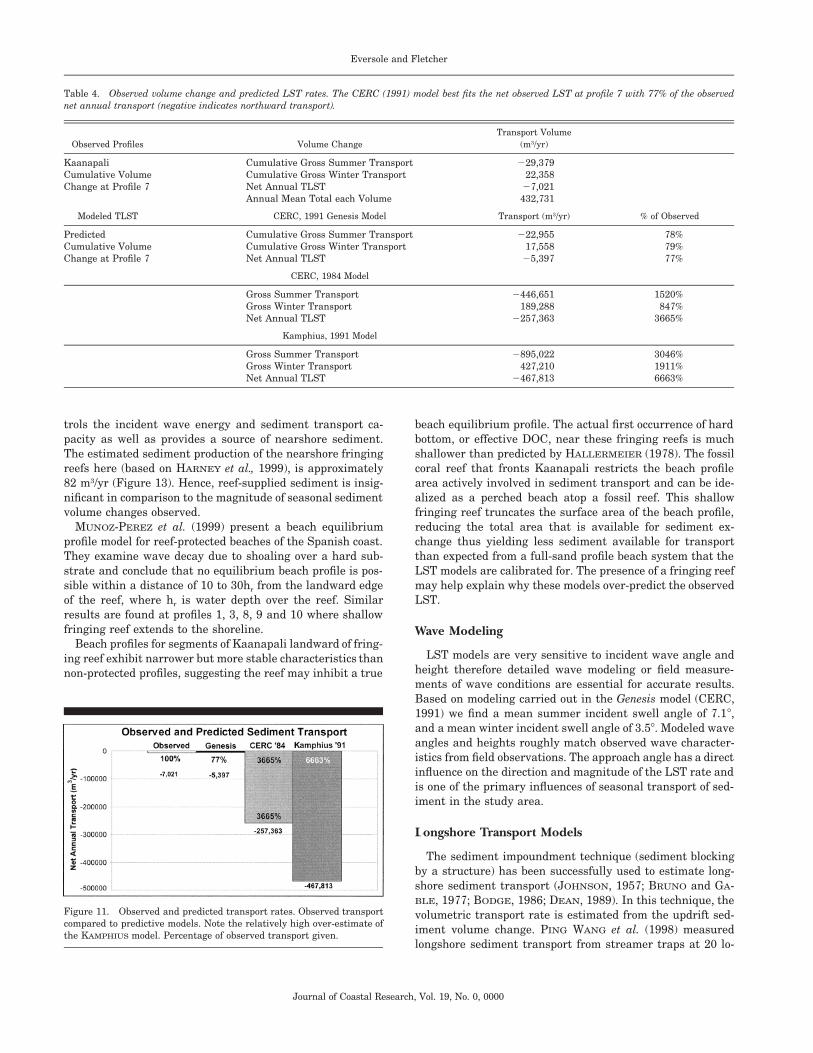
Table 4. Observed volume change and predicted LST rates. The CERC (1991) model best fits the net observed LST at profile 7 with 77% of the observednet annual transport (negative indicates northward transport).
Observed Profiles Volume ChangeTransport Volume
(m3/yr)
KaanapaliCumulative VolumeChange at Profile 7
Cumulative Gross Summer TransportCumulative Gross Winter TransportNet Annual TLSTAnnual Mean Total each Volume
229,37922,358
27,021432,731
Modeled TLST CERC, 1991 Genesis Model Transport (m3/yr) % of Observed
PredictedCumulative VolumeChange at Profile 7
Cumulative Gross Summer TransportCumulative Gross Winter TransportNet Annual TLST
222,95517,558
25,397
78%79%77%
CERC, 1984 Model
Gross Summer TransportGross Winter TransportNet Annual TLST
2446,651189,288
2257,363
1520%847%
3665%
Kamphius, 1991 Model
Gross Summer TransportGross Winter TransportNet Annual TLST
2895,022427,210
2467,813
3046%1911%6663%
Figure 11. Observed and predicted transport rates. Observed transportcompared to predictive models. Note the relatively high over-estimate ofthe KAMPHIUS model. Percentage of observed transport given.
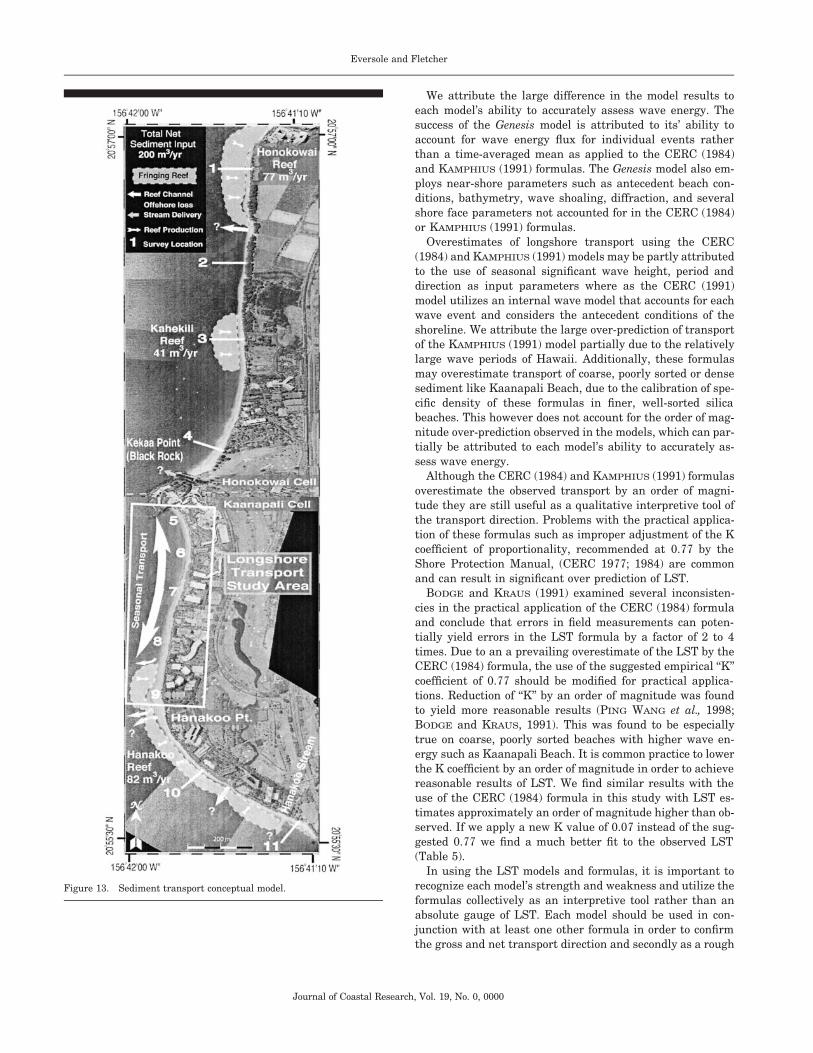
trols the incident wave energy and sediment transport ca-pacity as well as provides a source of nearshore sediment.The estimated sediment production of the nearshore fringingreefs here (based on HARNEY et al., 1999), is approximately82 m3/yr (Figure 13). Hence, reef-supplied sediment is insig-nificant in comparison to the magnitude of seasonal sedimentvolume changes observed.
MUNOZ-PEREZ et al. (1999) present a beach equilibriumprofile model for reef-protected beaches of the Spanish coast.They examine wave decay due to shoaling over a hard sub-strate and conclude that no equilibrium beach profile is pos-sible within a distance of 10 to 30hr from the landward edgeof the reef, where hr is water depth over the reef. Similarresults are found at profiles 1, 3, 8, 9 and 10 where shallowfringing reef extends to the shoreline.
Beach profiles for segments of Kaanapali landward of fring-ing reef exhibit narrower but more stable characteristics thannon-protected profiles, suggesting the reef may inhibit a true
beach equilibrium profile. The actual first occurrence of hardbottom, or effective DOC, near these fringing reefs is muchshallower than predicted by HALLERMEIER (1978). The fossilcoral reef that fronts Kaanapali restricts the beach profilearea actively involved in sediment transport and can be ide-alized as a perched beach atop a fossil reef. This shallowfringing reef truncates the surface area of the beach profile,reducing the total area that is available for sediment ex-change thus yielding less sediment available for transportthan expected from a full-sand profile beach system that theLST models are calibrated for. The presence of a fringing reefmay help explain why these models over-predict the observedLST.
Wave Modeling
LST models are very sensitive to incident wave angle andheight therefore detailed wave modeling or field measure-ments of wave conditions are essential for accurate results.Based on modeling carried out in the Genesis model (CERC,1991) we find a mean summer incident swell angle of 7.18,and a mean winter incident swell angle of 3.58. Modeled waveangles and heights roughly match observed wave character-istics from field observations. The approach angle has a directinfluence on the direction and magnitude of the LST rate andis one of the primary influences of seasonal transport of sed-iment in the study area.
Longshore Transport Models
The sediment impoundment technique (sediment blockingby a structure) has been successfully used to estimate long-shore sediment transport (JOHNSON, 1957; BRUNO and GA-BLE, 1977; BODGE, 1986; DEAN, 1989). In this technique, thevolumetric transport rate is estimated from the updrift sed-iment volume change. PING WANG et al. (1998) measuredlongshore sediment transport from streamer traps at 20 lo-
Longshore Sediment Transport Rates on a Reef-Fronted Beach
Journal of Coastal Research, Vol. 19, No. 0, 0000
Figure 12. Three-dimensional plot of beach volume change from the mean. Note the sign reversal of the volume change as the seasons change fromsummer to winter bottom to top of upper plot. Arrows indicate the seasonal migration of erosion and accretion alongshore through time.
cations along U.S. East and Florida Gulf coasts. They con-cluded that longshore sediment transport on low energycoasts was considerably lower than predicted by publishedempirical transport formulas. They found that KAMPHIUS
(1991) predicted sediment transport three times lower thanthe commonly used CERC (1984) formula and approximatedthe measured transport. The KAMPHIUS (1991) formula in-
cludes a non-linear function of wave period that may accountfor it’s low prediction in the PING WANG et al. (1998) studyand the large over-prediction in this study. The KAMPHIUS
(1991) formula is especially sensitive to extremes in wave pe-riod and tends to deviate from observed transport estimatesfor unusually high (this study) and low (PING WANG et al.(1998)) wave periods.
Eversole and Fletcher
Journal of Coastal Research, Vol. 19, No. 0, 0000
Figure 13. Sediment transport conceptual model.
We attribute the large difference in the model results toeach model’s ability to accurately assess wave energy. Thesuccess of the Genesis model is attributed to its’ ability toaccount for wave energy flux for individual events ratherthan a time-averaged mean as applied to the CERC (1984)and KAMPHIUS (1991) formulas. The Genesis model also em-ploys near-shore parameters such as antecedent beach con-ditions, bathymetry, wave shoaling, diffraction, and severalshore face parameters not accounted for in the CERC (1984)or KAMPHIUS (1991) formulas.
Overestimates of longshore transport using the CERC(1984) and KAMPHIUS (1991) models may be partly attributedto the use of seasonal significant wave height, period anddirection as input parameters where as the CERC (1991)model utilizes an internal wave model that accounts for eachwave event and considers the antecedent conditions of theshoreline. We attribute the large over-prediction of transportof the KAMPHIUS (1991) model partially due to the relativelylarge wave periods of Hawaii. Additionally, these formulasmay overestimate transport of coarse, poorly sorted or densesediment like Kaanapali Beach, due to the calibration of spe-cific density of these formulas in finer, well-sorted silicabeaches. This however does not account for the order of mag-nitude over-prediction observed in the models, which can par-tially be attributed to each model’s ability to accurately as-sess wave energy.
Although the CERC (1984) and KAMPHIUS (1991) formulasoverestimate the observed transport by an order of magni-tude they are still useful as a qualitative interpretive tool ofthe transport direction. Problems with the practical applica-tion of these formulas such as improper adjustment of the Kcoefficient of proportionality, recommended at 0.77 by theShore Protection Manual, (CERC 1977; 1984) are commonand can result in significant over prediction of LST.
BODGE and KRAUS (1991) examined several inconsisten-cies in the practical application of the CERC (1984) formulaand conclude that errors in field measurements can poten-tially yield errors in the LST formula by a factor of 2 to 4times. Due to an a prevailing overestimate of the LST by theCERC (1984) formula, the use of the suggested empirical ‘‘K’’coefficient of 0.77 should be modified for practical applica-tions. Reduction of ‘‘K’’ by an order of magnitude was foundto yield more reasonable results (PING WANG et al., 1998;BODGE and KRAUS, 1991). This was found to be especiallytrue on coarse, poorly sorted beaches with higher wave en-ergy such as Kaanapali Beach. It is common practice to lowerthe K coefficient by an order of magnitude in order to achievereasonable results of LST. We find similar results with theuse of the CERC (1984) formula in this study with LST es-timates approximately an order of magnitude higher than ob-served. If we apply a new K value of 0.07 instead of the sug-gested 0.77 we find a much better fit to the observed LST(Table 5).
In using the LST models and formulas, it is important torecognize each model’s strength and weakness and utilize theformulas collectively as an interpretive tool rather than anabsolute gauge of LST. Each model should be used in con-junction with at least one other formula in order to confirmthe gross and net transport direction and secondly as a rough
Longshore Sediment Transport Rates on a Reef-Fronted Beach
Journal of Coastal Research, Vol. 19, No. 0, 0000
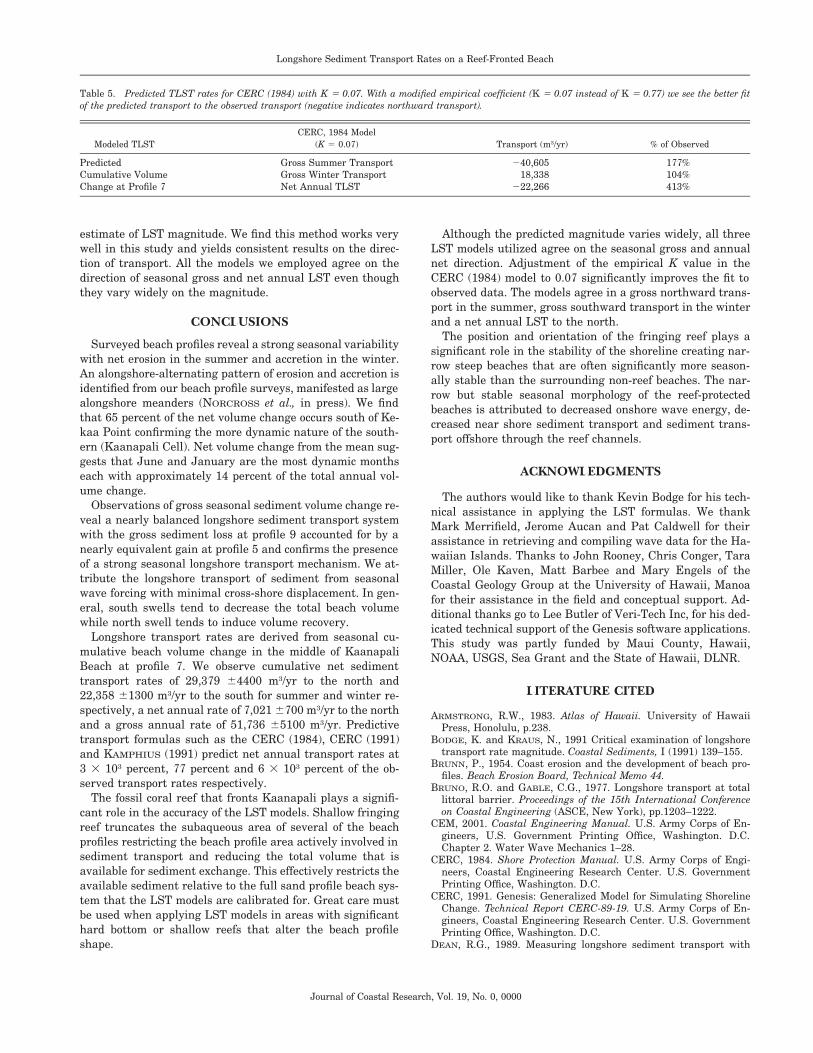
Table 5. Predicted TLST rates for CERC (1984) with K 5 0.07. With a modified empirical coefficient (K 5 0.07 instead of K 5 0.77) we see the better fitof the predicted transport to the observed transport (negative indicates northward transport).
Modeled TLSTCERC, 1984 Model
(K 5 0.07) Transport (m3/yr) % of Observed
PredictedCumulative VolumeChange at Profile 7
Gross Summer TransportGross Winter TransportNet Annual TLST
240,60518,338
222,266
177%104%413%
estimate of LST magnitude. We find this method works verywell in this study and yields consistent results on the direc-tion of transport. All the models we employed agree on thedirection of seasonal gross and net annual LST even thoughthey vary widely on the magnitude.
CONCLUSIONS
Surveyed beach profiles reveal a strong seasonal variabilitywith net erosion in the summer and accretion in the winter.An alongshore-alternating pattern of erosion and accretion isidentified from our beach profile surveys, manifested as largealongshore meanders (NORCROSS et al., in press). We findthat 65 percent of the net volume change occurs south of Ke-kaa Point confirming the more dynamic nature of the south-ern (Kaanapali Cell). Net volume change from the mean sug-gests that June and January are the most dynamic monthseach with approximately 14 percent of the total annual vol-ume change.
Observations of gross seasonal sediment volume change re-veal a nearly balanced longshore sediment transport systemwith the gross sediment loss at profile 9 accounted for by anearly equivalent gain at profile 5 and confirms the presenceof a strong seasonal longshore transport mechanism. We at-tribute the longshore transport of sediment from seasonalwave forcing with minimal cross-shore displacement. In gen-eral, south swells tend to decrease the total beach volumewhile north swell tends to induce volume recovery.
Longshore transport rates are derived from seasonal cu-mulative beach volume change in the middle of KaanapaliBeach at profile 7. We observe cumulative net sedimenttransport rates of 29,379 64400 m3/yr to the north and22,358 61300 m3/yr to the south for summer and winter re-spectively, a net annual rate of 7,021 6700 m3/yr to the northand a gross annual rate of 51,736 65100 m3/yr. Predictivetransport formulas such as the CERC (1984), CERC (1991)and KAMPHIUS (1991) predict net annual transport rates at3 3 103 percent, 77 percent and 6 3 103 percent of the ob-served transport rates respectively.
The fossil coral reef that fronts Kaanapali plays a signifi-cant role in the accuracy of the LST models. Shallow fringingreef truncates the subaqueous area of several of the beachprofiles restricting the beach profile area actively involved insediment transport and reducing the total volume that isavailable for sediment exchange. This effectively restricts theavailable sediment relative to the full sand profile beach sys-tem that the LST models are calibrated for. Great care mustbe used when applying LST models in areas with significanthard bottom or shallow reefs that alter the beach profileshape.
Although the predicted magnitude varies widely, all threeLST models utilized agree on the seasonal gross and annualnet direction. Adjustment of the empirical K value in theCERC (1984) model to 0.07 significantly improves the fit toobserved data. The models agree in a gross northward trans-port in the summer, gross southward transport in the winterand a net annual LST to the north.
The position and orientation of the fringing reef plays asignificant role in the stability of the shoreline creating nar-row steep beaches that are often significantly more season-ally stable than the surrounding non-reef beaches. The nar-row but stable seasonal morphology of the reef-protectedbeaches is attributed to decreased onshore wave energy, de-creased near shore sediment transport and sediment trans-port offshore through the reef channels.
ACKNOWLEDGMENTS
The authors would like to thank Kevin Bodge for his tech-nical assistance in applying the LST formulas. We thankMark Merrifield, Jerome Aucan and Pat Caldwell for theirassistance in retrieving and compiling wave data for the Ha-waiian Islands. Thanks to John Rooney, Chris Conger, TaraMiller, Ole Kaven, Matt Barbee and Mary Engels of theCoastal Geology Group at the University of Hawaii, Manoafor their assistance in the field and conceptual support. Ad-ditional thanks go to Lee Butler of Veri-Tech Inc, for his ded-icated technical support of the Genesis software applications.This study was partly funded by Maui County, Hawaii,NOAA, USGS, Sea Grant and the State of Hawaii, DLNR.
LITERATURE CITED
ARMSTRONG, R.W., 1983. Atlas of Hawaii. University of HawaiiPress, Honolulu, p.238.
BODGE, K. and KRAUS, N., 1991 Critical examination of longshoretransport rate magnitude. Coastal Sediments, I (1991) 139–155.
BRUNN, P., 1954. Coast erosion and the development of beach pro-files. Beach Erosion Board, Technical Memo 44.
BRUNO, R.O. and GABLE, C.G., 1977. Longshore transport at totallittoral barrier. Proceedings of the 15th International Conferenceon Coastal Engineering (ASCE, New York), pp.1203–1222.
CEM, 2001. Coastal Engineering Manual. U.S. Army Corps of En-gineers, U.S. Government Printing Office, Washington. D.C.Chapter 2. Water Wave Mechanics 1–28.
CERC, 1984. Shore Protection Manual. U.S. Army Corps of Engi-neers, Coastal Engineering Research Center. U.S. GovernmentPrinting Office, Washington. D.C.
CERC, 1991. Genesis: Generalized Model for Simulating ShorelineChange. Technical Report CERC-89-19. U.S. Army Corps of En-gineers, Coastal Engineering Research Center. U.S. GovernmentPrinting Office, Washington. D.C.
DEAN, R.G., 1989. Measuring longshore sediment transport with
Eversole and Fletcher
Journal of Coastal Research, Vol. 19, No. 0, 0000
traps. In: Seymour, R.J. (ed.), Nearshore Sediment Transport. NewYork: Plenum, pp. 313–337.
DEAN, R.G., 1977. Equilibrium Beach Profiles: US Atlantic and GulfCoasts. Ocean Engineering Report No. 12, Department of Civil En-gineering, University of Delaware, Newark, Delaware.
HALLERMEIER, R.J., 1978. Uses for a calculated limit depth to beacherosion. Proceedings 16th Coastal Engineering Conference. ASCE,New York, pp.1493–1512.
HARNEY, J.N.; GROSSMAN, E.E.; RICHMOND, B.M., and FLETCHER,C.H., 1999. Age and composition of carbonate shoreface sediments,Kailua Bay, Oahu, Hawaii. Coral Reefs, 19. 141–154.
INMAN, D.L. and WALDORF, B.W., 1978. Beach and Reef Study,South Beach Kaanapali, Maui. Report for Amfac Communities-Maui. Intersea Research Corporation, July 1978.
JOHNSON, J.W., 1957. The littoral drift problem at shoreline har-bors. Journal of waterways and Harbors Division (ASCE, NewYork), pp.1215–1234.
KANA, T.W. and WARD, L.G., 1980. Suspended Sediment Load Dur-ing Storm and Post-Storm Conditions. Proceedings of 17th Inter-national Conference on Coastal Engineering (New York: ASCE),pp.1159–1175.
KAMPHIUS, J.W., 1991. Alongshore sediment transport rate. Journalof Waterway, Port, Coastal and Ocean Engineering (ASCE), 117(6),624–641.
KOMAR, P.D. and GAUGHAN, M.K., 1972. Airy wave theory andbreaker height prediction. Proceedings of the 13th Annual CoastalEngineering Conference (ASCE), pp.405–418.
KOMAR, P.D. and INMAN, D.L., 1970. Longshore sand transport onbeaches. Journal of Geophysical Research, 75(30), 5514–5527.
KRAUS, N.C.; LARSON, M., and KRIEBEL, D.L., 1991. Evaluation ofBeach Erosion and Accretion Predictors. Paper Presented atCoastal Sediments, Am. Soc. Civ. Eng., Vol 91, Seattle, WA.
MAKAI OCEAN ENGINEERING, INC., and SEA ENGINEERING INC.,1991. Aerial photographic Analysis of Coastal Erosion on the Is-lands of Kaui, Lanai, Maui and Hawaii. Office of Sate Planning,Coastal Zone Management Program. Honolulu, 200p.
MUNOZ-PEREZ, J.J.; TEJEDOR, L., and MEDIAN, R., 1999. Equilibri-um profile model for reef-protected beaches. Journal of CoastalResearch, 15(4), 950–957.
NIELSEN, P., 1984. Field measurements of time-averaged suspendedsediment concentrations under waves. Coastal Engineering, 8, 51–72.
NORCROSS, Z.M.; FLETCHER, C.H., and MERRIFIELD, M.A., (InPress). Large-scale longshore meanders on a carbonate beach sub-stitute for seasonal morphology in response to wave state.
ROONEY, J.J. and FLETCHER, C.H., 2000. A high resolution, digital,aerial-photogrammetric analysis of historical shoreline changeand net sediment transport along the Kihei cast of Maui, Hawaii.Proceedings 13th Annual National Conference Beach PreservationTechnology (February 2–4, 2000, Melbourne, Florida), pp.xxx–xxx.
SHORT, A.D., 1999. Handbook of Beach and Shoreface Morphodyn-amics. New York: Wiley, 177p.
VAN RIJN, L.C., 1993. Principles of Sediment Transport in Rivers,Estuaries and Coastal Seas. The Netherlands: Aqua Publications,xxxp.
WANG, P.; KRAUS, N.C., and DAVIS, R.A., 1998. Total longshore sed-iment transport rate in the surf zone: Field measurements andempirical predictions. Journal of Coastal Research, 14(1), 269–282.
WANG, P.; SMITH, E.R., and EBERSOLE, B.A., 2002. Large-scale lab-oratory measurements of longshore sediment transport underspilling and plunging breakers. Journal of Coastal Research, 18(1),118–135.
WRIGHT, L.D. and SHORT, A.D., 1984. Morphodynamics of beachesand surf zones in Australia. Boca Raton, Florida: CRC Handbookof Coastal Processes and Erosion, pp. 35–64.