longitudinal joint density and permeability in asphalt concrete

This is an Open Access document downloaded from ORCA, Cardiff University's institutional
repository: http://orca.cf.ac.uk/135162/
This is the author’s version of a work that was submitted to / accepted for publication.
Citation for final published version:
Genc, Sila, Malpas, Charles B., Gulenc, Alisha, Sciberras, Emma, Efron, Daryl, Silk, Timothy J.
and Seal, Marc L. 2020. Longitudinal patterns of white matter fibre density and morphology in
children is associated with age and pubertal stage. Developmental Cognitive Neuroscience 45 ,
100853. 10.1016/j.dcn.2020.100853 file
Publishers page: https://doi.org/10.1016/j.dcn.2020.100853
<https://doi.org/10.1016/j.dcn.2020.100853>
Please note:
Changes made as a result of publishing processes such as copy-editing, formatting and page
numbers may not be reflected in this version. For the definitive version of this publication, please
refer to the published source. You are advised to consult the publisher’s version if you wish to cite
this paper.
This version is being made available in accordance with publisher policies. See
http://orca.cf.ac.uk/policies.html for usage policies. Copyright and moral rights for publications
made available in ORCA are retained by the copyright holders.

Developmental Cognitive Neuroscience 45 (2020) 100853
Available online 28 August 20201878-9293/© 2020 The Authors. Published by Elsevier Ltd. This is an open access article under the CC BY-NC-ND license(http://creativecommons.org/licenses/by-nc-nd/4.0/).
Longitudinal patterns of white matter ibre density and morphology in children are associated with age and pubertal stage Sila Genc a,b,c,*, Charles B. Malpas b,d, Alisha Gulenc e, Emma Sciberras c,e,f, Daryl Efron e,g, Timothy J. Silk b,f,1, Marc L. Seal b,c,1
a Cardiff University Brain Research Imaging Centre (CUBRIC), Cardiff University, Cardiff, UK b Developmental Imaging, Murdoch Children’s Research Institute, Parkville, Australia c Department of Paediatrics, University of Melbourne, Parkville, Australia d Clinical Outcomes Research Unit (CORe), Department of Medicine, Royal Melbourne Hospital, University of Melbourne, Parkville, Australia e Population Health, Murdoch Children’s Research Institute, Parkville, Australia f School of Psychology, Deakin University, Geelong, Australia g The Royal Children’s Hospital, Parkville, Australia
A R T I C L E I N F O
Keywords: White matter Longitudinal Fixel-based analysis Puberty Fibre density Fibre morphology
A B S T R A C T
The pubertal period involves dynamic white matter development. This period also corresponds with rapid gains in higher cognitive functions including attention, as well as increased risk of developing mental health difi-culties. This longitudinal study comprised children aged 9–13 years (n = 130). Diffusion magnetic resonance imaging (dMRI) data were acquired (b = 2800s/mm2, 60 directions) at two time-points. We derived measures of ibre density and morphology using the ixel-based analysis framework and performed a tract-based mixed-ef-fects modelling analysis to understand patterns of white matter development with respect to age, sex, pubertal stage, and the change in pubertal stage. We observed signiicant increases in apparent ibre density across a large number of white matter pathways, including major association and commissural pathways. We observed a linear relationship between pubertal stage and ibre density and morphology in the right superior longitudinal fasciculus, and ibre morphology in the right inferior longitudinal fasciculus. Finally, we report a signiicant interaction between the change in pubertal stage and age in the development of ibre density, for left-lateralised association tracts. Overall, white matter development across ages 9–13 years involves the expansion of major white matter ibre pathways, with key association pathways linked with pubertal stage.
1. Introduction
Puberty is a critical period of development, marking the transition from childhood to reproductive maturity (Dorn et al., 2006). Brain structure is particularly sensitive to remodelling with exposure to pu-bertal hormones (Juraska and Willing, 2017). Previous diffusion tensor imaging (DTI) studies have shown a strong link between advancing pubertal stage and greater white matter microstructural organisation (Ladouceur et al., 2012; Herting et al., 2012, 2017).
World-wide, the peak age of onset of psychiatric disorders is age 14 years (Kessler et al., 2005). The presence of internalising problems, including anxiety and depression, during this sensitive period of devel-opment pose risk for later case-level disorder (Shankman et al., 2009). Whether puberty inluences the onset of mental health problems and neurodevelopmental pathways, or vice versa, is not well understood. What is clear, however, is that these interrelated factors can alter the structural and functional reorganisation of the brain (Paus et al., 2008). Alongside internalising problems, externalising disorders can co-exist
Abbreviations: ADHD, attention-deicit/hyperactivity disorder; CCG, cingulum cingulate gyrus; CCH, cingulum hippocampus; CSD, constrained spherical deconvolution; CST, cortico-spinal tract; FA, fractional anisotropy; FBA, ixel-based analysis; FC, ibre cross-section; FD, ibre density; FDC, ibre density and cross- section; FOD, ibre orientation distribution; Fmajor, forceps major; Fminor, forceps minor; Fx, fornix; IFOF, inferior fronto-occipital fasciculus; ILF, inferior longi-tudinal fasciculus; MRI, magnetic resonance imaging; NICAP, Neuroimaging of the Children’s Attention Project; PDS, pubertal development scale; SEIFA, Socio- Economic Indexes for Areas; SES, socio-economic status; SLF, superior longitudinal fasciculus; UF, uncinate fasciculus.
* Corresponding author at: Cardiff University Brain Research Imaging Centre (CUBRIC), Cardiff University, Cardiff, CF24 4HQ, UK. E-mail address: [email protected] (S. Genc).
1 Equal senior author.
Contents lists available at ScienceDirect
Developmental Cognitive Neuroscience journal homepage: www.elsevier.com/locate/dcn
https://doi.org/10.1016/j.dcn.2020.100853 Received 3 May 2019; Received in revised form 31 July 2020; Accepted 24 August 2020
Developmental Cognitive Neuroscience 45 (2020) 100853
2
with commonly occurring disorders in childhood, such as Attention-Deicit/Hyperactivity Disorder (ADHD) (Polanczyk et al., 2007). Whilst ADHD symptoms often present before pubertal onset, these symptoms can become more severe during the transition to adolescence, whereby increases in attentional dificulties and external-ising symptoms can alter neuropsychological function (Langberg et al., 2008).
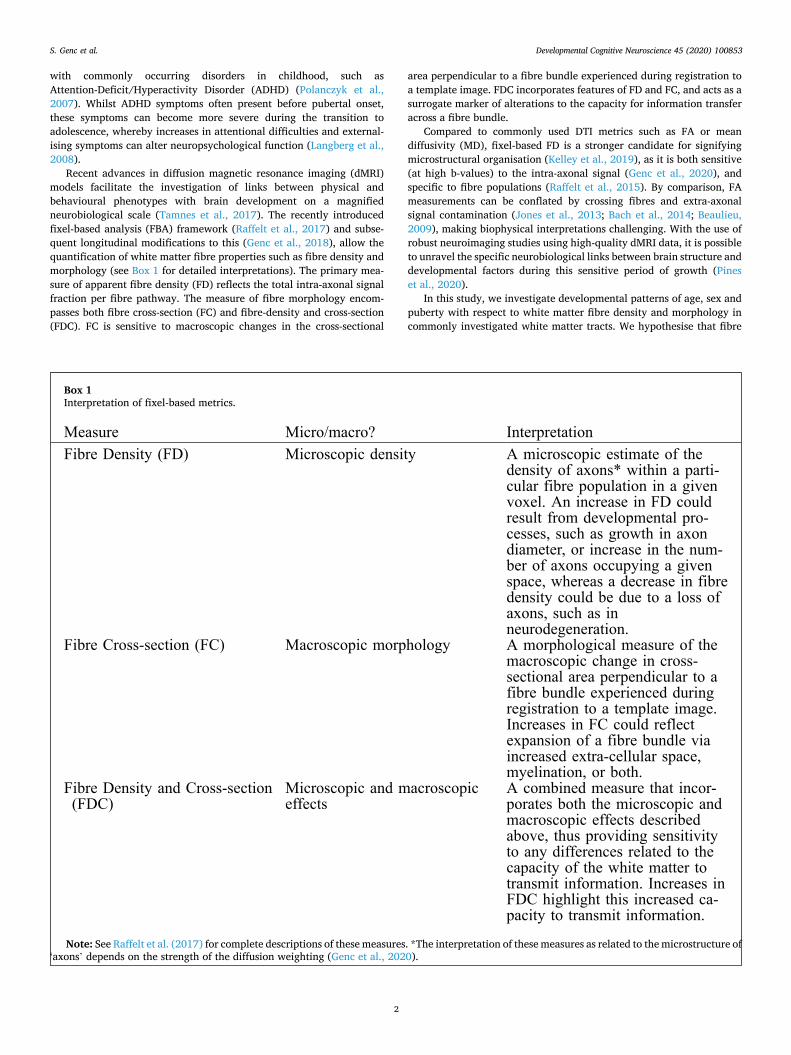
Recent advances in diffusion magnetic resonance imaging (dMRI) models facilitate the investigation of links between physical and behavioural phenotypes with brain development on a magniied neurobiological scale (Tamnes et al., 2017). The recently introduced ixel-based analysis (FBA) framework (Raffelt et al., 2017) and subse-quent longitudinal modiications to this (Genc et al., 2018), allow the quantiication of white matter ibre properties such as ibre density and morphology (see Box 1 for detailed interpretations). The primary mea-sure of apparent ibre density (FD) relects the total intra-axonal signal fraction per ibre pathway. The measure of ibre morphology encom-passes both ibre cross-section (FC) and ibre-density and cross-section (FDC). FC is sensitive to macroscopic changes in the cross-sectional
area perpendicular to a ibre bundle experienced during registration to a template image. FDC incorporates features of FD and FC, and acts as a surrogate marker of alterations to the capacity for information transfer across a ibre bundle.
Compared to commonly used DTI metrics such as FA or mean diffusivity (MD), ixel-based FD is a stronger candidate for signifying microstructural organisation (Kelley et al., 2019), as it is both sensitive (at high b-values) to the intra-axonal signal (Genc et al., 2020), and speciic to ibre populations (Raffelt et al., 2015). By comparison, FA measurements can be conlated by crossing ibres and extra-axonal signal contamination (Jones et al., 2013; Bach et al., 2014; Beaulieu, 2009), making biophysical interpretations challenging. With the use of robust neuroimaging studies using high-quality dMRI data, it is possible to unravel the speciic neurobiological links between brain structure and developmental factors during this sensitive period of growth (Pines et al., 2020).
In this study, we investigate developmental patterns of age, sex and puberty with respect to white matter ibre density and morphology in commonly investigated white matter tracts. We hypothesise that ibre
Box 1 Interpretation of ixel-based metrics.
Measure Micro/macro? Interpretation Fibre Density (FD) Microscopic density A microscopic estimate of the
density of axons* within a parti-cular fibre population in a given voxel. An increase in FD could result from developmental pro-cesses, such as growth in axon diameter, or increase in the num-ber of axons occupying a given space, whereas a decrease in fibre density could be due to a loss of axons, such as in neurodegeneration.
Fibre Cross-section (FC) Macroscopic morphology A morphological measure of the macroscopic change in cross- sectional area perpendicular to a fibre bundle experienced during registration to a template image. Increases in FC could reflect expansion of a fibre bundle via increased extra-cellular space, myelination, or both.
Fibre Density and Cross-section (FDC)
Microscopic and macroscopic effects
A combined measure that incor-porates both the microscopic and macroscopic effects described above, thus providing sensitivity to any differences related to the capacity of the white matter to transmit information. Increases in FDC highlight this increased ca-pacity to transmit information.
Note: See Raffelt et al. (2017) for complete descriptions of these measures. *The interpretation of these measures as related to the microstructure of ‘axons’ depends on the strength of the diffusion weighting (Genc et al., 2020).
S. Genc et al.

Developmental Cognitive Neuroscience 45 (2020) 100853
3
density and morphology follow the typical course of white matter development previously shown with DTI. We expect that advanced dMRI measures will provide iner insights into associations with sex and puberty development of micro- and macro-structure. We then evaluate whether the longitudinal change in ibre density is associated with the change in pubertal stage and age. In order to understand these complex associations, we combine a tract-based approach with mixed-effects modelling upon a cohort of children with and without attentional dificulties.
2. Methods
2.1. Participants
This study reports on a sample of children aged 9–13 years recruited as part of the Neuroimaging of the Children’s Attention Project study (NICAP; see Silk et al. (2016) for a detailed protocol). This longitudinal study was approved by The Royal Children’s Hospital Melbourne Human Research Ethics Committee (HREC #34,071). Briely, children were initially recruited at 7 years of age as part of the Children’s Attention Project (CAP) study (Sciberras et al., 2013) from 43 socio-economically diverse primary schools distributed across the Mel-bourne metropolitan area, Victoria, Australia. Children underwent comprehensive assessment for ADHD at age 7 via the Diagnostic Inter-view Schedule for Children (DISC-IV) completed with parents face-to-face. Children were categorised as either meeting a negative or positive diagnosis for ADHD. A subsample of children from the CAP study, which either met or did not meet criteria for ADHD, were invited to participate in the neuroimaging study NICAP at age 10 (Fig. S1).
At 10 years of age, children and their primary caregiver were invited for a 3.5 -h appointment at The Melbourne Children’s campus, which included a child assessment, parent questionnaire, mock scan, and MRI scan. Direct assessments and MRI scans were performed by a trained research assistant who was blind to the child’s diagnostic status. Chil-dren were invited for a follow-up appointment approximately 16 months following their initial visit (M = 16.14, SD = 2.37 months). Overall, only data from children imaged at both imaging time-points: time-point 1 (age: M = 10.4, SD = .44 years old) and time-point 2 (age: M = 11.7, SD = .51 years old), were included for analysis in the current study.
Written informed consent was obtained from the parent/guardian of all children enrolled in the study. Children were excluded from the study if they had a neurological disorder, intellectual disability, or serious medical condition (e.g. diabetes, kidney disease).
2.2. Measures
The following measures were obtained at both imaging time-points. General intellectual ability was estimated using the Wechsler Abbrevi-ated Scale of Intelligence (WASI) matrix reasoning sub-test (Wechsler, 1999). The Connors 3 ADHD Index (10-items) was administered via parent survey (Conners et al., 2011), in order to capture the variation in ADHD symptom severity across time-points. The Strengths and Difi-culties Questionnaire (SDQ) was administered in the form of a parent survey as a measure of emotional/behavioural dificulties (Goodman, 1997). Using the responses from this questionnaire, the scores derived from the peer problems and emotional problems scales were added to generate a combined internalising dificulties score, and the scores from the hyperactivity and conduct scales were added to generate a combined externalising dificulties score (Goodman et al., 2010). The Pubertal Development Scale questionnaire (PDS; Petersen et al. (1988) was administered to parents, and a total PDS score (PDSS) combining fea-tures of adrenarche and gonadarche was computed for each imaging time-point (PDSS; Shirtcliff et al. (2009)). Additional information on the psychometric properties of these measures are summarised in Supple-mentary Information.
Child height and weight were measured using the average of two
consecutive measurements to calculate a Body-Mass index (BMI) (kg/ m2). Socio-economic status (SES) was determined using the Socio- Economic Indexes for Areas (SEIFA), based on Australian Census data.
2.3. Image acquisition and pre-processing
Diffusion MRI data were acquired at two distinct time-points on a 3.0 T Siemens Tim Trio, at The Melbourne Children’s Campus, Parkville, Australia. Data were acquired using the following protocol: b = 2800s/ mm2, 60 directions, 4 volumes without diffusion weighting, 2.4 × 2.4 × 2.4 mm voxel size, echo-time / repetition time (TE/ TR) = 110/3200 ms, multi-band acceleration factor of 3, acquisition matrix = 110 × 100, bandwidth =1758 Hz. A total of 152 participants had longitudinal MRI data. Of those, 130 participants had useable diffusion MRI data, therefore the subsequent image processing and analysis was performed on these 130 participants with imaging data at two time-points (Fig. S1).
All dMRI data were processed using MRtrix3 (v3.0RC3; Tournier et al. (2019)) using pre-processing steps from a recommended ixel-based analysis (FBA) pipeline (Raffelt et al., 2017). For each scan, these pre-processing steps were: denoising (Veraart et al., 2016); eddy, motion, and susceptibility induced distortion correction (Andersson and Sotiropoulos, 2016); bias ield correction (Tustison et al., 2010); and group-wise intensity normalisation. Data were then upsampled by a factor of 2, and a ibre-orientation distribution (FOD) was estimated in each voxel. Total intra-cranial volume for each T1-weighted image at each time-point was calculated using FreeSurfer (version 6) (Reuter et al., 2012). Images were visually inspected for motion artefact (assessed by the presence of Venetian blinding artefact), and whole datasets were excluded if excessive motion was present. In addition, we calculated mean frame-wise displacement using the FSL software library (v5.0.10) (Smith et al., 2004).
2.4. Longitudinal template generation
In order to build an unbiased longitudinal template, we selected 40 individuals, with equal numbers of males and females, to irst generate intra- subject templates. For each of these individuals, the time-point 1 and time-point 2 FOD maps were transformed to their midway space and subsequently averaged to generate an unbiased intra-subject template. The 40 intra-subject FOD templates were used as input for the popula-tion template generation step.
Following generation of the population template, each individual’s FOD image was registered to this longitudinal template (Raffelt et al., 2011), and the resulting transformed FOD within each template space voxel segmented to produce a set of discrete ixels. Reorientation of ixel directions due to spatial transformation, correspondence of these ixels with the template image, and derivation of FBA metrics, was performed as described previously (Genc et al., 2018). The output metrics ibre density (FD), ibre cross-section (FC), and ibre density and cross-section (FDC) (in template space) were then subjected to further statistical analysis.
2.5. Tractography
We chose to delineate 7 key bilateral white matter ibre pathways, alongside 3 commissural bundles, which make up the John’s Hopkins University (JHU) white matter tractography atlas available in FSL. These pathways were delineated to segment ixels from the whole-brain ixel template which corresponded with our tracts of interest. To aid in the spatial identiication of speciic ibre bundles, we used a three-step process to improve speciicity (Fig. 1), summarised as follows:
• Atlas registration: The FA image derived from the JHU-ICBM atlas (Smith et al., 2004) was non-linearly transformed to our population
S. Genc et al.

Developmental Cognitive Neuroscience 45 (2020) 100853
4
template, and the resulting transformations were applied to warp the JHU tractography atlas to population template space.
• Whole-brain tractogram overlay: The whole-brain population-based tractogram was visualised in order to identify speciic bundles. This tractogram was visualised as colour-coded directions, to further enable the identiication of speciic bundles (i.e. corticospinal tract runs inferior to superior, therefore is coloured blue).
• Region of interest (ROI) selection: We used a protocol deined in Wakana et al. (2007) to aid in the placement of inclusion ROIs for each major ibre bundle. We placed two separate inclusion ROIs in regions identiied in the protocol, making sure they overlapped the JHU tractography atlas and whole brain tractogram. For bilateral tracts, the opposite hemisphere was used as an exclusion ROI. The whole brain tractography map was then edited using tckedit, and visualised, to check the anatomical correctness of the tract. In cases where spurious streamlines were present, these were rerun with an additional manually drawn exclusion ROI.
The subsequently generated 17 white matter tracts (Fig. S2), also referred to as regions, were then converted to ixel maps using the whole-brain ixel template (tck2ixel), and binarised for statistical sam-pling of output maps (mrthreshold). For each participant at each time- point, we calculated mean FD, FC, and FDC values in each of the ixel masks derived from the 17 white matter tracts for subsequent statistical analyses. An example of these steps for one representative white matter tract can be visualised in Fig. 1.
2.6. Statistical analyses
All statistical analyses were performed within R (version 3.4.3). Data visualisation was performed using ggplot2 (Wickham, 2016) and rain-cloud tools in R (van Langen, 2020; M et al., 2019). To investigate developmental patterns of FBA metrics across the 17 tracts, we applied linear mixed effects modelling using lme4 (Bates et al., 2015), a method which allows for hierarchical structures observed in longitudinal data.
The irst aim was to describe normative development of white matter
ibre properties with respect to age, sex, and pubertal stage (main ef-fects). We built a linear model which included age (linear term) and sex (female as the reference group). For each white matter tract, we compared the it of this standard model with subsequent models including pubertal stage as a ixed term, and interaction terms including age by pubertal stage, sex by pubertal stage, and age by sex. Level 1 : Yij = β0j + β1jAgeij + β2jSexij + ∈ij
Level 2 : β0j = γ00 + u0(1)
In which Yij represents the ibre density in each white matter tract at the i’th time-point for the j’th individual. As age is mean centered, the ixed intercept γ00 represents the mean ibre density at the mean age of the sample.
The second aim was to assess whether the longitudinal change in white matter ibre properties was associated with the change in pubertal stage, over the two time-points. To do this, we set up a simple linear model with FD at time-point 1, age at time-point 1 (linear term), sex (female as the reference group) and the change in pubertal stage. The difference in age between time-points and pubertal stage at time-point 1 were entered as covariates. For each white matter tract, we compared the it of this standard model with subsequent models including the change in pubertal stage by sex and the change in pubertal stage by age as interaction terms. Table S1 summarises the formulae for each mixed- effects model tested. ΔY = β1FDt1 + β2Aget1 + β3Sex + β4ΔPDSS
+ β5ΔAge + β6PDSSt1 + ϵ (2) In which ΔY represents the change in ibre density in each white
matter tract, FD is the ibre density and t1 represents time-point 1. Finally, we performed an exploratory analysis of the impact of
symptom severity on white matter ibre properties (main effects). Our sample was originally selected by dichotomising groups based on ADHD symptom severity. However, rather than dichotomising groups at the extreme ends of mental health and attentional dificulties, we aimed to perform a dimensional analysis to shed light on whether continuous
Fig. 1. Protocol for deining ixels overlapping tracts of interest. Example shown is for a single ROI to delineate the left corticospinal tract.
S. Genc et al.

Developmental Cognitive Neuroscience 45 (2020) 100853
5
patterns of behavioural phenotypes relate to white matter ibre prop-erties. We built a linear model (as per model 1) which included age (linear term), sex (female as the reference group) and symptom severity.
For each aim tested, we itted separate models for each white matter metric (FD, FC, FDC) in each white matter tract and describe the best itting model in the results section. The most parsimonious model was selected based on lowest Akaike Information Criterion (AIC) values. We computed bootstrapped 95 % conidence intervals (n = 5000 simula-tions) and report these for each model coeficient as β [95 % CI]. Evi-dence for an association is represented when conidence intervals do not cross zero. We additionally report p-values, adjusted using False Dis-covery Rate (FDR) correction (pFDR; Benjamini and Hochberg (1995)).
3. Results
3.1. Participant characteristics
Differences in participant characteristics over the 16-month follow- up period are reported in Table 1 and visualised in Fig. 2. We observed developmental increases in physical characteristics such as BMI and PDSS (p < .001), and in WASI matrix reasoning raw score (p < .001). Behaviourally, we observed an increase in internalising symptoms (p < .001) but no change in externalising symptoms (p > .05) assessed by the SDQ. There was some evidence for a decrease in ADHD symptoms over time (p = .04).
We assessed whether there was evidence for regional differences in age-related patterns of white matter microstructure (Fig. 3), and asso-ciations between our phenotypic variables of interest. We observed a signiicant region by age interaction, suggesting that region-speciic age- related patterns exist. To investigate these region-speciic relationships, we computed multiple linear mixed-effects models for each white matter tract. Results from the mixed-effects modelling analysis are presented for each predictor (Table 2; Fig. 3).
3.2. Main effects of age, sex, and pubertal stage
Age related increases in ibre density (FD) over time were localised to the bilateral cingulum cingulate gyrus, bilateral corticospinal tract, forceps major and minor and bilateral superior longitudinal fasciculus. Signiicant increases in ibre cross-section (FC) were observed in the bilateral cingulum cingulate gyrus, bilateral corticospinal tract, forceps major, fornix, bilateral inferior fronto-occipito fasciculus, and bilateral superior longitudinal fasciculus. Increases in ibre density and cross- section (FDC) were observed in the bilateral cingulum cingulate gyrus, bilateral corticospinal tract, forceps major and minor, fornix, bilateral inferior fronto-occipito fasciculus and bilateral superior longitudinal fasciculus. All regions listed signiicantly increased in ibre density and morphology over time, and no regions decreased. The longitudinal changes in common ibre pathways changing over time are visualised in
Fig. 4. We observed no signiicant sex differences in ibre density across any
of the regions studied. For the morphological analyses, females had higher FDC than males in the forceps minor, β [95 % CI] = −.46 [−.79, −.13].
We observed a positive relationship between pubertal stage and ibre properties in the right superior longitudinal fasciculus for FD, β [95 % CI] = .12 [.03, .21], FC, β [95 % CI] = .14 [.06, .23], and FDC, β [95 % CI] = .16 [.07, .24], and for the right inferior longitudinal fasciculus for FC, β [95 % CI] = .19 [.08, .30], and FDC, β [95 % CI] = .18 [.07, .30]. These indings are summarised in Fig. 5.
Total intra-cranial volume (TIV) was a signiicant predictor of FC over all of the white matter tracts studied and FDC for all regions apart from the left cingulum hippocampus.
3.3. Longitudinal change in pubertal stage
We observed no main effect of the change in pubertal stage and the change in white matter microstructure. We observed an interaction between the change in pubertal stage and age at time-point 1, with the longitudinal change in ibre density over time for: the left corticospinal tract, β [95 % CI] = .19 [.04, .35], left inferior fronto-occipital fascic-ulus, β [95 % CI] = .25 [.07, .42], left inferior longitudinal fasciculus, β
[95 % CI] = .19 [.01, .37], and the left uncinate fasciculus, β [95 % CI] = .24 [.06, .42]. For these regions, a larger change in PDSS score combined with older age resulted in a larger increase in ibre density.
3.4. Main effects of symptom severity and impact of motion
The results of the exploratory analysis between symptom severity and white matter microstructure are summarised in Table S3. We observed no signiicant association between ADHD symptom severity and white matter ibre density, across the 17 tracts studied.
All analyses were rerun with frame-wise displacement included to mitigate any impact of motion on our indings, particularly given the nature of the sample and potential for greater motion artefact in children with attention/hyperactivity phenotypes. The results for the linear mixed-effects models remained unchanged (Tables S2, S3), and we observed no main effect of motion on the models tested for ibre density in each tract. We did observe an effect of motion on the morphological measures (FC and FDC) for some tracts, suggesting that motion artefact can inluence the computation of morphological measures, however, this had no bearing on the inal results.
4. Discussion
In our longitudinal diffusion MRI study of 130 children aged 9-13 years across two time-points, we identify regional patterns of white matter ibre density and morphology related to age, sex and pubertal
Table 1 Change in participant characteristics over the follow-up interval.
Variable Time-point 1 M(SD)
Time-point 2 M(SD)
Difference
Female Male Female Male p-value Age, years 10.36 (.40) 10.39 (0.46) 11.67 (.44) 11.75 (.55) < .001 Socio-economic status (SES) 1007 (46) 1022 (44) 1007 (46) 1021 (44) .32 Body Mass Index, kg/m2 20 (3.5) 19 (3.8) 21 (4.0) 20 (4.3) < .001 Pubertal stage, PDSS 2.0 (.9) 1.2 (.4) 3 (.9) 1.5 (.7) < .001 SDQ internalising 4.8 (4) 4.5 (4) 8.1 (4) 7.4 (3) < .001 SDQ externalising 5.7 (5) 7.7 (5) 5.1 (4) 7.4 (5) .19 ADHD symptoms 3.8 (6) 7.5 (7) 3.3 (5) 6.9 (7) .04 Matrix reasoning, raw score 22 (4.7) 23 (4.9) 24 (3.4) 25(4.6) < .001
Difference in participant characteristics between all participants across distinct time-points was calculated using a paired samples t-test. Data are further grouped by sex: N(females) = 47; N(males) = 83. M = mean, SD = standard deviation.
S. Genc et al.

Developmental Cognitive Neuroscience 45 (2020) 100853
6
development. These indings open up new avenues for investigating the interaction between white matter ibre properties and developmental factors, to unravel multiple contributions to altered neuro-developmental pathways.
4.1. Main effects of age and sex
We observed age-related development of ibre density in the bilateral cingulum cingulate gyrus, bilateral corticospinal tract, forceps major and minor and bilateral superior longitudinal fasciculus. Similar pat-terns were observed for ibre cross-section and ibre density and cross- section. The region-speciic development we observed is consistent with indings from many diffusion tensor imaging studies (see Tamnes et al. (2018) for a full review) and ixel-based analyses (Genc et al., 2018) in typically developing children of this age range. This may sug-gest that regional ibre development is consistent in this age range (9–13 years), regardless of variations due to pubertal stage. Regions such as the bilateral cingulum hippocampus, inferior longitudinal fasciculus, and uncinate fasciculus may have delayed maturation, completing matura-tion closer to the completion of adolescence and early adulthood (Lebel and Beaulieu, 2011).
In terms of sex differences in microstructure, a number of longitu-dinal developmental studies have also reported no sex differences in white matter development using DTI (Brouwer et al., 2012; Krogsrud et al., 2016; Lebel and Beaulieu, 2011; Tamnes et al., 2010), consistent with our indings. However, some studies of older samples studies have shown that boys have higher FA than girls in a number of associative white matter pathways (Seunarine et al., 2016; Schmithorst et al., 2008; Herting et al., 2012). Given our analyses are focused on data acquired at high diffusion weightings sensitised to the intra-axonal signal, discrep-ancies in indings could be due to differences in the sensitivity of MRI acquisition and modelling parameters to various neurobiological prop-erties, for example myelin content and extracellular properties.
The sex differences in ibre morphology observed in the forceps minor suggest that females have greater capacity for information transfer across this white matter tract. These differences could plausibly be a signature of anatomical sex differences between males and females,
potentially induced by early perinatal exposure to testosterone (Sisk and Foster, 2004). Neuroimaging studies have shown that testosterone and oestradiol impact brain volume across adolescence (Herting et al., 2014). Additionally (or alternatively) these differences could be perpetuated by the onset of pubertal processes and rising hormone levels in females, compared with males, as females generally begin puberty 1–2 years earlier than males (Dorn et al., 2006). Oestrogen receptors exist on oligodendrocytes, which may provide an avenue for myelin production (Zhang et al., 2004). Whilst we have not directly studied myelination in this study, this may be one explanation for the sex dif-ferences in ibre morphology observed in anterior and posterior callosal tracts.
4.2. Main effects of pubertal stage
A positive association between pubertal stage and ibre density, ibre cross-section and ibre density and cross-section was observed in the right superior longitudinal fasciculus. This suggests a linear relationship between pubertal development and ibre maturation, likely driven by the expansion of ibre bundles by virtue of axonal growth and myeli-nation. The superior longitudinal fasciculus is a white matter ibre most associated with language ability, semantic memory, and executive function, in developmental and adult populations. It anatomically con-nects two regions important for language - Broca’s and Wernicke’s area, and the relationship between language ability and microstructure in the SLF has been extensively reported (Catani et al., 2005). Similarly, we observed that ibre morphology of the right inferior longitudinal fasciculus exhibited a positive relationship with pubertal stage.
The pubertal period involves regulation and remodelling of white matter (Herting et al., 2017, 2012) with rising adrenal and gonadal (Maninger et al., 2009; Perrin et al., 2008; Pesaresi et al., 2015; Pan-gelinan et al., 2016) hormones. Previous studies have shown puberty-related increases in FA in the right insular gyrus with physical development (Herting et al., 2012) and decreases in MD in the superior and inferior longitudinal fasciculi (Menzies et al., 2015). This is consistent with our indings of a positive relationship between pubertal stage and ibre density and morphology in the right SLF, and ibre
Fig. 2. Change in participant characteristics over the 16-month follow-up period. Longitudinal data points are connected by a line.
S. Genc et al.

Developmental Cognitive Neuroscience 45 (2020) 100853
7
morphology in the right ILF. MD is sensitive to isotropic diffusion in the extracellular space, therefore any increases in intra-axonal signal frac-tion (proportional to our measure of ibre density) can be relected by decreases in MD, assuming myelin thickness does not change considerably.
A recent longitudinal study of non-human primate (marmoset) brain
development investigated grey matter and white matter changes over 3–7 time-points across the pre-pubertal, pubertal, and post-pubertal periods (Sawiak et al., 2018). Their results showed that the most dynamically developing white matter tracts in the early-pubertal period are the splenium of the corpus callosum, and ILF. These results are in line with our previous cross-sectional results, whereby ibre density
Fig. 3. Relationships between participant characteristics and ibre microstructure across all white matter tracts. 95 % conidence intervals which do not cross zero suggest a relationship between a predictor and FBA metric.
S. Genc et al.

Developmental Cognitive Neuroscience 45 (2020) 100853
8
appears to be increasing in the splenium in response to pubertal onset (Genc et al., 2017), and with the current results as we observed increasing ibre morphology in the right ILF with pubertal stage. During the pubertal period, regions experiencing most marked white matter tract thickening were localised to the SLF (Sawiak et al., 2018), consistent with evidence that the SLF does not reach full maturation until the post-pubertal stage (Ladouceur et al., 2012). Overall, we have replicable evidence that the splenium of the corpus callosum and right inferior longitudinal fasciculus are sensitive to pubertal timing, and the right superior longitudinal fasciculus is sensitive to pubertal stage. These indings additionally highlight the sensitivity of advanced microstruc-tural metrics such as ibre density and morphology, as they appear to be sensitive to region-speciic white matter changes mediated by pubertal
stage.
4.3. Longitudinal change in pubertal stage
We observed that relatively older children with a larger change in PDSS score experienced larger increases in ibre density in the left cor-ticospinal tract, left inferior fronto-occipital fasciculus, left inferior longitudinal fasciculus, and left uncinate fasciculus over the 16-month follow-up period. This may suggest that these left-lateralised associa-tion tracts (e.g. IFOF, ILF, UF) with known protracted development in late adolescence (Von Der Heide et al., 2013) are developing at a later age, or ‘catching up’, in older children with greater increases in pubertal stage. As this association was not predicted apriori, replication of these
Table 2 Relationship between white matter microstructure with age, sex, and pubertal stage.
Metric Region Model AIC Age Sex Pubertal stage β (95 % CI) pFDR β (95 % CI) pFDR β (95 % CI) pFDR
FD CCG L 3 487.93 .13 [.08, .19] < .001 .06 [−.31, .42] .86 .05 [−.05, .14] .54 R 3 474.70 .10 [.04, .15] .002 .10 [−.26, .46] .75 .05 [−.04, .14] .50
CCH L 3 603.95 −.02 [−.10, .07] .85 −.27 [−.64, .12] .32 −.15 [−.29, −.01] .11 R 5 614.16 −.04 [−.13, .05] .54 −.23 [−.63, .14] .43 −.01 [−.17, .16] .97
CST L 3 596.69 .11 [.03, .20] .04 −.41 [−.78, −.03] .10 −.06 [−.20, .08] .57 R 3 549.74 .11 [.04, .18] .02 −.41 [−.77, −.05] .09 −.02 [−.14, .11] .89
Fmajor 1 428.71 .21 [.17, .24] < .001 −.21 [−.55, .14] .44 –
Fminor 5 580.63 .16 [.08, .24] .002 −.15 [−.53, .23] .62 .01 [−.14, .16] .91 FX 3 500.20 .06 [.01, .12] .10 −.17 [−.54, .19] .54 −.04 [−.13, .06] .62 IFOF L 3 564.38 .09 [.02, .17] .05 −.13 [−.51, .24] .67 .02 [−.10, .14] .86
R 3 566.07 .10 [.02, .17] .06 −.32 [−.69, .04] .20 .09 [−.04, .21] .37 ILF L 3 564.88 .08 [.01, .15] .10 −.14 [−.52, .24] .63 .01 [−.12, .13] .98
R 5 542.20 .05 [−.02, .12] .32 .10 [−.29, .48] .77 .12 [−.01, .25] .18 SLF L 3 449.63 .13 [.08, .17] < .001 −.07 [−.44, .30] .82 .01 [−.08, .08] .95
R 3 459.20 .10 [.06, .15] < .001 .04 [−.34, .40] .90 .12 [.03, .20] .03 UF L 3 608.60 .05 [−.04, .14] .51 .06 [−.30, .44] .86 .04 [−.11, .18] .77
R 4 599.97 .01 [−.08, .09] .96 −.06 [−.42, .32] .86 −.05 [−.20, .11] .72 FC CCG L 1 328.39 .11 [.08, .13] < .001 .11 [−.20, .43] .64 –
R 1 334.71 .10 [.08, .13] < .001 .22 [−.11, .55] .39 –
CCH L 3 525.04 −.03 [−.10, .03] .54 .28 [−.08, .65] .30 .07 [−.04, .19] .44 R 3 491.79 .01 [−.05, .07] .87 .04 [−.33, .41] .91 .04 [−.06, .14] .62
CST L 3 358.03 .19 [.15, .23] < .001 −.34 [−.66, −.01] .12 −.03 [−.10, .04] .54 R 3 334.06 .19 [.15, .23] < .001 −.29 [−.59, .04] .19 .03 [−.03, .10] .52
Fmajor 3 301.22 .12 [.09, .15] < .001 −.38 [−.73, −.05] .11 .01 [−.04, .06] .87 Fminor 5 327.30 −.01 [−.05, .03] .78 −.30 [−.64, .05] .20 .02 [−.05, .09] .78 FX 1 374.13 .07 [.03, .10] < .001 .21 [−.10, .52] .39 –
IFOF L 1 390.58 .08 [.04, .12] < .001 −.15 [−.43, .14] .53 –
R 5 357.94 .06 [.02, .11] .04 −.07 [−.36, .23] .78 .06 [−.03, .15] .41 ILF L 3 493.81 .03 [−.04, .10] .54 .16 [−.18, .51] .54 .12 [.01, .23] .10
R 5 429.17 .04 [−.02, .10] .43 .15 [−.15, .46] .54 .19 [.08, .30] .006 SLF L 5 442.67 .11 [.06, .16] < .001 .12 [−.19, .52] .54 .16 [.01, .22] .10
R 3 428.74 .14 [.09, .19] < .001 .22 [−.11, .57] .41 .14 [.06, .23] .009 UF L 1 445.80 .06 [.02, .10] .03 .34 [.02, .66] .11 –
R 3 431.13 .05 [−.01, .11] .16 .07 [−.26, .40] .81 .01 [−.09, .10] .97 FDC CCG L 1 427.43 .14 [.11, .18] < .001 −.01 [−.37, .35] .99 –
R 3 437.83 .12 [.07, .17] < .001 .16 [−.22, .53] .56 .05 [−.04, .13] .49 CCH L 3 604.84 −.03 [−.12, .05] .62 −.08 [−.50, .33] .84 −.09 [−.23, .05] .43
R 3 582.06 −.01 [−.08, .08] .99 −.29 [−.71, .12] .32 −.06 [−.19, .08] .55 CST L 3 490.99 .19 [.13, .25] < .001 −.43 [−.79, −.05] .09 −.05 [−.16, .05] .54
R 3 468.85 .18 [.13, .24] < .001 −.40 [−.77, −.04] .10 .01 [−.08, .11] .90 Fmajor 1 338.21 .19 [.17, .21] < .001 −.31 [−.69, .08] .26 –
Fminor 5 384.20 .07 [.03, .12] .01 ¡.46 [−.79, −.13] .03 −.01 [−.09, .09] .99 FX 3 482.25 .09 [.03, .14] .02 −.08 [−.47, .31] .82 −.01 [−.11, .09] .91 IFOF L 3 505.27 .10 [.04, .17] .02 −.18 [−.54, .19] .54 .03 [−.09, .14] .78
R 3 489.83 .10 [.04, .17] .01 −.30 [−.65, .06] .23 .05 [−.06, .16] .54 ILF L 3 536.65 .07 [−.01, .14] .16 −.09 [−.48, .28] .78 .07 [−.06, .19] .49
R 5 476.66 .05 [−.01, .11] .26 .01 [−.36, .36] .97 .18 [.07, .30] .02 SLF L 3 432.95 .14 [.09, .18] < .001 .04 [−.34, .40] .91 .06 [−.02, .14] .32
R 3 451.14 .14 [.09, .19] < .001 .19 [−.20, .57] .54 .16 [.07, .24] .003 UF L 3 540.59 .07 [−.01, .14] .19 .17 [−.21, .55] .55 .02 [−.10, .14] .84
R 3 515.73 .04 [−.03, .11] .49 −.17 [−.52, .19] .54 .02 [−.10, .13] .88 Note: Best model it was determined using the lowest AIC for all models tested within each region (see Table S1 for full model details). Total intracranial volume (TIV) was entered as a covariate for morphological measures (FC, FDC). Abbreviations: CCG = cingulum cingulate gyrus; CCH = cingulum hippocampus; CST = Cortico- spinal tract; FA = Fractional anisotropy; FC = Fibre cross-section; FD = Fibre density; Fmajor = Forceps major; Fminor = Forceps minor; FX = fornix; L = Left; IFOF = inferior fronto-occipital fasciculus; ILF = inferior longitudinal fasciculus; R =Right; SLF = Superior longitudinal fasciculus; UF = uncinate fasciculus. P-values were adjusted for false-discovery rate (pFDR), where bold values denote pFDR < .05.
S. Genc et al.

Developmental Cognitive Neuroscience 45 (2020) 100853
9
indings is required to ensure the stability of these associations. In a similar aged sample, Ho et al. (2020) revealed that the longi-
tudinal change in testosterone levels in females was related to FA change in the corpus callosum, cingulum cingulate gyrus, and corticospinal tract. Although we did not observe any discernible relationship between the change in ibre density and change in pubertal stage (or sex in-teractions), differences in analysis approaches (DTI vs. ixel-based metrics) or pubertal staging methods (hormone sampling vs. PDS
questionnaire) may reconcile differences between results. Future work should combine ixel-based metrics derived from high b-values with improved pubertal phenotyping to demonstrate replicable evidence of tract-speciic microstructural development with respect to puberty.
4.4. Relationship with brain volume
Fibre cross-section is inherently a morphological measure of the
Fig. 4. Longitudinal change in white matter ibre properties for regions with signiicant age-related increases over time. Blue = boys, Red = girls (For interpretation of the references to colour in this igure legend, the reader is referred to the web version of this article).
S. Genc et al.

Developmental Cognitive Neuroscience 45 (2020) 100853
10
macroscopic change in cross-sectional area perpendicular to a ibre bundle experienced during registration to a template image (Raffelt et al., 2017). This inding is of special interest to users of the ixel-based analysis framework and derived metrics, as any variable associated with total intracranial volume can potentially conlate interpretations on changes in ibre cross-section (Smith et al., 2019). For example, it is known that on average (for a given age), males have greater intracranial volume than females. Without adjusting for this confound in analyses of ibre cross-section, sex differences could be attributed to biologically relevant differences, when in fact the differences may purely due to large-scale anatomical differences in head size (Luders et al., 2014). Similar patterns were observed in the analyses of ibre density and cross-section, given that this metric is calculated from ibre cross-section. Therefore, the main message of these results, are that these metrics must be interpreted with caution, and that analyses involving morphological measures should be adjusted appropriately for intracranial volume.
4.5. Limitations and future directions
Our measures of symptom severity may be biased as our sample inherently includes children which have either met or not met criteria for ADHD three years prior to neuroimaging. Although our community- based sample captures a wide range of symptom severity for attentional dificulties, our sample is not randomly selected and potentially biased we may be missing out on high-risk children which it ‘in-between’ these two ends of the spectrum of symptom severity. Whilst we did not observe a signiicant relationship between ADHD symptom severity and white matter ibre density (Table S3), future studies should perform larger population-level analyses to account for a wider dimensional range in attentional dificulties.
Our approach studied separate white matter pathways to determine the best itting model for each region. Whilst useful for ensuring each region is studied with the appropriate predictors, the problem of mul-tiple comparisons can inluence the interpretability of results. Dimen-sionality reduction methods such as principal components analysis (Chamberland et al., 2019; Geeraert et al., 2020) or canonical correla-tion analysis (Ball et al., 2018) has proven useful in these scenarios, in
order to capture components of microstructural attributes which vary together over development.
Finally, we have attempted to mitigate for motion artefact with the use of frame-wise displacement as a covariate, which did not appear to inluence the main results. However, robust measures such as temporal signal-to-noise ratio (TSNR) may be more appropriate descriptors of motion artefact (Roalf et al., 2016).
4.6. Conclusion
We summarise our longitudinal indings with four important con-clusions: (1) white matter development over the ages of 9–13 years in-volves dynamic increases in ibre density and morphology in a large range of developmentally-sensitive pathways, (2) pubertal stage is positively associated with ibre density and morphology in the right superior longitudinal fasciculus and ibre morphology in the right inferior fronto-occipital fasciculus, (3) intra-cranial volume is highly predictive of ibre morphology and should be modelled appropriately, and (4) the longitudinal change in ibre density is associated with the change in pubertal stage in relatively older children. These results shed light on key white matter ibre-speciic properties with age, sex and pubertal development across childhood and adolescence.
Declaration of Competing Interest
All authors declare no real or potential conlicts of interest.
Acknowledgements
Data used in the preparation of this article were obtained from the NICAP study (National Health and Medical Research Council (NHMRC); project grant #1065895). The research and analyses were conducted within the Developmental Imaging research group, Murdoch Children’s Research Institute, supported by the Victorian Government’s Opera-tional Infrastructure Support Program, and The Royal Children’s Hos-pital Foundation devoted to raising funds for research at The Royal Children’s Hospital. SG was supported by an Australian Government Research Training Program (RTP) scholarship. ES was supported by an
Fig. 5. Marginal effects plots of FBA metrics for sex and pubertal stage.
S. Genc et al.

Developmental Cognitive Neuroscience 45 (2020) 100853
11
NHMRC Career Development Award (1110688). We extend our gratitude to the families that have participated for a
number of years in this longitudinal study. We thank Michael Kean and The Royal Children’s Hospital Medical Imaging staff for their assistance and expertise in the collection of the MRI data included in this study.
Appendix A. Supplementary data
Supplementary material related to this article can be found, in the online version, at doi:https://doi.org/10.1016/j.dcn.2020.100853.
References Andersson, J.L.R., Sotiropoulos, S.N., 2016. An integrated approach to correction for off-
resonance effects and subject movement in diffusion MR imaging. Neuroimage 125, 1063–1078. https://doi.org/10.1016/j.neuroimage.2015.10.019.
Bach, M., Laun, F.B., Leemans, A., Tax, C.M., Biessels, G.J., Stieltjes, B., Maier-Hein, K.H., 2014. Methodological considerations on tract-based spatial statistics (TBSS). Neuroimage 100, 358–369. https://doi.org/10.1016/j.neuroimage.2014.06.021.
Ball, G., Malpas, C.B., Genc, S., Efron, D., Sciberras, E., Anderson, V., Nicholson, J.M., Silk, T.J., 2018. Multimodal structural neuroimaging markers of brain development and ADHD symptoms. Am. J. Psychiatry 0 (0). https://doi.org/10.1176/appi. ajp.2018.18010034 appiajp201818010034.
Bates, D., Machler, M., Bolker, B., Walker, S., 2015. Fitting linear mixed-effects models using lme4. J. Stat. Softw. 1 (1) https://doi.org/10.18637/jss.v067.i01 (2015).
Beaulieu, C., 2009. The biological basis of diffusion anisotropy. Diffusion Mri: From Quantitative Measurement to in Vivo Neuroanatomy, pp. 105–126. https://doi.org/ 10.1016/B978-0-12-374709-9.00006-7.
Benjamini, Y., Hochberg, Y., 1995. Controlling the false discovery rate: a practical and powerful approach to multiple testing. J. R. Stat. Soc. Ser. B 57 (1), 289–300.
Brouwer, R.M., Mandl, R.C., Schnack, H.G., van Soelen, I.L., van Baal, G.C., Peper, J.S., Kahn, R.S., Boomsma, D.I., Hulshoff Pol, H.E., 2012. White matter development in early puberty: a longitudinal volumetric and diffusion tensor imaging twin study. PLoS One 7 (4), e32316.
Catani, M., Jones, D.K., ffytche, D.H., 2005. Perisylvian language networks of the human brain. Ann. Neurol. 57 (1), 8–16. https://doi.org/10.1002/ana.20319.
Chamberland, M., Raven, E.P., Genc, S., Duffy, K., Descoteaux, M., Parker, G.D., Tax, C. M.W., Jones, D.K., 2019. Dimensionality reduction of diffusion MRI measures for improved tractometry of the human brain. Neuroimage 200, 89–100. https://doi. org/10.1016/j.neuroimage.2019.06.020.
Conners, C.K., Pitkanen, J., Rzepa, S.R., 2011. Conners 3rd edition (Conners 3; Conners 2008). In: Kreutzer, J.S., DeLuca, J., Caplan, B. (Eds.), Encyclopedia of Clinical Neuropsychology. Springer New York, New York, NY, pp. 675–678. https://doi.org/ 10.1007/978-0-387-79948-3_1534.
Dorn, L.D., Dahl, R.E., Woodward, H.R., Biro, F., 2006. Deining the boundaries of early adolescence: a user’s guide to assessing pubertal status and pubertal timing in research with adolescents. Appl. Dev. Sci. 10 (1), 30–56. https://doi.org/10.1207/ s1532480xads1001_3.
Genc, S., Seal, M.L., Dhollander, T., Malpas, C.B., Hazell, P., Silk, T.J., 2017. White matter alterations at pubertal onset. Neuroimage 156, 286–292. https://doi.org/ 10.1016/j.neuroimage.2017.05.017.
Genc, S., Smith, R.E., Malpas, C.B., Anderson, V., Nicholson, J.M., Efron, D., Sciberras, E., Seal, M.L., Silk, T.J., 2018. Development of white matter ibre density and morphology over childhood: a longitudinal ixel-based analysis. Neuroimage 183, 666–676. https://doi.org/10.1016/j.neuroimage.2018.08.043.
Genc, S., Tax, C.M.W., Raven, E.P., Chamberland, M., Parker, G.D., Jones, D.K., 2020. Impact of b-value on estimates of apparent ibre density. Hum. Brain Mapp. https:// doi.org/10.1002/hbm.24964, 2020.2001.2015.905802.
Geeraert, B.L., Chamberland, M., Lebel, R.M., Lebel, C., 2020. Multimodal principal component analysis to identify major features of white matter structure and links to reading. PLOS ONE 15 (8), e0233244.
Goodman, R., 1997. The strengths and dificulties questionnaire: a research note. J. Child Psychol. Psychiatry 38 (5), 581–586. https://doi.org/10.1111/j.1469-7610.1997. tb01545.x.
Goodman, A., Lamping, D.L., Ploubidis, G.B., 2010. When to use broader internalising and externalising subscales instead of the hypothesised ive subscales on the Strengths and Dificulties Questionnaire (SDQ): data from British parents, teachers and children. J. Abnorm. Child Psychol. 38 (8), 1179–1191. https://doi.org/ 10.1007/s10802-010-9434-x.
Herting, M.M., Maxwell, E.C., Irvine, C., Nagel, B.J., 2012. The impact of sex, puberty, and hormones on white matter microstructure in adolescents. Cereb. Cortex 22 (9), 1979–1992. https://doi.org/10.1093/cercor/bhr246.
Herting, M.M., Gautam, P., Spielberg, J.M., Kan, E., Dahl, R.E., Sowell, E.R., 2014. The role of testosterone and estradiol in brain volume changes across adolescence: a longitudinal structural MRI study. Hum. Brain Mapp. 35 (11), 5633–5645. https:// doi.org/10.1002/hbm.22575.
Herting, M.M., Kim, R., Uban, K.A., Kan, E., Binley, A., Sowell, E.R., 2017. Longitudinal changes in pubertal maturation and white matter microstructure. Psychoneuroendocrinology 81, 70–79. https://doi.org/10.1016/j. psyneuen.2017.03.017.
Ho, T.C., Colich, N.L., Sisk, L.M., Oskirko, K., Jo, B., Gotlib, I.H., 2020. Sex differences in the effects of gonadal hormones on white matter microstructure development in
adolescence. Dev. Cogn. Neurosci. 42, 100773 https://doi.org/10.1016/j. dcn.2020.100773.
Jones, D.K., Knosche, T.R., Turner, R., 2013. White matter integrity, iber count, and other fallacies: the do’s and don’ts of diffusion MRI. Neuroimage 73, 239–254. https://doi.org/10.1016/j.neuroimage.2012.06.081.
Juraska, J.M., Willing, J., 2017. Pubertal onset as a critical transition for neural development and cognition. Brain Res. 1654 (Pt B), 87–94. https://doi.org/ 10.1016/j.brainres.2016.04.012.
Kelley, S., Plass, J., Bender, A.R., Polk, T.A., 2019. Age-related differences in white matter: comparing ixel based and tensor based analyses. bioRxiv. https://doi.org/ 10.1101/751628, 751628.
Kessler, R.C., Berglund, P., Demler, O., Jin, R., Merikangas, K.R., Walters, E.E., 2005. Lifetime prevalence and age-of-onset distributions of DSM-IV disorders in the National Comorbidity Survey Replication. Arch. Gen. Psychiatry 62 (6), 593–602. https://doi.org/10.1001/archpsyc.62.6.593.
Krogsrud, S.K., Fjell, A.M., Tamnes, C.K., Grydeland, H., Mork, L., Due-Tonnessen, P., Bjornerud, A., Sampaio-Baptista, C., Andersson, J., Johansen-Berg, H., Walhovd, K. B., 2016. Changes in white matter microstructure in the developing brain–A longitudinal diffusion tensor imaging study of children from 4 to 11years of age. Neuroimage 124 (Pt A), 473–486.
Ladouceur, C.D., Peper, J.S., Crone, E.A., Dahl, R.E., 2012. White matter development in adolescence: the inluence of puberty and implications for affective disorders. Dev. Cogn. Neurosci. 2 (1), 36–54. https://doi.org/10.1016/j.dcn.2011.06.002.
Langberg, J.M., Epstein, J.N., Altaye, M., Molina, B.S.G., Arnold, L.E., Vitiello, B., 2008. The transition to middle school is associated with changes in the developmental trajectory of ADHD symptomatology in young adolescents with ADHD. J. Clin. Child Adolesc. Psychol. 53 37 (3), 651–663. https://doi.org/10.1080/ 15374410802148095. American Psychological Association, Division.
Lebel, C., Beaulieu, C., 2011. Longitudinal development of human brain wiring continues from childhood into adulthood. J. Neurosci. 31 (30), 10937–10947. https://doi.org/ 10.1523/JNEUROSCI.5302-10.2011.
Luders, E., Toga, A.W., Thompson, P.M., 2014. Why size matters: differences in brain volume account for apparent sex differences in callosal anatomy: the sexual dimorphism of the corpus callosum. Neuroimage 84, 820–824. https://doi.org/ 10.1016/j.neuroimage.2013.09.040.
M, A., D, P., K, W., Marshall, T.R., Kievit, R.A., 2019. Raincloud plots: a multi-platform tool for robust data visualization. Wellcome Open Res. https://doi.org/10.12688/ wellcomeopenres.15191.1.
Maninger, N., Wolkowitz, O.M., Reus, V.I., Epel, E.S., Mellon, S.H., 2009. Neurobiological and neuropsychiatric effects of dehydroepiandrosterone (DHEA) and DHEA sulfate (DHEAS). Front. Neuroendocrinol. 30 (1), 65–91. https://doi.org/ 10.1016/j.yfrne.2008.11.002.
Menzies, L., Goddings, A.L., Whitaker, K.J., Blakemore, S.J., Viner, R.M., 2015. The effects of puberty on white matter development in boys. Dev. Cogn. Neurosci. 11, 116–128. https://doi.org/10.1016/j.dcn.2014.10.002.
Pangelinan, M.M., Leonard, G., Perron, M., Pike, G.B., Richer, L., Veillette, S., Pausova, Z., Paus, T., 2016. Puberty and testosterone shape the corticospinal tract during male adolescence. Brain Struct. Funct. 221 (2), 1083–1094. https://doi.org/ 10.1007/s00429-014-0956-9.
Paus, T., Keshavan, M., Giedd, J.N., 2008. Why do many psychiatric disorders emerge during adolescence? Nat. Rev. Neurosci. 9 (12), 947–957. https://doi.org/10.1038/ nrn2513.
Perrin, J.S., Herve, P.Y., Leonard, G., Perron, M., Pike, G.B., Pitiot, A., Richer, L., Veillette, S., Pausova, Z., Paus, T., 2008. Growth of white matter in the adolescent brain: role of testosterone and androgen receptor. J. Neurosci. 28 (38), 9519–9524. https://doi.org/10.1523/JNEUROSCI.1212-08.2008.
Pesaresi, M., Soon-Shiong, R., French, L., Kaplan, D.R., Miller, F.D., Paus, T., 2015. Axon diameter and axonal transport: in vivo and in vitro effects of androgens. Neuroimage 115, 191–201. https://doi.org/10.1016/j.neuroimage.2015.04.048.
Petersen, A.C., Crockett, L., Richards, M., Boxer, A., 1988. A self-report measure of pubertal status: reliability, validity, and initial norms. J. Youth Adolesc. 17 (2), 117–133. https://doi.org/10.1007/BF01537962.
Pines, A.R., Cieslak, M., Larsen, B., Baum, G.L., Cook, P.A., Adebimpe, A., Davila, D.G., Elliott, M.A., Jirsaraie, R., Murtha, K., Oathes, D.J., Piiwaa, K., Rosen, A.F.G., Rush, S., Shinohara, R.T., Bassett, D.S., Roalf, D.R., Satterthwaite, T.D., 2020. Leveraging multi-shell diffusion for studies of brain development in youth and young adulthood. Dev. Cogn. Neurosci. https://doi.org/10.1016/j.dcn.2020.100788, 100788.
Polanczyk, G., de Lima, M.S., Horta, B.L., Biederman, J., Rohde, L.A., 2007. The worldwide prevalence of ADHD: a systematic review and metaregression analysis. Am. J. Psychiatry 164 (6), 942–948. https://doi.org/10.1176/ajp.2007.164.6.942.
Raffelt, D., Tournier, J.D., Fripp, J., Crozier, S., Connelly, A., Salvado, O., 2011. Symmetric diffeomorphic registration of ibre orientation distributions. Neuroimage 56 (3), 1171–1180. https://doi.org/10.1016/j.neuroimage.2011.02.014.
Raffelt, D.A., Smith, R.E., Ridgway, G.R., Tournier, J.D., Vaughan, D.N., Rose, S., Henderson, R., Connelly, A., 2015. Connectivity-based ixel enhancement: whole- brain statistical analysis of diffusion MRI measures in the presence of crossing ibres. Neuroimage 117, 40–55. https://doi.org/10.1016/j.neuroimage.2015.05.039.
Raffelt, D.A., Tournier, J.D., Smith, R.E., Vaughan, D.N., Jackson, G., Ridgway, G.R., Connelly, A., 2017. Investigating white matter ibre density and morphology using ixel-based analysis. Neuroimage 144 (Pt A), 58–73. https://doi.org/10.1016/j. neuroimage.2016.09.029.
Reuter, M., Schmansky, N.J., Rosas, H.D., Fischl, B., 2012. Within-subject template estimation for unbiased longitudinal image analysis. Neuroimage 61 (4), 1402–1418. https://doi.org/10.1016/j.neuroimage.2012.02.084.
S. Genc et al.

Developmental Cognitive Neuroscience 45 (2020) 100853
12
Roalf, D.R., Quarmley, M., Elliott, M.A., Satterthwaite, T.D., Vandekar, S.N., Ruparel, K., Gennatas, E.D., Calkins, M.E., Moore, T.M., Hopson, R., Prabhakaran, K., Jackson, C. T., Verma, R., Hakonarson, H., Gur, R.C., Gur, R.C.E., 2016. The impact of quality assurance assessment on diffusion tensor imaging outcomes in a large-scale population-based cohort. Neuroimage 125, 903–919. https://doi.org/10.1016/j. neuroimage.2015.10.068.
Sawiak, S.J., Shiba, Y., Oikonomidis, L., Windle, C.P., Santangelo, A.M., Grydeland, H., Cockcroft, G., Bullmore, E.T., Roberts, A.C., 2018. Trajectories and milestones of cortical and subcortical development of the marmoset brain from infancy to adulthood. Cereb. Cortex 28 (12), 4440–4453. https://doi.org/10.1093/cercor/ bhy256.
Schmithorst, V.J., Holland, S.K., Dardzinski, B.J., 2008. Developmental differences in white matter architecture between boys and girls. Hum. Brain Mapp. 29 (6), 696–710. https://doi.org/10.1002/hbm.20431.
Sciberras, E., Efron, D., Schilpzand, E.J., Anderson, V., Jongeling, B., Hazell, P., Ukoumunne, O.C., Nicholson, J.M., 2013. The Children’s Attention Project: a community-based longitudinal study of children with ADHD and non-ADHD controls. BMC Psychiatry 13, 18. https://doi.org/10.1186/1471-244X-13-18.
Seunarine, K.K., Clayden, J.D., Jentschke, S., Munoz, M., Cooper, J.M., Chadwick, M.J., Banks, T., Vargha-Khadem, F., Clark, C.A., 2016. Sexual dimorphism in white matter developmental trajectories using tract-based spatial statistics. Brain Connect. 6 (1), 37–47. https://doi.org/10.1089/brain.2015.0340.
Shankman, S.A., Lewinsohn, P.M., Klein, D.N., Small, J.W., Seeley, J.R., Altman, S.E., 2009. Subthreshold conditions as precursors for full syndrome disorders: a 15-year longitudinal study of multiple diagnostic classes. J. Child Psychol. Psychiatry 50 (12), 1485–1494. https://doi.org/10.1111/j.1469-7610.2009.02117.x.
Shirtcliff, E.A., Dahl, R.E., Pollak, S.D., 2009. Pubertal development: correspondence between hormonal and physical development. Child Dev. 80 (2), 327–337. https:// doi.org/10.1111/j.1467-8624.2009.01263.x.
Silk, T.J., Genc, S., Anderson, V., Efron, D., Hazell, P., Nicholson, J.M., Kean, M., Malpas, C.B., Sciberras, E., 2016. Developmental brain trajectories in children with ADHD and controls: a longitudinal neuroimaging study. BMC Psychiatry 16, 59. https://doi.org/10.1186/s12888-016-0770-4.
Sisk, C.L., Foster, D.L., 2004. The neural basis of puberty and adolescence. Nat. Neurosci. 7 (10), 1040–1047. https://doi.org/10.1038/nn1326.
Smith, S.M., Jenkinson, M., Woolrich, M.W., Beckmann, C.F., Behrens, T.E., Johansen- Berg, H., Bannister, P.R., De Luca, M., Drobnjak, I., Flitney, D.E., Niazy, R.K., Saunders, J., Vickers, J., Zhang, Y., De Stefano, N., Brady, J.M., Matthews, P.M., 2004. Advances in functional and structural MR image analysis and implementation as FSL. Neuroimage 23 (Suppl. 1), S208–219. https://doi.org/10.1016/j. neuroimage.2004.07.051.
Smith, R., Dhollander, T., Connelly, A., 2019. On the regression of intracranial volume in ixel-based analysis. 3385. Proc. Intl. Soc. Mag. Reson. Med. ISMRM, Montreal, Canada.
Tamnes, C.K., Ostby, Y., Fjell, A.M., Westlye, L.T., Due-Tonnessen, P., Walhovd, K.B., 2010. Brain maturation in adolescence and young adulthood: regional age-related changes in cortical thickness and white matter volume and microstructure. Cereb Cortex 20 (3), 534–548.
Tamnes, C.K., Roalf, D.R., Goddings, A.L., Lebel, C., 2017. Diffusion MRI of white matter microstructure development in childhood and adolescence: methods, challenges and progress. Dev. Cogn. Neurosci. https://doi.org/10.1016/j.dcn.2017.12.002.
Tamnes, C.K., Roalf, D.R., Goddings, A.-L., Lebel, C., 2018. Diffusion MRI of white matter microstructure development in childhood and adolescence: methods, challenges and progress. Dev. Cogn. Neurosci. 33, 161–175. https://doi.org/10.1016/j. dcn.2017.12.002.
Tournier, J.D., Smith, R., Raffelt, D., Tabbara, R., Dhollander, T., Pietsch, M., Christiaens, D., Jeurissen, B., Yeh, C.-H., Connelly, A., 2019. MRtrix3: a fast, lexible and open software framework for medical image processing and visualisation. Neuroimage 202, 116137. https://doi.org/10.1016/j.neuroimage.2019.116137.
Tustison, N.J., Avants, B.B., Cook, P.A., Zheng, Y., Egan, A., Yushkevich, P.A., Gee, J.C., 2010. N4ITK: improved N3 bias correction. IEEE Trans. Med. Imaging 29 (6), 1310–1320. https://doi.org/10.1109/TMI.2010.2046908.
van Langen, J., 2020. Open-visualizations for Repeated Measures in R. https://github.co m/jorvlan/open-visualizations.
Veraart, J., Fieremans, E., Novikov, D.S., 2016. Diffusion MRI noise mapping using random matrix theory. Magn. Reson. Med. 76 (5), 1582–1593. https://doi.org/ 10.1002/mrm.26059.
Von Der Heide, R.J., Skipper, L.M., Klobusicky, E., Olson, I.R., 2013. Dissecting the uncinate fasciculus: disorders, controversies and a hypothesis. Brain 136 (Pt 6), 1692–1707. https://doi.org/10.1093/brain/awt094.
Wakana, S., Caprihan, A., Panzenboeck, M.M., Fallon, J.H., Perry, M., Gollub, R.L., Hua, K., Zhang, J., Jiang, H., Dubey, P., Blitz, A., van Zijl, P., Mori, S., 2007. Reproducibility of quantitative tractography methods applied to cerebral white matter. Neuroimage 36 (3), 630–644. https://doi.org/10.1016/j. neuroimage.2007.02.049.
Wechsler, D., 1999. Wechsler Abbreviated Scale of Intelligence. The Psychological Corporation: Harcourt Brace & Company, New York, NY.
Wickham, H., 2016. ggplot2: Elegant Graphics for Data Analysis. Springer-Verlag, New York. https://ggplot2.tidyverse.org.
Zhang, Z., Cerghet, M., Mullins, C., Williamson, M., Bessert, D., Skoff, R., 2004. Comparison of in vivo and in vitro subcellular localization of estrogen receptors alpha and beta in oligodendrocytes. J. Neurochem. 89 (3), 674–684. https://doi.org/ 10.1111/j.1471-4159.2004.02388.x.
S. Genc et al.