LONGITUDINAL MULTIPLE SCLEROSIS LESION …raman/MSLesion.pdf · LONGITUDINAL MULTIPLE SCLEROSIS...
2
LONGITUDINAL MULTIPLE SCLEROSIS LESION SEGMENTATION USING 3D CONVOLUTIONAL NEURAL NETWORKS Suthirth Vaidya, Abhijith Chunduru, Ramanathan Muthuganapathy, Ganapathy Krishnamurthi Biomedical Imaging Lab, Department of Engineering Design Indian Institute of Technology Madras, India ABSTRACT We present our entry for the Longitudinal Multiple Sclero- sis Challenge 2015 using 3D convolutional neural networks (CNN). We model a voxel-wise classifier using multi-channel 3D patches of MRI volumes as input. For each ground truth, a CNN is trained and the final segmentation is obtained by com- bining the probability outputs of these CNNs. Efficient train- ing is achieved by using sub-sampling methods and sparse convolutions. We obtain accurate results with dice scores comparable to the inter-rater variability. Index Terms— Multiple Sclerosis, 3D Convolutional Neural Networks, Deep Learning, Neuroimaging 1. INTRODUCTION Multiple Sclerosis (MS) is a chronic demyelinating disease and affects over 2 million patients globally. The condition is typically diagnosed based on hyperintense or hypointense appearance on Magnetic Resonance (MR) Images. How- ever, the complex appearance and visually vague edges of lesions make segmentation by specialists a difficult and time-consuming task. Methods such as Gaussian Mixture Models[1] have been proposed for the automated segmenta- tion of MS lesions. Motivated by the performance of Convo- lutional Neural Networks(CNN) for visual recognition from 2D images[2], we decided to apply a 3D version of CNN for this challenge. 2. MATERIAL AND METHODS 2.1. Pre-Processing We use the data provided by the Longitudinal Multiple Scle- rosis Challenge 2015. The data provided is skull-stripped and corrected for bias. Further to this, we employ a normalization technique similar to one described by G. Urban et al.[3] The data is histogram matched to an arbitrary data point (patient 1, time point 1) and normalized using the mean CSF value. We also added an additional step of truncating the in- tensity values to the quartile range of [0.01, 0.99]. The nor- Fig. 1. Architecture of the 3D CNN: L1 - 60 filters of 4x4x4 with average pooling of 2x2x2, L2 - 60 filters of 3x3x3 with average pooling of 2x2x2, L3 - Multi-layer Perceptron, L4 - Softmax. O1, O2, O3 and O4 are respective outputs of L1, L2, L3 and L4. malization step was carried out using Advanced Normaliza- tion Tools (ANTs)[4] and Atropos[5]. 2.2. Convolutional Neural Network We employ a voxel-wise classifier to perform the segmenta- tion task. Three dimensional patches from each channel - T1, T2, FLAIR and PD centered around the voxel of interest is fed to the classifier. Thus, the classifier effectively analyzes 4 dimensions for each voxel. 2.2.1. Data Sampling Since MS Lesions only constitute a very small percentage of the MRI volume, we performed a data sampling method to re- duce the class imbalance in our training data. In this method, each image volume is divided into subvolumes of equal size. Three dimensional patches for training are selected only from those subvolumes that contain lesion voxels greater than a set threshold. In addition, this sampling technique allows the use of sparse convolution method as described in [6] which has proven to speed up the training of convolutional neural net- works for segmentation. 2.2.2. Architecture We developed a 3D Convolutional Neural Network which performs 3D spatial convolutions as opposed to 2D convolu-
Transcript of LONGITUDINAL MULTIPLE SCLEROSIS LESION …raman/MSLesion.pdf · LONGITUDINAL MULTIPLE SCLEROSIS...
LONGITUDINAL MULTIPLE SCLEROSIS LESION SEGMENTATIONUSING 3D CONVOLUTIONAL NEURAL NETWORKS
Suthirth Vaidya, Abhijith Chunduru, Ramanathan Muthuganapathy, Ganapathy Krishnamurthi
Biomedical Imaging Lab, Department of Engineering DesignIndian Institute of Technology Madras, India
ABSTRACT
We present our entry for the Longitudinal Multiple Sclero-sis Challenge 2015 using 3D convolutional neural networks(CNN). We model a voxel-wise classifier using multi-channel3D patches of MRI volumes as input. For each ground truth, aCNN is trained and the final segmentation is obtained by com-bining the probability outputs of these CNNs. Efficient train-ing is achieved by using sub-sampling methods and sparseconvolutions. We obtain accurate results with dice scorescomparable to the inter-rater variability.
Index Terms— Multiple Sclerosis, 3D ConvolutionalNeural Networks, Deep Learning, Neuroimaging
1. INTRODUCTION
Multiple Sclerosis (MS) is a chronic demyelinating diseaseand affects over 2 million patients globally. The conditionis typically diagnosed based on hyperintense or hypointenseappearance on Magnetic Resonance (MR) Images. How-ever, the complex appearance and visually vague edges oflesions make segmentation by specialists a difficult andtime-consuming task. Methods such as Gaussian MixtureModels[1] have been proposed for the automated segmenta-tion of MS lesions. Motivated by the performance of Convo-lutional Neural Networks(CNN) for visual recognition from2D images[2], we decided to apply a 3D version of CNN forthis challenge.
2. MATERIAL AND METHODS
2.1. Pre-Processing
We use the data provided by the Longitudinal Multiple Scle-rosis Challenge 2015. The data provided is skull-stripped andcorrected for bias. Further to this, we employ a normalizationtechnique similar to one described by G. Urban et al.[3]
The data is histogram matched to an arbitrary data point(patient 1, time point 1) and normalized using the mean CSFvalue. We also added an additional step of truncating the in-tensity values to the quartile range of [0.01, 0.99]. The nor-
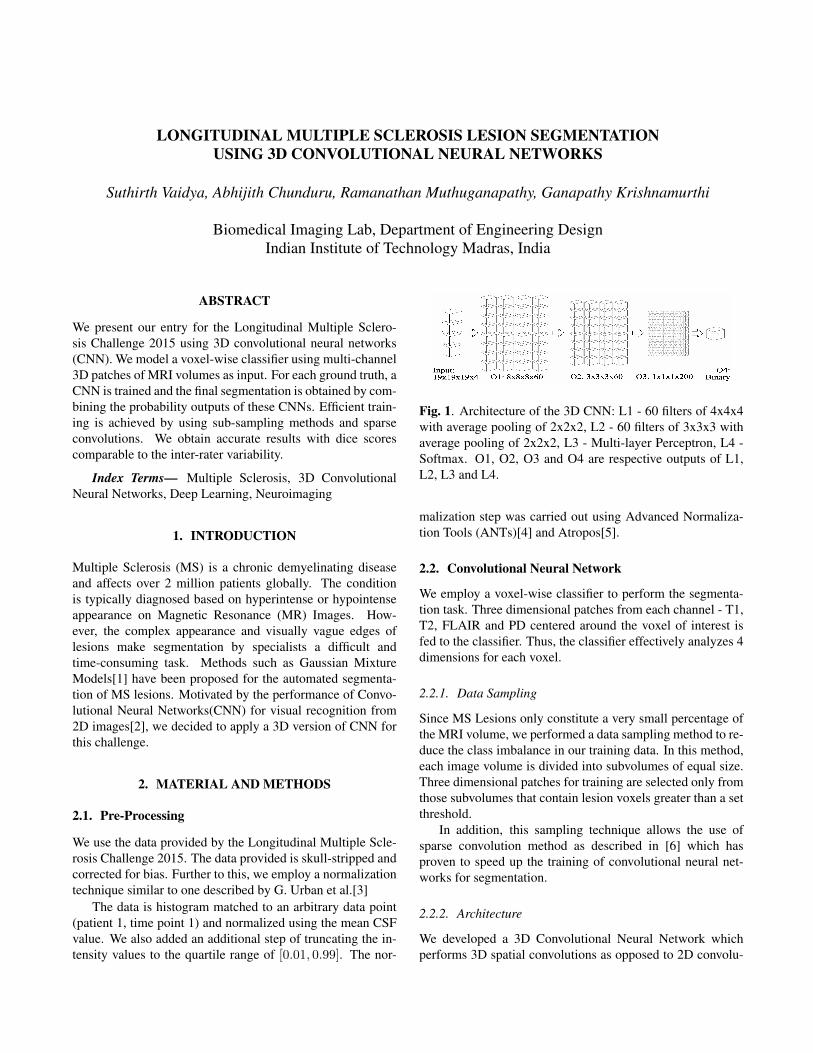
Fig. 1. Architecture of the 3D CNN: L1 - 60 filters of 4x4x4with average pooling of 2x2x2, L2 - 60 filters of 3x3x3 withaverage pooling of 2x2x2, L3 - Multi-layer Perceptron, L4 -Softmax. O1, O2, O3 and O4 are respective outputs of L1,L2, L3 and L4.
malization step was carried out using Advanced Normaliza-tion Tools (ANTs)[4] and Atropos[5].
2.2. Convolutional Neural Network
We employ a voxel-wise classifier to perform the segmenta-tion task. Three dimensional patches from each channel - T1,T2, FLAIR and PD centered around the voxel of interest isfed to the classifier. Thus, the classifier effectively analyzes 4dimensions for each voxel.
2.2.1. Data Sampling
Since MS Lesions only constitute a very small percentage ofthe MRI volume, we performed a data sampling method to re-duce the class imbalance in our training data. In this method,each image volume is divided into subvolumes of equal size.Three dimensional patches for training are selected only fromthose subvolumes that contain lesion voxels greater than a setthreshold.
In addition, this sampling technique allows the use ofsparse convolution method as described in [6] which hasproven to speed up the training of convolutional neural net-works for segmentation.
2.2.2. Architecture
We developed a 3D Convolutional Neural Network whichperforms 3D spatial convolutions as opposed to 2D convolu-
tion used in image classification tasks. The architecture hasbeen represented in Fig.1.
All convolutional layers use softplus activation function.The model is trained using logarithmic likelihood as costfunction and optimization is carried out using mini-batchgradient descent with a momentum. We gain a speed upof several orders by processing 253 voxels in one gradientoptimization using the earlier mentioned sparse convolutionmethod. We were able to train our model within one dayand prediction took around 2 minutes per brain image on anNvidia Tesla K20 GPU.
We trained two Convolutional Neural Networks, one foreach radiologist mask with the same architecture and specifi-cations. We used the posterior probability maps of the lesionclass from the CNNs to generate our final prediction.
2.3. Post-Processing
We add posterior probability values from both CNNs withequal confidence and use it to arrive at our final segmenta-tion. Since Multiple Sclerosis is only seen in white matter,we apply a white matter mask on the prediction by registeringthe test images with pre-built brain templates [7] and performgrayscale dilation on the corresponding WM priors for eachpatient.
3. RESULTS AND DISCUSSION
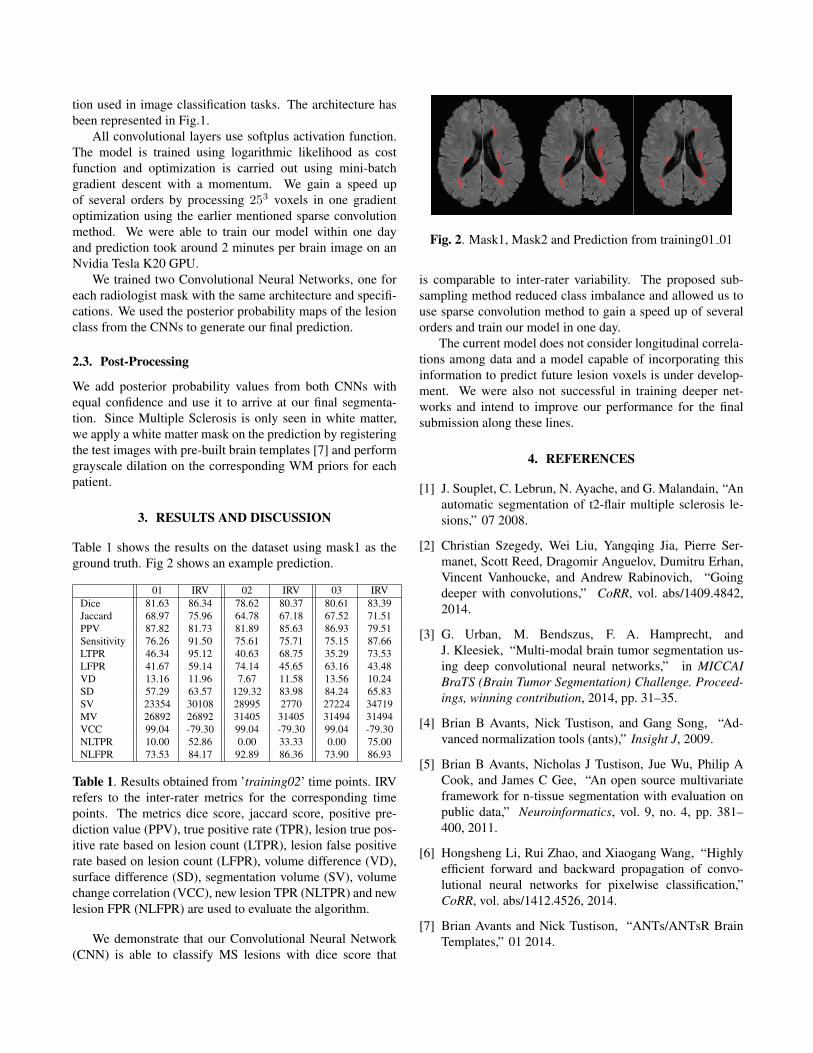
Table 1 shows the results on the dataset using mask1 as theground truth. Fig 2 shows an example prediction.
01 IRV 02 IRV 03 IRVDice 81.63 86.34 78.62 80.37 80.61 83.39Jaccard 68.97 75.96 64.78 67.18 67.52 71.51PPV 87.82 81.73 81.89 85.63 86.93 79.51Sensitivity 76.26 91.50 75.61 75.71 75.15 87.66LTPR 46.34 95.12 40.63 68.75 35.29 73.53LFPR 41.67 59.14 74.14 45.65 63.16 43.48VD 13.16 11.96 7.67 11.58 13.56 10.24SD 57.29 63.57 129.32 83.98 84.24 65.83SV 23354 30108 28995 2770 27224 34719MV 26892 26892 31405 31405 31494 31494VCC 99.04 -79.30 99.04 -79.30 99.04 -79.30NLTPR 10.00 52.86 0.00 33.33 0.00 75.00NLFPR 73.53 84.17 92.89 86.36 73.90 86.93
Table 1. Results obtained from ’training02’ time points. IRVrefers to the inter-rater metrics for the corresponding timepoints. The metrics dice score, jaccard score, positive pre-diction value (PPV), true positive rate (TPR), lesion true pos-itive rate based on lesion count (LTPR), lesion false positiverate based on lesion count (LFPR), volume difference (VD),surface difference (SD), segmentation volume (SV), volumechange correlation (VCC), new lesion TPR (NLTPR) and newlesion FPR (NLFPR) are used to evaluate the algorithm.
We demonstrate that our Convolutional Neural Network(CNN) is able to classify MS lesions with dice score that
Fig. 2. Mask1, Mask2 and Prediction from training01 01
is comparable to inter-rater variability. The proposed sub-sampling method reduced class imbalance and allowed us touse sparse convolution method to gain a speed up of severalorders and train our model in one day.
The current model does not consider longitudinal correla-tions among data and a model capable of incorporating thisinformation to predict future lesion voxels is under develop-ment. We were also not successful in training deeper net-works and intend to improve our performance for the finalsubmission along these lines.
4. REFERENCES
[1] J. Souplet, C. Lebrun, N. Ayache, and G. Malandain, “Anautomatic segmentation of t2-flair multiple sclerosis le-sions,” 07 2008.
[2] Christian Szegedy, Wei Liu, Yangqing Jia, Pierre Ser-manet, Scott Reed, Dragomir Anguelov, Dumitru Erhan,Vincent Vanhoucke, and Andrew Rabinovich, “Goingdeeper with convolutions,” CoRR, vol. abs/1409.4842,2014.
[3] G. Urban, M. Bendszus, F. A. Hamprecht, andJ. Kleesiek, “Multi-modal brain tumor segmentation us-ing deep convolutional neural networks,” in MICCAIBraTS (Brain Tumor Segmentation) Challenge. Proceed-ings, winning contribution, 2014, pp. 31–35.
[4] Brian B Avants, Nick Tustison, and Gang Song, “Ad-vanced normalization tools (ants),” Insight J, 2009.
[5] Brian B Avants, Nicholas J Tustison, Jue Wu, Philip ACook, and James C Gee, “An open source multivariateframework for n-tissue segmentation with evaluation onpublic data,” Neuroinformatics, vol. 9, no. 4, pp. 381–400, 2011.
[6] Hongsheng Li, Rui Zhao, and Xiaogang Wang, “Highlyefficient forward and backward propagation of convo-lutional neural networks for pixelwise classification,”CoRR, vol. abs/1412.4526, 2014.
[7] Brian Avants and Nick Tustison, “ANTs/ANTsR BrainTemplates,” 01 2014.