Longitudinal dunes, their genesis and ordering€¦ · Inferior mirage of a mountain. Figure 71....
97
The University of Adelaide Department of Geology and Geophysics LONGITUDINAL DUNES: THEIR GENESIS AND ORDERING George Kuang Yee Tseo Volume Two (figures and plates) January, 1986 A thesis submitted to the University of Adelaide in fulfilment of the requirements for the degree of Doctor of Philosophy by /tr.¿¡ødea1 ¡L- I - ¿9 ;
Transcript of Longitudinal dunes, their genesis and ordering€¦ · Inferior mirage of a mountain. Figure 71....

The University of AdelaideDepartment of Geology and Geophysics
LONGITUDINAL DUNES:THEIR GENESIS AND ORDERING
George Kuang Yee Tseo
Volume Two(figures and plates)
January, 1986
A thesis submitted to the University of Adelaidein fulfilment of the requirements for the
degree ofDoctor of Philosophy
by
/tr.¿¡ødea1 ¡L- I - ¿9 ;

PIates
Liet of Plates
Plete 1. Landsat imagery of six linear dune fields'
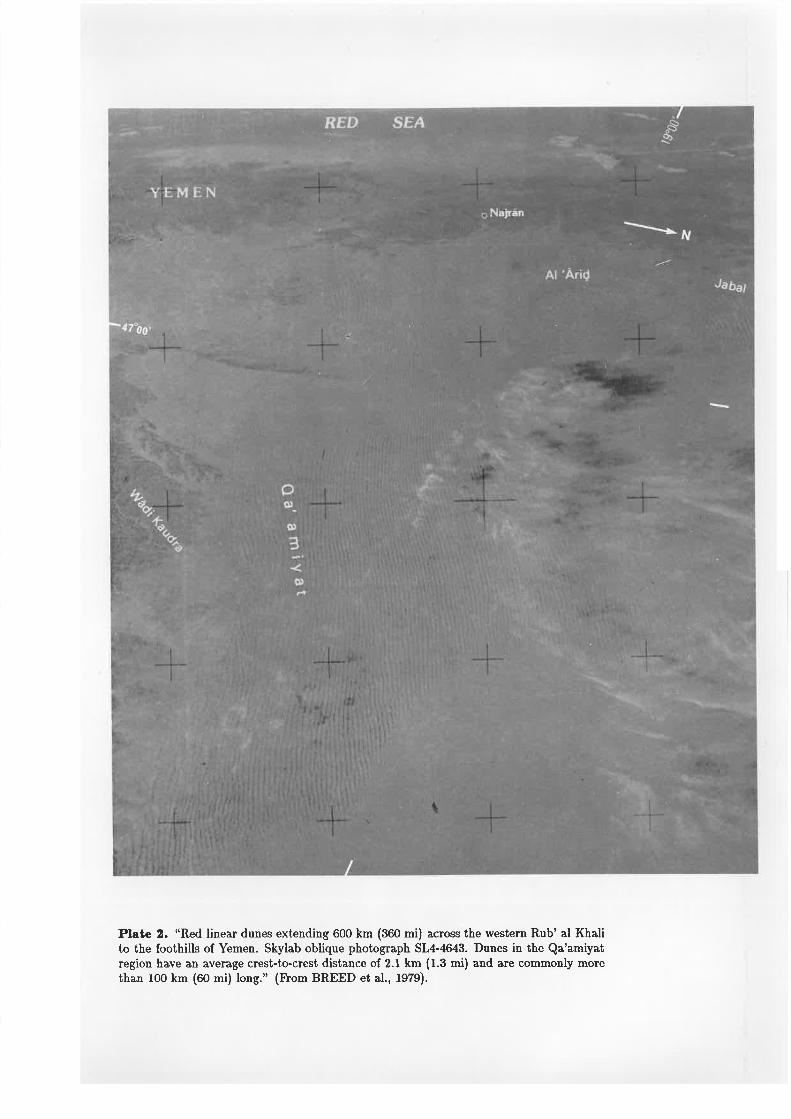
Plate 2. Rub' al Khali, Yemen'
Plate B. Erg'Bilma, Niger.
Plate 4. Negev Desert, Israel.
Plate 5. Simpson Desert, Australia'
Plate 6. ,,Fishinghook" linear dunes of western china.
Plate 7. "Honeycomb" linear dunes of western China'
Plate 8. "Dendritic" linear dunes of western China'
Plate 9. Navajo Indian Reservation, U'S'A'
plate 1O. Linear dunes with barchanlike slip faces (Central Wahiba Sands,
Oman).
Plate 11. Snow barchans.
Plate 12. Linear dunes emerging from the leeward side of a debris ridge'
Plate 13. smoke-marked roll vortices in a shallow fluid chamber'
Plate 14. Rotation canister.
Plate 15.tank.
Longitudinal streaks recorded in the china-clay bed of a rotation
Plate 1o. Longitudinal features recorded in the sand bed of a rotation canister'
Plate 17. Stationary vortìces produced in a rotation tank while fluid was moved
radially across the bottom.
Plate 18. Single stationary vortex'
plate lg. Longitudinal features recorded in the sand bed of a rotation canister'
Plate 20. Notched linear dunes in northern Africa'
Plate 21. Notched linear dunes in central Australia'
Plate 22. Instrumented tower.
l

Plates
Plate 28. Smoke trails.
Plate 24. Airplane wing-mounted electrical field measurement device.
Plate 26. Instrumented airplane foremast'
Plate 2o. Landsat image of the area of the study linear dune'
Plate 27. Bare portion of the study dune eastern flank'
Plate 2t. vegetated portion of the study dune eastern flank.
Plate 29. StudY dune summits.
Plate 3o. study dune summits as viewed looking south along the crest.
Plate 31. Study dune surface ripples.
plate 82. TÌansition between dune and interdune corridor (study dune western
perimeter).
plate BB. Close-up view of transition between dune and interdune corridor
(study dune western Perimeter).
ptate 84. Two stage transition between dune and interdune corridor (study
dune western perimeter).
plate 85. "Clay leave" erosional structures (eastern perimeter)-
plate BO. Portion of interdune corridor covered by low vegetation (west of study
dune).
plate BT. Portion of interdune comidor covered by grass (east of study dune).
plate St. Portion of interdune corridor covered by sand and very sparse low
vegetation (west of studY dune)'
plate 3g. Portion of interdune corridor covered by pebbles (west of study dune).
Plate 40. Electronic wind vane'
Plate 41. Electronic wind vane mounted on a pole'
Plate 42. Grid of stakes.
plate 48. Tracking theodolite and balloons (close to study dune western perime-
ter).
Plate 44. tacking theodolite (- 200 m west of study dune)'
Plate 46. lr{eander in the Colorado River.
Plate 48. Covergent dunes that do not coalesce (South Australia).

Fígures
List of Figures
Figure l. Sectional profiles of typical and sharp-crested longitudinal dunes.
Figure 2. The Australian system of linear dune frelds'
Figure B. The northern African system of linear dune frelds and its associated
wind pattern.
Figure 4. The Australian arc of relict dunes and a hypothetical trace of ancient
summer anticyclones.
Figure 5. Prevailing winds of the modern summer anticyclone.
Figure O. Aerial trace comparing the trend of newly forming linear dunes and
,"ti.t linear dunes of the northeastern shore of Lake Flome, south Australia.
Figure Z. Longitudinal dune with shifting crest and vectors of causal storm
winds.
Figure B. Series of pictures depicting the transition from a barchan to a linear
dune as a result of bidirectional winds.
Figure g. Longitudinal sand strips deposited during a stor,m and the hypothet-
ical secondary circulation.
Figure lO. Roll vortices and their relationship to longitudinal dunes, soaring
birds and longitudinal clouds.
Figure 11. Computer plots of various forms of longitudinal dunes and their
internal structure.
Figore 12. Aerial trace of a portion of the Simpson Desert displaying a high
density of Y junctions.
Figure 13. Dune profiles in relation to Y junctions'
Figure 14. Flow and pressure gradient forces around parallel travelling ships.
Figure 15. Internal structure of Bénard convection cell.
Figure 16. Schematic diagram of smoke chamber'
Figure 17. Wind field of roll vortices simulated using Doppler radar data.
Figure 18. Theoretically derived flow parameter profrles ol roll vortices.
Figure 19. Theoretical secondary flow in the planetary boundary layer'

Figures
Figure 2O. Schematic diagram of rotation tank-
Figure 21. Schematic diagram of rotation canister'
Figure 22. Spiral axes of the two mutuaþ orthogonal sets of roll vortices'
Figure 23. The formation of spiral sediment bands by roll vortices.
Figure 24. Graph depicting the relationship between the measured and calcu-
latãd anguìar divergence of longitudinal roll vortices from the mean flow.
Figure 25. Itlustrations depicting the consequences of the unconditional stabil-
ity6t roll vortices situated with respect to longitudinal dunes such that surface
flow convergence zones coincide with dune crests.
Figure 26. Illustrations depicting the consequences of the conditional stability
of ioll vortices situated with respect to longitudinal dunes such that surface flow
divergence zones coincide with dune crests'
Figure 27. Spectra of velocity components derived from airplane measurements.
Figure 28. Ideal rectangular circulation, elliptical circulation and the zones of
turbulent entrainment associated with elliptical circulation.
Figure 2g. Variations of the vertical electrical potential gradient as measured
using aircraft.
Figure BO. Simultaneous records of the vertical electrical potential gradient
and relative humiditY.
Figure 81. The relationship between geostrophic wind and roll vortices.
Figure 32. tlorizontal fluctuations of lvind parameters'
Figure 38. Recommended flight patterns for aircraft measurement of wind
parameters.
Figure 34. schematic diagrams of reverse flow temperature probes.
Figure s5. Map of simpson Desert, Strzelecki Desert and environs.
Figure BO. Plan-view symbolic representation of study linear dune depicting
salient geourorphic features'
Figure BZ. Grid of stakes over the study dune and its topographic form lines.
Figure BB. Arc of ôolored sand aggregates on the study dune avalanche face
believed to indicate a leervard side rotor.

Fígures
Figure Bg. i{ite and ribbon configuration believed to indicate a windward side
rotor.
Figure 4O. Delta wing kite.
Figure 41. Kite configuration believed to indicate roll vortices.
Figure 42. Kite confrguration believed to indicate roll vortices.
Figure 48. Array of tethered kites needed for full wavelength roll vortices
observations in linear dune fields.
Figure 44. Kite configuration believed to indicate quasi-laminar flow.
Figure 46. Kite configuration believed to indicate quasi-laminar flow.
Eigure 40. Peculiar kite configuration.
Figure 47. Horizontal plane wind directions across the southern perimeter of
the study site.
Figure 4E. Vertical plane wind directions across the southern perimeter of the
study site.
Figure 4g. Relative wind speed measurements across the southern perimeter
of the study site.
Figure 5O. Horizontal flow divergence/convergence pattern over the study lin-
ear dune.
Figure 61. Streamlines during oblique flow.
Figure 52. Study site deposition/erosion record for the period from December
16, 1982 to December 18, 1982.
Fígure 58. Study site deposition/erosion record for the period from December
14, 1982 to December 24, 1982'
Figure 54. Study site deposition/erosion record for the period from December
24,1982 to February 11, 1983.
Figure 55. Study site deposition/erosion record for the period from December
14, 1982 to February 11, 1983.
Figure 56. Study site deposition/erosion record for the period from February
11, 1983 to April 10, 1983.
Figure 57. Study site deposition/erosion record for the period from December
14, L982 to April 10, 1983.

Figures
Figure 58. Deposition/erosion records for the head of the study dune-
Figure 69. Study site firmness record for December 22, 1982
Figure 6O. Study site firmness record for January 30, 1983
Figure O1. Change in firmness record for the study site for the period fromDecember 22, 1982 to January 30, 1983.
Figure 62. Study site deposition/erosion record for the period from December
22, 1982 to January 30, 1983.
Figure 03. Lines along which topographic change was monitored over the studysite
Figure 64. Topographic change in the study site northern perimeter between
December 8, 1982 and January 29, 1983.
Figure O5. Topographic change in the study site southern perimeter between
December 8, 1982 and January 29, 1983.
Figure 66. Topographic change in the study site crestal axis between December8, 1982 and januan{ 29,1983.
Figure 67. Flow and sediment transport convergence and divergence zones
across a gridded area.
Figure 6t. Stake with vaseline-covered file cards for sand collection duringsaltation.
Figure 69. Distribution of colored grains over the study site on December 16,
1982.
Figure 7O. Inferior mirage of a mountain.
Figure 71. Optically deduced vertical temperature profile for Gershoj, Den-
mark.
Figure 72. Solar radiative heating of a linear dune
Figure 73. Comparative diagram of parabolic, sine, circular and sine-generatedcurves
Figure 74. River meanders.
Figure 75. FIow asymrnetry for channel bends of various shapes
Figure 78. Idealized flow patern of a typical meander.
Figures
Figure 77. Idealized shear pattern for turning flow if transverse flow is to be
prevented.
Figure 78. Linear sand banks of the Norfolk Banks area in the North Sea-
Figure 79. Flow and sediment transport deflection in the shallow water over a
linear sand bank.
Figure 8O. Flow momentum over a linear sand bank and far from it"
Figure 8L. Momentum vector and its components.
Figure 82. Illustration depicting the relationship between the parameters lr
and $f and the bottom toPograPhY'
Figure 88. The relationship between lateral flow speed variation and topogra-
phv.
Figure 84. Linear sand bank growth rate contours
Figure 85. Inflection point vertical velocity profile and vertical profiles of asso-
ciated parameters.
Figure E6. Curves for neutral stability for a two- dimensional boundary layer
with two-dimensional disturbances.
Figure E7. Sketch of Lake Phitlipi area, near the eastern margin of the Simpson
Desert in western Queensland.
Figure E8. Map of southwestern margin of Lake Eyre, central South Australia
and map of northern shore of Lake Gregory, central South Australia.
Figure tg. Map of the Diamantina flood plain near Birdsville, Queensland.
Figure gO. Stagnation pressure over the windward face of an obstacle and the
associated flow vertical velocity profile'
Figure 91. Pressure gradient generation of vortical fl.ow around an obstacle
Figure g2. Roll vortìces generated around a namow obstacle and around the
ends of a wide obstacle.
Figure 93. Görtter instability over a concave surface.
Figure 94. The development of a series of longitudinal deposition ridges froma single mound.
Figure g5. The development of longitudinal dunes from a clebris riclge.

Figures
Figure 96. Leeward secondary flow and the resultant longitudinal deposition
in wind tunnel trials using plasticene obstacles'
Figure 97. wind rotor between two converging linear dunes.
Figure 9t. Sine-generated curve.
Figure 99. Ekman sPiral.
Figure 1OO. centriÍugal instabitity for fl.ow over a concave slope.

1 8'30'l 26"30',
/o"^ro,
?3'00
1 5"00'
e-
zf3oi-&ihÞI
N
t
@ 'ta¿ 24'30'
KM
M
plate l. ,,Landsat imagery sample areas on which measurements of linear width, length,
and wavelength were *id". Nornbers in parentheses refer to the regions listed in table
36. Each sariple is an area 50 km by 50 km, or 2,500 km2 (1,550 mi2) in a sand sea. A)
Kalahari Desert southern Africa; simple dunes B) Great Sandy Desert, Australia; simple
dunes C) Southwestern Rub' al Khali, Saudi Arabia; compound dunes D) Southwestern
Sahara; áompound dunes E) Namib Desert, South-west Africa; complex dunes F) Western
R.b' ai Khaii, Saudi Arabia; complex dunes." (Flom BREED and GR9W, 1979).

N
I
B DP:948ANNUAL
DP=96FEB.
DP:119APR.
DP:71JUNE
DP=25AUG.
DP:49 DP:55DEC.ocT
Plate 8. "Landsat imagery of linear dunes A) in the Erg Bilma. Both simple andcompound linear dunes occur near Bilma in the same regìonal wind environment. B)Annual and six monthly sand roses for Bilma, Niger, illustrate a wide unimodal high-energT wind regime near the dunes. Arrow indicates resultant drift direction. Number incenter circle of rose is reduction factor. DP (drift potential, in vector units) is given foreach rose." (Fbom FRYBERGER, 1979).


Plate 6. SimPson Desert dunes'
ó"pu.t-.ot of Linds, South Australia)(Poolowanna 1:250,000 photograph' SVY' 2445'
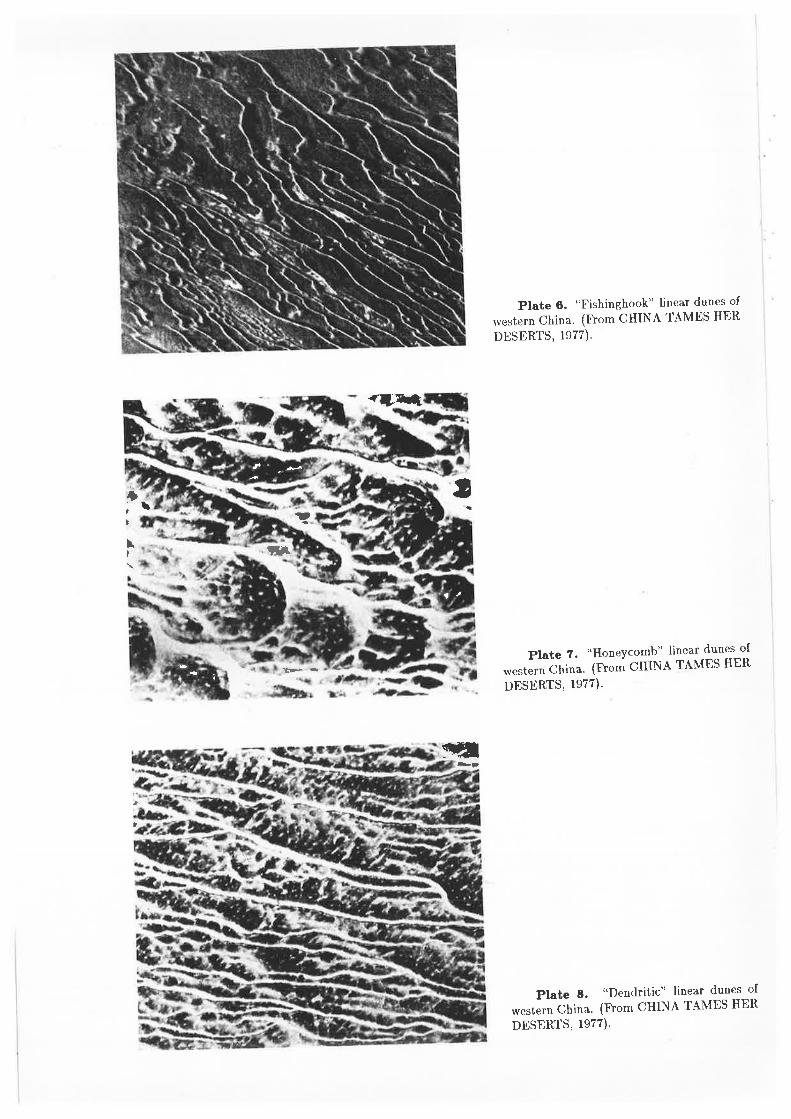
Plate 6. "Fishinghook" linear dunes of
rvestern China. (From CHINA TAMES HER
DESBRTS, 1977).
ÇT
t\þ
,i
\I
t
,s
Þ--Plate 7. "Honeycomb" linear dunes of
*".t"* China. (From CHINA TAMES HER
DESERTS, 1977).
Plate 8. "Dendritic" linear dunes of
ru".tã.o China. (From CIIINA TAMES HER
DESERTS, 1977).
+t
l.
a
,

+Josh
()
.r') Í?gD
3 5'5 5'
.({.a\ù
4
,'1\\\\\\ '
[/¡r]r nk{) [¡¡
$¡ I í, tr,t.l t I
5.f- I
:ì l\ll
trz
9"o-
0
t"
111"15' rì
q*
\!6)
Klv'l)1*
Plate 9. simple linear dunes from the Navajo Indian Resewation, northern Arizona,
U.S.A. (Flom BREED and GROW, 1979)'

Ptate lO. Linear dunes "with barchan-
like slip faces developed on their western
flanks as a result of gentle eastern wtn-
t-". *i"at. Central Wahiba Sands' Oman'"
(From GLENNIE, 1970')
Plate 11. Snow barchans of the Lake
E.i" .no." linked by the elongation of ole of
it " t oto. of the windward barchan' (FTom
HANNES and HANNES, 1982)'
rvhìtc to rcd sand.

t1234Scrn
!!È
a - _.-.
>
j.=:¡-
CIIANDRA, 1938).
Plate 14. Rotation canister set uP for
photography' (Flom HORST, 1970b)'

III
I
Plate 16. "china-clay record of instability." The direction of disk rotation was
counterclockwise, the roiation rate was 3200 rev/min and the disk radius was 4.35 in'
(From GREGORY, STUART and WALKER, 1955)'

Plate 16' Longitudinal features developed on the bottom sand bed the rotation canister.(trÌom HORST, te70b).
tlit\
Plate 17' Stationary vortices produced jn a rotation tank while fluid was moved radiallyacross the bottom. (From FALLER and KAYLOR, f966).


Plate 19. Longitudinal features in
bottom sand bed of the rotation canister'
Note that in this instance only the fluid
near the fringe of the canister seems to have
succombed to an organìzed instability' (From
HORST, l97ob).
Twidale)'

¡
Þ
:
ii
I
B
Þ 4.,T
lt?
Ptate 22. A) 100 rn tower instrurnented for the observation of turbulant eddies over the
low canopy of a forest in central Eyre Penninsula, south Australia. Note that the pairs
of short extension arms, mounted with a cup anemometer and a shielded temperature
sensor, are logarithmicaily spaced. This is configuration is promptgd by the logarithmic
vertical variatlon in wind rp""a toa temperature. B) Long horizontal boom mounted with,
from right to left, wind vane and propellor anemometer, vertical wind component rotor
anemorieter, and hygrometer. The encasement for the thermometer mounted on the short
arm, of whici a ct"ir"r view is afforded in this image, is designed to shield the sensor from
direct solar radiation and wind. (chen Fa Zu, Chinese Academy of science).
a

I
Plate 28. "Smoke laid parallel to the
wind by a plane flying horizontally. Note
the vertical development of points A and
B. Elapsed time between (i) and (ii) is 88
seconds." (Taken from WOODCOCK and
WYMAN, 1947).
Plate 24. "Installation of potential gra-dient probes on wing of Tlipacer aircraft."(From VONNEGUT, MOORE and MÄLLA-HAN, 196l).
Plate 26. The instrumented fo¡emastor noseboom of the de Ilavilland Buffalo air-craft N326D of the N¿tional Center for At-mospheric Research (NCAR), Boulder, Col-
orado, U.S. (tlom LENSCHOW, 1972).
Bout¡n0
-tUZ
l
I
I1
I
I
I
8d

i
fl*
\I
!
^I
)
(!
'¡1:
Plate 26. Landsat image of the area just to the south of Moomba ga,s camP. The study
ã""ã i",rrrr.ed ,,s,,. (stizelecki l:250,ó00 photograph, svY. 2548, Department of Lands,
South Australia).
\Ja.
'î
i
-it
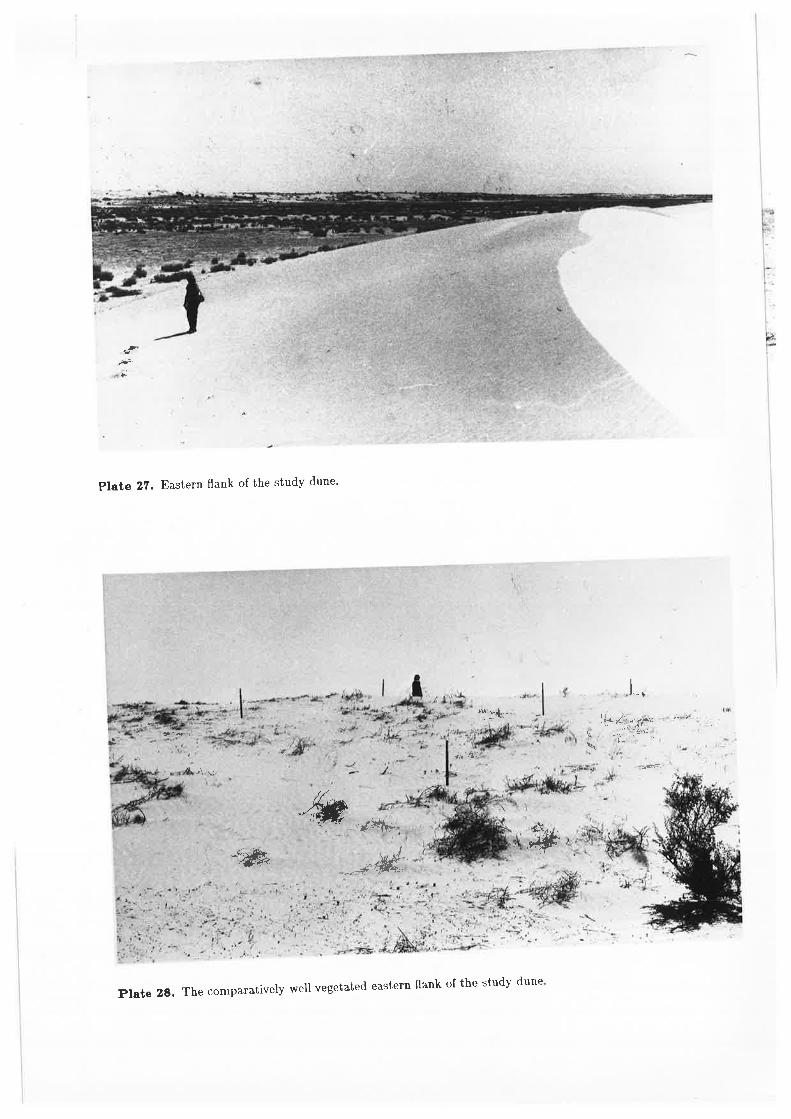
Plate 27. Eastern flank of the study dune'
,,, -#-
,{.\,,.r#
J-- .
t\,L^ y'-'. -,4¡-,. ', *' ,,.:_i.,_,
î'- .
-r"fu
;r' !L;.
.É¿tfir,
-".r&
-nrw
Plate 2t. The comparatively well vegetated eastern flank of the study dune


Plate 31. RiPPles on the studY dune
,ottu." as viewecl looking south and into the
wind.
Plate 33. A close-up view of the transi-
tion betrveen the dune and the interdune cor-
ridor (See Pt. 32).
Plate 32. A Point along the western
perimeter of the study dune at r¡vhich ^the
iransition between the dune and the firmmaterial of the interdune conidor is abrupt'
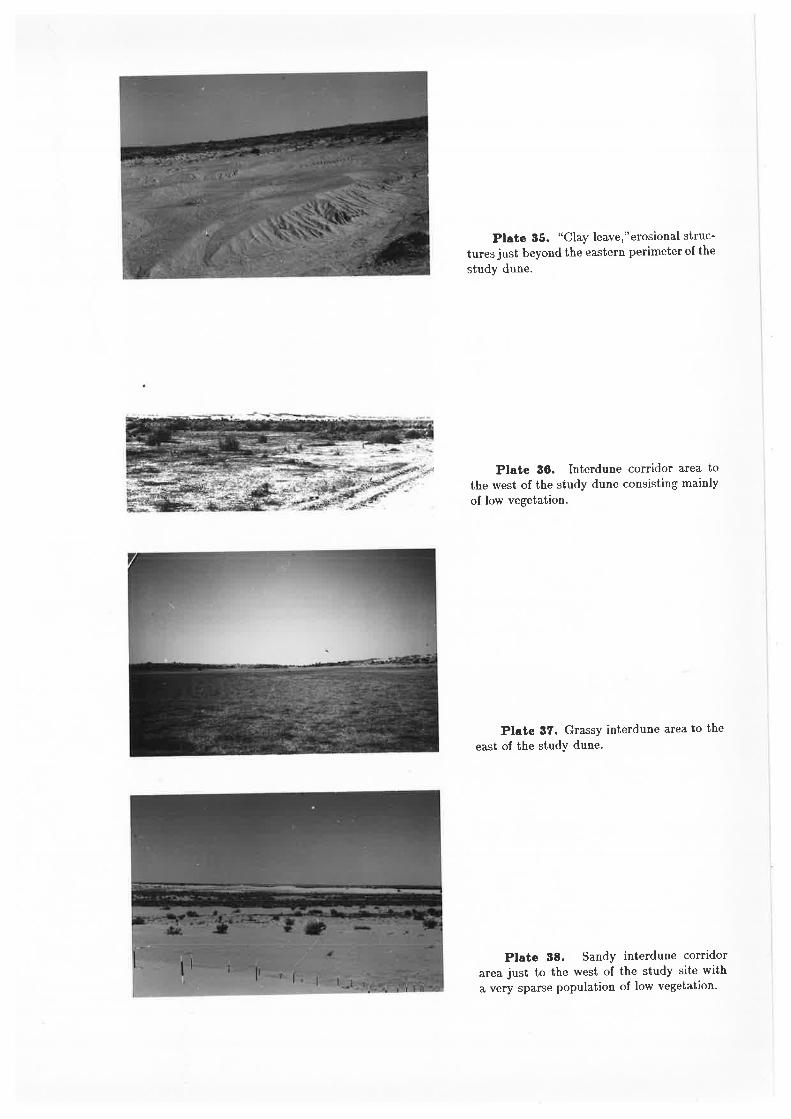
Plate 86. "Clay leave,"erosional struc-
turesjust beyond the eastern perimeter of the
study dune.
Ptate 96. Interdune corridor area tothe west of the study dune consisting mainlyof low vegetation.
Plate 87' Grassy interdune area to the
east of the studY dune'
Plate 8E. Sandy interdune corridorarea just to the west of the study site witha very sparse population of low vegetation'

Plate 89. Pebbly interdune corridor area to the west of the study dune with some low,
woody debris.
Plate 4O. Variable resistance wind vane utilizing a styrofoam tail and a DC 100
microampere meter.

,.{
i
gl t?
Electronic wind vane mounted on top o1 a - 2.5 m wooden pole forPlate 41.measurements
)
I
IIt'
t.
ll
I
-.\--- rli
',i
._q t
'¡{-.
Plate 42.monitoring
Grid of stakes planted over the study site for use in deposition/erosion

Plate 43. tacking theodolite and balloons before launching close to the western
perimeter of the study dune.
-..r4ff
Plate 44. Tracking theodolite - 200 m west of the dune.


Plate 46. Several examples of dunes that converge but do not coalesce can be foundin this image, most notably the three convergent dunes in the center. (Gason l:250,000photograph, ïVY.2473, Department of Lands, South Australia. )

Sectiou
A
-ôo
Poroll€l lonq¡rudinol
fiì Lons¡rud,ñol dunes ol
"..,dblc lrcñd.
B
SVONEY
E Simpson Desert
F Sturt's Stony Desert
[TWIDALE, lesll
Figure l. A) Section throügh a typical longitudinal dune. .B) Section through the sharp-crested
lc,n"gituclinal clunes founcl in the vicinity of Qinghai, central china
PER
o 1oo 200 l@ ¡00 H
l-,-+çl-È_U0 100 200 100 ¡00 xM
A Great Sandy Desert
B Tanami Desert
C Gibson Desert
D Great Victoria Desert
BR IS
N
.I
ì\
Spnngs
Figure 2. The continental system of Australian linear dune fields.

o too aoo
/)'-.lN
.? \Ir
¡l \ Au
¡o
to
zI
t'
\'E-
t-
IIl" IIr_Fo
-þ'N
Cap Jby
Ircpc
,o'w
to
t to'E 20'
Cilllol
I
,1,i
jfiI
30'
II
,ùi
lrrft¡lIIt.d(I
- 'r74t
I
III
ù
r$
--I
¡ aE
II
a-..
III
III
a tIt
ItI
Y
E
ç !I +t
Figure S. A) Saharan and Sahelian linear deposition and deflatïon feature patterns
as ãerived from satellite data. Dashed lines represent what are Presumably deposi-
tion features, and sotid lines represent what are presumably deflation features' B)
Saharan wind patterns based on satellite data'
t-
::-

a
N
'4
,a
=?t."'¿
ù
--\.\
¿
Figure 4. The Àustralian cont¡nental arc of relict linear clunes and an approximation ofthe mean trace of anc¡ent summer anticyclones (surface high pressure systems).
J
\
.,,
Figure 6. Prevailing winds of thc modcrn surnnrer anticycbnc
ISPRIGG, lesol

4 U I mile
1
l'tl
,/
(rl
ir 'i..) ¿
^(r
,
ti\Tù
I
*,Á
)
llI
(^:,Iì
LATE FâOAIT \."$
\ I
)/l
ISPRIGG, 19801
Flgure 6. present ¡rrevaìling winds, as ìndicateri by the thick arrow, freshly forming longìtudinal
rlunes on the northeastern shore of Lake Frome. The forming dunes are greatly dìvergent from the
preexisting ones.
\AI
:;ùi¡iË .p-F=- -:'
Plan
[BAGNOLD, rOltl
J/
Section
A E
FlgurcT.Longitudinaldunewithshiftingcrest,Arrowsarestormwindvectors.

Plan
(b)
A
A9
s
(el
lcl
Plan
cB
A
B
(o) s
g -...+
III (dl s
I A
,s
[BAGNOLD, le4llI
Flgure 8. Transition from barchan to linear dune as a result of bidirectional winds.
ù
tYtJ
\-^
Ur..i
I..
t-Sectlon
[BÀGNOtD, 19411
\)
J
,:J,,lu1.Y
.::
,.J:;ì
\-.:i.:,, *)
D
Flgure 9. strips of fine sand deposited during a storm and the hypothetical secondary circulation

r{Plan Section
IWIPPERI\,I4N, t9691¿, l!,
B///E
A
Figure fO. A) Roll vortices anrì longitudinal dunes. B) Roll vortices, longitudinal dunes, soaring
birds and longitudinal clouds or clouclstreets'
IRI-lI]lN, r9851
Figure 1la. Laterally stationary rvindrift-type linear dunes. llere clunes are presumably
aligned with mean sediment transport.

IRUBIN, t98sl
Figure 1lb. Linear clunes that cause dorvnward scouring during lateral migration' l)unes
.*"not aligned rvith tnean sediment transport'
IRUI]IN, 19851
Figure llc. Linear dunes that neither scour or clirnb during lateral migration

uìtJBlN, 19851
Figure lld. Linear dunes that climb at a slight angle during lateral migration
IìUBIN, le85]
Figurelle.I,inearclunesthatclimbatasubstantialangleduringlateralmigration

IRUBIN, 19851
Figure 1lf. Linear dunes "that accrete vertically without migrating laterally'" Ilere
dri", .." either alignecl wittr sedi¡nent transport, or deposition rate is unusually high'
IRUBIN, 1985]
Figure l1g. Liuear dunes that both accrete vertically and migrate laterally.

135'oo' 135?o'
23"6r
2525IFOLK, 1e711
Flgurc lZ. ..Tlacing of the northwest corner of Mcf)ill's topographìc sheet' showing dune trends
typical of the central Simpson desert. Observe the fantastic parallelism of the dunes, and the
systematic opening of the tuning-fork junctures üo the SSE. A count on the original map showed 8lout of 83 junctures opening to the south."
S¡l! I (o
Scolrr
Widlñ ¡n M.tr.troo 200 300 {oo
SllrL INSEI
Sir. I
S¡ tc I¡ o
\
s
zoi.g
,oEÌ@
IMABBUTT and SULIVAN, 1968l
Flguro lS. "Dune proflles in relation to junctions as shown inset."

Plan
,l
t
Irs
ft
17o
Plan
v" Ío
F2
I
l7o = velocity vector of the ambient
flow relative to the shiPs' and
f" = velocity vector of the constricted
flow relative to the shiPs'
Él > Y"l
F¡ and F, = no.mtl pressure gradient forces,
Po = ambient fluid Pressure, and
P" = fluid pressure in the region of contricted flow'
A
4P"
PoPo
PolP"
B
Flgurc l{. A) Flow around ships travelling in parallel. B) Pressure ffeld and normal pressure
gradient forces upon ships travelling in parallel'
Sectíon
IBRUNT, 19511
a
I
Flgurc 16. "Circutation in the Bdnard convection cell"'

Sectlo¡
Coldp
lron
21456Eo¡l¡o¡tal dtrtancc (Lm)
.tù
,t
¡ìþ
I
tt!:
'{
'l
ïI
I
,
iIGRAHAM, le33l
Flgurc lO. Smoke chamber for the <¡bservation of microscale roll vortices' The convective fluid
tayir is between the hot iron plate and the cold glass plate'
2
I
fl
Ë
IN
F¡fÁÐ'õtr
0
789x->
IKROPFI and KOIIN, 1978]
Figure 17. Wind field over an urban topography simulatcd qsing f)oppler radar data. The
win{ is {irected orthogonally out of the plane of the paper, towards the vierver, Note that the
wavelength of these roll vortices is approximately twice as large as ustral.
Return
t-11-I
\
\ I ¡ +r+¡lI f ,r..r.*,I f t.- -ttú,/r/K'l +r,. . ! r ll?,t, . | { llt".- .ttlIttar-
etJ { !.rî ì r*.* Ft J ! t t .
¡ Êa- ? , . y ì
I IIII
IIa

,q
Þ?.o
IE1ñ
o5E
o. r.o 1.5 2.O 2.ay' km
3.5 4.O 4.53.0
2.O
E!
N
t.oIBROWN, l98ol
2.O 5.5 4.5
I' km
Flgurc 18. "Theoretical secondary flow parameteni, stream function ty', and lateral
velocity u for latitude 45o, Ekman depth 6 = 400 m, Us = l0 m/s, and ^Rc =U06lK - 486, where I{ is the eddy viscosity."
€Wind
Hodoqroph
IBROWN, l98o]
05 LO 30
t.,
11
p
(
A
B
c
-.o2
.o4
oû
.o2
.o812
.o6I
to
-.04
Ó)
-.o35
vlUg
.o36
02
Figure 19. 'I'heoretical secondary flow in l,he planctary botlndãry layer

o
T
I
I
I
|-.
SrrtiooerTro¿lã
Orohr plúric
Sectio¡
Slor, 2 m
?!! od
200 @ ---{
chmbcr
¡i
hFlo¡r
Cammtrci.i0¡3¡dl
IFALLBR and I(AYLOR, 19661
Figure 2O. "schematic diagram of the rotating tank and mechanism"
Section
r -1r = can¡ster radius
7cm(r!22cmplexiglass tube
turntable flIl = fluid depth
rlIIl4r
brake plexiglass bottom plate
brake ring
clutchrotation rate
measuring device
motor
mounting plate
level adjusùment screw level adjustment screw
ulonsT, leTobJ
?
PUP
I
Figure 21. schenrat,ic. {iagrarn of t,he rqt,ating canist,cr an(l lllccllanisnl'

1l 2Iaaa aaa aaaaa
¿o6O4.-
a ab.- a_u4s - 'ol
.a-o3 4t
[wIPPERMAN, l96el
Flgure 22. Axes of the two mutually orthogonal sets of roll vortices. d¡ E zlxes of transverse
rotl vortices, and lf¡ = ilX€s of longitudinal roll vortices
a
[IlORST, loTobl
Flgure 23. The formatìon of spiral sediment bands by roll vortices.
e
!o2
r

C
¿ta.
o.å
o
3¡LL¡¡
o6 o., or o.9 r.o
IHORST, leTob]
ã = l3oll' ãl¡ = lSoll'
ø:experimental value of the angular difference between longitudinal roll vortices and the mean flow
c¡¡ =theoretical value of the angular difference between longitudinal roll vortices and the mean flow
äf =* inwIPPERMAN.
1¡ =wavenumber of transverse roll vortices
¿Iv :wavenumber of longitudinal roll vortices
Flgure 24. The ratio of the measured to calculated angular divergence of longitudinal roll vortices
from the mean flow as a function of the ratio of longitudinal roll vortices wavelength to transvetse
roll vortices wavelength.
i

,Sectlo¡
V¡
.- '. 'r.:,:, ..'l : .::.i j.i'.;'."1,'.1
A.
l"
c
c
BIt
dune.i ',
unconditioDal stabilitY As the vortices shift to the left at rate
l7r, a force /] towards the left is exerted
by the right-hand side vortice upon the
right-hand side flank of the dune.
D
The roll vortices shift back towarcls
the left al ratei2.
Figure 26.
A
Sectlo¡
unconditional stabilitY
l7l --.
B
......:
The roll vort¡ces continue to shift
towards the right.
D
As the vortices shift to the right at
rate fr, a force /'¡ towards the right isexerted by the left-hand side vortice upon
the left-hand side flank of the dune'
conditional stabilitY
%..t;
i:.
E
) Lterorlgln¡l dunc
disruption
Flgure 20.
unconditional stability

otlo!þ
o
ra
¡IIL'lYI
E
ot¡lt
o90
oa3
ort
oro
oott
aa
TIIE¡J'
L
aatax
E
¡r
ùtlr
20
ta
¡a
t.a
t2
to
olotoa
o2
roE-ol
tg¿-ot2 roc -ol r0c +oo
FREOUEÎICY III HZ
toE- 02 roE - or roE.oo
FREOU€IICY ril ltzoiþ
oat
oao
o!5
o¡¡o
o2!
o20
oltoro
roel0r
roc -o2 roE -o ro€ +oo
FRcorr€ircY rlt HZ
108-02 roE-or rof+oo
FiEqUEtlCY rf't HZ
oot
oooro€ -cEl roE +0t
tc+ot
ro€ -o! to€+o¡
rc +ot
ILEMONE, 19761
¡(,o
ooza
og¿2
oo20
oor to ora
o ola
o.ort
o oro
oooa
oooc
oooa
ooo?
ÎLa¡¡$ oooor
ttoooo"5
o(þta
ooort
ooora
ooor2
oooþ
ooooa
oooot
ooooo
5Þ
ttll
tc-ot toc-o2 loc-ot rG+ooFRÉOUE¡ICY IX }IZ
I oc -ol
Flgure 22. Spectra of velocity components of u, u and u (roll coordinates), temperatl¡re f'anã absolute humidity po from the NCAR Buffalo aircraft flying normal to roll axis at l0O-170 m
above un¿ulating terrain, near llaswell, Colo., meteorological tower. Airspeed 70 rn/s. Spectra
computed from 5 min of data.
u
T Po
Sectlon
Flow convergence and divergencejunctions are perfect.
Section
Convergence and rlivergence zones
are zones of apparent fìow decompression
A Ideal rectangular circulation B Elliptical llow
Sectloaac)
C Turbulerrtetìtrainnlent
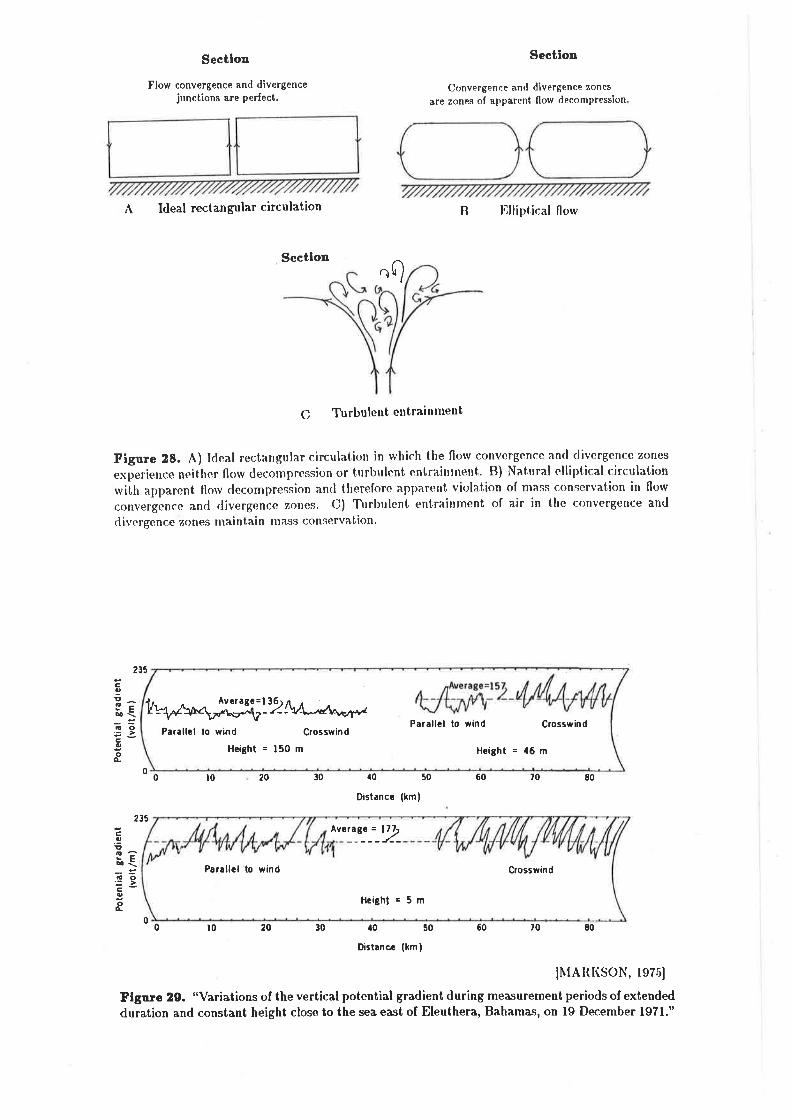
Figure ZB. ,À) I{eal rectangular circulation in which the flow convergence and divergence zones
"x[eri"nce neither llow deconrpression or tttrbttlent entr¿inntent. B) Natural elliptical circulation
rvith apparent florv decompression ancl therefore apparent violation of mass conservation in flow
convergence and divergence zorìes. C) Turbulent entrainment of air in the convergence and
divergence zones mãintain Ina^ss conservation,
t0 20 ¡10 50 70 80
Distancc (kmI
20 ¡10 50 ,0 80
O¡slanc¡ (kml
[NfARI(SON, le75]
Ftgure 29. "Variations of the vertical potential gradient during me:Lsurement periods of extended
duration and constant height close to the sea east of Eleuthera, Bahamas, on lg December lg7l."
?35
Eg!
oi-=ao'-zCOoo-
c.9!o=d\lo:>E0oA.
0
235
0 6030
06030l00
1&þAA.#"./,rü t-t 2 [*-u*gParalhl lo wind C¡osswind
Height = ¡50 m
Parallcl to wind Crosswind
Height = 46 m
Parallcl to wind
HeiShl = 5 m
Crosswind
Ave:'::_2

;E=or:ÀEJ
400
00
0
l0
l0 20 40
50
50
60
60
4020 30
D'stance (km )
30
Distancr (km)
o.ì 85
;:tso=É1
6s
Figure 3O. "simultaneous records of the vertical potential gradient (A) and relative humidity(B) showing correlation. Data were obtained at an altitude of 16 m over the ocean off Eleuthera."
cloud streets e¿f
A
O.d., Ð
€)'
longitudinal dunes 3/[as modified from LEIr{OND, 19721
plan
ioto = vector of the geostrophic windc-= vector of the plane's motion
c ,<900d+e=90oc- l3o
Figure Sf . A) The relationship between geostrophic wind Ío an<l roll vortices. B) Thc orientation
of potential roll vortices during strong winds and the crossflotv direction for observation flights.
v
B
b
0
q"
r'o
A
B

=ã
ÊJ
l{U
VU
É.
8FäE
x Ê
É
¡l5
^¡+
ô
riåp
ã f
-ô-É
-Y-.
Èj-ã
.ãi
' ::-
\t +
r :i'
ão-
å-:
ØÐ
X'
Èi¿
J4
ØO
fl'ß
ort
xäñ
ö :€
X >
Q ã
Ë ;'
r* o
-Ø
-^õ:
< Þ
N^i
.{ i 1ã'
€-
z7-il
a
ìI^
ll t
: >
ã{
ãú_s
I F
.oå
EF
- É
rE,
-?
ã'1
ã¡
=P
É! 9=
tlt<
1
-.8
!ìã
='
or5
iãe
Eoi
vãâ
, I
-.-;
/F
9Ë 1¿tl
ô<ã
toÐ
Ø =
+Y
Oã
Pãô zË
'¡Þ
F'Ë
-*-
E t Þ
Q¿
Q¡
ré tÉ
Сl = 0t
¡öÉ ãf
l Þô
FC
'X
c,o f> äv Ù
Q Bõ -= è, c
-
voQ
g:
(r,
å*
ll:.
Iè)
9 T
OF
J 4+!a
=
9E^: ã^/
ä'E
=
aÉ
3'5
O.
-â-
Í.ò Øâ
ô; ?3 ê, f. H o ô õ'
f-_
n/se
c
Y rVsê
c¡y
'sec
TT
Iw
r3
Li.L
Li'
a-xi
s of
not
enti¿
l¿
- -
-lo
ngitu
dina
l rol
ls
- o <L ã z = 7- ÈL ã s f. a b
- rt z -trJ \¡
¡i t Ë
q¡ol
¡eur
pnlr8
uo¡
¡cr1
ua¡o
d ¡o
s¡x
e

A llight direction
platinum sensing element
Side Rear
IF\ 72.
supporting struf
flow-7
supporting struts
flight direction
\
aspiration holes I
RearB
platinum sensing elementsupporùing strutSide
supporting strut
flow
tubes
exhaust tubes
[after RODI and SPYDRS-DURAN, l97ll
I
Ij
_r
L
Flgure S4. ^)
Reverse-flow temperature probe. B) Improved reven¡e-flow temperature probe.

.t\o i
I
OELAIOE
\\n
[after TïVIDALE, l972aldunefields
I'lgure 36. Simpson f)esert, Strzelecki Desert and environs.

I1.2 km
continrred next Page
l.l km
lmplied <limensions, such as dune width,are approximate.
Ë lo'J
Section I
- 0.5 km
- 0.4 km
- 0.3 km
- 0.2 km
0.1 km
,L' ..1,.?.''-i'¡.,{t.:¡lfá::í;.:i.
'i;sectionstudy
longitudindune from thto - 0.1 km
50
N
ii{i * vegetation
,:t',jji,'
ii'# Peaked summit
rounded summit
¡í9" avalanche slope
small trees,#,
clay flatj ',t,
l"i r'-"1."..;:'
.. lr'r .a
liv
sandy, grassyrise in flank
Flgure 3O. Plan-view symbotic representation of süudy lincar dune dcpicting salient geomorphic
featr¡res. Due to insuffìcient information, the outline of the e¿stern dune flank in secton I is
above the base of the dune, and the peak of
is perhaps the highest point along the dune'
dune at - 5o, and at point p2, the dttne base
longiturlinal axis of the dtrne shifts towards the
.2 km south of the dune heacl'

1;',¿.,'(i'
Beyond this Pointt,he dune narÌows.
Section
Planef
2.5 km
2.3 km
2.1 km
- 2krn
1.9 km
1.8 km
1.7 km
1.5 km
1.4 km.?.i
- 3.0 km
- 2.8 km
- 1.3 km
track
2.7 km
Plan
oo
oo
Qo
o tt, t
oo
.oo
oo
II
crestalsummit
ephemeralavalanche
faces
o oo
o.n
.:r o r:lÐo
(dÊ.
.i. .i. .i.
. r'¡:',':' I f'!'t ':'
subsidiarysuntmit
¡'-i .r-r:;r¡r
\tra \o
(Ë
Ë\':'9
contour lines indicatea height difierence ofabout half a meter
4m
rd,Þ.t.. ã.2,
o.oq.
È'
o
o
À
È .)
N
. stakes plantcd on December 8' 1982
o stakes planted on Deceurber 10, 1982
'i' stakes planted on December 11, 1982
topographic contours sketchetl on l)ccc¡¡tl¡er 10, 1082
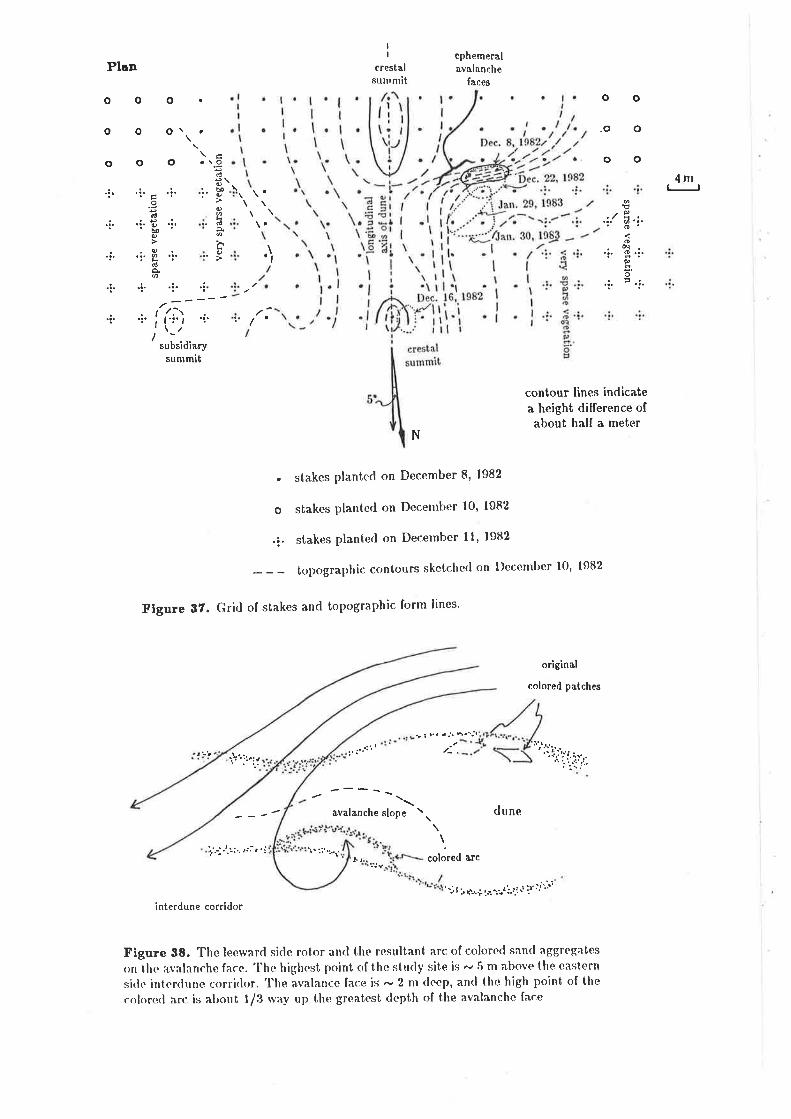
Flgure 37. Grid of stakes and topographic form lines'
original
colored patches
r 3 r.. ¿ .'. .\.{,
:' i"': " I /_.
"tìïîri..-,,,
\ \avalanche slope \ dune
i;.-;J.::..,r:. '; 'r.::'.b.r'\
colored arc!.¡
'::l i *-,i,r.:i.i.r.i J ::. :j"i:
interdune corridor
Flgure 38. 'I'hc ìeewarrl sirle l'otor arrrl I,he resultant anc of colorcd sand aggncgates
on t,he asalanche face. The highest point of the strrrly site is - 5 m above the castern
sirle intcrdune corrirìor. 'l'he avalance face is - 2 nr deep, an<l the high point of the
colorccl arc is atrout t/3 rvay up the greatest depth of the avalanchc face

¿-
---> 1
gust occurrence
; 500
SectlonE
dune
Plan
-l0m
ji N
N
A: :' ::,i.
¿
ôRô
:.'dune .
Pla¡
.:'dun"l
3
Figure 8g. I(ite and ribbon configuration believed to indicate a windward side
roiár. Mainstream wind in all frames wa"s from - 22Oo SSW. Mean wind speed
was È l3 knots, and gust speed was )15 knots. Time for all frames was around
5:00 PM, Dece¡nber 17, 1982. Exact angular orientation for the ribbon in the plan
frames is unknown. Kite cord length was -,50 m. symbols as in Fig. 37

Sectlon
- 30o - {0o
ì,*1::'{ lr:{ìq.:,.-.,:..:..... ':.:dune
-l0m
nroderate winds
Plan
N
- l00o
U - l80o
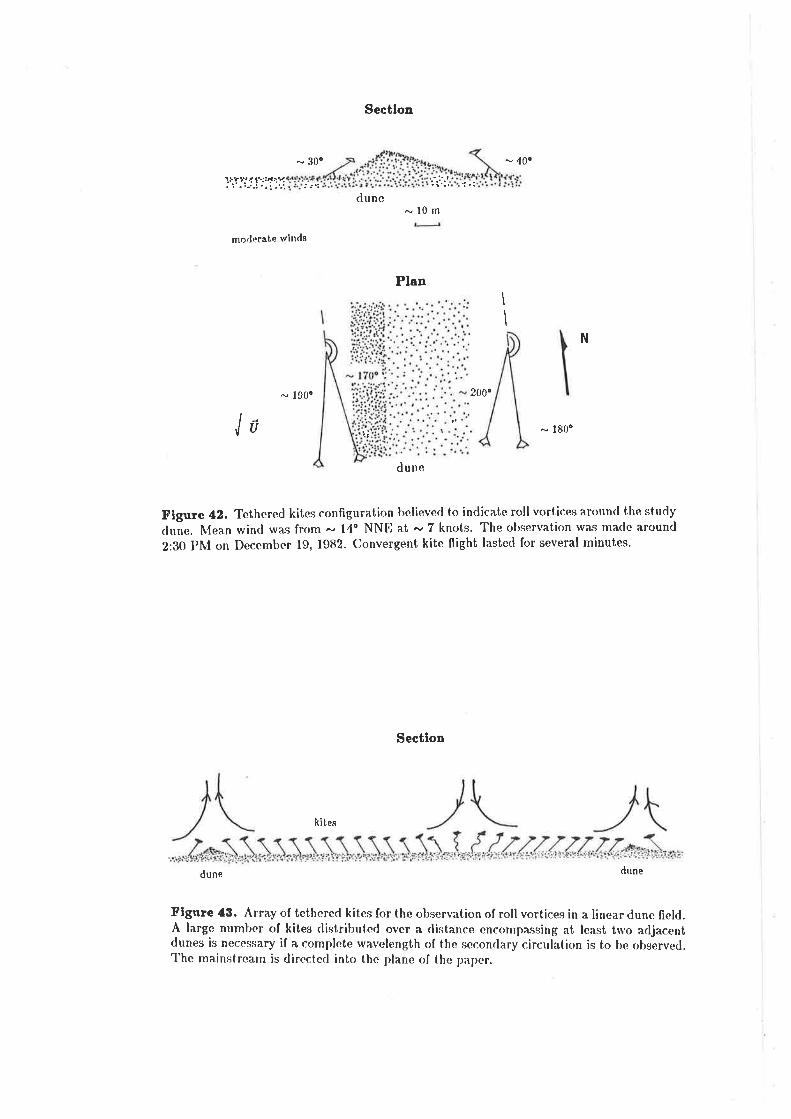
Figure 42. Tethered kitcs configural,ion bclievecl to indicate roll vortices âround the stucly
rlune. N{ean wincl was from - 14" NND at - 7 knots. The clbservation was made around
2:80 PN{ on December 19, 1982. Convergent kite flight lasted for several nì¡nutes.
Section
ki tes
dune dune
Flgure 43. Ârray of tethered kites for the observation of roll vortices in a linear dune field.A large numt¡er of kites distribr¡t,cd ovcr a clistance enconrpassing at teast trvo arljacentdunes is necessary if a complete wavclength of the secondary circulation is to Ìre observe{.The nlainstrcam is dincctcrl into thc ¡rlane of the paper.
\
\
200è
/
dune

kite will not staY uP Seetlon
dune
Plan
kite will not staY uP
- 45o
' "
t.j¡ -,;...):r: I .:...,-!
- 40o
-l0m
- 310'
-20o--40"
f'J
- 20"
À
-l0m
-280o - -310o _3200 - -g401
unsteady flier
- 30o
10"É3-3400'-3600
hypothetical streatnlines
Figure 44. Tcthere¿ kites confìgurat¡on bclieved to inclicate quasi'laminar florv over the
,t,irv ¿unn ¿uring oblique w¡n(ls. Mean winrl wtus from - 160o SSll an¿ at - l3 knots'
'IheobservationwasmadeduringtheafternoonofDccenlberl9'1982.
Sectlon
- 30o - 43o- 25"
û
:{t
dune
N
\
ì
- 330o
- 201¡o
Figure 46. 'fcthenecl kites confìgurat¡on believed to indicate qrta'si-larninar llow over the
J-u'.ry a*o rlrrring oblir¡rre winrls. I\{ean winrl was from - 1600 ss¡l an¿ at - l2 knots'
The observation wis ma(le at about 9:30 ÂN{ on f)ecenrber l8' 1982.
- 33.1o
Sectlon
9-¿O- 85' ENE
oo
U a
a
l0m
N
t
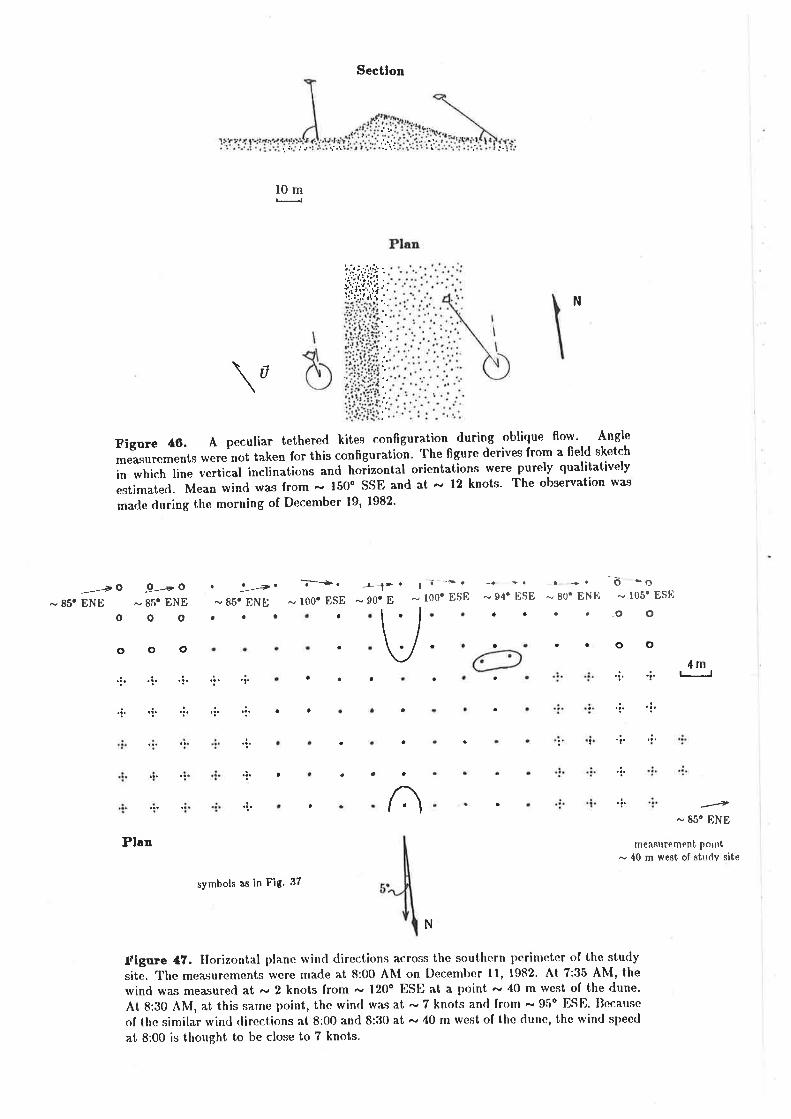
Figure 46. A peculiar tethered kites configrrration during oblique flow' Angl.e
measurements were not taken for this configuration, The figure derives from a field sketch
in which line vertical inclinations and hoiizontal orientations were purely qualitatively
estimatecl. Mean wind was from - l50o ssE and at - 12 knots. The observation was
made during the morning of December l9' 1982'
',.',,: ..'.r:i': .
iì'..'ri.:iÍ:
:'
,,
__-->o- 85' ENE
o
. . _-Z'.
- 85' ENEaaa
ì-->. J--l- .
- 100' ESE - 90'E| õ ---. -.---.
- 100. ESE - 94' ESE-. -'. O -O- 80" ENE - 105' ESE
. . .O Oa
tooo o
aa
a o
{m1l
-"=+- 85' ENE
mea"strrement porrrt
- 40 m west of study site
a
a
t
/lPlar
symbols as in Fig' 37
N
.trigure 47. Ilorizontal plane rvind directions across the southern perilììetcr of the study
site. Thc measurcments were made at 8:00 Âlr{ on Deccmber ll, t982' Ât 7:35 AM, the
wind was measured at - 2 knots from - l20o DSÐ at a point - 40 m wcst of the dune.
At 8:J0 ÂM, at this same point, the wincl wa^s at -7 knots and from - 9,'¡o llSFl. Ilecar¡se
of the similar wind <lircctions at 8:00 and 8:30 at - 40 m wcst of the dune, thc wind speed
at 8:00 is thought to be close to 7 knots.

Plan
- *5"o
- *5o
- tl3ooo
- +l0ooa
- *l0oaa
a
a
- +9caa
- *5o -0o --4o -0oa
I
-0'
a
a
oo
OOOr. a .,OO
a
aa
oo
.¡.
o
'¡.
oo
.t.
't.
4m
aa .¡.
a
- +5'
+
measurement polnt
- 20 m east of study site
Sectlon
4mLJ
- +90 -*5n -0.
_0. _0.
/lsymbols as in Fig. 37
N
- +13' - +10' - +l0c - -4'
6m
:--' j .''
- +5'
: ' .:.- ' -
measurement point
- 20 m east of study site
Flgure tt. Vertical plane direction vecton¡ of llow across the southern perimeter of sturlysite during oblique winds. Measurements made at 8:45 ÂN{ on December ll, 1982.

,{
trwE
(o
(,l
oC't
-l
CN
gl
o
o(¡
qtl
o
'l
ïII
II
ú
Ð',
p
-4m
Ttial I
Sectiou
slow
E w
fast ¡""¿ faateetmoderate fast moderate
5m elow
4m
Figure 4g. Relative wind spced nleasurenìents across the southern perilìleter of thc study
sit,e. N{easurenìent.s taken at 8:30 Alr{ on Decelnber ll, 1982. lr{can wind rvas at - 7 knots
and from - gbo []SE, making it ahnost pcrpenrlicrtlar rvith respect to the stucly site's
l,r¡rgilurlinal axis. 'l'hc ancnl.¡r]reter rvas helrl at a lreight of - 1.4 nl. The range of win¿
*¡r"",t, for each trial is stlnrrnarized at the far righthanrì sirle of lhe taþle, an<l as a general
iilrrstration of rvi.rl spccrl variat,ion, thc resttlts of of 'lrial I are shorvn in rclation to a
scc.t,ion of the dune in thc loruor portion of the fìgure'
rvalking
fromlower flank upper tlank cresl upper tlank lower tlank
DtoWTrial I
oo{
ilE
Tooo¡tÞo
Føoo
ÞÐ
D'0
lloCLo|lpo
!o{
\!toDTrial 2
oo4.
IoÈo¡tPo
to1.
IoÈIDãÞo
IoÈoIÞo
DtoW
Trial S
go{
òo(
øo{
Ioo@
Db
ooonIo
Þo
Eo{
WtoDfial 4
3oo.ôÈtÞr!
Þhoq
ãoooãIô
doÊo4Fo
aoI
DtoW
Tnial 5
oaoIÞo
!tbÉ
JoÊ.oIÞo
fb
fboÐ
IoÈorlÞo
3oÈo.lpo
Wtolù
Trial6
3oÈoãFr!
øot
øo{
ã3& F&ô*oiôaóoÞôô
!toÈoIFo
ÞoÀôãFo

wE
//
t
tÞ
Plau
inlerdune'.'corridor : .
flou'divergence
. tlank
flowconvergence
intertlunecorridor
Figure 6O. Ilorizontal fìorv divergence/convergence pattern over the stucly linear dune
Section
'r. '.j '
t{r
A
a:l
Section
:.'.' : i'.:.."'j'.:":
Figure 61. A) Streamlinc during oblir¡ue florv incirlent upon the broacl llank of thestrrcly dune. Maxirnrr¡n rr¡rwarrl flow cornponent occurs jrrst to winrlward of thc crcst.B) Strcamline during oblir¡ue flow incident u¡ron the avalanche flank of the study dune.Nfaximum uprvard flol conrponent occurs just to lecrvard of the crest.
B

5lÉ6È
o 'i.
-i. .:.
';'
5l.:.\
8o)ot.a.Ê.
t.l'+toìo
t.ñ{.:.l.
r..;.
t.1.T.
rù.¡.
t.i.
\.¡Ê.'i.
f,.!.
1..
S.l,
ì.i.
+ ':'
t.;.
+':'
ìl.:.
[.Sr{.l..{¡tfrta
t.i.
!. -;.
R-i
\.:.
l.1..
t,t.
€
E
UOìoer.
1.
Ir lS
¡
tr to
€.. f.!.e
T.
ì o I-i.
Bo \.;.
Ê. ì.:.
r. ì.:.
oo
.{I=
ô¡emr^ g)
!rÌ=:àL=
a)
=g
cr: âo,-4,àac_u3+
.Ëi>É --
c 7.¿Ã
-!ll'ao ¿
qla
@C
ô-
ül 9.nãò¡-
-oo.9'c-'E
:r1-.? ç
!n4 i
UX
Yê-=
e)
<9c
cq-9^ro g>o ic-tctOo0-
€i[ te
oo'tI
oo
ooo
o0o
cÈ
aO
.^E
.nì
-ñ
.:^ ^r .9
^l^r .9
b8 õ
¿úl
:;o E
a ¿
di G
.-o=v
E?
E?
Êó'r.
=.;
=c¡c
:q -
ãE
ËS
é
-9 -.9.
=Z
-= é-=
=
õøñØ
!:Ø
- Ø
!
ôì c)
úÊ-ÈD
:Loa3.E
+=>-É
tu=z "t)
ë¿L i-l
ùû{o¡Ê
æ
EÑ
OL
\-(;
r Ç
=:i<
>
oã^:¡ô=
.YZ
-oÈ
f¿
haáLñ il
'¡o* ã.¡
åi -ôh90
oc:; .; U
?
!ro¡t€¡>
eño
coË'ìÍ
a
Þo=
ccC
ã(c
c!
o .i.
.i. .i.
-:' 'i'
l
l'IIl.II\rìIl'Il.It\.
.:\ .¡,\
\.:. .:.
\'\
' tl
I
tì
\ ic; t,'
a
I'r'
t.¡ ô¡
r -i*cooè
c.o
l.'E r.
o
a
t
z\
Ez
t.l
t¡S
. Ê
.¡ T.
t. S
.¡ ì.
l. l.It
aa
I
ì. s.
Ê.. ì.
ê. 'r$.
.,1
-r. +
+ +a
rf . T
. 1' ì.rh1
ì.t
lIIII
\_----ra
tt\+
Fç)titt4dc3
a
aôo
o=
'=B
co ad'-=
o>=
¡C
e.P
õ
hqñbo
14qo-Ê;
I
o\'A
r'
oo
\. ì.
ì.
\r 1.
)'a
a
-:. .:.
.t. .a-
.:.
:. .i'
.i. 'i.
';'
o .:.
-;. .i'
':- ';'
':' ':'
':' 'i'
'i'
.;. .:.
':. ','
'i'
ì. \.
l.i. g'.i. ì.:'
\.i.
t'¡ I o \':'
I'i' I'i'
ì':'t
+)oìo
soìoIo
ra -:. I
.:. ñl .:.
¡.1.t-
a.i- \.:. ì.:-
î{.:. \.i. f .i.
r':'
r..i.É6È
te 10

o
o
o
\o o
O\ O
Plan
o
Pla¡
O1i\
. -/.---> . r... t .!, .:.\ .:, 4mlrìI
\
.i. ¡
sand ev¡r.cuation ) 25 cm
approximate contour lines
symbols as in Fig. 37
's-' ':' \
o
o
o
N
Figure 64. Deposition/erosion pattern over the stucly site for f)ccentber 24, 1982 (8:30
nU¡ t" February ll, lgSA (6:30 Alr{). Southeasterly winds bclieved to have prevailed
during the observation interval.
o \o\o o\
oo
\
4mfl
I
symbols as in Fig' 37sand evacuatlon ) 50 cm
(great erosion)
sand accumulation 2 50 cm
(great deposition)
N
Flgure 66. Deposition/erosion pattcrn over thc strrdy'site for l)ecernber l'1, 1982 (3:1,'r
Plrt) to l¡cbruary tl, 1983 (6:30 Âlr{). South southcastcrly winrls belicved to have prevailed
during the ol¡servation interval.
¡^

o o o
o o o
.i.
-i.
'i.
'?'
'i'
o o lol
I I )
1 à f u -¡
fú Ê Þ
,ì { 'l :rl
lr :õ 2. I
g. ê
toa 69
. a
Sô :ì= Êr
Ê,
U
a t I
o! =o pl =o do ir k6 C,¡
-
@Þ
cD5
a¡t ô o P o
/
=.?
=îg
aÇ:-
- _
¿
- È
vl
='e
=Z
a=--
-Å-
Ò
q _2
+
: Ë
: f
=l
¡. Ë
t ,ó
=19
ã'5
=!
>g
¡r -o
=
=:"
3af=
F
€<
=.,
I ?¿
ã 1
r 3.
=¿
3 =
Z i 1
E ?
'=-
=.>
,4G
=p:
=x
3:t
?: q
'Ê.æ
+=
'i=-Ê
--ã^
5'::.
iÉai
s!É
ìo=
d=á-
-:=
zlË
i i F
;i.È
ãî=
'1^=
=9-
iJ-^
vP
]:Ã-'v
a ã!
='Þ
J åa
.ã
,--
-z,
t=--
=7a
á 1
_.
6 -1
Ò =
î*î?
zë.?
.3?
T =
ã?
e =
'9=
.Ð*\
2Å'a
l+=
--
€ ^;
J
- -
7--"
Ñ
¿5
^ ã
_=2^
Ø-Ò
u)t
= -
¿
ô-¡
-+
:, :
vt.a
4l
s
a7,ë
=2*
úai
=o
c -
r=<
'' o
f ô-
=o
ã'Ø
==
3 €
=i
= ä
o f
P o
q ?
¿--
øá=
2.=
.Llro
'r-
"x=
?='T
ã'?
Fó
27,
9. =
'=.1
s-;'7
-*îõ
'c^
!¡
Ð
':a
3 Ð
i---À
=-a
ó2=
fíã?'
<=
!1
=
-'<
+!-
sÒ--
îráç
=âl
='
sãlii
aag
; o
ã *?
-¡
ðe
â c
ê, ¿
-â
a^
rl;€"
7FãË
hd I F
a/'i
- -'r
.
a-¿
a
.---
---')
a
\ \
a :\
\'Q
¡
\I
'2'
-úal
)
.!a
a{
)
z:.
.;\
-)...
.'--"
'a
) \
U) :t êt o o { o o - q o N o
\o
l\
--
_ )
\O
O
'v/o
[;

Plan
ooo\
O O rO
o
o
o
':'
,z]o or
\4m
\
symbols as in Fï9. 37
sir,nd accumulation ( 75 cm.
December 17, 1982'December 22,1982
4-3 +l +6.aaa
+l -4 +5 +2 +3'a a a a .
avalanche face
I
sand evacuation ) 75 cm
JanuarY 14, 1983
Janrrary 27, 1983
-l -2 0 -5+7aaaaa
N
Figure 67. Deposition/erosion pattern over the study site for l)ecember 14, 1982 (3:15
fni¡ to April 10, 1983 (12:40 PM). South ancl southeasterly winds believed to have pre-
vailed during the observation interval.
. '.:;a:.'- "'il:;¿'r "':!",)i'
" ";a
:'
: ," .:::.;i!. r ,1;11.... irr.'{"
. r"..t;q..... trll..:' .'.t¡i;:,.¡ii.4ï":J:l:,,|i
l.'
Pla¡
+l -5 -l
,. -.Íl:ir
.'rrí:':i i.j
¿ .'.':i-.'
",',iitÌ'
t,. . ,'.'
.Vj: ''ll
ww
"rú V
\vvN
wv"8m Yl
úú
vl.tl fl v ltrl'q
gra"s8
shrubs
4v
+23
, 19821983
t7l,
emberDec
+qt2-l
-6
eroslon
Fe
-5
bruary
I
vÚc+
dep osition
w\,
Figure 68. I)cposition/crosion patterns
ncar thc rlr¡ne l¡ea<|.
v 11
¿:ul
+3

IPlan
o
l0
l9.\l0
ephemeral avalanche faces
meral avalanche face
I
a
8't
o
o
o
,¡.
o1l
o ao
rÀ
taaa
6
28.
6'
: .'.:.:'l¡:.:
a
/.
t'"
II
o
o
o
o
o
ooo¿
a
4m
.:. .:. .:, .:. a
I.:. ,:. .'.. .:. .:.
16 I.:. .i- .i. .i' ':'
I
symbols a"s in Fig. 37penetraùion ( 20 cm
LJ (highest degree of penetration)
Ú penetration ) 20 cm
D penetration 2 50 cm
O penebration 2 100 cmN
Figure 69. Fir¡nness of study site sunface as gauged l>y penetration pattern' Penetronteter
readings taken on December 22, 1982'
Plan
oo
o
o
a
a
24)
l5I
o
o
o
t(.
40
!.t'73
o
o25
o
ò/Io
o
\9. l5:
i.{
26 1
a
(--.€ -/6
a28
.l
4m
G
16
\
synrbols as in Fig. 374 ¡n--l
N I4m
I
l3l3ll5
r4
8 l0
7
7(l
Flgure OO. Firmness of study site sllrface on 'lanuary 30' 1983'

Pla¡o+4o Io
o
o
o'r/6 a
ìI
)
o*8 o
\
face
4m
.i. 'i' 'i' ':' 'i'
a(
3 't¡
A
o
o
o
o
o
o
I
I
+l9l .
/':'t ! '\:1-i'
':. I -_,,
s)'mbols a;s in Fìg. 37
O change in penetration ilepth<5 cm
f--l increase in penetrat'ion depth I 5 cm. ^'mness)(slight decrea"se tn ttr
Ú increase ìn penetration depth 2 25 cmN
DD
tlE
increase in penetration depth 2 50 cm
decrea.se in penetration depth I 5 cm
(slight increase in firmness)
rlecrease in penetration de¡rth 2 25 cm
tlecrea"se in penetration depth ) 50 cm
Figure 61. change in lìrmness of the study site surface as gauged by change in penetra-
t¡oi. nrr"*ment feriocl is from December 22, 1982 to January 30, 1983'
Pla¡ 0 -8 l7 +15
61 o o(
o \o\_oo
.,. \it.i- \
i<o
0
':.
a a
/ ':'
I ':,:
4m
I lr..'i1
-i(ri/'ilt'l
r2
II
I
.--l
./
\:l
symbols as in Fig' 37
N
Figure 62. Deposit'ion/crosion ¡lattern ovcr t,lre strr<l¡' site ftlr Dccclnl¡cr 22, 1982 (9:00
ÀN{) to January 30, 19'83 (l:55 Plrl). Dast to eastsoutlteastcrìy s'in<ls ìrelicvtrd to have
prer;a,iled during the obscrvat'ion intcrval'

'g80I '62 Ártnut¡ Puq U86I
.g.requrera6l uaÐ,r,lfaq lolouttlod uJÐtllJou e'¡ts '(pn1s aq¡ u¡ eEutql elqdurSodo¡ '79 ernE¡g
algord 9961 '6¿ 'ut¡ -- -a¡gord ¿g61 tg 'raq "" c ÁÀ
,<=la-.-"-'ï='¿--<"""
rVo1*
¿y
't
J - - -<'t'3t'-"-:-'-"Ð'i-: : r. - .= t.a -t'a'1 :':': ":"7''--'a {'ii..l,
lur í,EollÐÐs
(gg pu* gg ,Þg s'ElJ) pÐJolluotll sta,r aSutqr rrqtltrEodo¡ qetqa'r 8uo¡e sÐurl '80 ernt¡¡
N
¿S 'ålJ ut * s¡oqu,(s
¡tt
:.-
tv
a a
ir!v
0 o o
t
a
a
t
t-I
a
o
o
a
o
rQOOsg
ooooo
u'
a
tC
rgD
EBId

Sectlon
Dec. I, 1982 proflle
2m
,""'- Dec. 8, 1982 prolìle
- -- Jrn. 29, 1983 proflle
B¡
J
t 2m
wE_:-
Flgure 66. Topographic change in the study site southern perimeter between l)ecember
8, 1982 and January 29, 1983.
Sectlon
2ml-¡
crc2
I
c2
2m
/,/
sN
Cr
I
-læ------L.
Jan. 29, 1983 ProflleJ
Flgure 6O. Topographic change in the crestãl axis between Decomber 8, 1982 and Jan'
uary 29, fg83. Note that the crãstal topography seems to translate with minor ¿istortion'
In a southwarcl migration of - 6 m, the separaiion betwccn thc two sunìnlits increa"sc¿ by
only æ I m,

^B
PlauI
I
--è __.1--I
flow vectors
sediment transportvectors
Figure 67. A) Flow and sediment transport convergence in a zone centered on thewindrvard perimeter of the grid of stakes resulting in deposition. B) Florv and sedimenttransport divergence in a zone centered on the leeward perimeter of the grid of stakesresulting in erosion. Note that while florv changes linearly, transport changes cubically.
wooden stake
\s
rubber band -ì*
stake number
vaseline-smeared fìle card
EN
w
-t
dune surface
of stakes
Flgure GB. Stake with vaseline-covcred fìlc cards for sand collection during saltation.

green patch (half-exposed, Dec. 10, 1982)Pla¡ blue patch
,- l--.( .I
u
Lt'. t..,:.,,
L rjl'it
v1.tt
4.m
l. ooOOO'
ooo
ooo(
rrì
-l
IIra
iL
L
La
o
o
o
o1, 1
.\ -!
.¡ .i. /..
¡.
La
L
L
a
a
L\.t .!. .i. .i .i.l;/.f
.rl¡l
t
l.r 'l A !: .
!¡ ;r;.:
symbols as in Fig. 37
base trench
Iy-
lines normal to form line
dashed lines in the above plob demarcate regions
in rvhich colored grain aggtegates ìYere found
N
Flgure 6g. Distribrrtion of colored grain aggregates over the study site on Decelllber 16,
lgS2. Stakes with colored aggregates in the trenches excavated around their bases are
marked "L", The original colored sand patches were - 0.5 m X - 3 m x - 0.0015+0'005
lìr.
Sectlon
Flgurc 7O. Inferior ntiragc of a nlorrntain
optical horizon

2.2
2.O
t,8
t.6
l.a
s r.2
Fü ,.o
s.0
.6
.4
.2
-,t -,6 '.5 '.4 -,! "2T 'T3 ('c,
t
ROSKILDEFIORO
l-l- llñ
to
Plan
nrsl
[FRASER, lsl791
Flgure Zl. A) "O for Gershoj deduced from two different heìghts (marked
rvilh x's) plotted o ßive a single line." B) "A map of a portion of Roskilde
Fiord in Denmark. was on the shore at Risø." The target Gershoj (7220 m)
is shown.
Sectio¡
solar rays
linear dune
-_- PARABOLIC CURVE
-
stNE cuRvE__ CIRCULAR CURVE
-
S|NE.GENERATED CURVE
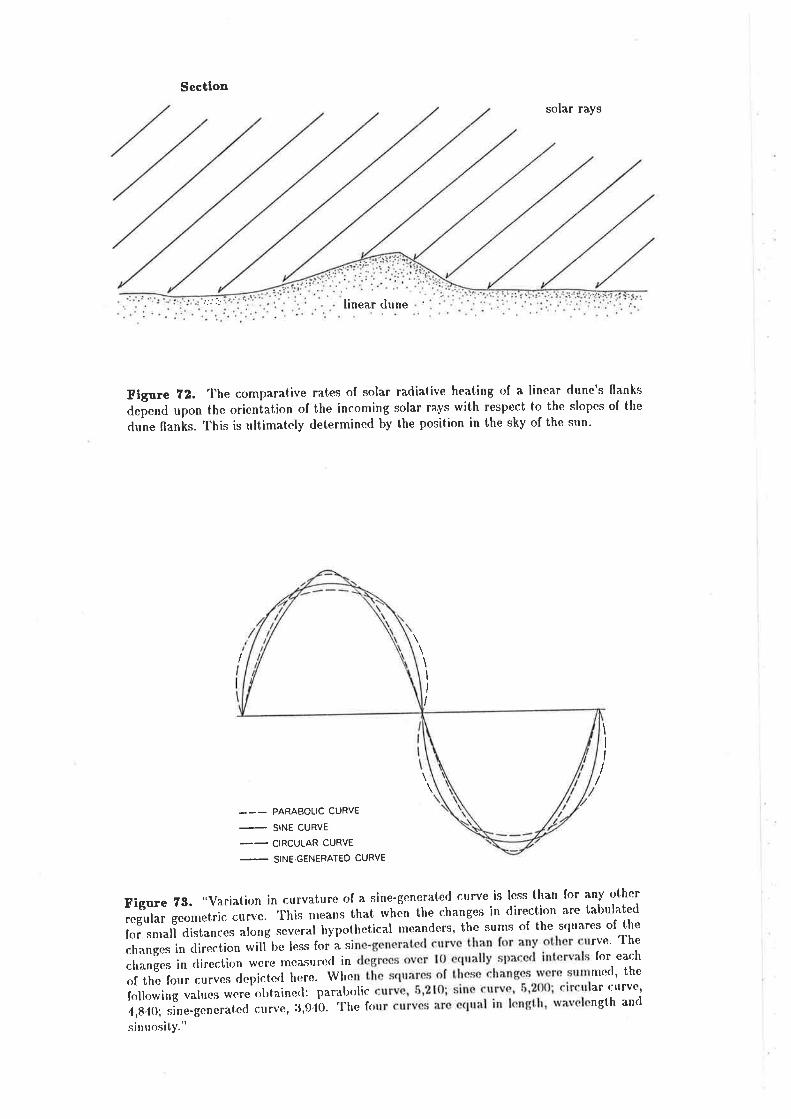
Flgure 22. The comparative rates of solar radiat,ive heating of a linear dune's flanks
defend upon the orientalion of the incoming solar rays with respect to the slopes of the
duìe flanlr. This is ultimateìy determined by the position in the sky of the sun.
\I
I
I
I
Figure 73. ,,variation in curvature of a sine'generated curve is less than for any other
regular gcouretric curve. 'fhis nreans that whðn the changes in direction are tabulated
for small ¿istances "tong
;o."1 ¡ypothetical nrean¿crs, the sunrs of the squares of the
changes in direction wilibe less for a si rve' The
changcs in dircction wcre rneast¡rcd in for each
of the four curves depictcrl here' Whe med' the
following valucs were olltainerl: parabolic ar curvet
4,8,10; sine-gencrate<l c,,,*, 3,9'l'0' 'l'he f( ngth and
sirrrtosity."
'|
I
I
I

Plan
Feet
050 lm
N{iles
30
It{ean rlown-valley
20 directior'
l,400
I,000
FeetÊ:l-l
t0
l5a
0
D0
III,,t
III
I I,I
III
V
26
b
0
c50
7526
0
Shoals
50
- Thalweg
100
ILEOPOLD and LÀNGRlllN' 19661
Flgure 24. Above are shown "segments of two typical meanderìng streams! the Mississippi R'iver
nerr Gr.enville, N{iss. (a), and Rlackrock Creek in Wyoming (b), as well as a segment of an
experimental mean¿er foimed in a homogenous medium in the laboratory (c)." Dashed lines tr¿ce
the correspondent sine-ge¡rerat'ed curves.

Plan
sine-generated curve bend
ú
sìnusoidal bend
semi-circular bend
/ÍT
út_TJ
I
parabolic bend
/ tperpendicular bend
Flgure ?6. Asymmebry of turnïng flow and the assoclated turbulence are minimalized in
n .i"nn.l bend conformìng bo a sine-generated curve'

AA
É-B
Plan
C
É-
D
II,EOPOLD ancl LÀNGREIN, 19661
Plan
IB^GNOLD, l960l
Figure TI . ,l¿e.alize{ fliagram of shearing motion tretrveen wator fìlanrents in a pipe bend
if transverse llow were prevented."
B
E
ê
.?
c
D
E
Figure 76. ,,Idealized flow pattern of a typical meander'" Vertical velocity profìles are
provirled for fìve sections at various points along the first bend (t' B' C, f) and E)' Note
the counterc.lockwise rotation of thã flo* ,ounãing this bend. Flow rotation would l¡e
clockrvise around the subsequent bend.''

ulell¡g e.s quoN
'rorr pðllold Jo u()lltrol s/ìlotls losul ..'tJ 09
Puu gg ,g¡ 1u sq¡rqo$l .rÐJu sTueü llorroN Ðrlì Jo s{uu(ì l)ur:s rtðull,, ¡o du¡1 '3¿ ornt¡¡
x'toJ uo N
lz¿or 'No¡,svclsellu letllneN
r-ffi.oq.¿t
ìt/
q¡.þ¡oq¡l¡H
uol¡alulM
\)\¡0f
\..¡'r.J
PlOúu¡Hq0no¡oqlleH
ltoux¡qltùs
r¡0ptUl¡0[.]{
I3.
trl
,tl¡e9Hq)l
c6p u
t-\,I ouyPusS
.oo¡t ll'
'\_4..:::)
\EB.
-'ooJss
.ot.[t $/ñ
u9uallu.g
lu¡g
¡t
¡9ho
-,0rtS ù¡¡uu
lurS
lu30I t.il^
z-
.ottß N\'
\
u.lo¡g
lu¡8aù ¡¡hs ¿,0t 'tTll
(. ( - - to9- \'- _ t..,-- \r
t/.otSçll

PlanDeep
¡--- :) ------f
Shallow
\\'-
a
Deep----)
[IlIJTIINANCE, 1982a]
Figure 79. Flow and sediment transport cleflcction in the shallow water over I'he linear
sand bank.
A
!¡u
Ìtu
l.t'
H
UI(OIIII-]TIIN ANCJE, l982al
B
'Far' current lluid colrrnln
¡
z
z
Conceptual fluld eolumns ¿re bounded
of iop and bottom bY unit areas.litrear sond bank
Figure so. ^)
Axcs of topography.. B) Nlomentrtnr is conscrved over the sand bank' The
,far,current momentum (pliuitt} must eqtral the fluid column momentttm (p[u) over
tlre sand bank. 1'hat is, HU l(tl = hu'
general ßuid column
fíl-¡lr t-
I

Plan
Þ
ilõÉ.n
\\ts
f{ 1\ù
HUI(r)cosa = lru
Flgure 81. lr{omentum vector and its components'
fluid layer surface
Sectlon
z
u hH
v (+)
Íl .o trro#=o
Flgure 82. The relationshìp between the parameters h antl $| an<l ühe bottom topography,

ô [c(t) cos y + å(t) sin y]
(lateral flow speed voriation)
,(+)
7 h12
2tl2tI
I
I
u(+)
l¡=l*6siny(topography)
¿(+) sand bank crest
r,(+)
polnt on s¿nd bank where
peak lateral flow sPeed occurs
Ftgure E3. The relationship between lateral flow speed variation and topography.
90
60
a
30
æ
IfIUTHNANCE, l982al
Flgure E4. "Contours of growth rate ø(rc,c) as a multiple ol SII2Fnlz(l - p)gll when
f =0, F = l¡ A = O.005 and m =2= î."
roo,c

z(+)
z(+l
(+)
"(+)
,(+)
II
Iril -JPJ6z
(+)
(+)
II
(+) (-)
(-)il#)tu æ¡lIJJ,-l¡t,o
"ft|
(+)N
Figure t6. lnflec.tion point vertical velocity profìle (A) and vertic.al prolìlesof associated
paiamcters (B - D), ,,1" in¿icates the inllcction point, and N =vorticity.
I
T

@@!v
46
ó
U
ó
U
stable
R*, Rcnt
/l \ \\\r:-s-
[scHLICHTING, l960l
¡- u-ó
Figure go. ,,curves of neutral stability for a two-dimensional boundary layer with trvo-
dimensional ¿istur¡anles-l.i ì"..-tiscåus' instability; in the case of velocity profìles of
type with point of inflectiàri PI, the curve of neutral stability is of type a (5) 'viscous'
instability; ¡ ttr" "."" oi u"to.ity prolìles of type l> withot¿t point of inflexion' the curve of
neutral stabilitY is of tYPe b'"
<:::1:>
U
t*',
l!
qS,
D\ t "r' sì
\
/ lMóuNlLr ttì,\\
s
S = solino
[TWIDALII, 19721
I
,t
tf'
¡t'I,I
t'l
It
I
I
I
LÀKE PHILIPPI (SÀTINA)
Figure g7. ,,sketch of the Lake Phillipi area, near the eastern nìargin of the sitlpson
Desert in western C¿u..orfnn¡. Note thl leesicle u.tottncl sorlre 20 klll east'west' stancling
so're 30 'r above th" ;ä;i trre sari.a, ancr the relatc¿ ¿une 'iclges."

Hou ND
/,I
ri
F[TWID^LE, 19721
I¡t'¡
ttl,tr
'I
Ii
i
ì
I
t/
t,
8EÁC;trB
[TWll)^l,tt, 19721
Â
olm
'N{ap of lìlal'gin of Lake Dyre near Warritters -At'tll'
bris mou dune"ridges' (Drarvn fronr air photographs)"
of the iak" G"rtgory shorving deblis mound and
(Drawn Phs)"
[rhì,
fr
\,\
"\
I\I
\ i
f lood
ploin
f lood
ploin N
0 km.
Figure 89. ,,Map drawn frorn air photographs of the Dia¡Dantina flood plain near
Birdsville, south-west Queensland, showing leeside mound and longitudinal sand ridges
extending frorn it."
z(+)
Sectlon i¿(z)
--+Pot
VPo
Poz
u (+)
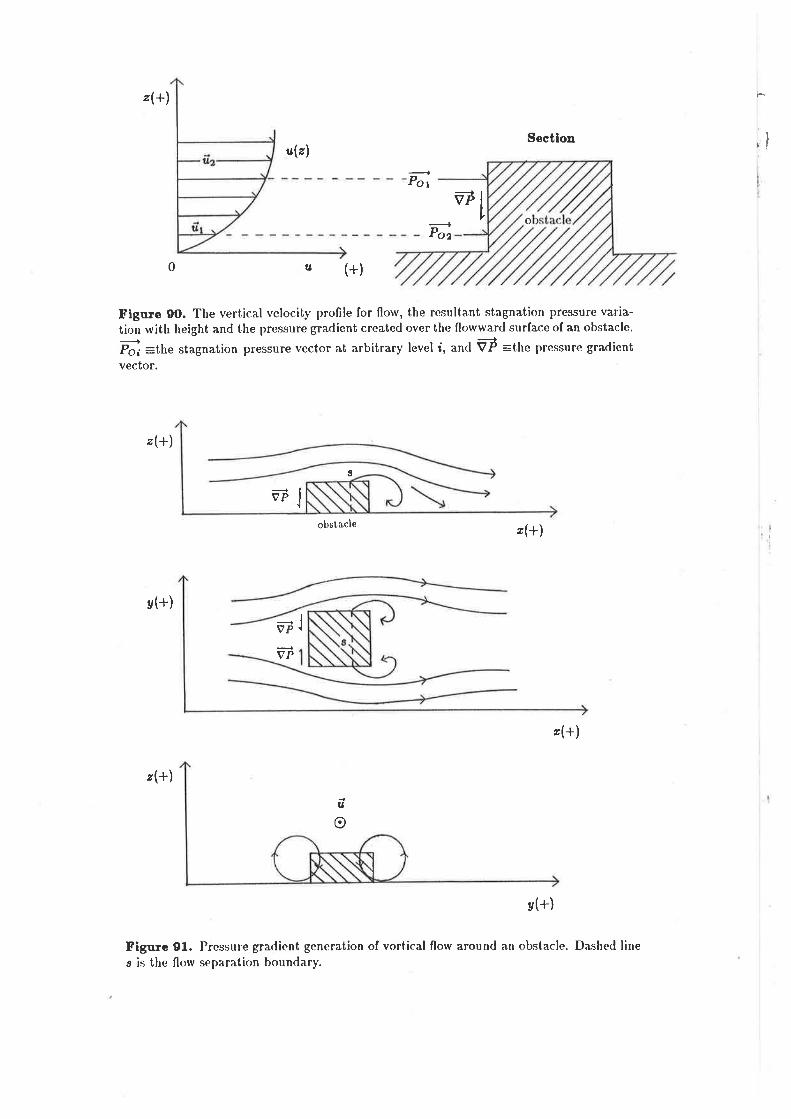
Flgure gO. The vertical velocity profile for flow, the resultant stagnation pressure varia-tion with height and the pressure gradicnt created over the flowward sunface of an obstacle.
Pol =the stagnation pressure vector at arbitrary level d, and V? :the pressure graclient
vector.
z(+)
vËJ
obstacle r(+)
v(+)
l
0
g
+VP
VP
"(+)
z(+)
v(+)
Flgure 91. Pressure gradient generation of vortical flow around an obstacle. Dashed lines is the flow separation bounclary.
ú
o
I

.4,
B
Figure 92. ^)
Roll vo¡tices generated around a narrow obstacle. D) Vortical currentsgeneratcd arot¡nd the encls of ¿ wicle obstacle and rotors generated to leeward of theobstacle's main body.
z(+) +l¡æ
u(")
insbrinsically unstable
z(+)intrinsically stable
u(")
Figure 93. Görtlcr instability or instability ovcr a concave surfacc. Notc that in gen-eral, llow over a convex surface is intrinsically stable and flow ovcr a concave sr¡rface isintrinsically u nstable.
l¡æ
I
I
'(+)

roll vorticesA
+-{t
/ lrulgt
Sectlon
secondary vortices
/
B _==-¿'7- <-
?-riro$
ò"!:"' '
\iù
a'- -
/r*-,'"Io
Sectlon
7- z/- 2
f--:
/_ --f-
c Sectlon
Flgure 94. Â) Â Ìrulge in a sancl shcet gives rise to roll vortices. B) ^
longit,u<linalrlcr¡ros;it,ion lail is frrrnrcrrl lo lcervarrl of llrc ori¡çin;rl brrlgc. Âs this linear nrounrl grows, thcroll vorticcs it gives rise to intensify. Seconrlary vortices are l)ro(luced, arrrl those inil,iatesrrbsirliar¡'srrrfacc bulges. Cl) A sct of longit,urlirr;rl rnounrls anrl tlreir associiìtc(ì r'orticespairs l>cgins to fornr.

À
¿ /----¿¿t /t'
/./
Figure 9õ . The developntent of longitudinal dunes from a single dcbris mound. A)original dcbris nror¡nd. B) 'flre atn¡rlifìcation of topograplric irregularities anrt t,he initiationof longil,urlinal deposit,ion tails. O) 'l'he <leveloprrrent of longitudinal rlunes.

Plau v
Plan
Plan
deposition tail
ri<lge
PIa¡
ol-rstacle
Plan
depression
[TWID^LE, le72l
\
v
o
PIan
î
Sectlon
Flgure g0. Leeward scconrlary flow anrl the resrrltant ìongituclinal deposit,ion in wincl
tunncl trials using pliusticene obst¿cles. V= vortices.
Sectlo¡
\.--l
Figure 97. \Yinrl rotor betu'tlcn trvo r:tlnvt'l'ging lincar dtln'¡s'

c
MEAN DOWNVALLEY DIRECT
G
100
0
r00
6UJt¡¡É(9¡JeI
l¡¡JJl¡JzozYI(.)l^:z9HFC)l¡JGõ
0 .b .5 .75
DISTANCE ALONG CHANNEL
1.25.25
II,EOPOLD and LANGBBIN, 19661
Flgure g8. "Sine-generated curve (lop/ closely approximates the shape of real river
meàn¿ers. This means that the angular direction of the channel at any point with respect
to tlre r¡ean dorvn-valley direction (lourard the ilght) is a sine function of the distance
mea^sured along the channel (graph at boltont). At the axis of each bend (I), D and F)the channel is directed in the mean down-valley direction and the anglc of dellection iszero, rvhcreas at ear:h poiut of i¡lflc.ction (A, G, E and G) the angle of dc'flection reaches a
maximum value."
c G
F
A E

,? /400TUUU
23 t0m.
I
500
t00
-200
\
À
so m
)
??
20
r8
t6
l4dc)
?. tzoclelos
I
6
4
?.
0
¿¿, m. Per sec.
FAURWITZ, lo'lll
Flgure 99. ,,Vertical variation of the wind distribution (llkman spiral)."
1o
Aú =É!
\ û
\t/(r)
surface
Figure l0O. For flow over a concave surface, florv speecl decreases non-linearly with
disìance away from the center of curvature and approaching the surface. Centrifugal
acceìeration at any point is ec¡ual to the s<¡uare of the florv speecl divided by the distance
from the center ofcurvature. Thcrefore, flow centrifugal acceleration decre;uses non-linearly
fa-ster than {oes flow speed approaching the surface, ancl instability results. In the fìgttre,
o :centcr of curvaturc, r =r.,linl clistancc to any point of interesl' anrl rl"¡ =c-entrifrrgalaccclcration.