Longitudinal Assessment of Transorbital Sonography, Visual...
6
Research Article Longitudinal Assessment of Transorbital Sonography, Visual Acuity, and Biomarkers for Inflammation and Axonal Injury in Optic Neuritis Piergiorgio Lochner, 1,2 Roberto Cantello, 2 Klaus Fassbender, 1 Martin Lesmeister, 1 Raffaele Nardone, 3,4 Antonio Siniscalchi, 5 Nausicaa Clemente, 2 Andrea Naldi, 2 Lorenzo Coppo, 2 Francesco Brigo, 3,6 and Cristoforo Comi 2 1 Department of Neurology, Saarland University Medical Center, Homburg, Germany 2 Department of Translational Medicine, Section of Neurology, University of Piemonte Orientale, Novara, Italy 3 Division of Neurology, “Franz Tappeiner” Hospital, Merano, Italy 4 Department of Neurology, Christian Doppler Medical Centre, Paracelsus Medical University Salzburg, Salzburg, Austria 5 Department of Neurology, “Annunziata” Hospital, Cosenza, Italy 6 Department of Neuroscience, Biomedicine and Movement Sciences, University of Verona, Verona, Italy Correspondence should be addressed to Piergiorgio Lochner; [email protected] Received 25 June 2017; Accepted 17 August 2017; Published 11 September 2017 Academic Editor: Patrizia Cardelli Copyright © 2017 Piergiorgio Lochner et al. This is an open access article distributed under the Creative Commons Attribution License, which permits unrestricted use, distribution, and reproduction in any medium, provided the original work is properly cited. Background and Objective. To investigate the relationship between optic nerve sheath diameter, optic nerve diameter, visual acuity and osteopontin, and neurofilament heavy chain in patients with acute optic neuritis. Patients and Methods. Sonographic and visual acuity assessment and biomarker measurements were executed in 23 patients with unilateral optic neuritis and in 19 sex- and age-matched healthy controls. Results. ONSD was thicker on the affected side at symptom onset (median 6.3 mm; interquartile range 6.0–6.5) than after 12 months (5.3 mm; 4.9–5.6; p <0 001) or than in controls (5.2 mm; 4.8–5.5; p <0 001). OND was significantly increased in the affected side (3.4 mm; 2.9–3.8) compared to healthy controls (2.7 mm; 2.5–2.9; p <0 001) and was thicker at baseline than after 12 months (2.8 mm; 2.7–3.0; p <0 01). Visual acuity improved significantly after 12 months (1.00; 0.90–1.00) compared to onset of symptoms (0.80; 0.40–1.00; p <0 001). OPN levels were significantly higher in patients at presentation (median 6.44 ng/ml; 2.05–10.06) compared to healthy controls (3.21 ng/ml, 1.34–4.34; p <0 03). Concentrations of NfH were significantly higher in patients than in controls. Conclusion. ONSD and OND are increased in the affected eye. OPN and NfH are elevated in patients, confirming the presence of any underlying inflammation and axonal injury. 1. Introduction Optic neuritis can be easily investigated because of its well- defined onset and accessibility to different diagnostic methods [1]. The most common pathophysiological mechanism of optic neuritis is inflammatory demyelination of the optic nerve. However, axonal degeneration and inflammation coex- ist in these patients and are associated with visual function impairment [2, 3]. Although optic neuritis is a clinical diagnosis, investiga- tions such as retinal optical coherence tomography (OCT) or MRI may be proven useful in supporting the diagnosis. These techniques have provided fascinating insights into the pathophysiology of optic neuritis in its various forms [4, 5]. Transorbital sonography is a sensitive, highly accessi- ble, user-friendly, and reliable technique for detecting optic nerve diameter (OND) and optic nerve sheath diameter (ONSD) [6] and is also able to show a significant thickening Hindawi Disease Markers Volume 2017, Article ID 5434310, 5 pages https://doi.org/10.1155/2017/5434310
Transcript of Longitudinal Assessment of Transorbital Sonography, Visual...

Research ArticleLongitudinal Assessment of Transorbital Sonography, VisualAcuity, and Biomarkers for Inflammation and Axonal Injury inOptic Neuritis
Piergiorgio Lochner,1,2 Roberto Cantello,2 Klaus Fassbender,1 Martin Lesmeister,1
Raffaele Nardone,3,4 Antonio Siniscalchi,5 Nausicaa Clemente,2 Andrea Naldi,2
Lorenzo Coppo,2 Francesco Brigo,3,6 and Cristoforo Comi2
1Department of Neurology, Saarland University Medical Center, Homburg, Germany2Department of Translational Medicine, Section of Neurology, University of Piemonte Orientale, Novara, Italy3Division of Neurology, “Franz Tappeiner” Hospital, Merano, Italy4Department of Neurology, Christian Doppler Medical Centre, Paracelsus Medical University Salzburg, Salzburg, Austria5Department of Neurology, “Annunziata” Hospital, Cosenza, Italy6Department of Neuroscience, Biomedicine and Movement Sciences, University of Verona, Verona, Italy
Correspondence should be addressed to Piergiorgio Lochner; [email protected]
Received 25 June 2017; Accepted 17 August 2017; Published 11 September 2017
Academic Editor: Patrizia Cardelli
Copyright © 2017 Piergiorgio Lochner et al. This is an open access article distributed under the Creative Commons AttributionLicense, which permits unrestricted use, distribution, and reproduction in any medium, provided the original work isproperly cited.
Background and Objective. To investigate the relationship between optic nerve sheath diameter, optic nerve diameter, visualacuity and osteopontin, and neurofilament heavy chain in patients with acute optic neuritis. Patients and Methods.Sonographic and visual acuity assessment and biomarker measurements were executed in 23 patients with unilateral opticneuritis and in 19 sex- and age-matched healthy controls. Results. ONSD was thicker on the affected side at symptom onset(median 6.3mm; interquartile range 6.0–6.5) than after 12 months (5.3mm; 4.9–5.6; p < 0 001) or than in controls (5.2mm;4.8–5.5; p < 0 001). OND was significantly increased in the affected side (3.4mm; 2.9–3.8) compared to healthy controls(2.7mm; 2.5–2.9; p < 0 001) and was thicker at baseline than after 12 months (2.8mm; 2.7–3.0; p < 0 01). Visual acuityimproved significantly after 12 months (1.00; 0.90–1.00) compared to onset of symptoms (0.80; 0.40–1.00; p < 0 001). OPN levelswere significantly higher in patients at presentation (median 6.44 ng/ml; 2.05–10.06) compared to healthy controls (3.21 ng/ml,1.34–4.34; p < 0 03). Concentrations of NfH were significantly higher in patients than in controls. Conclusion. ONSD and OND areincreased in the affected eye. OPN and NfH are elevated in patients, confirming the presence of any underlying inflammation andaxonal injury.
1. Introduction
Optic neuritis can be easily investigated because of its well-defined onset and accessibility to different diagnosticmethods[1]. The most common pathophysiological mechanism ofoptic neuritis is inflammatory demyelination of the opticnerve.However, axonal degeneration and inflammation coex-ist in these patients and are associated with visual functionimpairment [2, 3].
Although optic neuritis is a clinical diagnosis, investiga-tions such as retinal optical coherence tomography (OCT)or MRI may be proven useful in supporting the diagnosis.These techniques have provided fascinating insights intothe pathophysiology of optic neuritis in its various forms[4, 5]. Transorbital sonography is a sensitive, highly accessi-ble, user-friendly, and reliable technique for detecting opticnerve diameter (OND) and optic nerve sheath diameter(ONSD) [6] and is also able to show a significant thickening
HindawiDisease MarkersVolume 2017, Article ID 5434310, 5 pageshttps://doi.org/10.1155/2017/5434310

of OND and ONSD in the affected side, which is probablydue to inflammation with subsequently increased perineuralsubarachnoid fluid [7].
Transorbital sonography and OCT provide different andcomplementary information on the pathophysiology of opticneuritis. Compared to OCT, nerve ultrasonography has aninferior resolution but can provide a better depiction of thenerve and the orbita, because OCT is limited to surfaceanalysis [7].
In a recent systematic review assessing the role of opticultrasonography in the diagnosis of acute optic neuritis, thistechnique was able to detect an increase of the optic nerveand sheath diameters in about 80% of affected patients [8].This finding is consistent with the development of vasogenicedema and the presence of the early optic nerve lesion, recog-nizable by the gadolinium leakage often shown in MRI or thelesions identified with particular sequences of MRI such asFLAIR sequences [5, 9].
Conversely, OCT accurately documents changes in thethickness of retinal layers such as swelling in case of acuteoptic neuritis with optic disc swelling; this might be provenfurther useful, although only one-third of patients with acuteoptic neuritis show papillitis [4, 8].
Osteopontin (OPN), a proinflammatory cytokine expressedin several tissues and pathological conditions [10, 11], wasshown to be increased in the cerebrospinal fluid of patientswith optic neuritis [12]. In multiple sclerosis (MS), OPN levelscorrelate with disease severity and relapse rate [13]. On theother hand, blood levels of neurofilament heavy chain (NfH),a biomarker for neurodegeneration, are increased in patientswith acute optic neuritis and inversely correlated with visualloss [14]. Simultaneous assessment of visual acuity, transorbitalsonography, and biomarkers may provide an opportunity tofurther explore inflammation and neurodegeneration in opticneuritis and was therefore the aim of this study.
2. Methods
Written informed consent was obtained from all personsbefore entering the study. The studywas approved by the localethics committee (Bolzano, number 19-2014) and performedin accordance with the Declaration of Helsinki.
2.1. Patients’ Inclusion. All consecutive patients presenting tothe Neurology Outpatient Clinic of Merano Hospitalbetween December 2014 and November 2015 with a clinicaldiagnosis of optic neuritis were enrolled. Inclusion criteriawere those adopted in the Optic Neuritis Treatment Trialby the Opticus Neuritis Study Group: 18–46 years of age;acute unilateral optic neuritis with visual symptoms for 8days or fewer; a relative afferent pupillary defect and a visualfield defect in the affected eye; no previous episodes of opticneuritis in the affected eye; no previous corticosteroid treat-ment for optic neuritis or multiple sclerosis; and no systemicdisease other than multiple sclerosis that might be the causeof the optic neuritis [3].
All patients underwent neurologic and ophthalmologicexaminations, including visual acuity assessment and directophthalmoscopy. Laboratory examinations included vasculitis
screening, anti-neuromyelitis optical antibodies (aquaporin4-antibodies), and antibodies against myelin oligodendrocyteglycoprotein. MRI was done to exclude other causes of opticneuritis or compressive lesions [3]. All patients were followedup for 12 months.
2.2. Procedure of the Study and B-Ultrasound Sonography.Transorbital sonography, visual acuity, and biomarkers wereassessed at onset (T0) and after 12 months (T12). At firstpresentation, transorbital sonography was evaluated by anexpert neurosonologist (PL), who was accredited by theItalian Medical Ultrasound Society. We did not evaluate thesensitivity of sonographic data, but high attention was paidin order to assure quality control for the sonographic data.The high reliability of this technique has been reported inprevious studies [15, 16]. In order to reduce the variabilityof measurements, the ONSD was measured three times ineach eye and the mean values were calculated.
Transorbital sonography was always performed prior tothe initiation of steroid treatment. Afterwards, all includedpatients received a single course of one gram of intravenousmethylprednisolone sodium succinate over five days. Thesonographer was unaware of the condition of case or controland of the affected side. To ensure blinding, patients andhealthy controls were asked not to reveal their status (or theiraffected side) during examinations and were always placedon the examination table before the sonographer’s arrival.
Transorbital sonography was carried out in B-mode usinga Toshiba Applio XG equipped by a 4-11 Megahertz 5 S1Linear Probe (Toshiba Medical System, Applio Nasu, Japan).We adopted the same procedure described elsewhere [6, 7].
2.3. Assessment of OPN and NfH. OPN and NfH levels weredetermined for all patients presenting with symptomssuggestive of acute unilateral optic neuritis and before thebeginning of the infusion of methylprednisolone. Aftercollection, the clotted venous blood was centrifuged at3000 rpm for 15min to obtain the serum that was then storedat −80°C until use. OPN and NfH serum levels were mea-sured using the human OPN DuoSet ELISA developmentkit and the ELISA-pNFH-V1 (R&D Systems, Minneapolis,MN, USA; EnCor Biotechnology Inc., Gainesville, FL, USA,resp.) according to the manufacturer’s instructions. Theoptical density (OD) of each sample was determined at450 nm with a Spectra Count (Bio-Rad, Hercules, CA, USA),subtracting the lowest mean OD of the negative control.Sensitivity for OPN ELISA was 0.0625 ng/ml and for NfHELISA was 0.2 ng/ml. Specificity of OPN ELISA kit was testedwith recombinant human MMP-3 prepared at 50ng/ml thatshowed no cross-reactivity or interference. Specificity ofNfH ELISA kit was tested with HPLC-purified bovine NfM(7.8%), with bovine NfL (6.5%), and with bovine GFAP(0.06%) [17]. All samples were stored at the Clinic of MeranoHospital and then sent to the University of Novara. Due to ashortage of patients’ samples, we decided to test OPN in allsamples and NfH in 19 patients.
2.4. Statistical Evaluation. Continuous variables weredescribed using median and interquartile range (IQR) for
2 Disease Markers
nonparametrically distributed variables and mean withstandard deviation for parametrically distributed variables.
Comparisons between groups were assessed using thenonparametric Mann–Whitney U test and Wilcoxon signed-rank test. Correlations were assessed with the Spearman test;the level of statistical significance was set at p = 0 05.
All analyses were performed using dedicated statisticalsoftware (IBM Statistical Package for Social Science (SPSS),version 23.0.0.2, Armonk, New York, USA).
3. Results
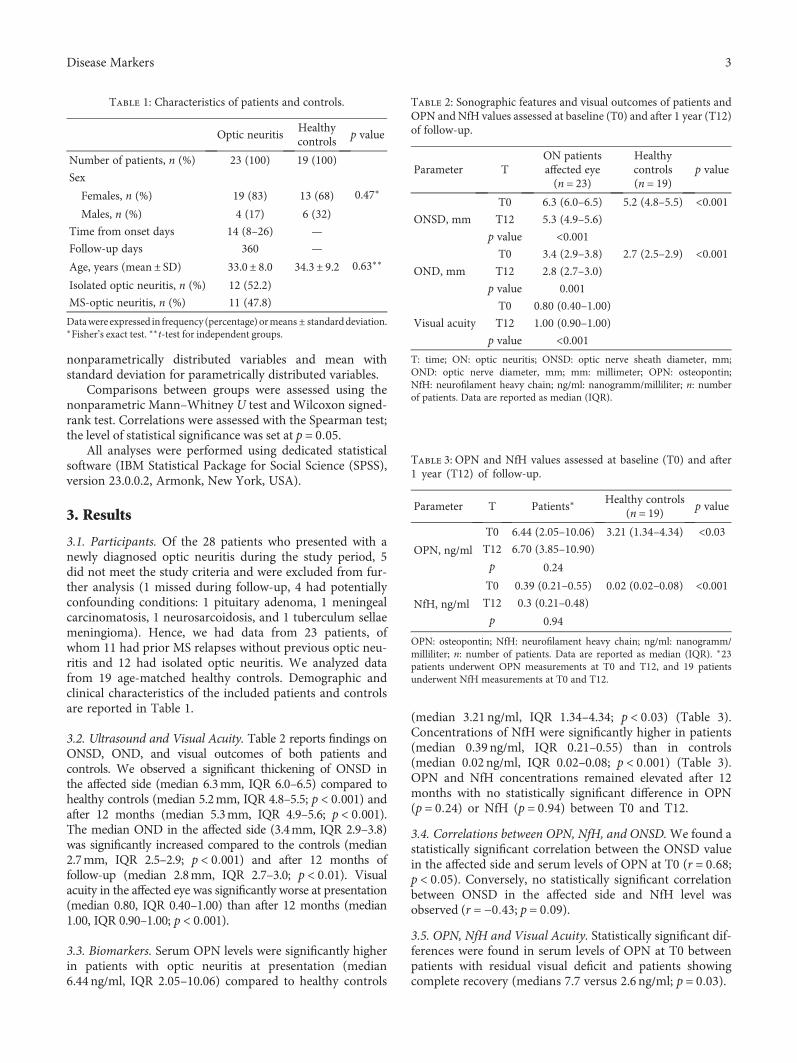
3.1. Participants. Of the 28 patients who presented with anewly diagnosed optic neuritis during the study period, 5did not meet the study criteria and were excluded from fur-ther analysis (1 missed during follow-up, 4 had potentiallyconfounding conditions: 1 pituitary adenoma, 1 meningealcarcinomatosis, 1 neurosarcoidosis, and 1 tuberculum sellaemeningioma). Hence, we had data from 23 patients, ofwhom 11 had prior MS relapses without previous optic neu-ritis and 12 had isolated optic neuritis. We analyzed datafrom 19 age-matched healthy controls. Demographic andclinical characteristics of the included patients and controlsare reported in Table 1.
3.2. Ultrasound and Visual Acuity. Table 2 reports findings onONSD, OND, and visual outcomes of both patients andcontrols. We observed a significant thickening of ONSD inthe affected side (median 6.3mm, IQR 6.0–6.5) compared tohealthy controls (median 5.2mm, IQR 4.8–5.5; p < 0 001) andafter 12 months (median 5.3mm, IQR 4.9–5.6; p < 0 001).The median OND in the affected side (3.4mm, IQR 2.9–3.8)was significantly increased compared to the controls (median2.7mm, IQR 2.5–2.9; p < 0 001) and after 12 months offollow-up (median 2.8mm, IQR 2.7–3.0; p < 0 01). Visualacuity in the affected eye was significantly worse at presentation(median 0.80, IQR 0.40–1.00) than after 12 months (median1.00, IQR 0.90–1.00; p < 0 001).
3.3. Biomarkers. Serum OPN levels were significantly higherin patients with optic neuritis at presentation (median6.44 ng/ml, IQR 2.05–10.06) compared to healthy controls
(median 3.21 ng/ml, IQR 1.34–4.34; p < 0 03) (Table 3).Concentrations of NfH were significantly higher in patients(median 0.39 ng/ml, IQR 0.21–0.55) than in controls(median 0.02 ng/ml, IQR 0.02–0.08; p < 0 001) (Table 3).OPN and NfH concentrations remained elevated after 12months with no statistically significant difference in OPN(p = 0 24) or NfH (p = 0 94) between T0 and T12.
3.4. Correlations between OPN, NfH, and ONSD.We found astatistically significant correlation between the ONSD valuein the affected side and serum levels of OPN at T0 (r = 0 68;p < 0 05). Conversely, no statistically significant correlationbetween ONSD in the affected side and NfH level wasobserved (r = −0 43; p = 0 09).
3.5. OPN, NfH and Visual Acuity. Statistically significant dif-ferences were found in serum levels of OPN at T0 betweenpatients with residual visual deficit and patients showingcomplete recovery (medians 7.7 versus 2.6 ng/ml; p = 0 03).
Table 1: Characteristics of patients and controls.
Optic neuritisHealthycontrols
p value
Number of patients, n (%) 23 (100) 19 (100)
Sex
Females, n (%) 19 (83) 13 (68) 0.47∗
Males, n (%) 4 (17) 6 (32)
Time from onset days 14 (8–26) —
Follow-up days 360 —
Age, years (mean± SD) 33.0± 8.0 34.3± 9.2 0.63∗∗
Isolated optic neuritis, n (%) 12 (52.2)
MS-optic neuritis, n (%) 11 (47.8)
Datawere expressed in frequency (percentage)ormeans ± standarddeviation.∗Fisher’s exact test. ∗∗t-test for independent groups.
Table 2: Sonographic features and visual outcomes of patients andOPN and NfH values assessed at baseline (T0) and after 1 year (T12)of follow-up.
Parameter TON patientsaffected eye(n = 23)
Healthycontrols(n = 19)
p value
ONSD, mm
T0 6.3 (6.0–6.5) 5.2 (4.8–5.5) <0.001T12 5.3 (4.9–5.6)
p value <0.001
OND, mm
T0 3.4 (2.9–3.8) 2.7 (2.5–2.9) <0.001T12 2.8 (2.7–3.0)
p value 0.001
Visual acuity
T0 0.80 (0.40–1.00)
T12 1.00 (0.90–1.00)
p value <0.001T: time; ON: optic neuritis; ONSD: optic nerve sheath diameter, mm;OND: optic nerve diameter, mm; mm: millimeter; OPN: osteopontin;NfH: neurofilament heavy chain; ng/ml: nanogramm/milliliter; n: numberof patients. Data are reported as median (IQR).
Table 3: OPN and NfH values assessed at baseline (T0) and after1 year (T12) of follow-up.
Parameter T Patients∗Healthy controls
(n = 19) p value
OPN, ng/ml
T0 6.44 (2.05–10.06) 3.21 (1.34–4.34) <0.03T12 6.70 (3.85–10.90)
p 0.24
NfH, ng/ml
T0 0.39 (0.21–0.55) 0.02 (0.02–0.08) <0.001T12 0.3 (0.21–0.48)
p 0.94
OPN: osteopontin; NfH: neurofilament heavy chain; ng/ml: nanogramm/milliliter; n: number of patients. Data are reported as median (IQR). ∗23patients underwent OPN measurements at T0 and T12, and 19 patientsunderwent NfH measurements at T0 and T12.
3Disease Markers

Regarding the serum levels of NfH at T0, we observed nostatistically significant difference between patients with visualdeficit at follow-up compared with patients with a goodvisual outcome (medians 0.39 versus 0.28 ng/ml; p = 0 291).
OPN values at T12 were significantly higher in patientswith worsened visual acuity compared to patients withcomplete recovery of visual function (medians 10.8 versus4.6 ng/ml; p = 0 019).
Regarding the serum levels of NfH at T12, we observed nostatistically significant difference between the 7 patients withworsened visual acuity and patients who had regained normalvisual acuity (medians 0.36 versus 0.25 ng/ml; p = 0 236).
4. Discussion
This is the first longitudinal study assessing circulatingbiomarkers of inflammation and axonal injury in parallelwith transorbital sonography and visual acuity in patientswith acute optic neuritis. Our approach is quite novel sincewe explored translational aspects that are well established inother neuroinflammatory conditions such as MS [18] butdefinitely less studied in optic neuritis [19].
Our study confirms that transorbital sonography is asensitive technique for visualizing optic nerve thickening inthe affected eye [7]. Nerve swelling is indeed the directexpression of the hallmark of optic neuritis, that is, inflam-mation. Furthermore, transorbital sonography can providequantitative observations of the increase of nerve sheathsdetermined by the perineural subarachnoid fluid.
NfH and OPN levels were higher in patients with opticneuritis than in controls and remained elevated even after12 months. Moreover, OPN concentration was significantlyhigher in patients with residual visual deficit after 12 months,thus supporting its detrimental effect in neuroinflammatoryconditions [20]. Conversely, we did not find a higher concen-tration of NfH in patients with residual deficit compared topatients with a complete recovery after 12 months.
Our findings are in line with a previous study showinghigher OPN levels during MS relapses and a direct correla-tion between OPN levels and disability [21]. Two furtherstudies confirmed that OPN levels were higher in MS relapsecompared to remission [13, 22].
Other studies found higher concentrations of NfH inpatients with optic neuritis compared to controls or higherconcentrations in patients with optic neuritis and neuromy-elitis optica with more serious visual impairment comparedto MS patients with optic neuritis or controls [2, 23]. Ourstudy failed to show a significant relation between higherNfH concentrations at symptom onset and residual visualimpairment. Conversely, we found a direct correlationbetween OPN and both ONSD and OND. Such parameterscan provide complementary information on the dynamicsof inflammation, and therefore, we suggest that they shouldbe further studied in optic neuritis.
Notwithstanding the significant improvement in visualacuity, the persistence of high biomarkers concentrationsover time suggests the persistence of underlying inflamma-tion and neurodegeneration. The ONTT trial has indeedshown a spontaneous recovery in many but not all patients
over a few weeks in acute idiopathic optic neuritis, eventhough the effect of treatment in subgroups was notanalyzed [3].
The main limitation of this study is the small sample size.Therefore, our results need to be cautiously interpreted andreplicated on a larger population. The use of transorbitalsonography together with biomarkers would be of particularinterest to monitor subgroups of patients with visual lossprogressing for more than 2 weeks and with the absence ofrecovery for more than 3 weeks. Our findings were obtainedby a single operator, but they can be easily replicated thanksto the low inter-rater variability of this technique [6].
Overall, our results support the usefulness of examiningbiomarkers in optic neuritis, since they provide complemen-tary information on pathophysiology. The increase of OPNand ONSD seems to be correlated with the intensity ofinflammation and might have a prognostic value, in analogyto what was suggested in MS [24]. Moreover, a similar studydesign could be easily applied to test correlations betweenultrasound findings and other circulating molecules with apotential role in optic neuritis [25].
In conclusion, this study suggests that OPN levels predictvisual outcome and neuronal loss after optic neuritis,whereas the role of NfH remains to be fully elucidated.
Conflicts of Interest
No potential conflict of interest relevant to this articlewas reported.
Authors’ Contributions
All authors provided substantial contributions to the concep-tion or design of the work or the acquisition, analysis, orinterpretation of data. Piergiorgio Lochner, Roberto Cantello,Raffaele Nardone, and Francesco Brigo are responsible forthe study organisation, execution, manuscript review, andcritique. Antonio Siniscalchi and Lorenzo Coppo are respon-sible for the study execution, manuscript review, and critique.Nausicaa Clemente is responsible for the study organisation,execution, and critique. Martin Lesmeister and Andrea Naldiare responsible for the statistical analysis, manuscript review,and critique. CristoforoComi is responsible for the study con-ception, manuscript writing, review, and critique. FrancescoBrigo and Cristoforo Comi contributed equally to thiswork. Klaus Fassbender is responsible for manuscriptreview and critique.
References
[1] A. T. Toosy, D. F. Mason, and D. H. Miller, “Optic neuritis,”Lancet Neurology, vol. 13, no. 1, pp. 83–99, 2014.
[2] A. Petzold, K. Rejdak, and G. T. Plant, “Axonal degenerationand inflammation in acute optic neuritis,” Journal of Neurology,Neurosurgery, and Psychiatry, vol. 75, no. 8, pp. 1178–1180, 2004.
[3] Optic Neuritis Study Group, “Multiple sclerosis risk after opticneuritis: final optic neuritis treatment trial follow-up,”Archives of Neurology, vol. 65, no. 6, pp. 727–732, 2008.
4 Disease Markers

[4] A. Petzold, M. P. Wattjes, F. Costello et al., “The investigationof acute optic neuritis: a review and proposed protocol,”Nature Reviews Neurology, vol. 10, no. 8, pp. 447–458, 2014.
[5] S. J. Hickman, A. T. Toosy, S. J. Jones et al., “Serial magnetiza-tion transfer imaging in acute optic neuritis,” Brain, vol. 127,Part 3, pp. 692–700, 2004.
[6] P. Lochner, L. Coppo, R. Cantello et al., “Intra- and interob-server reliability of transorbital sonographic assessment ofthe optic nerve sheath diameter and optic nerve diameter inhealthy adults,” Journal of Ultrasound, vol. 19, no. 1, pp. 41–45, 2014.
[7] P. Lochner,R.Cantello, F.Brigo et al., “Transorbital sonographyin acute optic neuritis: a case-control study,” AJNR - AmericanJournal of Neuroradiology, vol. 35, no. 12, pp. 2371–2375, 2014.
[8] P. Lochner, M. A. Leone, L. Coppo et al., “B-mode transorbitalultrasononography for the diagnosis of acute optic neuritis. Asystematic review,” Clinical Neurophysiology, vol. 127, no. 1,pp. 803–809, 2016.
[9] B. D. Youl, G. Turano, D. H. Miller et al., “The pathophysiol-ogy of acute optic neuritis. An association of gadoliniumleakage with clinical and electrophysiological deficits,” Brain,vol. 114, Part 6, pp. 2437–2450, 1991.
[10] N. Clemente, D. Raineri, G. Cappellano et al., “Osteopontinbridging innate and adaptive immunity in autoimmunediseases,” Journal of Immunology Research, vol. 2016, ArticleID 7675437, 15 pages, 2016.
[11] E. Boggio, C. Dianzani, C. L. Gigliotti et al., “Thrombin cleav-age of osteopontin modulates its activities in human cellsin vitro and mouse experimental autoimmune encephalomy-elitis in vivo,” Journal of Immunology Research, vol. 2016,Article ID 9345495, 13 pages, 2016.
[12] S. Modvig, M. Degn, H. Horwitz et al., “Relationship betweencerebrospinal fluid biomarkers for inflammation, demyelin-ation and neurodegeneration in acute optic neuritis,” PLoSOne, vol. 8, no. 10, article e77163, 2013.
[13] M. H. Vogt, S. Floris, J. Killestein et al., “Osteopontin levelsand increased disease activity in relapsing-remitting multiplesclerosis patients,” Journal of Neuroimmunology, vol. 155,no. 1-2, pp. 155–160, 2004.
[14] A. Petzold and G. T. Plant, “The diagnostic and prognosticvalue of neurofilament heavy chain levels in immune-mediated optic neuropathies,”Multiple Sclerosis International,vol. 2012, Article ID 217802, 5 pages, 2012.
[15] J. Bäuerle, P. Lochner, M. Kaps, and M. Nedelmann, “Intra-and interobsever reliability of sonographic assessment of theoptic nerve sheath diameter in healthy adults,” Journal ofNeuroimaging, vol. 22, no. 1, pp. 42–45, 2012.
[16] J. Bäuerle, F. Schuchardt, L. Schroeder, K. Egger, M. Weigel,and A. Harloff, “Reproducibility and accuracy of optic nervesheath diameter assessment using ultrasound compared tomagnetic resonance imaging,” BMC Neurology, vol. 13,p. 187, 2013.
[17] A. Petzold, G. Keir, A. J. Green, G. Giovannoni, and E. J.Thompson, “A specific ELISA for measuring neurofilamentheavy chain phosphoforms,” Journal of ImmunologicalMethods,vol. 278, pp. 179–190, 2003.
[18] L. Castelli, C. Comi, A. Chiocchetti et al., “ICOS genehaplotypes correlate with IL10 secretion and multiple sclerosisevolution,” Journal of Neuroimmunology, vol. 186, pp. 193–198, 2007.
[19] S. Rossi, C. Motta, V. Studer et al., “Interleukin-8 is associatedwith acute and persistent dysfunction after optic neuritis,”Multiple Sclerosis, vol. 20, pp. 1841–1850, 2014.
[20] M. Carecchio and C. Comi, “The role of osteopontin in neuro-degenerative diseases,” Journal of Alzheimer’s Disease, vol. 25,no. 2, pp. 179–185, 2011.
[21] Y. Shimizu, K. Ota, R. Ikeguchi, S. Kubo, C. Kabasawa, andS. Uchiyama, “Plasma osteopontin levels are associated withdisease activity in the patients with multiple sclerosis andneuromyelitis optica,” Journal of Neuroimmunology, vol. 263,no. 1-2, pp. 148–151, 2013.
[22] M. H. Vogt, L. Lopatinskaya, M. Smits, C. H. Polman, andL. Nagelkerken, “Elevated osteopontin levels in activerelapsing-remitting multiple sclerosis,” Annals of Neurology,vol. 53, no. 6, pp. 819–822, 2003.
[23] J. Pasol, W. Feuer, C. Yang, G. Shaw, R. Kardon, and J. Guy,“Phosphorylated neurofilament heavy chain correlations tovisual function, optical coherence tomography, and treat-ment,” Multiple Sclerosis International, vol. 2010, Article ID542691, 10 pages, 2010.
[24] C. Comi, G. Cappellano, A. Chiocchetti et al., “The impact ofosteopontin gene variations on multiple sclerosis developmentand progression,” Clinical and Developmental Immunology,vol. 2012, Article ID 212893, 6 pages, 2012.
[25] E. Bellavista, A. Santoro, D. Galimberti, C. Comi, F. Luciani,and M. Mishto, “Current understanding on the role ofstandard and immunoproteasomes in inflammatory/immuno-logical pathways of multiple sclerosis,” Autoimmune Diseases,vol. 2014, Article ID 739705, 12 pages, 2014.
5Disease Markers

Submit your manuscripts athttps://www.hindawi.com
Stem CellsInternational
Hindawi Publishing Corporationhttp://www.hindawi.com Volume 2014
Hindawi Publishing Corporationhttp://www.hindawi.com Volume 2014
MEDIATORSINFLAMMATION
of
Hindawi Publishing Corporationhttp://www.hindawi.com Volume 2014
Behavioural Neurology
EndocrinologyInternational Journal of
Hindawi Publishing Corporationhttp://www.hindawi.com Volume 2014
Hindawi Publishing Corporationhttp://www.hindawi.com Volume 2014
Disease Markers
Hindawi Publishing Corporationhttp://www.hindawi.com Volume 2014
BioMed Research International
OncologyJournal of
Hindawi Publishing Corporationhttp://www.hindawi.com Volume 2014
Hindawi Publishing Corporationhttp://www.hindawi.com Volume 2014
Oxidative Medicine and Cellular Longevity
Hindawi Publishing Corporationhttp://www.hindawi.com Volume 2014
PPAR Research
The Scientific World JournalHindawi Publishing Corporation http://www.hindawi.com Volume 2014
Immunology ResearchHindawi Publishing Corporationhttp://www.hindawi.com Volume 2014
Journal of
ObesityJournal of
Hindawi Publishing Corporationhttp://www.hindawi.com Volume 2014
Hindawi Publishing Corporationhttp://www.hindawi.com Volume 2014
Computational and Mathematical Methods in Medicine
OphthalmologyJournal of
Hindawi Publishing Corporationhttp://www.hindawi.com Volume 2014
Diabetes ResearchJournal of
Hindawi Publishing Corporationhttp://www.hindawi.com Volume 2014
Hindawi Publishing Corporationhttp://www.hindawi.com Volume 2014
Research and TreatmentAIDS
Hindawi Publishing Corporationhttp://www.hindawi.com Volume 2014
Gastroenterology Research and Practice
Hindawi Publishing Corporationhttp://www.hindawi.com Volume 2014
Parkinson’s Disease
Evidence-Based Complementary and Alternative Medicine
Volume 2014Hindawi Publishing Corporationhttp://www.hindawi.com