Long Term Results of Operating Ta Luft Acid Gas Scrubbing ...
13
LONG TERM RESULTS OF OPERATING TA LUFT ACID GAS SCRUBBING SYSTEMS KLAUS S. FEINDLER Beaumont Environmental, Inc. Wheatley Heights, New York ABSTRACf The Kiel refuse power and district heating station in West Germany was the first resource recovery facility built in compliance with the 1974 guidelines for air pollution control (TA Luft 74). One of its key features was the installation of acid gas scrubbers with regenerative heat exchangers for plume control. Since Kiel, a score of other systems have been built using a variety of different approaches to acid gas scrubbing. The performance of several selected systems is dis- cussed and special consideration is given to recent test- ing on dioxin/furan emissions. In a broader context, the Kiel emissions are then compared with those of other large facilities in West Germany. This will pro- vide insights into the results of recent govement- sponsored research into the effectiveness of TA Luft 74 type of air pollution control systems. In conclusion, reference is made to the revised guidelines, the issuance of which is pending. INTRODUION In recent years, a rash of waste-to-energy projects has been commissioned in the United States. Many of these are based on European technology, consisting of mass buing fuaces positioned under waterwall boil- 17 ers. The concept of carefully controlled refuse com- bustion in combination with efficient steam generation was readily adapted. However, with regard to air pol- lution control, only a high level of particulate control was generally desired. Several states, most notably California, New Jersey and Oregon, have now gone beyond the framework originally set forth by the U.S.EPA in demanding that acid gas control be included as well. In this respect, much attention has been focused on West Germany, where such acid gas control has been mandated for over 10 years. The German success with acid gas control technol- ogy is discussed in three steps: (a) regulatory goal setting; (b) industry leadership; and (c) market ac- ceptance. TA LU CHALLENGE In August 1974, the Federal Ministry of the Interior in West Germany issued TA Luft 74 (Technical Guide- lines for Air Quality Protection) or TAL 74 [1]. It contained the administrative steps required for imple- menting the Federal Clean Air Act which had been promulgated a few months earlier [2]. Intended to strike a balance between ecological and economical conces, TAL 74 set forth the framework
Transcript of Long Term Results of Operating Ta Luft Acid Gas Scrubbing ...

..
LONG TERM RESULTS OF OPERATING TA LUFT ACID GAS SCRUBBING SYSTEMS
KLAUS S. FEINDLER Beaumont Environmental, Inc. Wheatley Heights, New York
ABSTRACf The Kiel refuse power and district heating station
in West Germany was the first resource recovery facility built in compliance with the 1974 guidelines for air pollution control (TA Luft 74). One of its key features was the installation of acid gas scrubbers with regenerative heat exchangers for plume control. Since Kiel, a score of other systems have been built using a variety of different approaches to acid gas scrubbing. The performance of several selected systems is discussed and special consideration is given to recent testing on dioxin/furan emissions. In a broader context, the Kiel emissions are then compared with those of other large facilities in West Germany. This will provide insights into the results of recent governmentsponsored research into the effectiveness of T A Luft 74 type of air pollution control systems. In conclusion, reference is made to the revised guidelines, the issuance of which is pending.
INTRODUCfION In recent years, a rash of waste-to-energy projects
has been commissioned in the United States. Many of these are based on European technology, consisting of mass burning furnaces positioned under waterwall boil-
17
ers. The concept of carefully controlled refuse combustion in combination with efficient steam generation was readily adapted. However, with regard to air pollution control, only a high level of particulate control was generally desired.
Several states, most notably California, New Jersey and Oregon, have now gone beyond the framework originally set forth by the U.S. EPA in demanding that acid gas control be included as well. In this respect, much attention has been focused on West Germany, where such acid gas control has been mandated for over 10 years.
The German success with acid gas control technology is discussed in three steps: (a) regulatory goal setting; (b) industry leadership; and (c) market acceptance.
TA LUFf CHALLENGE In August 1974, the Federal Ministry of the Interior
in West Germany issued TA Luft 74 (Technical Guidelines for Air Quality Protection) or TAL 74 [1]. It contained the administrative steps required for implementing the Federal Clean Air Act which had been promulgated a few months earlier [2].
Intended to strike a balance between ecological and economical concerns, TAL 74 set forth the framework

for permitting construction and operation of facilities which have the potential to impair air quality. In effect, these are the minimum requirements which must be met by the permitting agencies at the local, county and state level. In case of a conflict between pollution and costs, priority was to be accorded to environmental protection.
This approach was not deemed unreasonable because the earlier version, called TAL 64, had been successful in defining the ideas of adverse environmental impact and establishing a uniform minimum standard of air pollution control technology.
Much had been learned during the intervening years from the work of the VDI Air Quality Commission (the VDI is roughly the equivalent of the ASME), from feedback from the permitting agencies, from consultations with the pollution control industry and from international discussions. Consequently, it was decided that a toughening of air pollution control requirements was both necessary and possible.
TAL 64 was improved in several important aspects: (aj lower emission limits for nontoxic particulate
matter (b) new particle emission limits for 50 substances
which are divided into three classes according to their degree of toxicity
(c) new gaseous emission limits for 120 substances in three classes according to toxicity
TAL 74 applies to a long catalog of facilities and processes, but because of the unique nature of refuse, incinerators for municipal and hazardous waste were given special attention.
A full discussion of TAL 74 would go beyond the scope of this report. Instead, the reader's attention is directed to Table 1, which summarizes the requirements of both TAL 64 and TAL 74. It is important to point out that neither of these guidelines mandated SO" control for municipal refuse incinerators. This aspect was left to the discretion of the individual permitting agencies, who determined on the basis of environmental impact studies whether or not ambient air quality conditions warranted the addition of an S02 emissions limit. Several large cities and other communities with high background levels resulting from utility and industry operations have actually done so, e.g., Krefeld and Hamburg [3].
Late in 1982, the Federal Government issued a draft novation which contained significant modifications to TAL 74. After much disucssion and comment, this novation was adopted in March 1983, however, it did not yet revise the emission limits previously laid down [4]. Extensive discussions among regulators, builders and operators determined that the state of the art had
18
progressed further to the point where emission limits for refuse incinerators could be tightened up further. New emission limits are now in preparation and should be issued shortly. For purposes of this discussion, we have dubbed them "TAL 84", and they are included in Table 1 as well.
In the meantime, several other European countries have followed suit and developed their own version of TAL 84. One such example is Switzerland's new guidelines for the limitation of air pollution from municipal incinerators [5].
It should be recognized that the design of the original Kiel facility came at the crossroads of TAL 64 and TAL 74. Therefore, the local permitting agency accepted the older particulate control requirement while already imposing the new acid gas control requirements.
INDUSTRY LEADERSHIP As in the U.S. today, there was much skepticism in
West Germany during the early seventies. A large body of opinion held that applying acid gas control technology to municipal incinerators would invite the attendant problems of process inefficiency and equipment unreliability. Therefore, it is appropriate to review the operating history of the Kiel refuse power and district heating station. This was the first resource recovery facility designed to achieve compliance with TAL 74; it also has the longest operating record of any such facility.
Kiel uses electrostatic precipitators (ESP's) in conjunction with single-stage wet scrubbers (SS/WS) for air pollution control (APC). Design, construction and initial operation were the subject of a previous paper [6]. It should be mentioned, however, that Kiel features three APC systems. The two smaller and older ones (I and II) feature venturi scrubbers which are directly coupled with the ESP's by means of the ID fans. Hot air is subsequently bled into the flue gas stream for reheating prior to entry into the stack.
In contrast, the newer and larger system (III) uses regenerative heat exchange as the preferred means for protecting the stack, increasing draft and minimizing plume formation. A special glass tube heat exchanger was installed for this purpose.
In order to explain the workings qf this new system, Fig. 1 was furnished with a simplified flow schematic. In a departure from the older design, hot flue gases are now pushed by the ID fan into the primary side of the glass tube heat exchanger for cooling. Conse-

TABLE 1 COMPARISON OF EMISSIONS LIMITS FOR DIFFERENT VERSIONS OF TA LUFT (l)
1964 1974 1984
Pollutant (s) mg/m3(2) mg/m3(3) mg/m3(3)
A. Solid Phase: ..
Total Particulate Matter 150 100 50.
Class I Particulates (Cd, Hg, Tl) N.A.(4) 20 0.2
Class II Particulates (As, Cr, Co, Ni, Se, Te) N.A. 50 1.0
Class III Particulates (Sb, Pb, F, Cu, M n, V) N.A. 75 5.0
B. Gaseous Phase:
Carbon Monoxide (CO) N.A. 1,000 10 0. -
Fluorides (Fl ) N.A. 5 5. -
Hydrogen Chloride (Cl ) N.A. 100 50.
Sulfur Dioxide (S02) N.A. N.A. 2 00.
Notes: (1) 8000C or 1,4720F and 0.3 sec. min. furnace conditions.
(2 ) we�, corrscted to 7% vol. CO2
, 1,013 mb and 32 F or 0 C.
(3 ) we�, corrscted to 11% vol. °2' l,O13 mb and
32 F or 0 C. (4) N.A. denotes "not applicable" or "not
available".
quently, the flue gases are first cooled by about 90 °F (50°C) before being admitted to the scrubber. After additional cooling inside the scrubber, i.e., another temperature reduction of some 70°F (39 °C), the cooled flue gases are returned to the glass tube heat exchanger into the secondary side for reheating. After having regained some 90 °F (50°C), the flue gases are finally exhausted through the stack. This substantial cooling increases the efficiency of the scrubbing fluid while acting as a solvent for the recovery of pollutants.
At present, the APC system at Kiel is being modified further to allow for the separate collection and disposal of fly ash. Figure 1 already incorporates these modifications, a key feature of which are filter presses needed for dewatering the scrubber sludge. In the future, dried
19
scrubber fly ash together with ESP fly ash will be handled separately from bottom ash.
Table 2 tracks the multi-year operating record of these two designs. Initially, there were a number of serious problems with APC systems I and II which, together with refuse supply problems and inexperience, were the reasons for much downtime. The latter two problems were easily overcome, as is indicated by the rapid increase in annual Grate Boiler Utilization or UGB [I, 2]. (Note: For definition of the terminology used in the context of this discussion, refer to Table 3).
In contrast, Scrubber Utilization, or Us [1, 2], did not increase. Corrosion in the scrubbers, ID fans and stack flues were major problem areas [6]. In addition,
tv
o
Msw
m '
FU
RNAC
E 03
1.0 s
tph
BO
TT Of'
1 AS
H
�
STEA
M FO
R D'I
STRl
CT
HEAT
ING
FEE
DWAT
ER
BOIL
ER W
ITH
ECOf
IOlH
ZER
BOIL
ER
FLYA
SH
-WE
FLYA
SH
No
te
s:
Le
ge
nd
:
392°F
REGE
NERA
TIVE
22
8°F
HAK
E-UP
WAT
ER
EXCH
ANGE
R
090F
DEMI
STER
S ING
LE
STAGE
VE
NTUR
I SC
RUBB
ER
S LUD
GE C
AKE
(1)
MS
W
= M
un
ic
ip
al
S
ol
id
W
as
te
(2
) C
om
mo
n
to
s
ys
te
ms
#
2
an
d
#3.
LII1
E
LIME
SL
AKER
NEUT
RAL
IZAT
ION
TANK
(3)
Ty
pi
ca
l
of
o
ne
s
ys
te
m
fo
r
a
to
ta
l
ca
pa
ci
ty
o
f
lx
ll
.O
st
ph
x2
4=
27
4
ST
PD
7
@l
OO
%
MC
R
of
N
SW
.
� S
am
pl
in
g
Lo
ca
ti
on
s
fo
r
AP
C
te
st
in
g
.....
Fl
ue
G
as
P
at
h
FIG
. 1
SIM
PL
IFIE
D F
LO
W S
CH
EM
AT
IC F
OR
NE
W A
PC
SY
ST
EM
AT
KIE
L(3)
[XHA
UST
S T A C K

�
Ye
ar
Pe
rf
or
ma
nc
e
Pa
ra
me
te
r
Gr
at
e
Bo
il
er
U
ti
li
za
ti
on
UG
a (1
,2) (
he
/h
e)
Sc
ru
bbe
r
Ut
il
iz
at
io
n
Us
(1
,2) (
he
/h
e)
Ut
il
iz
at
io
n
Qu
ot
ie
nt
UQ(1
,2) (
he
/h
e)
Pl
an
t
Ca
pa
c!
ty
P
ac
to
r
N
PC
FG(
1,2)
CST
R
ef
ua
e/
ST
R
ef
us
e)
Sp
ec
if
ic
St
ea
mi
ng
R
at
e
SS
R(1
,2)
(L
b St
ea
m/
Lb
Re
fu
se
)
Wa
te
r
Co
ns
um
pt
io
n (
6)
g
al
/s
T
Li
lte
C
on
su
mp
ti
on
(7
)
Lb/
ST
St
ea
m
Co
ns
um
pt
io
n
ST
/S
T
,
TA
BL
E 2
KIE
L A
PC
SY
ST
EM
S P
ER
FO
RM
AN
CE
PA
RA
ME
TE
RS
(l)
Pr
oc
es
si
ng
L
in
e
s
I
, I
I P
ro
ce
ss
in
g
Li
n
e
8 I
, I
I
19
75
(3
)
19
76
0.
62
8
0.
67
1
N ...
.. 0
.3
84
N.A
. 0
.5
72
0.
93
1
0.
97
0
1.
90
0
2.
03
0
21
7
30
2
N .
....
7
.6
69
N.
A.
0
.0
54
1
Fi
rs
t
Pe
ri
od
S
ec
on
d
Pe
ri
od
(
2)
19
77
1
97
8
19
79
(4
)
Av
er
ag
e
19
80
1
98
1
19
82
1
98
3
19
84
A
ve
ra
ge
0.
78
1
0.
87
7
0.
92
3
0.
77
6
0.
69
9
0.
39
8
0.
45
4
0.
45
1
0.
51
1
0.
50
3
0.
27
6
0.
41
8
0.
25
9
0.
33
4
0.
49
6
0.
34
2
0.
43
1
0.
41
7
0.
50
9
0.
43
9
0.
35
4
0.
41
6
0.
28
1
0.
42
1
0.
71
0
0.
85
9
0.
94
9
0.
92
5
0.
99
5
0.
88
8
0.
94
3
1.
05
6
1.
10
0
1.
00
0
0.
88
1
0.
51
3
0.
50
6
0.
52
8
0.
63
3
0.
61
2
2.
05
0
2.
15
9
2.
11
4
2.
06
3
2.
22
2
2.
21
6
2.
31
6
2.
38
4
2.
42
7
2.
31
3
30
5
37
0
39
8
31
8
31
9
31
9
37
0
28
3
28
8
31
6
9.
05
1
8.
51
0
8.
21
0
8.
36
0
6.
18
7
7.
38
9
7.
40
9
6.
56
8
6.
92
8
6.
89
6
0.
05
85
0
.0
53
0
0.
05
71
0
.0
55
8
0.
05
34
0
.0
51
1
0.
04
37
0
.0
48
7
0.
04
92
0
.0
49
2
No
te
s:
(l
)
Fo
r
de
fi
ni
ti
on
s
an
d
de
ri
va
ti
on
s
of
t
er
mi
no
lo
gy
, s
ee
t
he
p
ce
ce
ed
in
g
Ta
ble
1
a
nd
R
ef
er
en
ce
(
1)
.
(2
)
Ge
ne
ra
ll
y,
on
e
pe
oc
e ••
ing
l
in
e
is
A
SS
ig
ne
d
to
s
ta
nd
by
du
ty
be
ca
us
e
of
l
im
it
ed
r
ef
us
e
su
pp
ly
.
el}
St
ar
t-
up
y
ea
r,
no
t
al
l
eq
ui
pme
nt
wa
s
ru
n.
(
4)
C
on
st
ru
ct
io
n
ye
ar
, 3
rd
p
ro
ce
8s
in
9
li
ne
be
in
9
in
st
al
le
d.
(
5)
St
ar
t-
up
y
ea
r
fo
r
3r
d
pr
oc
es
si
n9
l
in
e.
(
6)
T
o
co
nv
ee
t
fr
oll
g
al
/ST
t
o
kg
/M
T
Mu
lt
ip
ly
by
4
.1
7.
(
7)
T
o
co
nv
er
t
fr
OID
L
b/ST
t
o
k9
/MT
m
ul
ti
pl
y
by
0.
50
.
pr
oc
es
si
ng
L
in
e
I
I I
Se
co
nd
P
er
io
d
19
80
(5
)
19
81
1
98
2
19
83
1
98
4
0.
75
0
0.
81
2
0.
83
5
0.
88
8
0.
84
2
0.
72
8
0.
80
6
0.
83
3
0.
88
4
0.
83
9
0.
97
0
0.
99
3
0.
99
7
0.
99
6
0.
99
7
0.
82
2
0.
86
4
0.
89
2
0.
91
5
0.
91
3
2.
43
1
2.
49
4
2.
38
0
2.
4"
2
.4
39
16
8
14
6
16
1
21
8
20
9
6.
18
7
7.
38
9
7.
68
9
6.
56
8
6.
92
8
0
0
0
0
0
Av
er
ag
e
0.
82
5
0.
81
8
0.
99
1
0.
88
1
2.
43
8
18
0
6.
95
2
0

TABLE 3 DEFINITIONS USED FOR DESCRIBING PERFORMANCE PARAMETERS
Grate/Boiler Utilization Ul,2 _ hbl + hb2 GB - 2x8,760
[hours1 hours
hbl = annual operating hours for boiler #1 hb2 = annual operating hours for boiler #2
wi th
The superscript refers to the average of grate/boiler combinations #1 and #2.
Scrubber Utilization Ul,2 = hsl + hs2 S 2x8,760
rhours] /j)ours
hsl = annual operating hours for scrubber #1 hs2 = annual operating hours for scrubber #2
with
The superscript refers to the average of scrubbers #1 and #2.
Utilization Quotient Ul,2
UQl,2 = S
Ul,2 GB
Plant Capacity Factor = WI + W2 fST Refusel 2x8,760xCgh LST Refuse
with
Cgh = hourly grate processing rate at 100% design load in (stph] WI = annual amount of waste processed by grate #1 in (stl W2 = annual amount of waste processed by grate #2 in (sU The superscript refers to average of grates #1 and #2.
Specific Steaming Rate SSRl,2 _ Sl + S2 in [Lb Steam J with
- 2,000x(Wl+W2) Lb Refuse
Sl = annual steam production for boiler #1 in ( Lb] S2 = annual steam production for boiler #2 in (Lb]
excessive use of water and reagents hurt the project economics.
During the second 5-year operating period, the Us [1, 2] closely approached the UGB [1, 2], thus proving that the extensive modifications and repairs previously were successful in correcting this situation. Also, the initial practice of grossly overloading the combustion and APe systems was stopped. More important was the fact that much valuable knowledge had been gathered from the early experience. This knowledge was then factored into the design of the new APe system III.
Table 1 indicates that almost from the start in 1980, scrubber operating hours virtually equalled grate/
22
boiler operating hours. Both the UGB [3] and the Us [3] quickly reached the 80 percentile range and remained there. In fact, the Utilization Quotient, or UQ), approached unity, clearly demonstrating that even wet acid gas scrubbing systems can be made to perform just as reliably as their associated grate/boiler systems.
APe SYSTEMS PERFORMANCE Next to equipment reliability, t� question arises as
to how efficiently the APe systems perform. The answer was provided by the National Testing Service (TuV Norddeutschland) which administered the acceptance tests.

Table 2 presents the results in separate columns for the old and the new system. Inspection of this table reveals that in the beginning, the operator was carried away by his enthusiasm. He wanted to run his boiler at full load which, because of the relatively low heat content of the refuse available at the time, led to gross overloading of th�grate, i.e., about 160%. See under Processing Line II.
As a consequence, the ESP's, or primary particulate control devices, were also overloaded, as can be gleaned from the evidence on enormous raw gas loadings. It then came as no surprise to learn that the ESP's effluent particulate concentration did not even meet the requirement of the older TAL 64, according to which it had been designed. With additional particulate removed in the scrubber, compliance was achieved, but it came at the price of erosion in scrubber and fan parts.
During the testing of Processing Line III, better refuse was available, as is evidenced by the higher specific steaming rates (up to 2.7 compared to 2.1 before). Additionally, the operator was more careful about load management. In effect, he set only his grate at full load (105%) and contented himself with a reduced load for his boiler (88%). As a result, the requirement of TAL 74 was met easily by the ESP and the SS/WS. In fact, even the future requirement of TAL 84 was met as well.
The subject of acid gas control effectiveness is addressed by Table 4. The TAL 74 limits for Hel and HF emissions, respectively, were not exceeded by comfortable margins. However, water and reagent use were relatively high. Although TAL 84 was not known at the time, its requirements could have been complied with as well.
The unusually high sulfur load is attributed to coal ash which, together with their garbage, was still being discarded in those days by the householders. In spite of the fact that this SS/WS was not specifically designed for it, better than half of the resultant S02 was removed.
The newer system, or III, did not meet the TAL 74 requirement for Hel control when it was first tested. This problem was easily met by the manufacturer who installed a special choke in the venturi. Although this modification increased pressure drop and fan horsepower consumption, this concession was quite acceptable, in view of the fact that the new design eliminated steam usage. Also, water and reagent use were drastically cut.
The modified system III demonstrated full compliance with TAL 74 and essentially with TAL 84. In the latter instance, an increase in the reagent appli-
23
cation rate would probably provide a more comfortable margin. The efficiency of S02 control was also improved, although this was accompanied by a sharp drop in influent loadings.
MARKET ACCEPTANCE Following the leadership of Kiel, the industry fully
embraced the requirements of TAL 74. Within a few years, all tlie leading APe manufacturers offered acid gas control systems, adding semi-dry and dry scrubbers to wet scrubbers. A broad-based description of these systems has been provided elsewhere [7]. As of this writing, there are some 27 plants equipped with acid gas scrubbers operating in West Germany alone [7]. It is anticipated that by 1988, all of West Germany's 46 plants will be in compliance with TAL 74 if not TAL 84.
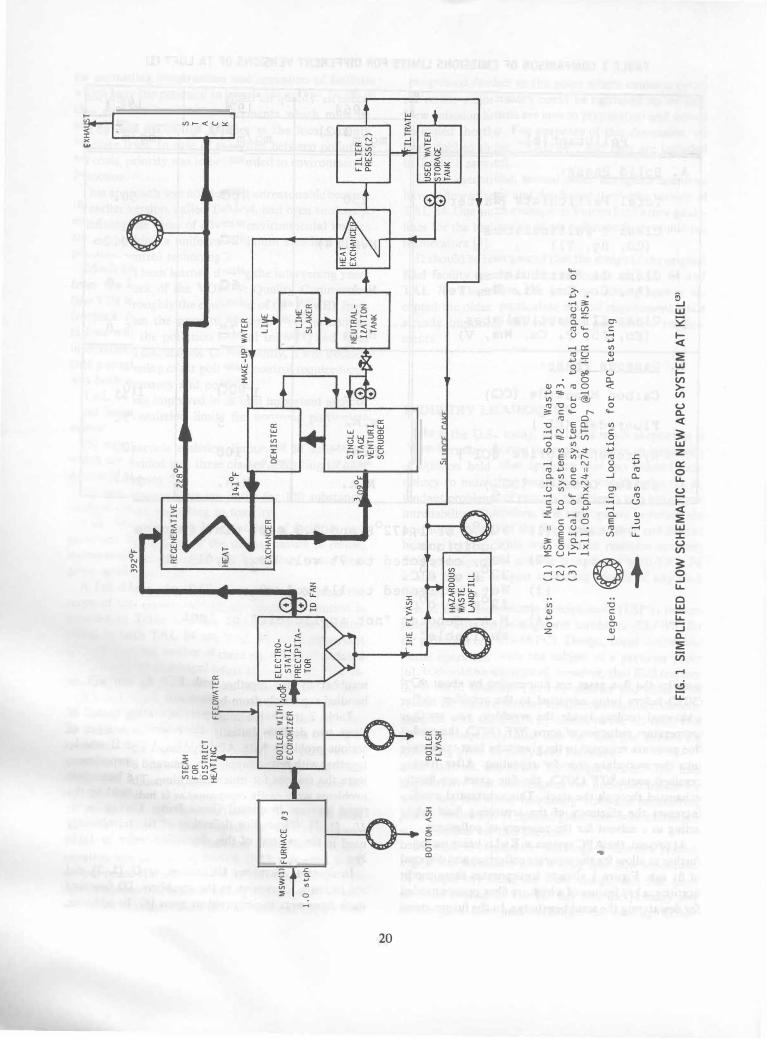
Is there a difference in systems performance because of technological differences? Figure 1 presents a comparative analysis for six different technologies as they were tested in 10 plants in West Germany and at one plant in Japan.
Kiel is entered as follows: 6a for system II testing, 6b for system III testing without choke, and 6c for system III testing with choke in place. Figure 1 shows that all technologies can satisfy TAL 74. Most can also satisfy TAL 84 in terms of the particulate, HF and S02 requirements even though some fine tuning may be required in several instances. The Hel requirement of TAL 84 may be a tougher challenge, but increased reagent use or fly ash recycling will be the primary counter strategies.
One relatively new technology which holds significant promise is the application of a recirculating, fluidized bed dry scrubber; note the entry in column 8. This fluidized bed can be combined either with an ESP or a fabric filter (FF). The first combination (ESP + FB/DS) has already been successfully tested in a fullsize, commercial-scale operation. It has exhibited some equally startling results with regard to the control of heavy metals [7].
DIOXIN /FURAN EMISSIONS In the past, APe systems have not been designed
explicitly for the purpose of controlling dioxins and/ or furans. Nevertheless, in light of the recent attention given to this new problem, the question has been posed: do TAL 74/84 type of APe systems help to control, at least in a passive way, the emission of these polychlorinated organic compounds�

tv
�
•
TA
BL
E 4
KIE
L A
PC
SY
ST
EM
S P
ER
FO
RM
AN
CE
, C
ON
TR
OL
OF
SO
LID
PO
LLU
TA
NT
S
Pa
ra
me
te
r
Fl
ya
sh
@
Bo
il
er
O
ut
le
t
Fl
ya
sh
@
Pr
ec
ip
it
at
or
O
ut
le
t
Fl
ya
sh
@
Sc
ru
bb
er
O
ut
le
t
Bo
il
er
C
on
di
ti
on
s
St
ea
mi
ng
R
at
e
Lo
ad
F
ac
to
r
Sp
ec
if
ic
S
te
am
in
g
Ra
te
Gr
at
e
Co
nd
it
io
ns
F
ir
in
g
Ra
te
L
oa
d
Fa
ct
or
Fl
ue
G
as
T
em
pe
ra
tu
re
@
Bo
il
er
O
ut
le
t
@ P
re
ci
pi
ta
to
r
Ou
tl
et
@
Sc
ru
bb
er
O
ut
le
t
Fl
ue
G
as
F
lo
wr
at
e
@ B
oi
le
r
Ou
tl
et
Fl
ue
G
as
Co
mp
os
it
io
n
@ P
re
ci
pi
ta
to
r
Ou
tl
et
C
O2
° 2 H 2
Un
it
o
f
Me
as
ur
em
en
t
mg
/N
m3
we
t
@ 11
% O
2
mg
/N
m3
we
t
@ 11
% 0 2
mg
/N
m3
we
t
@ 11
% 0 2
mt
ph
(4)
% M
T
St
ea
m/
MT
R
ef
us
e
mt
ph
(4)
% °c
(5)
°c
°c
Nm
3/h
we
t (6
)
% v
ol
. d
ry
%
vo
l.
dr
y
% v
ol
.
Pr
oc
es
si
ng
(l
) L
in
e
t2
5-11
/12-
76
8,32
5
255
19.3
16.8
5 10
5.3
2.1
8.02
16
0.4
N.A
. 22
4 N
.A.
39,2
56
N.A
. N
.A.
N.A
.
No
tes:
(l)
D
ata
So
urc
e:
Per
son
al
com
mu
nic
ati
on
s w
ith
pla
nt
op
era
tor,
8-5
-76
. (2
) D
ata
So
urc
e: P
erso
na
l co
mm
un
ica
tio
n w
ith
pla
nt
op
era
tio
n,
8-1
9-8
1.
(3)
N.A
. =
No
t A
vail
ab
le.
(4)
Fo
r co
nve
rsio
n f
rom
mtp
h t
o s
tph
, d
ivid
e b
y 1.1
(5
) F
or
con
vers
ion
fro
m °C
to of
, use
th
e fo
llow
ing
form
ula
: OF
= (O
C /J. 9/
5),
+ 3
2
(6)
Fo
r co
nve
rsio
n f
rom
m' /
h t
o ft
' / h
r, m
ult
iply
by
35
.3.
No
te:
ad
dit
ion
al
ad
just
men
ts m
ust
be
ma
de
for
dif
fere
nce
in
th
e re
fere
nce
te
mp
era
ture
use
d i
n E
uro
pe
ver
sus
the
U.S
.
Pr
oc
es
si
nq
L
in
e
13 (
2)
Wi
th
C
ho
ke
W
it
ho
ut
C
ho
ke
6-
22-8
1 4-
28/2
9-81
an
d
6-23
-81
N.A
. (3
)
21.8
7
9.1
25.5
79
.7
2.27
11.2
2 11
.22
204
203 30
58,9
22
9.22
10
.56
12.9
9
2,70
7
13.1
5
10.6
28.0
8 87
.8
2.67
10.5
0 10
5.0
211
210 61
54,3
81
9.1
10.6
13
.3

Based on extensive studies reported elsewhere, the answer is a qualified "yes" [7]. The qualification is based on the assumption that dioxins and furans are formed prior to entry of the carrier flue gases into the APC system. Thus, any potential catalystic and/or synergistic effects which might lead to the formation of additional diOJKns and furans inside the APC are not treated here.
Table 5 compares the results of recent testing performed at Kiel and nearby Hamburg, on behalf of governmental agencies. Both plants use wet scrubbers after ESP's, although Hamburg III has a more sophisticated multi-stage system. Space limitations prohibit detailed discussion of the many complex issues involved. However, in the section below, several generalized observations are offered.
The newer and possibly larger processing lines generate less, as a comparison of Kiel 75 (@ 5.5 TPH or 5.0 tph), Kiel 80 (@ 11 TPH or 10 tph) and Hamburg 11179 (@ 19 tph) would suggest. Furthermore, if taken as totals within their respective groups, less furans are generated than dioxins. Yet, a substantial amount of both are removed by the ESP's. This is believed to be possible because dioxins and furans have a propensity for accumulating on fine particles which are effectively separated by the ESP's.
Only very small amounts are removed by the wet scrubbers, except in Kiel #2, where, because of the overloading previously explained, a fair amount of fly ash spills over from the ESP into the scrubber for final separation there.
The Hamburg III APC system performed better across the board. This observation has been reinforced by comparisons contained in another study [7]. It is conceivable that the underlying cause may be the lower temperature and prolonged residence time at which this system operates. A number of recent papers have increasingly emphasized the existence and transport of dioxins and furans in the gas/vapor phase [7]. Thus, the mechanisms of condensation and absorption need to be reckoned with in addition to adsorption, which has been more often mentioned in the past.
For brevity'S sake, Table 5 is confined in solid phase phenomena, but more work is being done to deal with the other phenomena as well [8]. Preliminary results indicate that nearly 30% of all dioxin by mass and nearly 70% of all furan by mass may escape through the stack. About 20% of the dioxins may be captured by condensation, whereas less than 10% may be absorbed by solvent extraction. With regard to furans, the picture is different. Nearly 20% may be condensable, while some 50% may be collected by absorption only [7].
25
If these preliminary findings can be substantiated by additional research, then a new type of APC system may emerge in the future, combining filtration with cooling, adsorption and absorption. One such system is already undergoing laboratory tests in West Germany [7].
SCRUBBER RESIDUE DISPOSAL As mentioned before, the APC systems at Kiel are
being modified again. However, rather than any deficiencies in performance, environmental concerns are the motive this time. The authorities at Kiel, like others elsewhere in West Germany, have decided to consider fly ash as a hazardous substance. To a large extent, this decision was influenced by the potential risks associated with the accumulation of heavy metals and toxic organics in the residues resulting from more efficient flue gas cleaning. Apparently, the traditional practice of diluting fly ash with less polluted bottom ash prior to their joint disposal is no longer acceptable.
Consequently, Kiel is installing a new system for concentrating and drying scrubber sludge. This approach will leave a dry residue which can then be mixed with dry fly ash for safe disposal in a hazardous waste landfill. Several other facilities which feature wet scrubbers from acid gas control have already operated similar systems for years. Thus, liquid discharges have virtually been eliminated and technological progress has alleviated the most pressing environmental problem previously associated with wet scrubbers. In order to minimize costs, readily available wasteheat may be used in multi-effect evaporators where the final drying is to be accomplished.
CONCLUSION In order to align resource recovery facilities with
toughened environmental consideration, TAL 74 clearly set the goal for modem APC systems design. The industry responded with a variety of equipment and processes which demonstrate reliability and effectiveness. In fact, the state of the art has already progressed to the point where even attainment of TAL 84 is assured. While specialty issues such as heavy metals control have been addressed, more work needs to be done yet. This holds especially true with regard to certain organic trace compounds, such as dioxins and furans.
The designers of new acid gas systems are cautioned against disregarding the potential dangers associated with residue disposal. The need for separate fly ash

TABLE 5 KIEL APC SYSTEMS PERFORMANCE, CONTROL OF GASEOUS POLLUTANTS
Processing ProcessinQ Line t3 (3) (4) Unit of Line 12 (1) (2) With Choke Without Choke
Gaseous Pollutant Measurement 5-11/12-76 6-22-81 6-23-81
HCl (measured as Cl )
Scrubber Inlet Max. mg/Nm
3 N.A. (5) 1,220 Avg. wet 1,170 1,150 Min. @ 11% °2 N.A. 1,065
Scrubber Outlet Max. mg/Nm
3 44 57 Avg. wet 24*(6) 47 Min. @ 11% °2 N.A. 38
Removal Efficiency Avg. % 98.0 +1. 2/-1. 6 95.9 +1. 0/-1. 3 Sample Size n I 24 6
HF (measured as F )
Scrubber Inlet Max. 3 N.A. 12.2 Avg. mg/Nm wet 9.3 10.6 Min. @ 11% °2 N.A. 9.1
Scrubber Outlet Max. mg/Nm
3 N.A. 2.0 Avg. wet 0.4* 1.6 Min. @ 11% °2 N.A. 1.1
Removal Efficiency Avg. % 96.0 +1.7/-2.3 84.9 +6.0/-6.9 Sample Size n t 24 6
S02
Scrubber Inlet Max. mg/Nm
3 N.A. 170 Avg. wet 550 150 Min. @ 11% °2 N.A. 120
Scrubber Outlet Max. mg/Nm
3 350 31 Avg. wet 250 27 Min. @ 11% °2 N.A. 24.5
Removal Efficiency Avg. % 55.0 +3.5/-9.1 82.0 +3.6/-7.8 Sample Size n I 24 6
Notes: (1) (2)
Data Source: Personal communication with plant operator, 8-5-76 Specific Lime Rate: 4.71 kg Lime/MT Refuse Specific Water Rate: 1.32 Mt Water/MT Refuse Specific Steaming Rate: 2.10 MT Steam/MT Refuse Specific Stearn Consumption: 0.21 MT Steam/MT Refuse
89.2
83.8
79.0
(3) Data Source: Acceptance Test Report 1123 UM 00310 TuV Norddeutschland 8-19-81
( 4)
( 5) (6)
(7)
Specific Lime Rate: Specific Water Rate: Specific Steaming Rate: Specific Steam Consumption: N.A. = Not Available
3.70 0.63 2.27 o
kg Lime/MT Refuse MT Water/MT Refuse MT Steam/MT Refuse
* = Dilution with hot air bleed does not affect these results because of correction to 11% ° • For conversion from metric to tnglish units of measurement, refer to preceding tables.
26
1,520 1,280 1,140
176 138 109 +3.6/-4.6
6
14.3 11.7 10.8
3.5 1.9 1.1 +8.5/-16.2
6
190 157 130
38 33 28
+6.3/-8.2 6
..

N
�
TA
BLE
6 D
IOX
IN A
ND
FU
RA
N E
MIS
SIO
NS
FR
OM
GE
RM
AN
MA
SS
BU
RN
ING
IN
CIN
ER
AT
OR
S I
N (
PG
/t
X 10
6) �
io
n
Di
ox
in
/F
ur
an
G
ro
up
-
Kiel
!2
p(Q�
�s§ing
Li
n�
2
,3
,7
,8
-T
CD
D
E T
4C
DD
E
PC
DD
(3
-7
) O
CD
D
E P
CD
D(
3-
8)
Ki�l 13
p(Q��s
§ing �ine
2
,3
,7
,8
-T
CD
D
E T
4C
DD
E
PC
DD
(3
-7
) O
CD
D
E P
CD
D(
3-
8)
H�mQutg
III
'1
Pto�
�ssin
g Lin�
2
,3
,7
,8
-T
CD
D
E T
4C
DD
E
PC
DD
(?-
7)
OC
DD
E
PC
DD
(3
-8
)
Ki�l .
2
Pt
o��s
§ing �in�
2
,3
,7
,8
-T
CD
F
E T
4C
DF
E
PC
DF
(3
-7
) O
CD
F
E P
CD
F (
3-
8)
Ki�l .
� P
to
c�
ss
in
g L
in
�
2,
3,
7,
8-
TC
DF
E
T4
CD
F
E P
CD
F(
3-
7)
OC
DF
E
PC
DF
(3
-8
)
Hambu[g I
II .
1 P
tQc�
s§ing
Lin�
2,3
,7
,8
-T
CD
F
E T
4C
DF
E
PC
DF
(3
-7
) O
CD
F
E P
CD
F(
3-
8)
----
----- -
---
Bo
tto
m
Bo
ild
er
Fly
ash
F
ly a
sh
<7
.0
<
0.
4
<7
.0
1
1.
3
<17
5.
0
56
.7
2
10
.0
6
1.
0
38
5.
0
11
7.
7
<7.
0
<0.
2
<7.
0
1.
2
<17
5.
0
16
.4
2
10
.0
1
3.
9
38
5.
0
30
.3
0.
6
<0
.1
'-
8.
2
.,
2.
5
.2
9.
3
18
.0
to
4
.6
1
1.
7
33
.9
2
9.
7
N.
D.
1
.7
N
.D
.
21
. 8
N
.D
.
74
.1
N
.D
.
(1
.7
N
.D
.
75
.8
N.
D.
0
.4
N
.D
.
9.
9
N.
D.
3
5.
8
N.
D.
2
.0
N
.D
.
37
.8
<1.
8
., 0
.1
to
2.
8
5.
9
-4
2.
1
18
.3
_
15
.0
0
.7
5
7.
1
19
.0
-
� E
SP
1
st
St
ag
e
2n
d
St
ag
e
Sta
ck
S
ol
id
P
ha
se
F
ly a
sh
Sc
ru
bb
er
S
cr
ub
be
r
Fly
ash
T
ot
al
s
<1.
7
1.
0
N.
A.
8
.7
<1
8.
8
7.
0
30
.2
N
.A
.
0.
4
<55
.9
1
74
.4
1
25
.8
N
.A
.
1.
7
<55
3.
6
45
3.
3
12
5.
8
N.
A.
1
0.
9
86
1.
0
62
7.
7
25
1.
6
N.
A.
1
2.
6
111<1
,3
94
.6
<0.
8
0.
0
N.
A.
0
.1
<1
1.
9
14
.3
0
.7
N
.A
.
0.
7
<55
.6
1
11
.5
2
.8
N
.A
.
2.
4
00
8.
1
31
.8
2
.8
N
.A
.
6.
2
26
4.
7
14
3.
3
5.
6
N.
A.
8
.6
..
57
2.
8
., 0
.1
-
0
<lifO
-0
0
.8
3
.3
1/1
0.
1
tIS 0
.-
0.
3
..
14
.4
1
05
.2
1
.0
0
.1
1
.3
*
15
4.
9
23
2.
4
7.
3
3.
6
.0
.5
.
26
0.
1
33
7.
6
8.
3
3.
7
1.
8
41
5.
0
7.
0
3.
0
N.
A.
0
1
1.
7
20
9.
2
10
0.
7
N.
A.
1
.3
3
33
.0
6
97
.4
2
51
.7
N
.A
.
3.
9
1,
02
7.
1
34
.9
2
.5
N
.A
.
0.
1
39
.2
7
32
.3
2
54
.2
N
.A
.
4.
0
1,
06
6.
3
4.
8
0.
1
N.
A.
0
5
.3
1
11
.5
2
.3
N
.A
.
1.
0
12
4.
7
39
8.
4
5.
6
N.
A.
3
.8
4
43
.6
1
.6
0
.1
N
.A
.
0.
1
3.
8
40
0.
0
5.
7
N.
A.
3
.9
4
47
.4
., 0
.1
fil
l 0
fII
0
., 0
",
2.
0
12
.0
0
.2
0
.1
.,
0.
7
21
.7
8
4.
7
1.
0
0.
2
2.
2
14
8.
5
11
.5
0
.2
0
.4
"
0.
1
27
.9
9
6.
2
1.
2
0.
6
2.
3
17
6.
4

-
-
f\�;;a'g�,"Emi�siO�; (�;Nm3i �� �u�;-;� � Limits iTA Luft 84
� 1-'- _._.-._._ . - . - .-._ , ,-'0 ,.. IPARTICULATESI
- ,.. - -
,.. ...
-
:) j li� l -� � .-
� 1 :� � "
� � -S ia � � � \,. It � a � 0 ... .... io ... .. � a ... ...
:� I� � � � �� \. \. \. � ... ,. � � ia � � � � � � Iii! 'II �
1 2 3 4 5 6a6b6c 7 8 9a�b 10 11
Average Emissions (""g/Nm3 )
[;U ,..
,..� TA Luft 74 1--- . -..:-.-- - - -' Ti� tS1" --_' 1"1" _ • _.1..8. .lu.f.t!s!+_. -
- � � -I'""
1 ..,
�) .,
f- � � � 3 l Io'l VI � � i " 1::;-� � � 1: .., q I� f <l ., � '1 '? '? tf � a <l () a ... .. ... � ,. ... 'io ... � .... ..... \. � � � \. \. \. � Ifu q.,\. � � .., GI� \ij iii Ijj III I£j ..,'? lA 11141 1 2 3 4 5 6a6b6c 7 S 9a9b 10 11
10 �
10 z.
10 1
,..I'""� Average Em�ssions (mg/Nm )
GQJ
� TA Luft 74 - ----- -
'-
'- ' - '- '- ' -"
- Limit � � klLk - - �r-- - . .:'
� 'It � � g t i l
I l� � � " � It \I) �� Q � � � � I/) II) \I) C) q q .., q �
• • ... .. � � Q, � Q, 'e; . ,. � \. .. i-� \I) � �� ID � � \c& \IJ � iii III � 1Ii� 11& .... � �
1 2 3 4 5 6a6b6c 7 8 9a9b 10 11
Average Emissions (mg/Nm3)
I'"" r--1-- _.-
,..
... ... l $ � � � � ;., � lit � I\J ,. .. � I(j � \jj � l.IJ � Iii �
I S02 1 ,.. TA Luft 94 Limit -'-' - '-r:--' - . - .
- -
'?-
��J ... ...
�� \/.liZ, �
,..
-
� � 10 "-.... ..
� � I.a
rl , I , I , ,
� 1 I � � la' a � a 1 .., 1 \:' I iol ... � � I�I � \1,1 I ! 1 2 3 4 5 6a6b6c 7 S 9a9b 10 11
FIG. 2 COM PARA TIVE ANALYSIS FOR EMISSIONS FROM MASS BU RNING INCINERATORS WITH ENERGY RECOVERY
28
ft 84

disposal may become inevitable in the future. Therefore, the installation of separate collection and handling equipment is recommended as a precautionary step.
..
REFERENCES [1] "Technische Anleitung zur Reinhaltung der Luft." (TA
Luft), Bundes-Gesetzblatt. Bonn, August 28, 1974, S. 426, 525. [2] "Bundes-Immissionsschutzgesetz" (BImSchG), Bundes
Gesetzblatt. Bonn, March IS, 1974, S. 721, 1193. [3] Feindler, K. S. "The Codisposal Option-Krefeld's Meth
ods of Refuse and Sludge Disposal and Concomitant Electrical Power Generation." In Proceedings of the Energy Optimization of Water and Waste Water Management Conference. New Orleans, Louisiana: U.S. Department of Energy and Argonne National Laboratory, December 1979.
[4] "Allgemeine Verwaltungsvorschrift zur Anderung der Ersten AIIgemeinen Verwaltungsvorschrift zum Bundes-Immissionsschutzgesetz." (TA Luft), Bundes-Gesetzblatt, Bonn, February 28, 1983, S. 94.
29
[5] "Eidgenossische Richtlinien uber die LuftreinhaItung beim Verbrennen von Siedlungsabfallen." Berne, Switzerland, February 18, 1982.
[6] Feindler, K. S., and Grimm, H. "High Capacity Waste-toEnergy Conversion at the Kiel District Heating Station." In Proceedings of the 1982 National Waste Processing Conference. New York: The American Society of Mechanical Engineers, 1978.
[7] Feindler, K. S. "An Environmental Review of Air Pollution Control for Resource Recovery Facilities." Volume I. Wheatley Heights, New York: Beaumont Environmental Inc., September 1985 (unpublished).
[8] Nottrodt, A., et al. "Distribution of Polychloro-dibenzodioxin and Furan Emissions Between Particulates, Flue Gas Condensate and Impinger Absorption in Stack Gas Sampling." Chemosphere 14 (no. 6/7, June 1985): Pergamon Press, London.
Key Words: Baghouse; Boiler; Dust; Electrostatic recipitator; Emission; Equipment; Europe; Fluidized Bed; Fly Ash; Gases; Grate; Incineration; Incinerator; Kie1, F.R.G.; Maintenance; Measurements; Operation; Particulate Matter; Performance; Pollution; Process; Refuse; Scrubber; Solid; Stack; State of the Art; Sulfur; Technology; Testing; Waterwall