LONG TERM POPULATION DYNAMICS AND THE EFFECTS OF ...
19
2010 SUMMER RESEARCH REPORT | Page 1 LONG TERM POPULATION DYNAMICS AND THE EFFECTS OF PRESCRIBED FIRE ON THE WINTER RANGE OF THE YA HA TINDA ELK HERD SUMMER 2010 Prepared By: Scott Eggeman and Mark Hebblewhite, College of Forestry and Conservation, The University of Montana and Lindsay Glines and Evelyn Merrill, University of Alberta, With contributions from Jodie Dunbar, Parks Canada, and Semi-annual Research Progress Report
Transcript of LONG TERM POPULATION DYNAMICS AND THE EFFECTS OF ...

2010 SUMMER RESEARCH REPORT
| P a g e
1
LONG TERM POPULATION DYNAMICS AND THE EFFECTS OF PRESCRIBED FIRE ON THE WINTER RANGE OF THE YA HA TINDA ELK HERD
SUMMER 2010
Prepared By: Scott Eggeman and Mark Hebblewhite, College of Forestry and Conservation, The University of Montana and Lindsay Glines and Evelyn Merrill, University of Alberta, With contributions from Jodie Dunbar, Parks Canada, and
Semi-annual Research Progress Report

2010 SUMMER RESEARCH REPORT
2 | P a g e
Acknowledgements We would like to thank the many dedicated researchers before us for their diligence and commitment to the Ya Ha Tinda Elk and Grassland Ecosystem Project. We thank Holger Spaedtke, Antje Bohm, Lindsay Glines, Barry Robinson and Ali Pons among countless others for their contributions and prior work. Thanks to the ranch staff: Rick and Jean Smith, Rob Jennings, and Tom McKenzie for all their logistical help and patience with our research efforts. To the Parks Canada Staff: Blair Fyten, Tom Hurd, Jesse Whittington, Karsten Heuer, Ian Pengally and many more for financial and technical support, and assistance on backcountry trips. A special thanks to Jodie Dunbar and Mercedes McLean for their tireless effort and positive attitude while assisting MS student, Scott Eggeman with field work and data collection – not a menial task! Thanks to the Banff Citizen Science group for assistance with fall pellet counts. Administrative assistance was provided by Anthony Bertram. Funding Funding for the Long-term Ya Ha Tinda Elk and Grassland Ecosystem project was provided by Parks Canada, Alberta Conservation Association, The University of Alberta, and The University of Montana. Disclaimer The information provided in this progress report represents preliminary results and are to be interpreted as such. Data collected over the summer will be used for graduate research theses and results are subject to revision.
2010 SUMMER RESEARCH REPORT
3 | P a g e
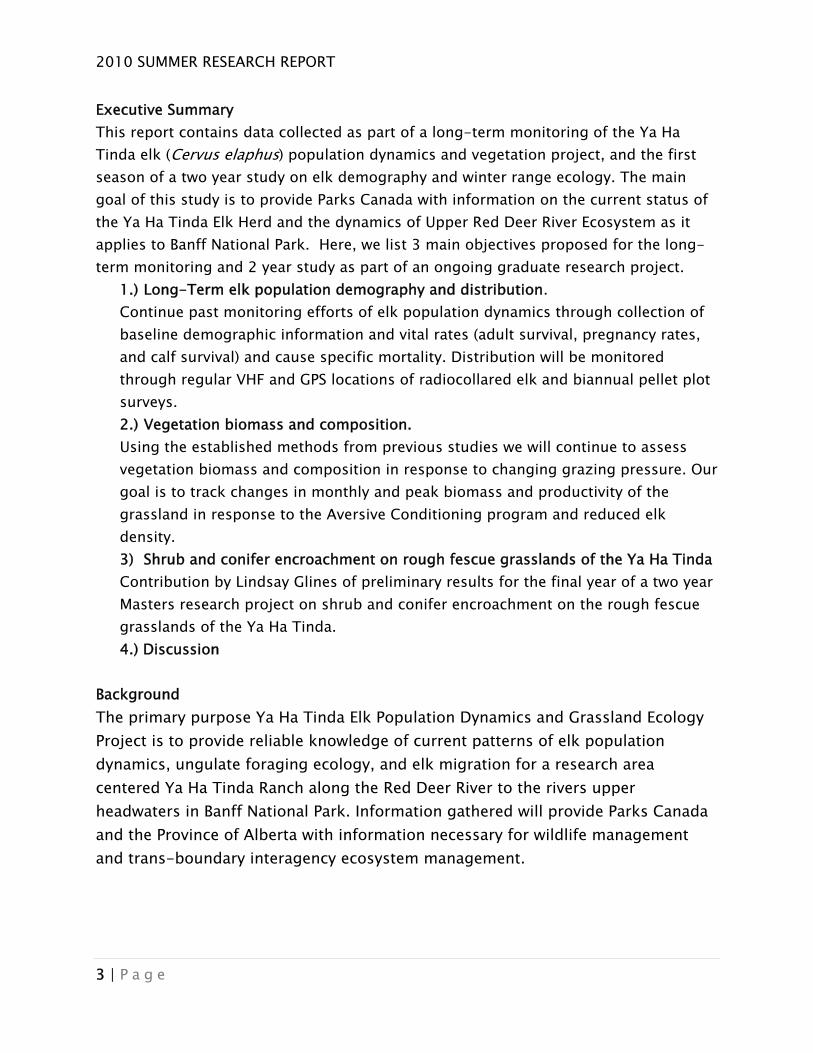
Executive Summary This report contains data collected as part of a long-term monitoring of the Ya Ha Tinda elk (Cervus elaphus) population dynamics and vegetation project, and the first season of a two year study on elk demography and winter range ecology. The main goal of this study is to provide Parks Canada with information on the current status of the Ya Ha Tinda Elk Herd and the dynamics of Upper Red Deer River Ecosystem as it applies to Banff National Park. Here, we list 3 main objectives proposed for the long-term monitoring and 2 year study as part of an ongoing graduate research project.
1.) Long-Term elk population demography and distribution. Continue past monitoring efforts of elk population dynamics through collection of baseline demographic information and vital rates (adult survival, pregnancy rates, and calf survival) and cause specific mortality. Distribution will be monitored through regular VHF and GPS locations of radiocollared elk and biannual pellet plot surveys. 2.) Vegetation biomass and composition. Using the established methods from previous studies we will continue to assess vegetation biomass and composition in response to changing grazing pressure. Our goal is to track changes in monthly and peak biomass and productivity of the grassland in response to the Aversive Conditioning program and reduced elk density. 3) Shrub and conifer encroachment on rough fescue grasslands of the Ya Ha Tinda Contribution by Lindsay Glines of preliminary results for the final year of a two year Masters research project on shrub and conifer encroachment on the rough fescue grasslands of the Ya Ha Tinda. 4.) Discussion
Background The primary purpose Ya Ha Tinda Elk Population Dynamics and Grassland Ecology Project is to provide reliable knowledge of current patterns of elk population dynamics, ungulate foraging ecology, and elk migration for a research area centered Ya Ha Tinda Ranch along the Red Deer River to the rivers upper headwaters in Banff National Park. Information gathered will provide Parks Canada and the Province of Alberta with information necessary for wildlife management and trans-boundary interagency ecosystem management.

2010 SUMMER RESEARCH REPORT
4 | P a g e
1Long-term elk population demography and distribution 1.1 Observations Elk observations were conducted each morning at first light along a transect route from the ranch compound to the eastern property boundary along the ranch road. We used 10× 42 Leopold binoculars and a 20 × 60 Bushnell spotting scope for visual detection. A total of 492 observations were recorded during 102 observation days between 10 May and 28 August of 2010. Each elk group or individual encounter is considered an observation. For each observation we recorded: date, time, and UTM location. If conditions permitted elk were classified by the number of individuals, sex and age class, individual ID, and whether or not a cow had a calf. Following the methods already used in former studies (Hebblewhite et al 2003) calf survival was determined using standardized criteria to sex- and age-classify elk in groups and obtain cow: calf ratios (Smith and MacDonald 2002). Specifically, tagged and/or radio-collared elk observed with a calf were recorded. Successfully identified cow calf pairs will continue to be monitored at intervals throughout the year until 1 April to determine survival. If an identified calf survives to 1April then survival will be assumed to be 100 percent beyond that point. Similarly, migrant elk monitored during the summer will be recorded as having a calf present or not and periodically monitored during November and in winter to assess calf survival for migrant elk. A list of all marked adult females with calves is reported in the Appendix, Table 1.
For summer classifications we narrowed are observations to range from 15 June – 31 August to represent the period of highest vulnerability for calves starting from the biological year when calves are born (1 June) and accounting for a 15 day period when calves are hidden and separated from the herd (White et al.2010). During this period we had a total of 237 elk observations and classified a total of 2684 elk. Sex and ageclass ratios were: cow:bull 100:15, cow:yly male 100:4, cow:yly female 100:9, and 100:21for cow:calf ratios (Table 1).
Table 1. Elk sex and age ratios reported for March 2009 & 2010 and summer (15 June – 31 August) 2009 & 2010.
Classifications March 2009 Summer 2009 March 2010 Summer 2010N Ratio N Ratio N Ratio N Ratio
Cow 575 100 1213 100 155 100 1792 100 Bull 3 <1 38 3 10 6 275 15 YLY Males 11 2 63 5 3 2 78 4 YLY Females 12 2 48 4 18 12 155 9 Calves 94 16 477 39 52 34 384 21 Total 695 1793 238 2684

2010 SUMMER RESEARCH REPORT
5 | P a g e
1.2 Biotelemetry and Migratory Behavior Elk were monitored each morning from the same location using a handheld telemetry receiver (Model R1000, Communications Specialists Inc.) and an omni antenna. Presence data are used to discern migratory individuals based on the percentage of days each elk was detected on the ranch as a proportion of the number of days surveyed per summer field season. Individuals that were detected less than 20% of the time were considered migratory, 21-64% partial migrants, and 65-100% residents (Table 2). Presence telemetry was also used for detecting mortality signals within range of detection (~5km radius). Table 2. Ratio of elk based on migratory status.
Approximately 2-4 times per month elk telemetry transects were conducted along the ranch road from the eastern boundary of the ranch to Sundre, AB. We used detections of collared elk to supplement migratory information obtained from presence data. In addition, we triangulated locations for each elk detected along the transect route at a minimum of two times per month. Locations for each resident elk were obtained at least once per month using triangulation or by observation.
We located migrant elk by aerial telemetry (Cessna 337 Skymaster) on 18 June and 24 June7 for a total of ~7 hours. Our pilot was Sean Biesbroek of Wildlife Air Observation Services Inc., Springbank Airport, Alberta. A total of 34 migrant or partially migrant elk were located along the Red Deer River and within the Park Boundary to Banff and Lake Louise along the Bow River Valley (Fig. 1).
Two backcountry trips were conducted to track migrant elk and investigate mortality sites; the first from 29 June to 3 July and a second from 13 July to 21 July. We totaled 14 days in the backcountry. Six migrant elk were located (BL265, BL272, BL252, BL285, OR5, YL62) during backcountry trips and five mortalities were recovered (YL38, YL37, GR108, YL07, GR184). Only one collared elk located in the backcountry was observed with a calf (YL62).
2010 Migrant ratios N Percentage Resident 12 20 Partial Migrant 21 36 Migrant 26 44

2010 SUMMER RESEARCH REPORT
6 | P a g e
Figure 1. Locations of migrant elk from flights conducted on 17 and 24 June 2010.
.3 Pellet Counts -term pellet counts in the grassland (<60% canopy cover; McInenly
n
1We continued long2003) of the Ya Ha Tinda. Spring pellet counts were conducted during the first two weeks of May and represented winter use of the ranch. Fall counts occurred betwee9-12 September and represent summer use. Grassland plots were 25 m2 circular plotslocated in a systematic grid at 250-m intervals across the grasslands (Fig. 2). Pellet groups were defined as containing at least 8 pellets and counted if >50% of a group was within the plot. Ungulate species recorded include elk, deer (Odocoileus

2010 SUMMER RESEARCH REPORT
7 | P a g e
virginiana, O. hemonius), horse (Equis), bighorn sheep (Ovis canadensi ) and Alces alces). Color, weathering, and shape of pellets was used to determine pellet
species and age. Elk pellets deposited in the winter had a squared bullet shape, whisummer pellets can transition to a soft coalesced or disc form (Murie and Elbroch, 2005). Deer pellets were similar but smaller, typically under 1 cm in length. Black pellets were considered recently deposited, where as grey or white color indicated pellets deposited last season or even a year earlier. The presence of wolf and coyot(Canis latrans) scat was recorded when encountered.
s moose (
le
e
Figure 2. Locations of grassland pellet plots within different habitats across the Ya Ha Tinda ranch, AB.
1.4 Mortalities Mortalities were detected from ground telemetry during morning presence/absence or aerial telemetry. Average time between detecting a mortality signal and locating the animal was 9.38 days. A total of 19 mortalities have been detected since the beginning of the calendar year, 17 of those were detected during the summer. We located 8 mortalities within the Park boundary and 11 were located on the ranch or along the front ranges (Fig.3). We determined 13 mortalities were predator related, 10 by wolves

2010 SUMMER RESEARCH REPORT
8 | P a g e
(Canis lupus), 2 from grizzly bear (Ursus arctos), and 1 from cougar (Puma concolor). Causes for 3 mortalities were undetermined and one was by train (Table 3). The current number of collared elk remaining at the end of the 2010 summer field season was 60, however, two of those (Gr131 & GR 177) have been missing since 2008, and two other collars may no longer be working. Therefore we can verify only 56 working radiocollars (see Appendix, Table 2).
gure 3. Map of mortality locations with ID numbers from summer 2010. Fi

2010 SUMMER RESEARCH REPORT
9 | P a g e
Table 3) Table listing mortalities found during 2010 representing mortalities from the current and previous year. Date Found Date killed EASTING NORTHING MORTALITY CAUSE Name/Ear Tag Age Class Date/Last
Location Migratory status
9/12/2010 9/1/2010 595961 5730842 Wolf bl254 ADULT 8/19/2010 Resident
9/9/2010 8/25/2010 599556 5731768 Wolf ADULT Unknown
8/23/2010 8/16/2010 594911 5730227 Wolf yl52 ADULT 8/12/2010 PM
6/24/2010 Unk 536901 5726102 Wolf Bl275 ADULT 2/13/2010 Migrant
6/24/2010 Unk 557358 5717767 Unknown BL266 ADULT 6/15/2009 Migrant
7/10/2010 7/9/2010 600084 5732100 Other BL270 ADULT 6/29/2010 Resident
6/24/2010 6/1/2010 592645 5706127 Unknown Gr108 ADULT 5/24/2009 Migrant
6/19/2010 6/1/2010 584037 5748114 Unknown yl37 ADULT 5/13/2010 Migrant
6/19/2010 Unk 593526 5716015 Wolf Gr184 ADULT 7/08/2009 Migrant
6/19/2010 6/5/2010 586886 5713738 Grizzly Bear Yl38 ADULT 5/14/2009 Migrant
6/12/2010 6/12/2010 600447 5732647 Grizzly Bear YOY Unknown
6/19/2010 6/15/2010 582420 5729282 Wolf yl7 ADULT 6/09/2010 PM
7/5/2010 6/7/2010 593409 5730338 Wolf Bl235 ADULT 6/03/2010 PM
6/7/2010 6/1/2010 598595 5732596 Wolf ADULT Unknown
6/1/2010 5/26/2010 641226 5726093 Wolf YL 50 ADULT 5/25/2010 Migrant
5/18/2010 5/17/2010 599476 5732465 Wolf ADULT Unknown
3/16/2010 3/15/2010 600004 5732286 Cougar bl249 ADULT 3/15/2010 Migrant
1/22/2010 1/22/2010 602400 5674000 Railway yl29 ADULT 1/12/2010 Migrant
2010 SUMMER RESEARCH REPORT
10 | P a g e
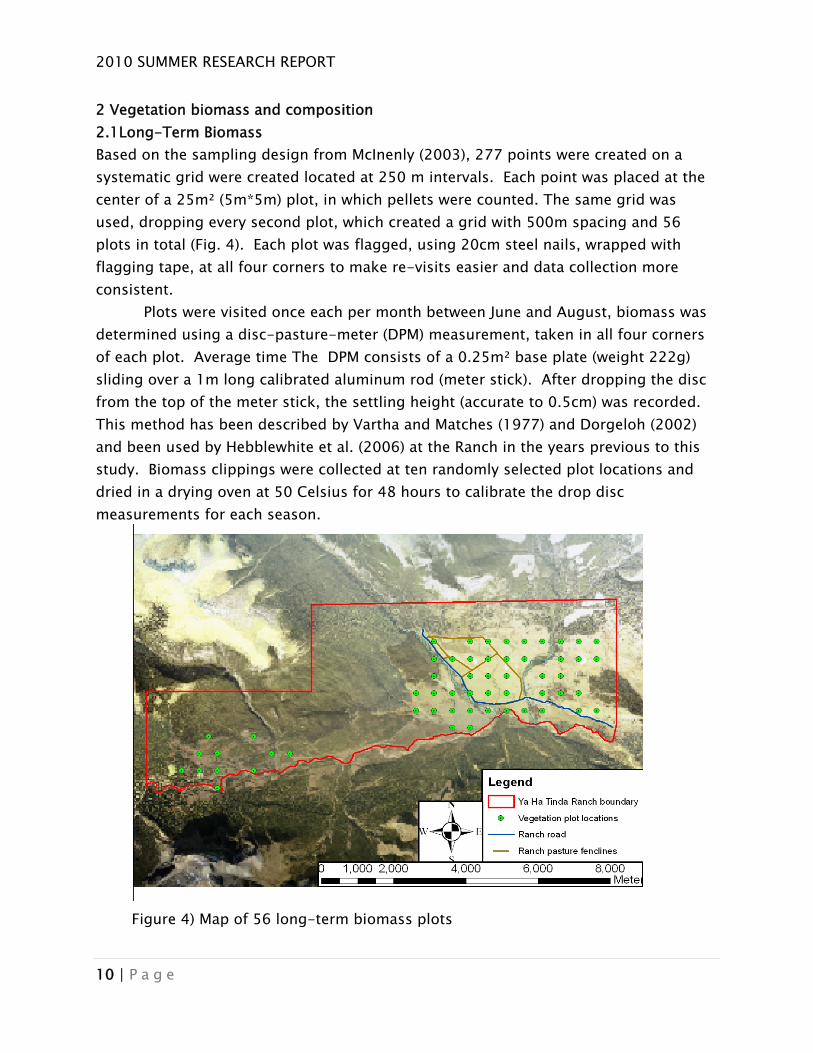
2 Vegetation biomass and composition 2.1Long-Term Biomass Based on the sampling design from McInenly (2003), 277 points were created on a systematic grid were created located at 250 m intervals. Each point was placed at the center of a 25m² (5m*5m) plot, in which pellets were counted. The same grid was used, dropping every second plot, which created a grid with 500m spacing and 56 plots in total (Fig. 4). Each plot was flagged, using 20cm steel nails, wrapped with flagging tape, at all four corners to make re-visits easier and data collection more consistent. Plots were visited once each per month between June and August, biomass was determined using a disc-pasture-meter (DPM) measurement, taken in all four corners of each plot. Average time The DPM consists of a 0.25m² base plate (weight 222g) sliding over a 1m long calibrated aluminum rod (meter stick). After dropping the disc from the top of the meter stick, the settling height (accurate to 0.5cm) was recorded. This method has been described by Vartha and Matches (1977) and Dorgeloh (2002) and been used by Hebblewhite et al. (2006) at the Ranch in the years previous to this study. Biomass clippings were collected at ten randomly selected plot locations and dried in a drying oven at 50 Celsius for 48 hours to calibrate the drop disc
measurements for each season.
Figure 4) Map of 56 long-term biomass plots

2010 SUMMER RESEARCH REPORT
11 | P a g e
For every disc measurement the average % species cover was determined (gras ological stage of the measured grass w of
n m biomass
orage biomass (g/m2) at the peak of the growing season was statistically modeled ap derived from a supervised classification of LANDSAT TM
nds, ). The
ndcover type, fire cover types,
slope,t
e.
06).
on
grasslands of the Ya Ha Tinda Lead: Lindsay Glines
Ove ntury, fire suppression in the eastern slopes of the Rocky M as created an unnatural mean fire return interval and fire cycle. Rough fescue grasslands along the Red Deer River Valley provide high quality forage for the
ses, forbs, shrubs and bare ground). The phenas recorded as old, newly emergent, flowering or cured. In addition the %
biomass grazed was assigned. This simple classification has been used by Hebblewhite et al. (2006) before and gives the ability to determine deviations betweedrop disc readings and grass height measurements. Results for the long-terare reported in the annual Aversive Conditioning report submitted by Jodie Dunbar. 2.2 Peak Biomass Fwithin a landcover mimagery at a spatial resolution of 30m2(Franklin et al. 2001, McDermid 2005,). Landcover types included: closed conifer, moderate conifer, open conifer, shrublaupland herbaceous, mixed forest, deciduous, (see Franklin et al. 2001 for detailslandcover classification was expanded to include fires in three vegetation types (forest, grassland, and shrub). Cutblocks and salvage logged burns were important and were therefore included in our design (Munro et al. 2006).
Peak forage biomass was sampled randomly following a proportional allocationdesign (Thompson 1992) within strata designated by la
and aspect classes. Between 27 July and 21 August, 70 peak of biomass sites were sampled for a sampling intensity of .08/km2. Average sampling date was ~Augus10. At each site, plant cover was estimated within five 1m2- quadrats systematically placed along a 30-m transect and clipped total (green + standing dead) herbaceous biomass in three 0.25m2quadrats, which were averaged for one biomass estimate/sitWet mass of forage biomass was weighed in the field; in the lab dry weight was obtained from n=210 samples oven dried at 50°C for 48 hours. Total shrub biomass was estimated using the basal diameter–biomass relationships (Visscher et al. 20Shrub biomass was converted to biomass of only forage species and leaf-forage biomass (g/m2) using mean % conversions for both within each landcover type. Data from peak biomass sampling will be used in the future to inform Resource SelectiFunctions (RSF’s) for Scott Eggeman’s M.Sc. project.
3) Shrub and conifer encroachment on rough fescue
Background r much of the past ce
ountains h

2010 SUMMER RESEARCH REPORT
12 | P a g e
wintering Banff elk herd, and a reduction in area or quality of grassland habitat dueencroachment of trees and/or shrubs could alter the ability to support this partially migratory herd. Analysis of six (1952 ,1962, 1972, 1982, 1992, 2003) sets of photos was completed in July 2010 to evaluate the extent of vegetation change over a 50-year time period. A preliminary analysis of small-scale changes along grassland-woody vegetation ecotone has also been completed and can be found in: Glines L., Bohm, A., S. Eggemen, S., E. Merrill, M. Hebblewhite. 2009. Red Deer River Valley Ecotone and Elk Project: Second year progress report, June 2008. University of Alberta. 26pgs Methods Sites This analysis focused specifically on grassland complexes at four sites (Ya Ha Tind
to
a t Lakes [WL] Tyrell Creek [TY], Scotch Camp [SC], and which establish an east
(high) to west (low) grazing gradient with the Red Deer river drainage. Past high
rate
el size of 1 2. Images were georeferenced using a minimum of 10 ground tie points to existing
Parks Canada orthorectified images within an ArcGIS program. Vegetation classes
to
eneral decrease in grassland area for each study site except the YHT ig 1). Each study site photo series fits a linear decrease in grassland area well ( WL;
R , P<0.05, TY; R2 =0.91, P<0.05, SC; R2 =0.99, P<0.05), except the YHT. As
[YHT] Wes
herbivory in areas such as YHT and WL, in combination with fire suppression at the YHT and WL would likely increase the rate or total amount of grassland loss. The west has experienced prescribed burns since 1983 (White 2001), and historically modeherbivory, where encroachment might be expected to be moderate to low. Analysis Photographs were scanned at a high resolution (1000 DPI +), to provide pixm
(grassland, shrubland, mixedwood and coniferous) as well as other (water, buildings, bare ground, pasture, logged) landcover types were delimited using standard photo interpretation (PI) techniques. This process was repeated in each study site and phoyear. The total area of vegetation types was reported for encroachment analysis, and acontingency table developed for assessing accuracy of PI relative to ground-truthed vegetation types. Results There has been a g(F
2=0.76
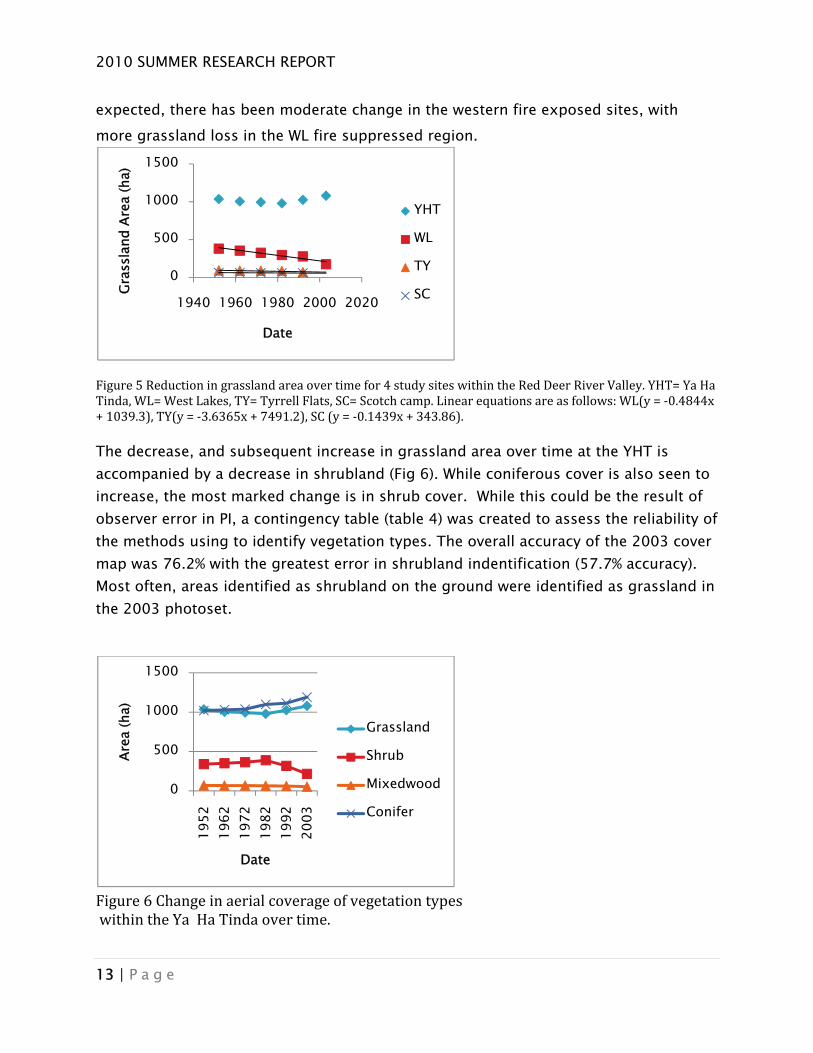
2010 SUMMER RESEARCH REPORT expected, there has been moderate change in the western fire exposed sites, with more grassland loss in the WL fire suppressed region.
13 | P a g e
n to
f
n
Figure 5 Reduction in grassland area over time for 4 study sites within the Red Deer River Valley. YHT= Ya Ha Tinda, WL= West Lakes, TY= Tyrrell Flats, SC= Scotch camp. Linear equations are as follows: WL(y = ‐0.4844x + 1039.3), TY(y = ‐3.6365x + 7491.2), SC (y = ‐0.1439x + 343.86).
The decrease, and subsequent increase in grassland area over time at the YHT is
0
500
1000
1500
a)
1940 1960 1980 2000 2020
Gra
ssla
nd A
rea
(h
Date
YHT
WL
TY
SC
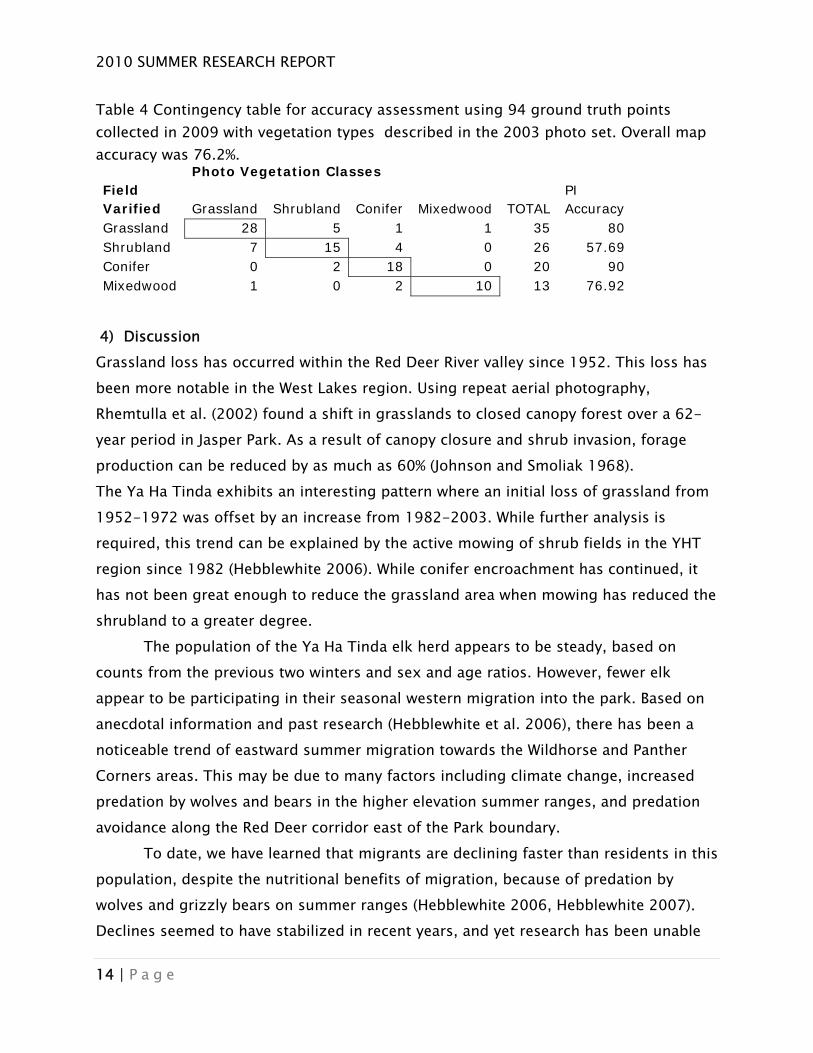
accompanied by a decrease in shrubland (Fig 6). While coniferous cover is also seeincrease, the most marked change is in shrub cover. While this could be the result of observer error in PI, a contingency table (table 4) was created to assess the reliability othe methods using to identify vegetation types. The overall accuracy of the 2003 cover map was 76.2% with the greatest error in shrubland indentification (57.7% accuracy). Most often, areas identified as shrubland on the ground were identified as grassland ithe 2003 photoset.
f vegetation types Figure 6 Change in aerial coverage o
within the Ya Ha Tinda over time.
0
500
1000
1500
1952
1962
1972
1982
1992
2003
Area
(ha)
Date
Grassland
Shrub
Mixedwood
Conifer
2010 SUMMER RESEARCH REPORT
14 | P a g e
Table 4 Contingency table for accuracy assessment using 94 ground truth points ap
egetation Classes
Grassland Shrubland
collected in 2009 with vegetation types described in the 2003 photo set. Overall maccuracy was 76.2%. Photo Vield F
Varified Conifer Mixedwood TOTAL PI
uracy
AccGrassland 28 5 1 1 35 80 Shrubland 7 15 4 0 26 57.69 Conifer 0 2 18 0 20 90 Mixedwood 1 0 2 10 13 76.92
Discussion
as occurred within the Red Deer River valley since 1952. This loss has
a 62-
and from
HT
e
Ha Tinda elk herd appears to be steady, based on counts
on
han residents in this popula
).
4)Grassland loss hbeen more notable in the West Lakes region. Using repeat aerial photography, Rhemtulla et al. (2002) found a shift in grasslands to closed canopy forest overyear period in Jasper Park. As a result of canopy closure and shrub invasion, forage production can be reduced by as much as 60% (Johnson and Smoliak 1968). The Ya Ha Tinda exhibits an interesting pattern where an initial loss of grassl1952-1972 was offset by an increase from 1982-2003. While further analysis is required, this trend can be explained by the active mowing of shrub fields in the Yregion since 1982 (Hebblewhite 2006). While conifer encroachment has continued, it has not been great enough to reduce the grassland area when mowing has reduced thshrubland to a greater degree.
The population of the Ya from the previous two winters and sex and age ratios. However, fewer elk
appear to be participating in their seasonal western migration into the park. Basedanecdotal information and past research (Hebblewhite et al. 2006), there has been a noticeable trend of eastward summer migration towards the Wildhorse and Panther Corners areas. This may be due to many factors including climate change, increasedpredation by wolves and bears in the higher elevation summer ranges, and predation avoidance along the Red Deer corridor east of the Park boundary.
To date, we have learned that migrants are declining faster ttion, despite the nutritional benefits of migration, because of predation by
wolves and grizzly bears on summer ranges (Hebblewhite 2006, Hebblewhite 2007Declines seemed to have stabilized in recent years, and yet research has been unable

2010 SUMMER RESEARCH REPORT
15 | P a g e
to determine if wolves and elk have reached a balance, or whether other factors are halting declines. Understanding the role of wolves in regulating elk to low density is key management question.
The goals of Scott Egge
a
man’s Master’s research will be to examine the general hypoth
io of
l
e
attemp rve
f ~80
002. Calibrating a disc pasture meter to estimate above-ground
Frankli enhouse, M.J. Hansen, C.C. Popplewell, J.A. Dechka, and D.R. Peddle. 2001. An integrated decision tree approach (IDTA) to mapping landcover using sattelite remote sensing in support of grizzly bear habitat analysis in the
esis that vital rates (survival, pregnancy and calf survival) of migrant and resident elk vary with changes in density and predation to determine a stable ratmigrants to residents in a population. Specifically, we will test whether wolf predation has regulated elk to a low density equilibrium (i.e., that wolf predation is density-dependent with elk density; Sinclair 1989). Second, we will test the hypothesis thatmigrants are still being impacted more by wolf predation. We predict that 1) cause-specific mortality by wolves will decrease with decreasing elk density, and 2) survivarates will be lower for migrants and their calves compared to resident, we will test thishypothesis using a long-term dataset of over 300 adult female elk collected from 2001 through past and present field research. In addition, we will assess how changes to resource availability on the winter range due to prescribed fires differentially affects resource selection strategies of resident and migratory adult female elk. We will test the hypothesis that burning of winter range grasslands will enhance forage quality. Wpredict that elk will select for burned areas more often compared to non-burned areas. To test this hypothesis, we will use data from GPS collared elk and VHF telemetry since 2001, in addition to pellet data to compare pre- and post-burn resource selection.
Our goals for the 2011 field season remain relatively unchanged. We will t three backcountry packtrips in 2011 to locate mortalities and try to obse
migrant elk with calves of the year. During the winter of 2011, we may trap and radiocollar and/or eartag 20-30 additional elk to maintain a target sample size oelk. A spring progress report in 2011 will elaborate on specifics for the summer seasonand developments over the winter field season. Literature CitedDorgeloh, W.G. 2
standing biomass in mixed bush-veld, South Africa. African Journal of Ecology 40:100-102. n, S.E., G.B. St

2010 SUMMER RESEARCH REPORT
16 | P a g e
Alberta Yellowhead Ecosystem. Canadian Journal of Remote Sensing 27:579592. white, M. 2006. Linking predation risk and forage to ungulate population dynamics.University of Alberta. Edmonton, Alberta. 256 pg
-
Hebble
sons the
McDer lti-jurisdictional habitat
McInenly, L.E. 2003 Seasonal effects of defoliation on montane rough fescue (Festuca
Munro fects of post-fire logging on elk
region of Jasper National Park, Alberta, Canada. Canadian Journal of Forestry Resources 32: 2010-2021
Sanchral Park,
anada. Journal of Environmental Management 77:183-193
Spaedt f
mith, L. B., and T.L. McDonald. 2002. Criteria to Improve Age Classification of
Sinclair, A. R. E. 1989 Population regulation of animals. In Ecological Concepts (ed. J.
Vissch stimating woody browse
Hebblewhite, M. 2007 Predator-prey management in the National park context: lesfrom a transboundary wolf-elk, moose, and caribou system. Transactions ofNorth American Wildlife Conference 72, 348-365.
Johnson, A. and S. Smoiak. 1968. Reclaiming brush land in southwestern Alberta. Journal for mid, G. J. 2005. Remote sensing for large-area, mumapping. Dissertation. University of Calgary.
campestrisRydb.). University of Alberta, MSC. , R., M. Hebblewhite, and E.H. Merrill. 2006. Efhabitat during the first 3-years post burn. Forest Ecology and Management, In prep.
Murie OJ, Elbroch M (2005). Animal Tracks, Peterson Field Guide Series 3rd Ed. Houghton Mifflin Company, New York
Rhemtulla, J.M., R.J. Hall, E.S. Higgs, and S.E. MacDonalds. 2002. Eighty years ofchange: vegetation in the montane eco
o L.L., W.L. Stronga, and C.C. Gates. 2005. Prescribed burning effects on summer elk forage availability in the subalpine zone, Banff NationC
ke, H.R. 2009 Aversive conditioning of elk at the Ya Ha Tinda. University oAlberta, Msc.
SAntlerless Elk. Wildlife Society Bulletin. 30:200-207.
M. Cherret), pp. 197-241. Oxford: Blackwell. er, D. R., E. H. Merrill, D. Fortin, and J. L. Frair. 2006.Eavailability for ungulates at increasing snow depths. Forest Ecology and Management222:348-354.

2010 SUMMER RESEARCH REPORT
17 | P a g e
White, C.A., E.G. Langemann, C.C. Gates, C.E. Kay, T. Shury, and T.E. Hurd. 2001. Plains bison restoration in the Canadian Rocky Mountains? Ecological and management 299 considerations. In Harmon, D., editor.
n
White, , l of
Crossing boundaries to manage wildlife: Proceedings of the 11th Conference on Research and Resource Management in Parks and oPublic Lands. The George Wright Society, Hancock, Michigan. C.G., P. Zager, M.W. Gratson. 2010. Influence of Predator HarvestBiological Factors, and Landscape on Elk Calf Survival in Idaho. JournaWildlife Management 74(3):355-369.

2010 SUMMER RESEARCH REPORT
18 | P a g e
Appendix able 1) List of all marked elk observed with an elk calf. An M designates migrant and
tes partial migrant. TPM designa
BL204 BL213 BL220pm BL221pm BL222 BL234 BL242 BL244
BL287m Bl254 Bl256 BL257 BL264 OR3 BL267pm Bl269
BL295 BL299 GR140 BL246 GR99 OR1 OR13 OR2
OR7pm YL58 YL62m YL80 OR6pm
Table 2) All remaining radiocollared elk after 12 September 2010. Ear tag ID
presents tag color: bl = blue, gr = green, or = orange, yl = yellow, and number. The reletter G identifies elk with GPS collars.
Ear Tag ID Frequency Comments 1 bl 201 G 150, 6519 2 bl 204 150,710 3 bl 211 149,922 4 bl 213 148,331 5 bl 220 152,060 6 bl 221 148,786 7 bl 226 149,586 8 bl 234 G 150, 6716 9 bl 236 G 151,029 10 bl 240 152,990 11 bl 243 G 150,992 12 bl 244 152,695 13 bl 245 148,532 14 bl 246 148,641 15 bl 250 G 148,160 16 bl 251 150,754 17 bl 256 152,802 18 bl 258 152,240 19 bl 260 G 152,889 20 bl 261 152,071 21 bl 262 148,312 22 bl 263 151,071 23 bl 264 149,545 24 bl265 150,850 25 bl267 150,430 26 bl268 150,680 27 bl269 G 152,859 28 bl272 150,329 29 bl284 150,539 30 bl285 150,439

2010 SUMMER RESEARCH REPORT
19 | P a g e
31 bl287 150,649 32 bl288 150,620 33 bl290 150,640 34 bl292 150,690 35 bl295 150,729 36 bl 622 152,790 37 gr 131 152,706 m
issing since 2008 38 gr 133 148,970 39 gr 177 148,501 m
issing since 2008
40 gr 183 152,750 41 yl 1 152,464 42 yl 2 148,980 43 yl 42 148,796 pr
obably dead collar
44 yl 55 152,125 45 yl 62 149,206 46 yl 88
obably dead collar150,609 pr
47 or 1 150,500 48 or 2 150,629 49 or 3 150,470 50 or 5 150,669 51 or 6 150,320 52 or 7 150,560 53 or 8 150,699 54 or 9 G 150,800 55 or 10 150,868 56 or 11 150,929 57 or 12 150,549 58 or 13 150,839 59 or 14 150,789 60 or 15 150,858