Long-term Estimates of U.S. Productivity and Growth by Dale W. Jorgenson, Mun S. Ho, and Jon D....
40
Long-term Estimates of U.S. Productivity and Growth by Dale W. Jorgenson, Mun S. Ho, and Jon D. Samuels ** Harvard University, and ** BEA The views expressed in this paper are solely those of the authors and are not necessarily those of the Bureau of Economic Analysis of the U.S. Department of Commerce. World KLEMS Conference 2014 Tokyo, Japan May 19-20, 2014
-
Upload
kameron-orcutt -
Category
Documents
-
view
214 -
download
0
Transcript of Long-term Estimates of U.S. Productivity and Growth by Dale W. Jorgenson, Mun S. Ho, and Jon D....

Long-term Estimates of U.S. Productivity and Growth
by
Dale W. Jorgenson, Mun S. Ho, and Jon D. Samuels**
Harvard University, and ** BEA
The views expressed in this paper are solely those of the authors and are not necessarily those of the Bureau of Economic Analysis of the U.S. Department of Commerce .
World KLEMS Conference 2014
Tokyo, JapanMay 19-20, 2014


Agenda
- 63-year Economic History,1947-2010
The Sources of Growth- Divide into 3 sub-periods:
- 1947-73 Post-war Recovery- 1973-95 The Long Slump- 1995-2010 Information Age and Recession
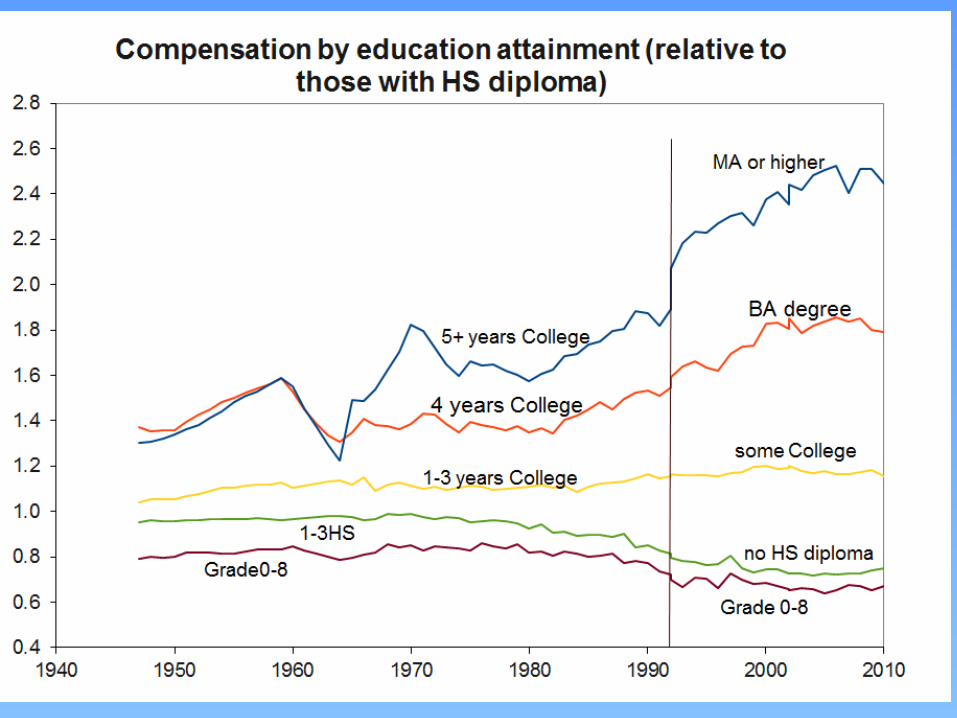
- Transformation of capital input; IT capital and TFP- Educational attainment of workers; evolution of wage
premium- Effect of 2007 Financial Crisis

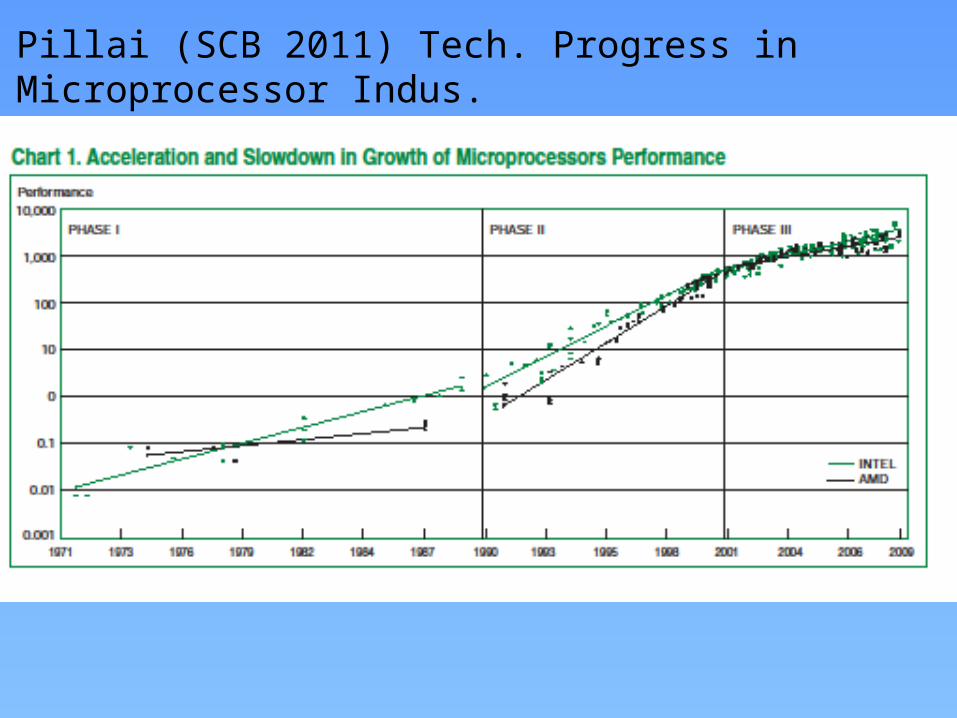
Pillai (SCB 2011) Tech. Progress in Microprocessor Indus.


THE ROLE OF INNOVATION
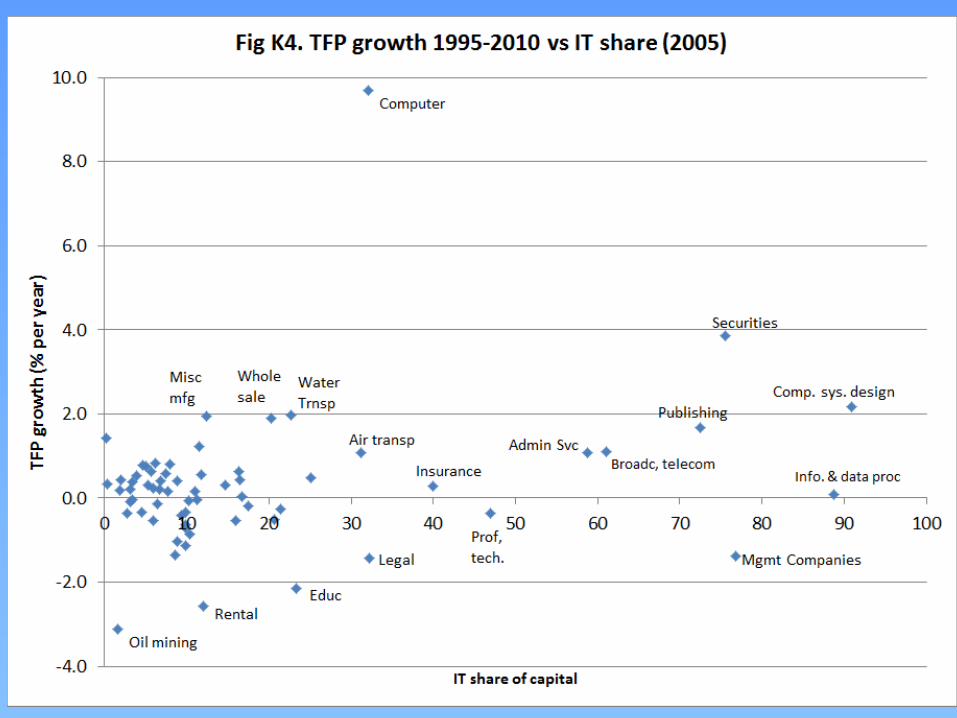
Total Factor Productivity IT-Producing, IT-Using and Non-IT Industries
Reallocation of Factor InputsCapital Input and Labor Input
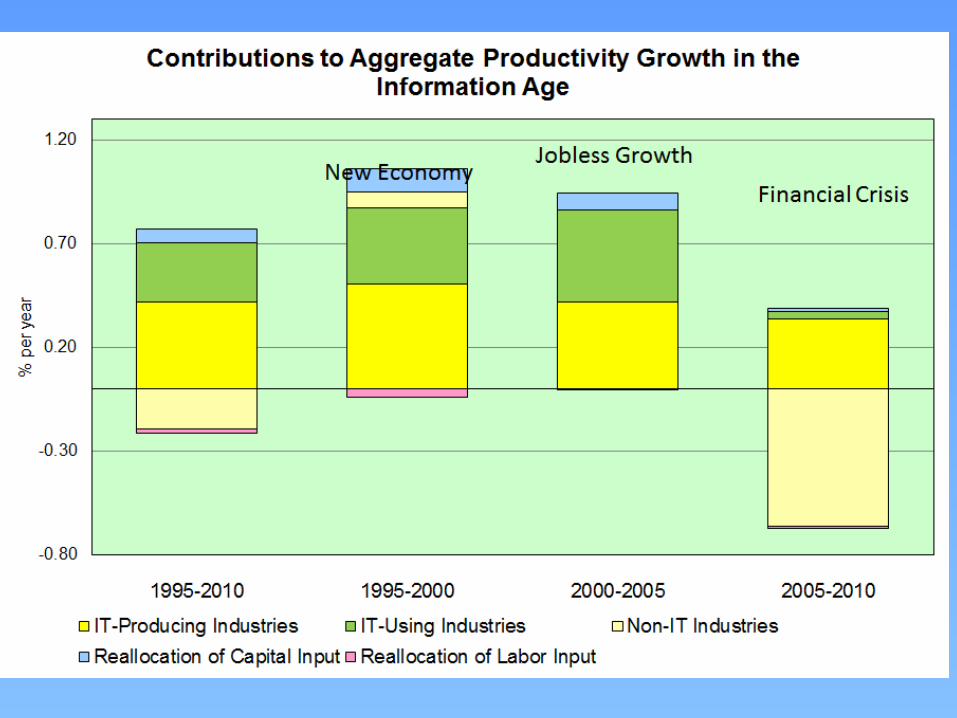
Aggregate Productivity GrowthIndustry Productivity and Factor Reallocations


Contributions of Individual Industries to Productivity
Growth, 1947-2010

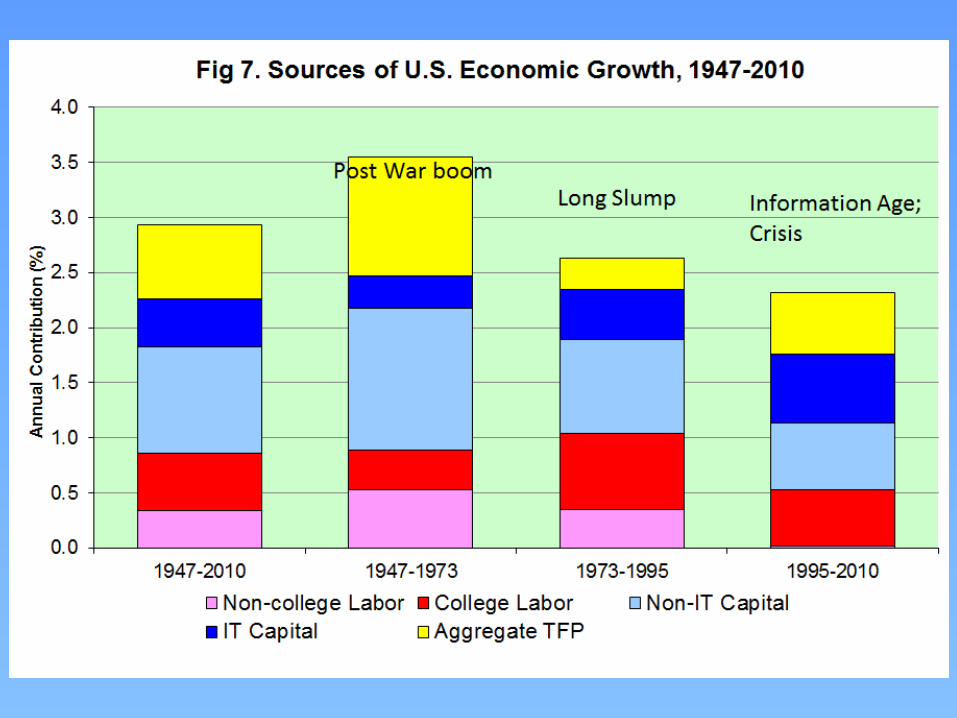
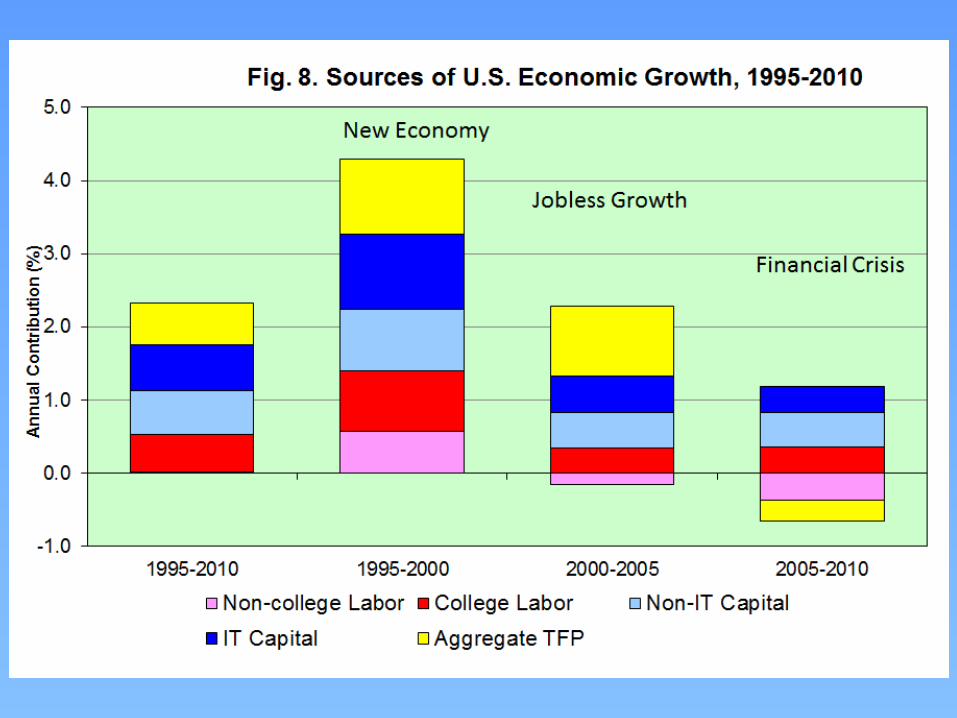
SOURCES OF U.S. ECONOMIC GROWTH
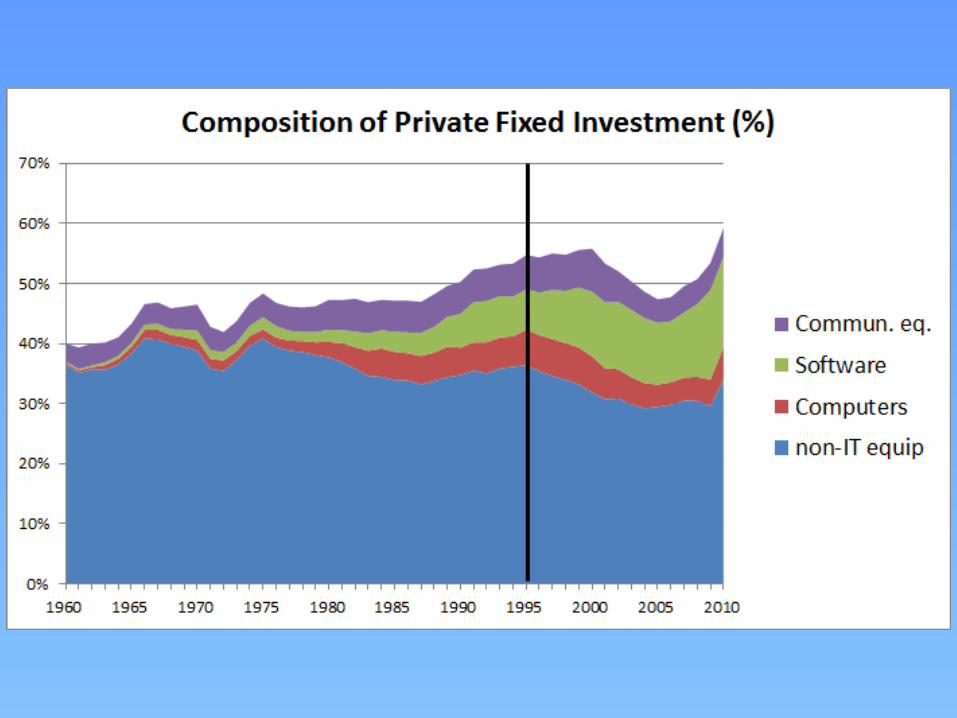
Contribution of Capital Input IT and Non-IT Capital
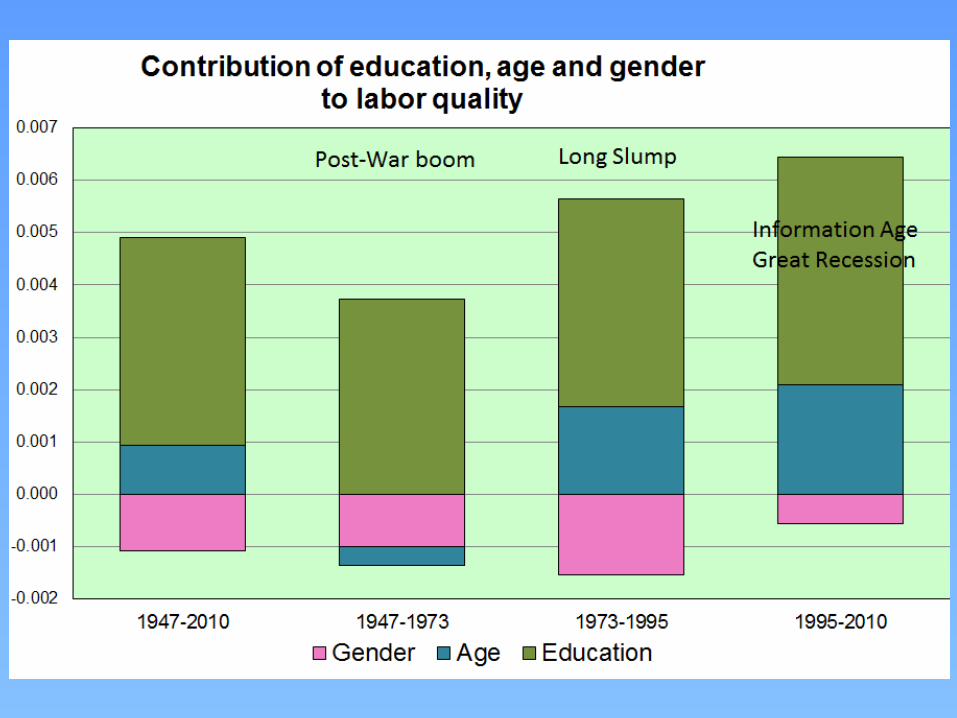
Contribution of Labor Input
College educated and Non-college
Contribution of ProductivityReplication vs. Innovation
, ,
ln ln ln
ln ln
IT nont KIT t non t
college noncolL Col t L nC t Tt
V v K v K
v L v L v

The Evolution of Labor Input. More Information Technology and
more Educated workers


- Historically, input growth in the major source of growth, in the New Economy TFP contribution has jumped.
- Unusual high TFP growth during the Jobless Recovery period of low investment and growth
- Effect of Financial Crisis.* IT-Production productivity relatively unchanged.* Big fall in productivity of non-IT group leading to negative aggregate TFP.
SUMMARY

Extra slides

Highlighting the role of Information Technology
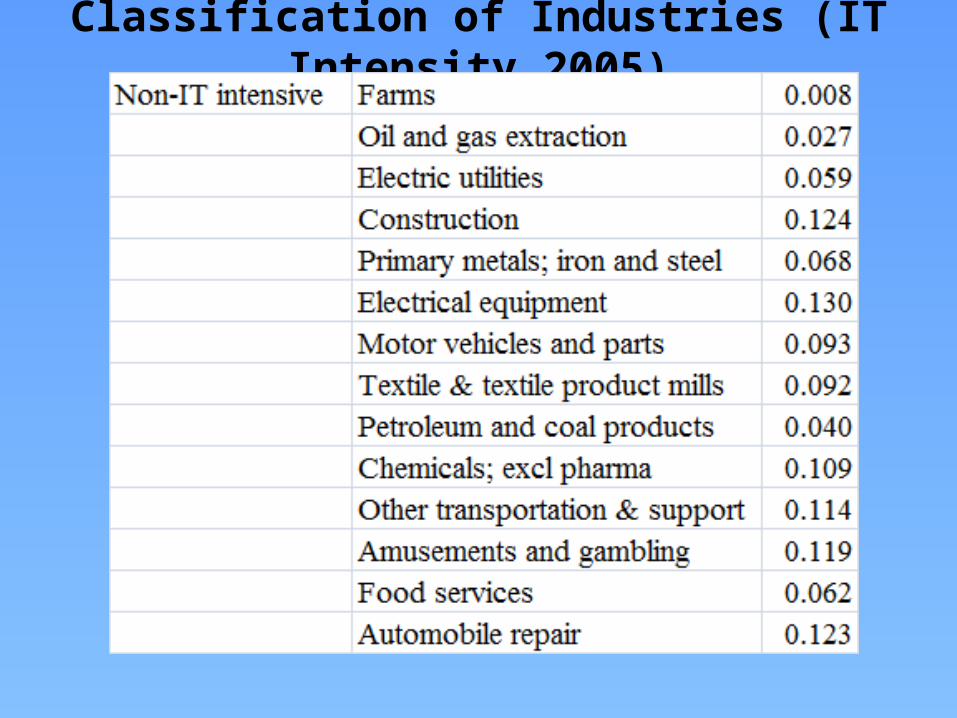
Divide industries into 3 groups:1) IT producing2) IT-intensive using3) non-IT intensive using
, ,
, ,
ITjT IT j T
jjT IT j T
K AIII
K A
IT-intensity index is the ratio of IT capital input plus IT intermediates to total capital input plus IT intermediates:

Classification of Industries (IT Intensity 2005)

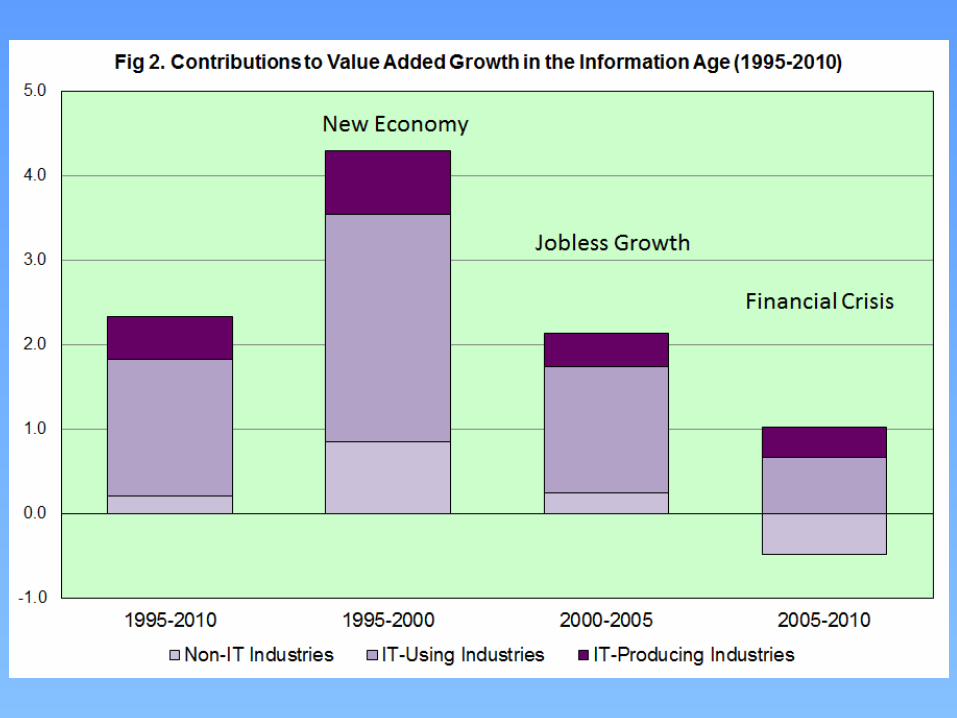
Growth of Value Added and Productivity
ln ln ln lnt jt jt jt jt jt jtj ITprod j ITusing j nonIT
V w V w V w V
Following graphs show contribution by the 3 industry groups to the growth of aggregate value added (GDP from PPF):

Classification of Industries (IT Intensity 2005)
Classification of Industries (IT Intensity 2005)


Industry Contributions to Value Added Growth; 1947-
2010
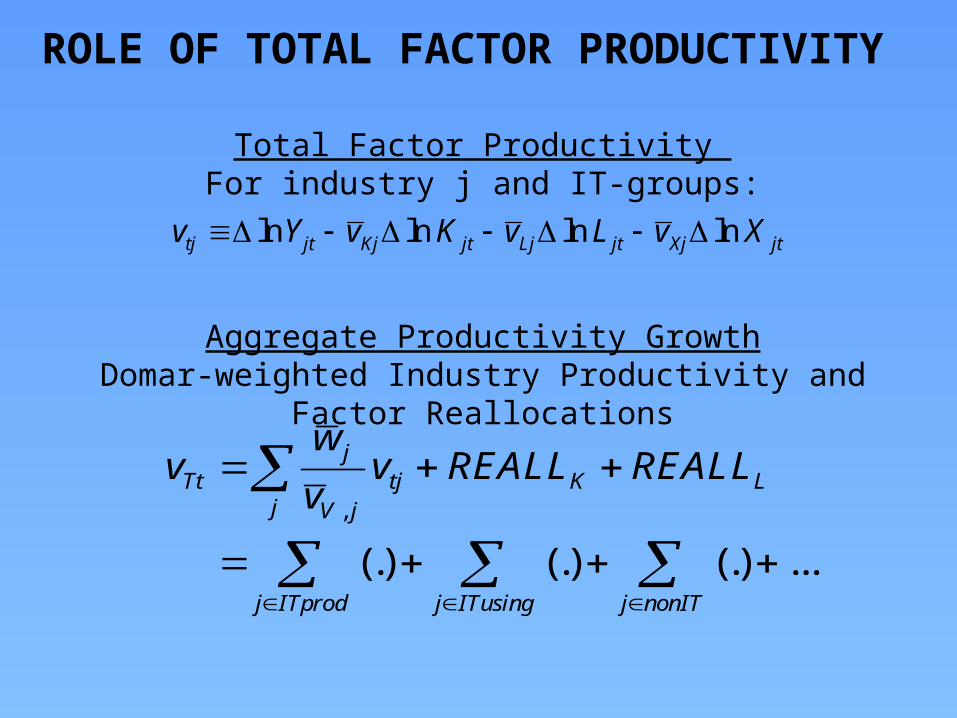
Total Factor Productivity For industry j and IT-groups:
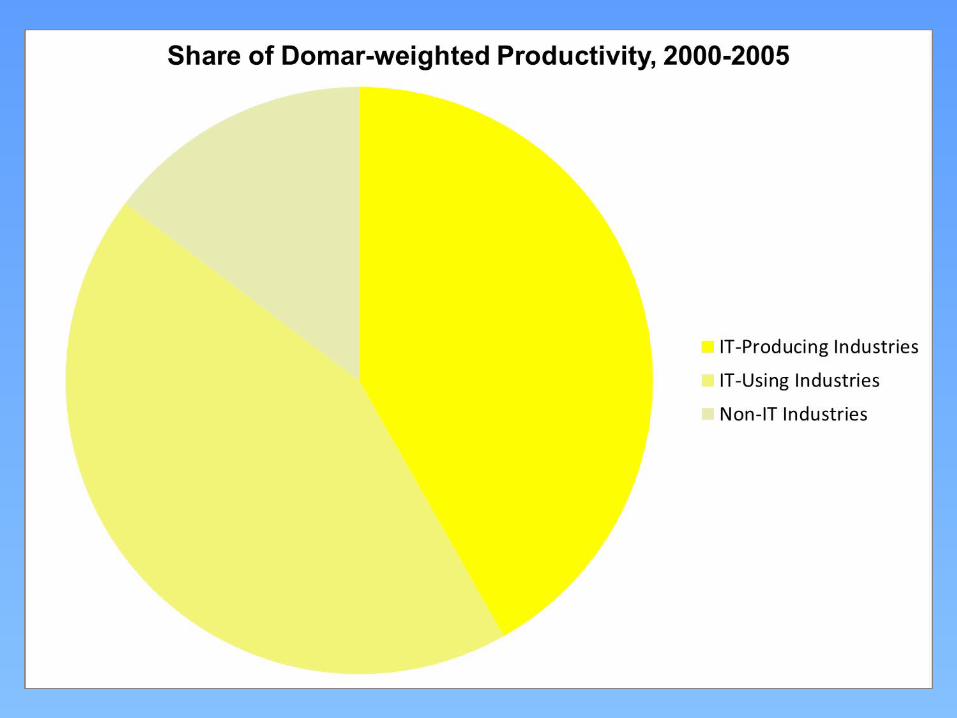
Aggregate Productivity GrowthDomar-weighted Industry Productivity and Factor
Reallocations
ln ln ln lntj jt Kj jt Lj jt Xj jtv Y v K v L v X
ROLE OF TOTAL FACTOR PRODUCTIVITY
,
(.) (.) (.) ...
jTt tj K L
j V j
j ITprod j ITusing j nonIT
wv v REALL REALL
v

Industry Contributions to Aggregate TFP
Growth, 1947-2010


PROJECTING PRODUCTIVITY AND ECONOMIC GROWTH
Contribution of Industry Groups to Productivity Growth
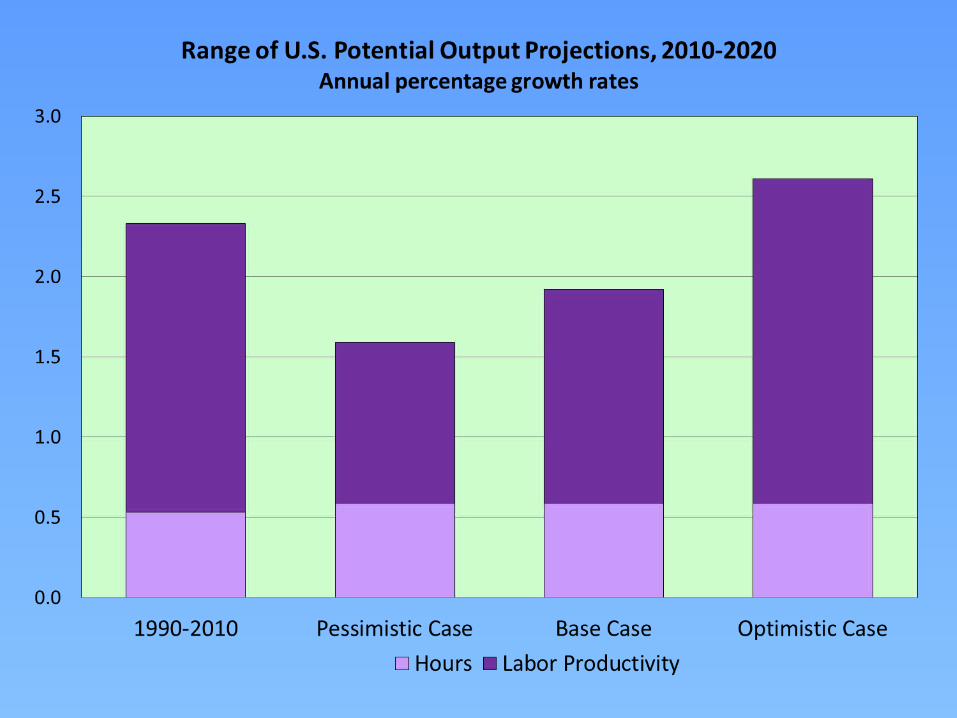
Range of Labor ProductivityGrowth Projections
Range of Potential Output Projections