
Long-term development of Holocene and Pleistocene gullies ... fileLong-term development of Holocene...
21
Long-term development of Holocene and Pleistocene gullies in the Protva River basin, Central Russia Andrey V. Panin ⁎, Julia N. Fuzeina, Vladimir R. Belyaev Faculty of Geography, Moscow State Lomonosov University, Vorobiovy Gory, Moscow,119992, Russia abstract article info Article history: Received 9 August 2006 Received in revised form 31 May 2008 Accepted 4 June 2008 Available online 6 February 2009 Keywords: Central Russia Gully erosion Holocene Human impact Palaeoclimate The specific geomorphic structure (a combination of flat or gentle watersheds with short steep valley sides) and the high resistance of surface material in the case study area in the centre of the Russian Plain are responsible for the specific pattern of Holocene erosion: no or minor sheet erosion, the occasional appearance of new gullies on the valley sides (four out of 19 studied), and a concentration of erosion activity in old gullies that had existed since pre-Holocene times (15 out of 19 studied). The erosion activity is studied using radiocarbon dating of gully sediments. Summed probability density distribution (SPDD) of 65 radiocarbon dates is applied to detect changes of erosion rates over the last five millennia. Three millennium- scale phases of erosion activity are distinguished: Phase 1 — 1200 years BP to the present (intensive erosion), Phase 2 — 2800 to 1200 years BP (weak erosion), and Phase 3 — N 4800 to 2800 years BP (intensive erosion). Short episodes, or single events of relatively strong erosion, have been found at around 4700, 3800, 3000, 2200, 1800, and 900 years BP. Erosion during Phase 3 coincided with the Holocene lowest population density in the whole region, and the start of Phase 1 coincided with a population gap at the case study area, which suggests other than anthropogenic causes for changing erosion regimes. These may be climatic factors because changes between millennium-scale phases of erosion activity coincide with pronounced climatic changes: the Subboreal–Subatlantic transition, and the start of the Medieval Warm period. However, a direct correlation between erosion activity and climatic parameters (warmer/cooler, wetter/drier) has not been found, presumably because the available palaeoclimatic reconstructions do not contain enough information on changing frequencies and magnitudes of hydrological extremes. According to population dynamics, charcoal frequency in erosion-derived sediments and pollen data, a human impact on erosion is suggested to have occurred from the 11th century AD, and more confidently from the 14th–16th centuries. This contributed to erosion acceleration that began some two centuries earlier, apparently for climatic reasons. © 2009 Elsevier B.V. All rights reserved. 1. Introduction A large number of studies have been carried out in Europe during recent decades concerning soil and gully erosion with a historical perspective. Establishing a chronology of erosion events and identify- ing causal factors of erosion rate fluctuations in the past provides a basis for a better understanding of both palaeoenvironmental dynamics and the present-day state of geomorphic systems under the influence of multiple natural and anthropogenic factors. Increased erosion in the past is indicated by various types of morphological evidence such as buried rills and gullies (Bork, 1989; Bork et al., 1998; Dotterweich, 2003, 2005; Vanwalleghem et al., 2005a, 2006; Schmitt et al., 2006; etc.), and sedimentological features such as truncation of soil profiles and increased colluvial, alluvial and lacustrine sedimentation (Bork, 1989; Ballantyne, 1991; Kalicki, 1996; Bork et al., 1998; Edwards and Whittington, 2001; Klimek, 2002, 2003; Zolitschka et al., 2003; Zygmunt, 2004; Starkel, 2005; Klimek et al., 2006; Chiverrell et al., 2007; Smolska, 2007). Established chronologies of both forms and sediments allow comparisons of erosion dynamics with climatic and land-use histories to infer possible reasons of erosion acceleration. It is always difficult to separate climatic and human influence over environmental change. In the case of erosion, anthropogenic drivers are inferred from indirect markers of human presence in the landscape such as the decline of tree species in pollen spectra, the rise in charcoal values and the presence of cereal-type pollen as a marker of agricultural activity (Kwaad and Mücher, 1979; Dodson, 1990; Macklin et al., 2000; Schmitt et al., 2003; etc.). Forest clearance and the onset of agriculture are traditionally regarded as critical points of landscape development that mark an abrupt increase of landscape susceptibility to erosion. The role of human impact on erosion is demonstrated by comparisons of erosion/sedimentation rates under and without human pressure over landscape. Lakes in northern and northwestern Scotland dis- playing stable or decreasing sedimentation over time have either no Geomorphology 108 (2009) 71–91 ⁎ Corresponding author. Tel.: +7 495 939 5469; fax: +7 495 932 8836. E-mail address: [email protected] (A.V. Panin). 0169-555X/$ – see front matter © 2009 Elsevier B.V. All rights reserved. doi:10.1016/j.geomorph.2008.06.017 Contents lists available at ScienceDirect Geomorphology journal homepage: www.elsevier.com/locate/geomorph
-
Upload
truongtram -
Category
Documents
-
view
215 -
download
0
Transcript of Long-term development of Holocene and Pleistocene gullies ... fileLong-term development of Holocene...

Geomorphology 108 (2009) 71–91
Contents lists available at ScienceDirect
Geomorphology
j ourna l homepage: www.e lsev ie r.com/ locate /geomorph
Long-term development of Holocene and Pleistocene gullies in the Protva River basin,Central Russia
Andrey V. Panin ⁎, Julia N. Fuzeina, Vladimir R. BelyaevFaculty of Geography, Moscow State Lomonosov University, Vorobiovy Gory, Moscow, 119992, Russia
⁎ Corresponding author. Tel.: +7 495 939 5469; fax:E-mail address: [email protected] (A.V. P
0169-555X/$ – see front matter © 2009 Elsevier B.V. Adoi:10.1016/j.geomorph.2008.06.017
a b s t r a c t
a r t i c l e i n f oArticle history:Received 9 August 2006Received in revised form 31 May 2008Accepted 4 June 2008Available online 6 February 2009
Keywords:Central RussiaGully erosionHoloceneHuman impactPalaeoclimate
The specific geomorphic structure (a combination of flat or gentle watersheds with short steep valley sides)and the high resistance of surface material in the case study area in the centre of the Russian Plain areresponsible for the specific pattern of Holocene erosion: no or minor sheet erosion, the occasionalappearance of new gullies on the valley sides (four out of 19 studied), and a concentration of erosion activityin old gullies that had existed since pre-Holocene times (15 out of 19 studied). The erosion activity is studiedusing radiocarbon dating of gully sediments. Summed probability density distribution (SPDD) of 65radiocarbon dates is applied to detect changes of erosion rates over the last five millennia. Three millennium-scale phases of erosion activity are distinguished: Phase 1 — 1200 years BP to the present (intensive erosion),Phase 2 — 2800 to 1200 years BP (weak erosion), and Phase 3 — N4800 to 2800 years BP (intensive erosion).Short episodes, or single events of relatively strong erosion, have been found at around 4700, 3800, 3000,2200, 1800, and 900 years BP. Erosion during Phase 3 coincided with the Holocene lowest population densityin the whole region, and the start of Phase 1 coincided with a population gap at the case study area, whichsuggests other than anthropogenic causes for changing erosion regimes. These may be climatic factorsbecause changes between millennium-scale phases of erosion activity coincide with pronounced climaticchanges: the Subboreal–Subatlantic transition, and the start of the Medieval Warm period. However, a directcorrelation between erosion activity and climatic parameters (warmer/cooler, wetter/drier) has not beenfound, presumably because the available palaeoclimatic reconstructions do not contain enough informationon changing frequencies and magnitudes of hydrological extremes. According to population dynamics,charcoal frequency in erosion-derived sediments and pollen data, a human impact on erosion is suggestedto have occurred from the 11th century AD, and more confidently from the 14th–16th centuries. Thiscontributed to erosion acceleration that began some two centuries earlier, apparently for climatic reasons.
© 2009 Elsevier B.V. All rights reserved.
1. Introduction
A large number of studies have been carried out in Europe duringrecent decades concerning soil and gully erosion with a historicalperspective. Establishing a chronology of erosion events and identify-ing causal factors of erosion rate fluctuations in the past providesa basis for a better understanding of both palaeoenvironmentaldynamics and the present-day state of geomorphic systems under theinfluence of multiple natural and anthropogenic factors.
Increased erosion in the past is indicated by various types ofmorphological evidence such as buried rills and gullies (Bork, 1989;Bork et al., 1998; Dotterweich, 2003, 2005; Vanwalleghem et al.,2005a, 2006; Schmitt et al., 2006; etc.), and sedimentological featuressuch as truncation of soil profiles and increased colluvial, alluvial andlacustrine sedimentation (Bork, 1989; Ballantyne, 1991; Kalicki, 1996;
+7 495 932 8836.anin).
ll rights reserved.
Bork et al., 1998; Edwards andWhittington, 2001; Klimek, 2002, 2003;Zolitschka et al., 2003; Zygmunt, 2004; Starkel, 2005; Klimek et al.,2006; Chiverrell et al., 2007; Smolska, 2007).
Established chronologies of both forms and sediments allowcomparisons of erosion dynamics with climatic and land-use historiesto infer possible reasons of erosion acceleration. It is always difficult toseparate climatic and human influence over environmental change.In the case of erosion, anthropogenic drivers are inferred from indirectmarkers of human presence in the landscape such as the decline oftree species in pollen spectra, the rise in charcoal values and thepresence of cereal-type pollen as a marker of agricultural activity(Kwaad and Mücher, 1979; Dodson, 1990; Macklin et al., 2000;Schmitt et al., 2003; etc.). Forest clearance and the onset of agricultureare traditionally regarded as critical points of landscape developmentthat mark an abrupt increase of landscape susceptibility to erosion.The role of human impact on erosion is demonstrated by comparisonsof erosion/sedimentation rates under and without human pressureover landscape. Lakes in northern and northwestern Scotland dis-playing stable or decreasing sedimentation over time have either no
72 A.V. Panin et al. / Geomorphology 108 (2009) 71–91
clear signs of human impact or only so towards the latter part ofthe Holocene, while most lakes in Britain and Ireland show increasedsedimentation through the Holocene together with indications ofanthropogenic impact (Edwards andWhittington, 2001). On the otherhand, there are cases which show that the onset of agriculture is notnecessarily reflected in increasing erosion. Thus, in Atlantic ScotlandtheMesolithic–Neolithic transition occurred at c. 5000 BP, but up untilc. 1000 BP agricultural communities appear to have had comparativelylittle impact on the environment (Macklin et al., 2000).
A coincidence of increased erosion/sedimentation with signsof human presence in the landscape is usually regarded as a proof ofanthropogenic causes of increased erosion. A lot of research carriedout in the last decades supports the conclusion that in the loessregions of Europe the intensity of land-use is to be considered themain trigger for soil and gully erosion in historical times (Bork andLang, 2003; Valentin et al., 2005). Both phases of gullying and periodsof old gully infilling are often found to have coincided with increasinghuman activity in the catchments, such as settlement, cultivation,timbering, road construction (Bork et al., 1998; Schmitt et al., 2006).In northern Bavaria, two main periods of gully erosion were found:during the 14th and in the late 18th and early 19th centuries AD(Schmitt et al., 2003). In both periods, erosion increased as a responseto land-use changes, such as the development of vineyards, hopgardens and intensive forest use, with heavy rainfall events playing atriggering role. Observations and datings of buried gullies demon-strate high process rates and a rapid response of erosion systems tohuman disturbance (Dotterweich, 2003; Vanwalleghem et al., 2005a;etc.). Larger erosion systems such as lake catchments are character-ized by a delay in response: in British and Irish lakes, indications ofanthropogenic impact are often prior to levels of increased sedimen-tation (Edwards and Whittington, 2001). Fluvial systems in CentralEurope show a similar delay: Igl et al. (2000) have suggested that inmany areas of Central Europe a time lag of several hundreds tothousands of years exists between the onset of human settlement andchanges in the alluvial sedimentary record. This delay is believed tobe related to the density of settlements in the catchments as well as todelayed sediment transfer processes that depend on topography.
In order to quantify the human impact, information on populationdensities and open land/woodland ratios based on archaeologicaldata can be used (Houben et al., 2006). A correlation of erosion andpopulation density is found, for example, in North-West Englandwhere little or no hillslope erosion occurred in the early Holocene, butseveral phases of extensive gully formation in the late Holocene, after2500–2200, 1300–1000, 1000–800 and 500 cal. BP, have been iden-tified as coinciding with established periods of population expansion(Chiverrell et al., 2007). All these phases are interpreted as a con-sequence of growing landscape susceptibility to erosion in response toincreased anthropogenic pressure.
Although most research has found a dominant human role inerosion increase during the Holocene, there are also examples of therole of climate in erosion/sedimentation dynamics. In the south-western Mediterranean, a clear correlation has been found betweenthe chronology of archaeological sites and river overbank sedimenta-tion, while floodplain sedimentation rates indicate a strong climaticsignal from 4.8 ka BP until today which is a clear correlation with theNorth Atlantic Oscillation (Zielhofer et al., 2008). It was concludedthat landscape dynamics greatly influenced prehistoric societies. Inthe Ebro Basin, northern Spain, valley-floor gully systems switchedbetween incisional and aggradational regimes through the Holocene,with two main infill phases around 6000 cal. BP and the Iron Age(Harvey and Gutiérrez-Elorza, 2005). The regime switches are inter-preted to have been climatically induced. One more study from theEbro Basin concerns a dry valley-bottom infill previously treated asa response to increasing human impact but now found to indicate aclimatically induced highly active phase of incision and subsequentaggradation that occurred during the Alleröd Period of the Late Glacial
(Andres et al., 2002). The authors conclude that highly dynamicprocesses of erosion/sedimentation can occur without human impact.Climatic changes have been shown to govern badland developmentin the semiarid southeast of Spain: during relatively humid periods,the vegetation cover on first-order valley bottoms traps sedimentfluxes from steep slopes while an increase in the duration or severityof drought periods causes a decrease of vegetation-carpeting and gullyincision in flat valley bottoms (Nogueras et al., 2000).
Little is known about Holocene erosion chronology and its drivingfactors in Eastern Europe. In the forest-steppe and forest zones ofthe East European Plain, seven erosion-sedimentation rhythms werefound for the Holocene, each of them including a phase of catchmenterosion/sediment deposition on foot slopes, old gully bottoms andriver floodplains, and a phase of landscape stabilization and soilformation (Sycheva, 2006). These rhythms are thought to correspondwell with Holocene climatic cycles. That research was based on a largenumber of dated palaeosoil sites spread over a large area, with variousscales of human impact and climatic history. More detailed local andregional studies are still needed to establish the details of erosionchronology and its driving factors.
In this paper we establish an erosion chronology at a case studyarea in the centre of the Russian Plain. Due to local conditions, erosionis concentrated in old Pleistocene gullies, and using a large series ofradiocarbon dates we try to distinguish the periodicity of their activityas well as events of new gully formation. Phases of high and lowerosion activity will be discussed in relation to climatic and humaninfluence on erosion.
2. Case study area description
2.1. Location and natural conditions
The case study area is located in the central part of the RussianPlain, about 100 km south-southwest of Moscow, in the north ofthe Kaluga Region, within the Borovsk District at 55°12′N and 36°22′E(Fig.1). It is an area of 15 km2 in themiddle reaches of the Protva Riverat the Satino Experimental Station of Moscow State University.The station and surrounding area look back on a 30-year history ofcomplex environmental research including detailed geological survey(a extensive program with N200 exposure sections, pits and coresfrom depths of up to 90 m), detailed geomorphic mapping, andmonitoring of soil and gully erosion rates at specially equipped, smallexperimental catchments (Antonov et al., 2001).
At the Satino village the area of the Protva River basin is 1450 km2,the mean annual discharge 9.92 m3/s, the mean maximum dischargeof snowmelt flood 150 m3/s, and the mean maximum dischargeof rainfall floods in summer to autumn 36.8 m3/s (Akimenko andYevstigneev, 2002). The climate is continental with severe winters,warm summers and no dry season: mean temperatures are +18 °C inJuly and −10 °C in January, and annual precipitation is c. 600 mm onaverage. The seasonal distributions of precipitation and surface runoffare non-synchronous. Two-thirds of the precipitation falls duringthe warm half of the year, but only 25% of surface runoff happensin summer and autumn. The long cold period promotes a significantaccumulation of snow which produces as much as 65% of the annualsurface runoff during spring snowmelt (end of March to April). Winterrunoff makes up only 10% of the annual runoff. The natural vegetationis mixed forest on ortho-podzolic soils (albeluvisols).
Runoff intensities during extreme rainstorms can considerablyexceed those observed during snowmelt periods. In rivers, the sum-mer flood discharges are several times lower than those of the springfloods. However, in gullies and small valleys with perennial streams,summer rainstorms can generate extremely high runoff. According toobservations at the experimental station, extreme rainstorms duringthe warm season make the biggest contribution to soil erosion onarable fields of the Satino Experimental Station, though some erosion

Fig. 1. Location map and physiography of the study area. Isolines drawn at 1 m increment. Gully numbers correspond to Table 2. Circled numbers — Holocene gullies.
73A.V.Panin
etal./
Geom
orphology108
(2009)71
–91

74 A.V. Panin et al. / Geomorphology 108 (2009) 71–91
is also produced during the snowmelt period. Maximum annualvalues obtained during a 20-year observation cycle are 26 t/hafor rainfall erosion and 8 t/ha for snowmelt erosion (Litvin, 2002;Golosov, 2006). On the other hand, observations over more than20 years on gully headcut advance prove an essential role of thesnowmelt period in annual gully growth (Bolysov and Tarzaeva,1996).
2.2. Geomorphic landscape of the study area and its sensitivity to erosion
Local topography was formed during the Late Cenozoic and mostlyduring the Quaternary. Major features of Quaternary history are seenclearly in the geological sections shown in Fig. 2. The pre-Quaternarybedrock consists of Carboniferous marine sedimentary rocks, mainlylimestones and dolomites with layers of clays and marls. Theywere deeply dissected during the Early Pleistocene when local relief
Fig. 2. Geological sections along theRiver Protvawatersheds. See Fig.1 for location. Stratigraphic iLate Pleistocene, Q4 — Holocene. Genetic indices: g— glacial, gf— glacio-fluvial, lg— limno-glacibiogenic (peat).
exceeded 100 m. This erosional landscape was modified greatly byglacial processes but it is still visible in the present-day topographythe highest positions of which inherit those of the bedrock landscape,i.e. the Early Pleistocene watersheds (Simonov et al., 1996). In theMiddle Pleistocene several layers of glacial tills and glacio-fluvialsands and silts covered the bedrock. The thickest and most per-sistent moraine sheets were left by the Dnieper (OIS 8) and theMoscow (OIS 6) glaciation. By the end of the Middle Pleistocene localtopography range was less than 30 m, but it rapidly increased fol-lowing deglaciation due to incision by the Protva River and itstributaries (Bredikhin and Panin, 1995). During the Late Pleistocenethe area was not glaciated. Several incision–aggradation cycles of thefluvial network have resulted in the present range of relief of up to70 m. A 2–3 m thick cover of the so-called sheet loams that formedduring the Late Pleistocene cold periods overlies glacial and glacio-
ndices: Q2dn, Q2
ms—Dnieper andMoscowEpochs of theMiddle Pleistocene (OIS 8 and6), Q3—
al, l— limnic, a— alluvial, d— deluvial, sl— sheet loams, ch— chemogenic (travertine), b—

Table 1Minimal catchment area (in ha) needed for a gully initiation under local conditions ofthe Satino Experimental Station (after Belyaev, 2002).
Slope angle Lithology
Sand Sheet loams Boulder loam
Grassed slope2° 1.40 580 –
5° 0.12 58.0 –
10° 0.04 18.4 –
15° 0.02 8.52 –
Bare slope (arable land)2° 0.21 7.30 84.75° 0.02 0.72 8.5010° 0.01 0.23 2.6815° b0.01 0.11 1.24
75A.V. Panin et al. / Geomorphology 108 (2009) 71–91
fluvial deposits on most of the interfluves and gentle slopes. It is aloess-like deposit, but with lower porosity and a higher clay content.It is, therefore, more resistant to erosion than typical loess, but lessresistant than moraine. At some places the loam cover is absent andthe underlying glacial sediment is exposed.
On the basis of genetic morphology, the modern landscapes of thestudy area can be classified into two types: glacial/glaciofluvial land-scapes that occupy watersheds and cover 61% of the study area, andfluvial landscapes that cover 39% of the area. The morphologicaldifferences critical for erosion development are illustrated by thedistribution of different slope categories (Fig. 3). Most elements ofglacial/glaciofluvial morphology such as moraine hill tops, glacio-fluvial hollows and sandurs constitute sub-horizontal surfaces withangles less than 2°. More than 95% of watershed areas have angles b5°,with gradients increasing in the vicinity of river valleys.
Fluvial landscapes are more varied. Terraces and floodplains aremostly b2° steep. Valley sides are the steepest morphological ele-ments over the territory: they are mainly 5–15° but at some reachesup to 35° steep. Valley sides cut through Quaternary deposits by 20–25 m and may be composed of layers with different erosional re-sistance, either low (sands, silts) or very high (boulder clays) (Figs. 1and 2). The exposed sands are most important for gully developmentdue to their low erosional resistance. In the east of the area the ProtvaRiver cuts a high point of the Carboniferous bedrock surface, so thevalley sides are composed of limestones and dolomites intercalatedwith clays (Figs. 1 and 2).
From combining surface lithology and slope morphometry acritical factor controlling gully initiation and development can bederived which allows determining the profound difference in sus-ceptibility to erosion between the two types of geomorphic land-scapes considered. The role of slope value is evident from the estimateof the minimal catchment area needed for gully initiation (Table 1).The steeper the slope is, the smaller the critical catchment area is.Under natural conditions (grass-covered earth), the initiation of a gullyon the watersheds (angles b5°) requires a catchment area of tens orhundreds of hectares (Table 1— column for sheet loams). Such gulliesexist in the south-east of the study area (gullies 13–16 on Fig.1). Arablefields are located on watershed areas with angles b5° covered bysheet loams. The critical catchment area decreases considerably withincreasing slope angle (Table 1), but in the current combination oftopographyandfield contours (Fig.1) no sites favouring gully initiationare found. This is supported by the fact that during the period ofobservation (i.e. over last 40 years) no new gullies have been formed.In accordancewith the poor conditions for linear erosion, rates of sheeterosion on arable fields are very low: according to observations at anumber of experimental sites, they vary from 1–2 to 5–8 t/ha per yearon average (Golosov, 1996, 2006).
Fig. 3. Slope angle distribution for areas of glacial/glacio-fluvial and fluvial origin. Slopegradient classes according to Rychagov, 2006.
Valley sides are the steepest topographical elements, and they aretherefore most susceptible for gully development. As valleys cutthrough different lithological units (Fig. 2), the composition of valleysides may change from place to place and along the same slope fromresistant dolostones and limestones to highly erodible sands and silts.Steep slopes composed of sand require only several hundred squaremetres to initiate a gully even under natural conditions. The valleysides are dissected by a number of gullies 100–800m long and 5–15mdeep. Their headcuts extend into interfluvial areas, while their fans lieover floodplains or protrude directly into the river channel. All gulliesare found on the earliest maps made in the late 18th century AD(Antonov et al., 2005). Direct observation since the late 1970s showsthat most gullies are active at present in terms of both bottom erosionand headcut advance (Bolysov and Tarzaeva, 1996).
2.3. Lithological types of gullies
Gullies cut through various types of rocks and Quaternary deposits.The resistance of underlying bedrock has been found to influence gullymorphology and long-term development to a great extent (Belyaev,2002). In order to take account of this factor, we determined thelithological units that prevail in the respective vertical section cutby each gully and on this basis divided all gullies into three groups(Table 2):
(i) Bedrock gullies (no. 14–17 in Table 2 and in Fig. 1) are cutmostly into pre-Quaternary rocks, predominantly Carbonifer-ous limestones and dolostones with variable proportions ofinterbedded clays and marls (Fig. 4a). Only the upper parts ofthese gullies are formed in the relatively less resistantQuaternary deposits. Longitudinal profiles of such gullies areungraded and demonstrate close dependence on lithology,with steep steps controlled by solid rock outcrops alternatingwith more gentle sections formed in less resistant materials.
(ii) Till gullies (no.1, 4–6 and 10–13 in Table 2 and in Fig. 1) cutmostly through tills, predominantly of Dnieper age (OIS-8),with less involvement of glacio-fluvial sands (Fig. 4b). Gullylongitudinal profiles are rather smooth, but their convex formpoints to an ungraded state which can be explained by therelatively high resistance of the till deposits.
(iii) Sand gullies (no. 2–3 and 7–9 in Table 1) are cut mainly intointer-glacial sands and silts with only limited involvement ofboulder clays (Fig. 4c). Gully longitudinal profiles are char-acterized by a semi-graded concave form, though local convexfragments may exist at the reaches where till is cut.
The spatial distribution of different gully types is controlled bylocal geological conditions resulting from Quaternary geomorphichistory. Bedrock gullies are found in the southeastern part of the areawhere the pre-Quaternary bedrock has a relatively thin cover of only5–15 m of Quaternary deposits (Figs. 1 and 2). The bedrock upper

Table 2Characteristics of gullies in the Satino case study area.
Gully name Agea Litho-typeb F, 103m2 L, m Dmax, m. Volume, 103m3 VF/VG % River actionc
VG VF
1 Uzkiy H T 72 230 9 36 b0.1 b1 02 Durnoy P S 300 450 11 53 11 21 N103 Volchiy H S 17 220 10 17 8.2 48 N104 Kamenniy P T 398 425 8 35 5.4 15 N105 Chugunkin P T 279 540 10 76 21 28 N106 Senokosnaya P T 328 460 10 48 6.6 14 N77 Buiniy H S 23 100 9 3.5 0.15 4.3 N58 Nabatov H S 43 200 3 1.9 0.20 11 N59 Lisyu Nory P S 494 540 13 91 0.6 b1 N710 Volchenkovskiy P T 414 540 12 51 b0.1 b1 011 Lukianovskiy P T 118 390 6 24 0.9 3.8 N512 Barsuchiy P T 195 425 10 29 0.9 3.0 N713 Obtsarskiy P T 627 920 8 29 b0.1 b1 014 Zapadniy Satinskiy P R 591 750 12 28 b0.1 b1 015 Vostochniy Satinskiy P R 370 940 9 41 b0.1 b1 016 Egorov P R 458 550 12 13 b0.1 b1 017 Emelin P R 119 410 6 3.0 b0.1 b1 018 Maliy Mitenkovskiy P T 97 270 6 13 b0.1 b1 N1019 Bolshoi Mitenkovskiy P T 145 340 8 34 0.4 1.2 N10
F — catchment area, L — gully length, Dmax — gully maximum depth, VG — gully volume, VF — fan volume.a Gully age: P — Pleistocene, H — Holocene.b Gully lithological type (see text): R — rock, T— till, S — sand.c Time elapsed since the last event of gully fan lateral undercut by the main river according to reconstructions of channel migration by Panin et al. (1999), Panin and Karevskaya
(2000) (103 radiocarbon years BP).
76 A.V. Panin et al. / Geomorphology 108 (2009) 71–91
surface dips towards the centre and the western part of the study areawhile the thickness of the Quaternary deposits rises up to 100 m. Tilland sand gullies are found here, with a particular spacing determinedby variations of Quaternary lithology. Most gullies are devoid ofbottom sediments, and their fans are the only record of their Holocenehistory (Fig. 4a, c). Nevertheless, in a few cases sediment storages arefound in gully bottoms (Fig. 4b).
2.4. Effect of river channel dynamics on gully development
Reconstructions of gully evolution need to take account of themain river channel migration because it can exert significant influenceon processes in valley side gullies by connecting or disconnecting theirsediment export from further transport in the channel. Lateral under-cutting of valley sides may also serve as a trigger for gully initiation.
The development of the Protva River channel has been studiedearlier by analyzing palaeochannel morphology and floodplain sedi-ment stratigraphy (Panin and Karevskaya, 2000; Vlasov, 2005). It hasbeen established that channel incision to 2–3 m below the presentposition occurred in the Late Glacial. This is attributed to higher andmore intensive, extreme surface runoff under conditions of wide-spread permafrost. High river runoff is evidenced by large palaeo-channels of the Protva River at the town of Borovsk where they aredated to 13200 14C years BP (Panin, 2000).
The very beginning of the Holocene has left no traces in the sedi-mentation record or palaeochannel development. Between 8500–6500 14C years BP the Protva River channel shifted widely acrossthe valley bottom, undercutting valley sides and gully mouths.This probably triggered incision in many gullies which were directlyconnected to the valley bottom. An extreme episode of channel plan-form transformation occurred around 5300 14C years BP when thechannel abruptly shifted approximately into its present position(Vlasov, 2005). Since 5000 14C years BP the river channel planform hasremained relatively stable until the present, except for a few localizedsections where limited bank erosion has continued. This means thatmost of the main valley sides have remained relatively stable. Con-sequently, over the second half of the Holocene most of the gulliesdeveloped fans that expand over the floodplain surface, of which onlya few were eroded by the river channel. Gradual channel aggradationoccurred between 5000 and 1000 14C years BP. Between 1200 and 800
14C years BP river incision started and progressed by about 2 m duringthe last millennium. By the present, the river has cut down to itsformer position in the middle of the Holocene. This incision couldinfluence lower parts of the gullies that are directly connected to theProtva River channel.
The available reconstructions of the Protva River channel migra-tions (Panin, 2000; Panin and Karevskaya, 2000; Vlasov, 2005) canprovide a rough evaluation of periods when each location at the valleysides and the fan (or mouth) of each gully was last affected by mainriver channel lateral erosion. This information should also be takeninto consideration when analyzing gully dynamics. On this basis, thegullies can be subdivided into four groups (Table 2) according to thetime period when a gully fan or mouth (or initial valley slope at afuture gully location) was disconnected from the main river channelas a result of channel migration:
(i) Late Glacial (N10,000 14C years BP): gullies no. 2, 3, 4, 5,18 and 19.(ii) Early Holocene (N7000 14C years BP): gullies no. 6, 9 and 12.(iii) Middle Holocene (N5000 14C years BP): gullies no. 7, 8 and 11.(iv) Present, i.e. gullies that are directly connected to the present river
channel: gullies no. 10, 13, 14, 15, 16, 17, and also no. 1 which islocated at the side of a small valley of the Yazvitsy River (Fig. 1).
The above periods of time do not correspond to ages of gullyformation, but to the time passed since a valley slope at a particulargully location was undercut the last time by migration of a recipientriver channel. For example, the Volchiy gully (no. 3 in Table 2 andFig. 1) itself began to form only in the middle Holocene (see below,Section 4.1), but the main valley slope at this point was disconnectedfrom lateral erosion of the Protva River channel much earlier. Thus,it belongs to group 1, i.e. Late Glacial (N10,000 14C years BP). It is,therefore, important to compare the date of a gully initiation withthe time at which the valley slope was disconnected from the mainriver channel in order to understand the temporal variation of gullysediment dynamics and gully's interaction with a recipient river.
3. Methods
Processes of erosion usually exhibit high temporal and spatialirregularity caused by the stochastic nature of both driving forces andinfluencing factors. Long periods of stability can be interrupted by
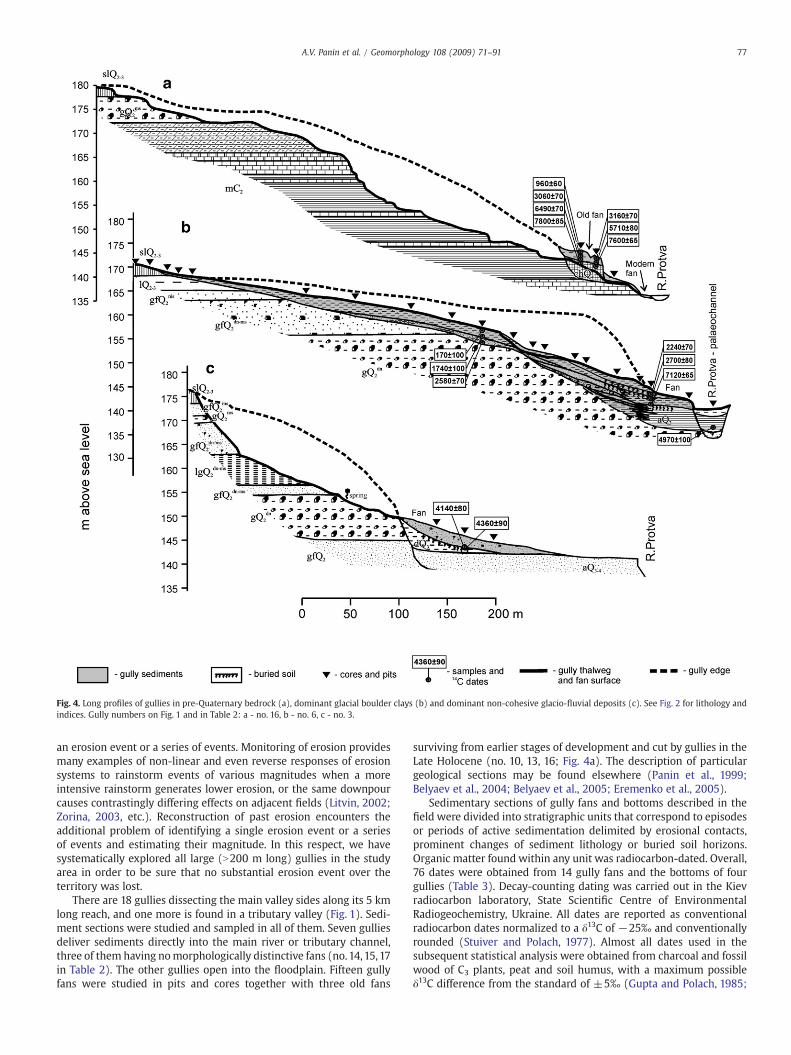
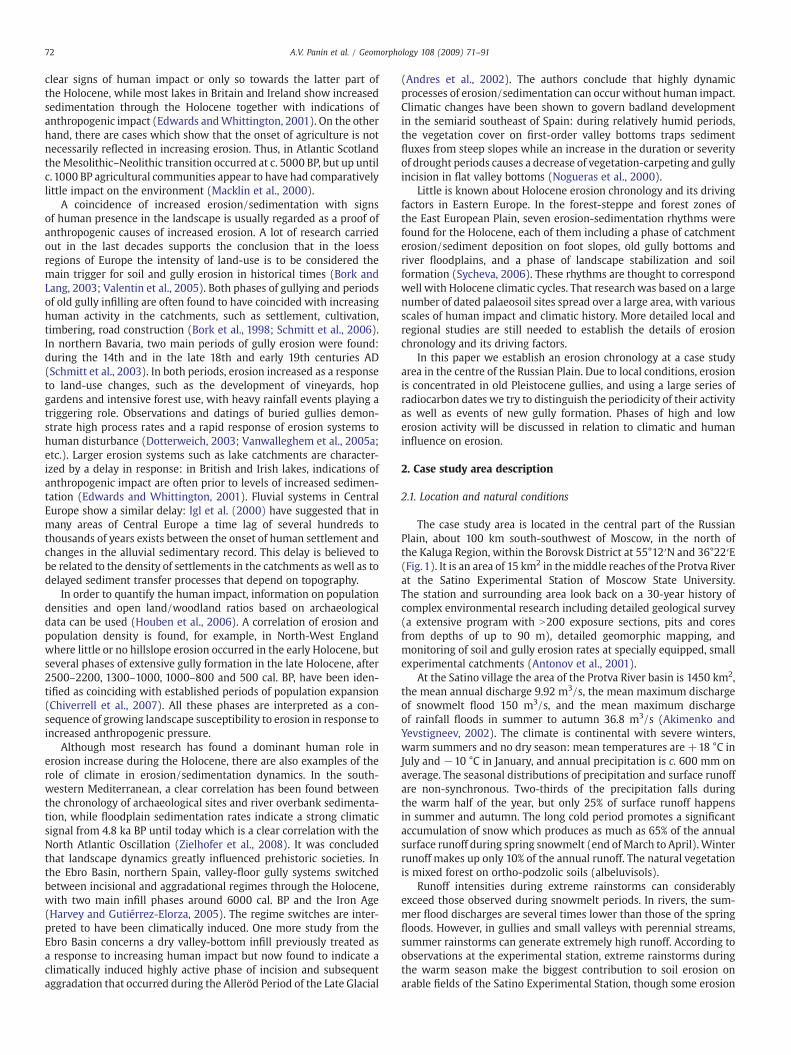
Fig. 4. Long profiles of gullies in pre-Quaternary bedrock (a), dominant glacial boulder clays (b) and dominant non-cohesive glacio-fluvial deposits (c). See Fig. 2 for lithology andindices. Gully numbers on Fig. 1 and in Table 2: a - no. 16, b - no. 6, c - no. 3.
77A.V. Panin et al. / Geomorphology 108 (2009) 71–91
an erosion event or a series of events. Monitoring of erosion providesmany examples of non-linear and even reverse responses of erosionsystems to rainstorm events of various magnitudes when a moreintensive rainstorm generates lower erosion, or the same downpourcauses contrastingly differing effects on adjacent fields (Litvin, 2002;Zorina, 2003, etc.). Reconstruction of past erosion encounters theadditional problem of identifying a single erosion event or a seriesof events and estimating their magnitude. In this respect, we havesystematically explored all large (N200 m long) gullies in the studyarea in order to be sure that no substantial erosion event over theterritory was lost.
There are 18 gullies dissecting the main valley sides along its 5 kmlong reach, and one more is found in a tributary valley (Fig. 1). Sedi-ment sections were studied and sampled in all of them. Seven gulliesdeliver sediments directly into the main river or tributary channel,three of them having nomorphologically distinctive fans (no.14,15,17in Table 2). The other gullies open into the floodplain. Fifteen gullyfans were studied in pits and cores together with three old fans
surviving from earlier stages of development and cut by gullies in theLate Holocene (no. 10, 13, 16; Fig. 4a). The description of particulargeological sections may be found elsewhere (Panin et al., 1999;Belyaev et al., 2004; Belyaev et al., 2005; Eremenko et al., 2005).
Sedimentary sections of gully fans and bottoms described in thefield were divided into stratigraphic units that correspond to episodesor periods of active sedimentation delimited by erosional contacts,prominent changes of sediment lithology or buried soil horizons.Organic matter found within any unit was radiocarbon-dated. Overall,76 dates were obtained from 14 gully fans and the bottoms of fourgullies (Table 3). Decay-counting dating was carried out in the Kievradiocarbon laboratory, State Scientific Centre of EnvironmentalRadiogeochemistry, Ukraine. All dates are reported as conventionalradiocarbon dates normalized to a δ13C of −25‰ and conventionallyrounded (Stuiver and Polach, 1977). Almost all dates used in thesubsequent statistical analysis were obtained from charcoal and fossilwood of C3 plants, peat and soil humus, with a maximum possibleδ13C difference from the standard of ±5‰ (Gupta and Polach, 1985;
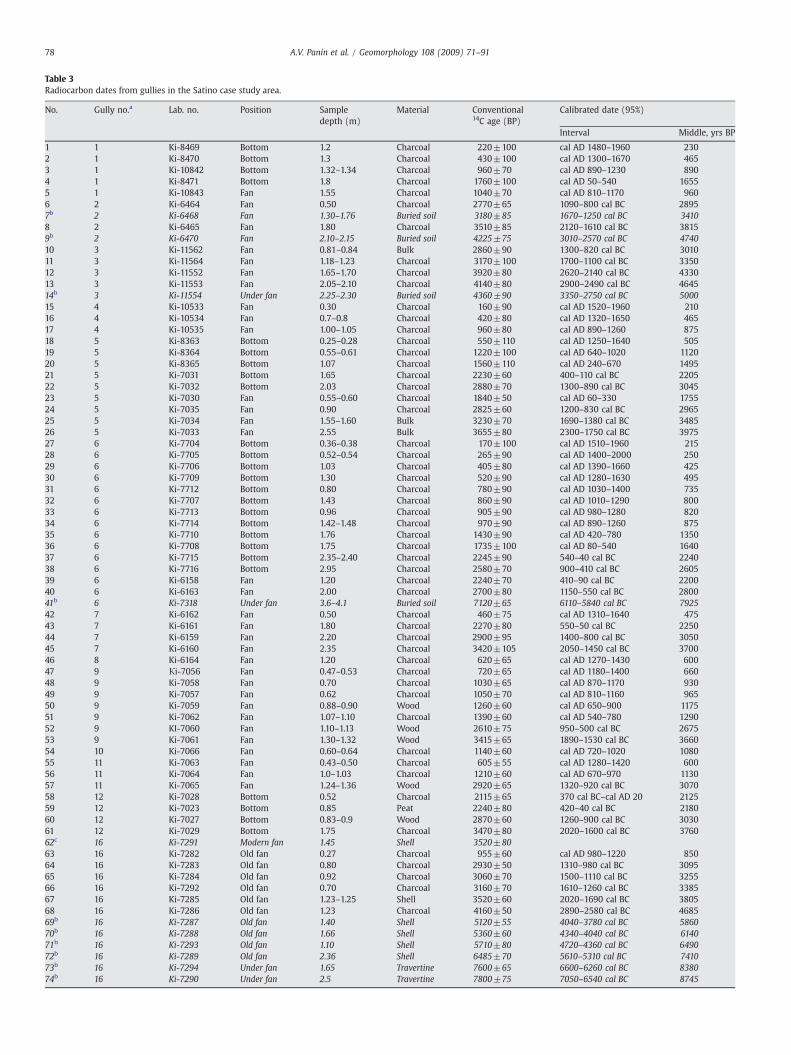
Table 3Radiocarbon dates from gullies in the Satino case study area.
No. Gully no.a Lab. no. Position Sampledepth (m)
Material Conventional14C age (BP)
Calibrated date (95%)
Interval Middle, yrs BP
1 1 Ki-8469 Bottom 1.2 Charcoal 220±100 cal AD 1480–1960 2302 1 Ki-8470 Bottom 1.3 Charcoal 430±100 cal AD 1300–1670 4653 1 Ki-10842 Bottom 1.32–1.34 Charcoal 960±70 cal AD 890–1230 8904 1 Ki-8471 Bottom 1.8 Charcoal 1760±100 cal AD 50–540 16555 1 Ki-10843 Fan 1.55 Charcoal 1040±70 cal AD 810–1170 9606 2 Ki-6464 Fan 0.50 Charcoal 2770±65 1090–800 cal BC 28957b 2 Ki-6468 Fan 1.30–1.76 Buried soil 3180±85 1670–1250 cal BC 34108 2 Ki-6465 Fan 1.80 Charcoal 3510±85 2120–1610 cal BC 38159b 2 Ki-6470 Fan 2.10–2.15 Buried soil 4225±75 3010–2570 cal BC 474010 3 Ki-11562 Fan 0.81–0.84 Bulk 2860±90 1300–820 cal BC 301011 3 Ki-11564 Fan 1.18–1.23 Charcoal 3170±100 1700–1100 cal BC 335012 3 Ki-11552 Fan 1.65–1.70 Charcoal 3920±80 2620–2140 cal BC 433013 3 Ki-11553 Fan 2.05–2.10 Charcoal 4140±80 2900–2490 cal BC 464514b 3 Ki-11554 Under fan 2.25–2.30 Buried soil 4360±90 3350–2750 cal BC 500015 4 Ki-10533 Fan 0.30 Charcoal 160±90 cal AD 1520–1960 21016 4 Ki-10534 Fan 0.7–0.8 Charcoal 420±80 cal AD 1320–1650 46517 4 Ki-10535 Fan 1.00–1.05 Charcoal 960±80 cal AD 890–1260 87518 5 Ki-8363 Bottom 0.25–0.28 Charcoal 550±110 cal AD 1250–1640 50519 5 Ki-8364 Bottom 0.55–0.61 Charcoal 1220±100 cal AD 640–1020 112020 5 Ki-8365 Bottom 1.07 Charcoal 1560±110 cal AD 240–670 149521 5 Ki-7031 Bottom 1.65 Charcoal 2230±60 400–110 cal BC 220522 5 Ki-7032 Bottom 2.03 Charcoal 2880±70 1300–890 cal BC 304523 5 Ki-7030 Fan 0.55–0.60 Charcoal 1840±50 cal AD 60–330 175524 5 Ki-7035 Fan 0.90 Charcoal 2825±60 1200–830 cal BC 296525 5 Ki-7034 Fan 1.55–1.60 Bulk 3230±70 1690–1380 cal BC 348526 5 Ki-7033 Fan 2.55 Bulk 3655±80 2300–1750 cal BC 397527 6 Ki-7704 Bottom 0.36–0.38 Charcoal 170±100 cal AD 1510–1960 21528 6 Ki-7705 Bottom 0.52–0.54 Charcoal 265±90 cal AD 1400–2000 25029 6 Ki-7706 Bottom 1.03 Charcoal 405±80 cal AD 1390–1660 42530 6 Ki-7709 Bottom 1.30 Charcoal 520±90 cal AD 1280–1630 49531 6 Ki-7712 Bottom 0.80 Charcoal 780±90 cal AD 1030–1400 73532 6 Ki-7707 Bottom 1.43 Charcoal 860±90 cal AD 1010–1290 80033 6 Ki-7713 Bottom 0.96 Charcoal 905±90 cal AD 980–1280 82034 6 Ki-7714 Bottom 1.42–1.48 Charcoal 970±90 cal AD 890–1260 87535 6 Ki-7710 Bottom 1.76 Charcoal 1430±90 cal AD 420–780 135036 6 Ki-7708 Bottom 1.75 Charcoal 1735±100 cal AD 80–540 164037 6 Ki-7715 Bottom 2.35–2.40 Charcoal 2245±90 540–40 cal BC 224038 6 Ki-7716 Bottom 2.95 Charcoal 2580±70 900–410 cal BC 260539 6 Ki-6158 Fan 1.20 Charcoal 2240±70 410–90 cal BC 220040 6 Ki-6163 Fan 2.00 Charcoal 2700±80 1150–550 cal BC 280041b 6 Ki-7318 Under fan 3.6–4.1 Buried soil 7120±65 6110–5840 cal BC 792542 7 Ki-6162 Fan 0.50 Charcoal 460±75 cal AD 1310–1640 47543 7 Ki-6161 Fan 1.80 Charcoal 2270±80 550–50 cal BC 225044 7 Ki-6159 Fan 2.20 Charcoal 2900±95 1400–800 cal BC 305045 7 Ki-6160 Fan 2.35 Charcoal 3420±105 2050–1450 cal BC 370046 8 Ki-6164 Fan 1.20 Charcoal 620±65 cal AD 1270–1430 60047 9 Кi-7056 Fan 0.47–0.53 Charcoal 720±65 cal AD 1180–1400 66048 9 Ki-7058 Fan 0.70 Charcoal 1030±65 cal AD 870–1170 93049 9 Ki-7057 Fan 0.62 Charcoal 1050±70 cal AD 810–1160 96550 9 Ki-7059 Fan 0.88–0.90 Wood 1260±60 cal AD 650–900 117551 9 Ki-7062 Fan 1.07–1.10 Charcoal 1390±60 cal AD 540–780 129052 9 KI-7060 Fan 1.10–1.13 Wood 2610±75 950–500 cal BC 267553 9 Ki-7061 Fan 1.30–1.32 Wood 3415±65 1890–1530 cal BC 366054 10 Ki-7066 Fan 0.60–0.64 Charcoal 1140±60 cal AD 720–1020 108055 11 Ki-7063 Fan 0.43–0.50 Charcoal 605±55 cal AD 1280–1420 60056 11 Ki-7064 Fan 1.0–1.03 Charcoal 1210±60 cal AD 670–970 113057 11 Ki-7065 Fan 1.24–1.36 Wood 2920±65 1320–920 cal BC 307058 12 Ki-7028 Bottom 0.52 Charcoal 2115±65 370 cal BC–cal AD 20 212559 12 Ki-7023 Bottom 0.85 Peat 2240±80 420–40 cal BC 218060 12 Ki-7027 Bottom 0.83–0.9 Wood 2870±60 1260–900 cal BC 303061 12 Ki-7029 Bottom 1.75 Charcoal 3470±80 2020–1600 cal BC 376062c 16 Ki-7291 Modern fan 1.45 Shell 3520±8063 16 Ki-7282 Old fan 0.27 Charcoal 955±60 cal AD 980–1220 85064 16 Ki-7283 Old fan 0.80 Charcoal 2930±50 1310–980 cal BC 309565 16 Ki-7284 Old fan 0.92 Charcoal 3060±70 1500–1110 cal BC 325566 16 Ki-7292 Old fan 0.70 Charcoal 3160±70 1610–1260 cal BC 338567 16 Ki-7285 Old fan 1.23–1.25 Shell 3520±60 2020–1690 cal BC 380568 16 Ki-7286 Old fan 1.23 Charcoal 4160±50 2890–2580 cal BC 468569b 16 Ki-7287 Old fan 1.40 Shell 5120±55 4040–3780 cal BC 586070b 16 Ki-7288 Old fan 1.66 Shell 5360±60 4340–4040 cal BC 614071b 16 Ki-7293 Old fan 1.10 Shell 5710±80 4720–4360 cal BC 649072b 16 Ki-7289 Old fan 2.36 Shell 6485±70 5610–5310 cal BC 741073b 16 Ki-7294 Under fan 1.65 Travertine 7600±65 6600–6260 cal BC 838074b 16 Ki-7290 Under fan 2.5 Travertine 7800±75 7050–6540 cal BC 8745
78 A.V. Panin et al. / Geomorphology 108 (2009) 71–91
75 18 Ki-7067 Fan 2.0–2.1 Charcoal 3270±60 1690–1430 cal BC 351076 19 Ki-7068 Fan 0.70–0.75 Charcoal 930±70 cal AD 980–1260 830
a Gully numbers correspond to those in Table 2 and Fig. 1.b Dates given in italics are not used in statistical analysis (see text).c Rejected date (see text).
Table 3 (continued )
No. Gully no.a Lab. no. Position Sampledepth (m)
Material Conventional14C age (BP)
Calibrated date (95%)
Interval Middle, yrs BP
79A.V. Panin et al. / Geomorphology 108 (2009) 71–91
Aitken, 1990). That may at worst result in an 80-year underestimationor overestimation, which is insignificant compared with the 2σ(95.4%) calibration interval of 300–600 calendar years provided bylaboratory errors of ±50–110 years (Table 3). Calibration was madewith the OxCal Version 3.10 program (Bronk Ramsey, 2001, 2005)using atmospheric data from Reimer et al. (2004). BC/AD and BP (0BP=1950 AD) time scales are used in the text depending on which ismore convenient in the context. Uncalibrated radiocarbon ages arespecially indicated as 14C years BP.
Wide calibration intervals impose limits both on the reliability ofcorrelation between individual events, and on the distinction betweenphases of different erosion activity. Redeposition of organic mattersampled for dating is also probable given the specific nature of gullysedimentation. These limitations suggest caution in interpretingthe dates in terms of single events and encourage the applicationof statistical approaches to analyze the entire data set rather thanindividual dates. We excluded dates from well-developed soils insidethe fan sections and soils or travertines buried under the fans (nos. 7,9, 14, 41, 73, and 74 in Table 3) because they characterize periods ofstability rather than erosion activity. Date no. 62 (Table 3) wasrejected because the sample was recognized as redeposited from itsposition in the geological section above a layer containing a glassfragment. Because only five dates represent the first half of theHolocene, and because they all belong to only one gully (dates no. 69–72, Table 3), we also exclude them from statistical analysis as notbeing representative of the entire area. Finally, we consider a series of65 dates younger than 500014C years BP for this study. The datedmaterial is charcoal in 55 cases, wood in six, soil humus (bulksamples) in two, and peat and shell in one case each.
Systematic sample bias should be taken into account whenanalyzing the data set. Upper and lower parts of sedimentary sectionsin gully fans were not studied in equal detail. Sediments older than3500–4000 radiocarbon years BP usually lie at depths of more than1.5–2.0 m in gully fans. As in many cases pits were limited to 1.0–1.5 mdepth because of the groundwater level, the lower parts of fanswere studied by coring. That provided a much lower probability ofobtaining datable matter. The youngest sediments were not sampledpurposely in many cases because of the time constraints of the radio-carbon method. For example, samples were not taken from sedimentsthe young age of which was obvious from artefacts (brick and glass
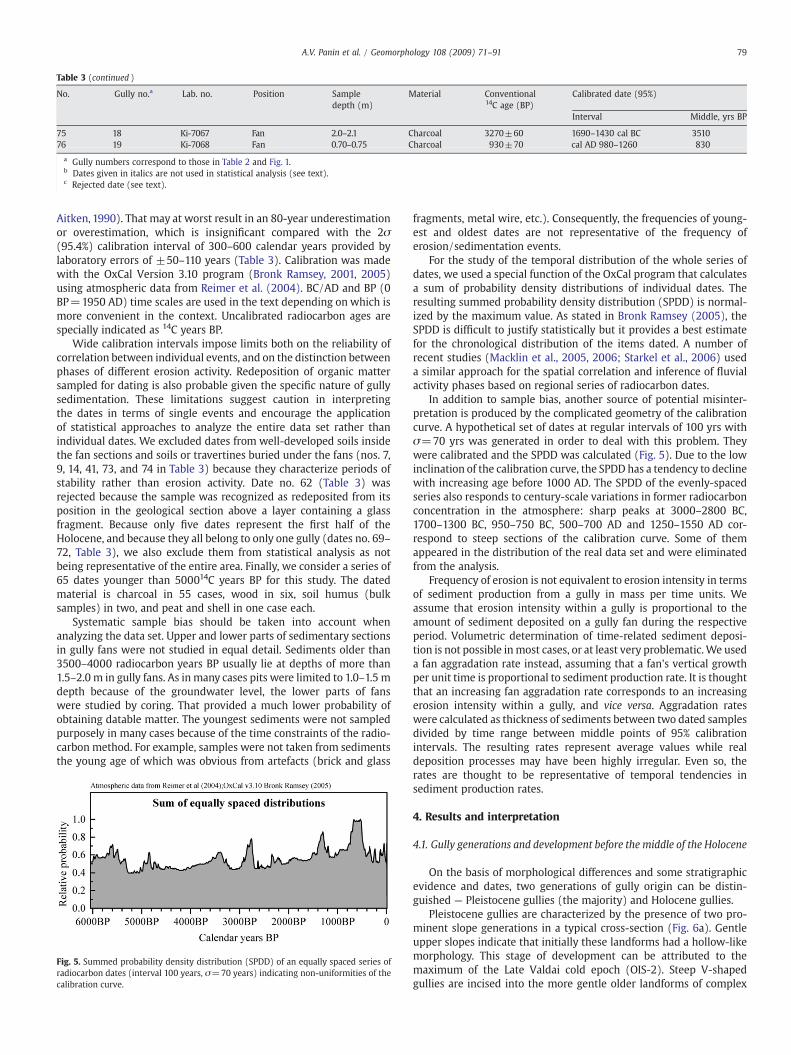
Fig. 5. Summed probability density distribution (SPDD) of an equally spaced series ofradiocarbon dates (interval 100 years, σ=70 years) indicating non-uniformities of thecalibration curve.
fragments, metal wire, etc.). Consequently, the frequencies of young-est and oldest dates are not representative of the frequency oferosion/sedimentation events.
For the study of the temporal distribution of the whole series ofdates, we used a special function of the OxCal program that calculatesa sum of probability density distributions of individual dates. Theresulting summed probability density distribution (SPDD) is normal-ized by the maximum value. As stated in Bronk Ramsey (2005), theSPDD is difficult to justify statistically but it provides a best estimatefor the chronological distribution of the items dated. A number ofrecent studies (Macklin et al., 2005, 2006; Starkel et al., 2006) useda similar approach for the spatial correlation and inference of fluvialactivity phases based on regional series of radiocarbon dates.
In addition to sample bias, another source of potential misinter-pretation is produced by the complicated geometry of the calibrationcurve. A hypothetical set of dates at regular intervals of 100 yrs withσ=70 yrs was generated in order to deal with this problem. Theywere calibrated and the SPDD was calculated (Fig. 5). Due to the lowinclination of the calibration curve, the SPDD has a tendency to declinewith increasing age before 1000 AD. The SPDD of the evenly-spacedseries also responds to century-scale variations in former radiocarbonconcentration in the atmosphere: sharp peaks at 3000–2800 BC,1700–1300 BC, 950–750 BC, 500–700 AD and 1250–1550 AD cor-respond to steep sections of the calibration curve. Some of themappeared in the distribution of the real data set and were eliminatedfrom the analysis.
Frequency of erosion is not equivalent to erosion intensity in termsof sediment production from a gully in mass per time units. Weassume that erosion intensity within a gully is proportional to theamount of sediment deposited on a gully fan during the respectiveperiod. Volumetric determination of time-related sediment deposi-tion is not possible inmost cases, or at least very problematic.We useda fan aggradation rate instead, assuming that a fan's vertical growthper unit time is proportional to sediment production rate. It is thoughtthat an increasing fan aggradation rate corresponds to an increasingerosion intensity within a gully, and vice versa. Aggradation rateswere calculated as thickness of sediments between two dated samplesdivided by time range between middle points of 95% calibrationintervals. The resulting rates represent average values while realdeposition processes may have been highly irregular. Even so, therates are thought to be representative of temporal tendencies insediment production rates.
4. Results and interpretation
4.1. Gully generations and development before the middle of the Holocene
On the basis of morphological differences and some stratigraphicevidence and dates, two generations of gully origin can be distin-guished — Pleistocene gullies (the majority) and Holocene gullies.
Pleistocene gullies are characterized by the presence of two pro-minent slope generations in a typical cross-section (Fig. 6a). Gentleupper slopes indicate that initially these landforms had a hollow-likemorphology. This stage of development can be attributed to themaximum of the Late Valdai cold epoch (OIS-2). Steep V-shapedgullies are incised into the more gentle older landforms of complex
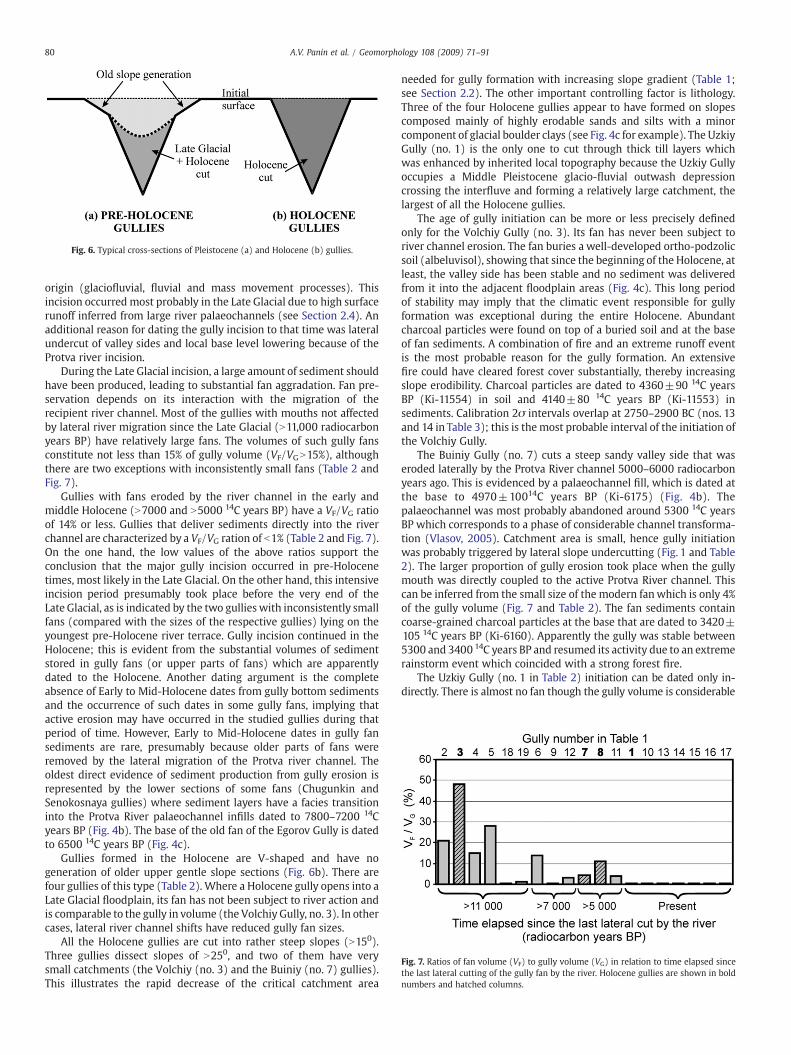
Fig. 7. Ratios of fan volume (VF) to gully volume (VG) in relation to time elapsed sincethe last lateral cutting of the gully fan by the river. Holocene gullies are shown in boldnumbers and hatched columns.
Fig. 6. Typical cross-sections of Pleistocene (a) and Holocene (b) gullies.
80 A.V. Panin et al. / Geomorphology 108 (2009) 71–91
origin (glaciofluvial, fluvial and mass movement processes). Thisincision occurred most probably in the Late Glacial due to high surfacerunoff inferred from large river palaeochannels (see Section 2.4). Anadditional reason for dating the gully incision to that time was lateralundercut of valley sides and local base level lowering because of theProtva river incision.
During the Late Glacial incision, a large amount of sediment shouldhave been produced, leading to substantial fan aggradation. Fan pre-servation depends on its interaction with the migration of therecipient river channel. Most of the gullies with mouths not affectedby lateral river migration since the Late Glacial (N11,000 radiocarbonyears BP) have relatively large fans. The volumes of such gully fansconstitute not less than 15% of gully volume (VF/VGN15%), althoughthere are two exceptions with inconsistently small fans (Table 2 andFig. 7).
Gullies with fans eroded by the river channel in the early andmiddle Holocene (N7000 and N5000 14C years BP) have a VF/VG ratioof 14% or less. Gullies that deliver sediments directly into the riverchannel are characterized by a VF/VG ration of b1% (Table 2 and Fig. 7).On the one hand, the low values of the above ratios support theconclusion that the major gully incision occurred in pre-Holocenetimes, most likely in the Late Glacial. On the other hand, this intensiveincision period presumably took place before the very end of theLate Glacial, as is indicated by the two gullies with inconsistently smallfans (compared with the sizes of the respective gullies) lying on theyoungest pre-Holocene river terrace. Gully incision continued in theHolocene; this is evident from the substantial volumes of sedimentstored in gully fans (or upper parts of fans) which are apparentlydated to the Holocene. Another dating argument is the completeabsence of Early to Mid-Holocene dates from gully bottom sedimentsand the occurrence of such dates in some gully fans, implying thatactive erosion may have occurred in the studied gullies during thatperiod of time. However, Early to Mid-Holocene dates in gully fansediments are rare, presumably because older parts of fans wereremoved by the lateral migration of the Protva river channel. Theoldest direct evidence of sediment production from gully erosion isrepresented by the lower sections of some fans (Chugunkin andSenokosnaya gullies) where sediment layers have a facies transitioninto the Protva River palaeochannel infills dated to 7800–7200 14Cyears BP (Fig. 4b). The base of the old fan of the Egorov Gully is datedto 6500 14C years BP (Fig. 4c).
Gullies formed in the Holocene are V-shaped and have nogeneration of older upper gentle slope sections (Fig. 6b). There arefour gullies of this type (Table 2). Where a Holocene gully opens into aLate Glacial floodplain, its fan has not been subject to river action andis comparable to the gully in volume (the Volchiy Gully, no. 3). In othercases, lateral river channel shifts have reduced gully fan sizes.
All the Holocene gullies are cut into rather steep slopes (N150).Three gullies dissect slopes of N250, and two of them have verysmall catchments (the Volchiy (no. 3) and the Buiniy (no. 7) gullies).This illustrates the rapid decrease of the critical catchment area
needed for gully formation with increasing slope gradient (Table 1;see Section 2.2). The other important controlling factor is lithology.Three of the four Holocene gullies appear to have formed on slopescomposed mainly of highly erodable sands and silts with a minorcomponent of glacial boulder clays (see Fig. 4c for example). The UzkiyGully (no. 1) is the only one to cut through thick till layers whichwas enhanced by inherited local topography because the Uzkiy Gullyoccupies a Middle Pleistocene glacio-fluvial outwash depressioncrossing the interfluve and forming a relatively large catchment, thelargest of all the Holocene gullies.
The age of gully initiation can be more or less precisely definedonly for the Volchiy Gully (no. 3). Its fan has never been subject toriver channel erosion. The fan buries a well-developed ortho-podzolicsoil (albeluvisol), showing that since the beginning of the Holocene, atleast, the valley side has been stable and no sediment was deliveredfrom it into the adjacent floodplain areas (Fig. 4c). This long periodof stability may imply that the climatic event responsible for gullyformation was exceptional during the entire Holocene. Abundantcharcoal particles were found on top of a buried soil and at the baseof fan sediments. A combination of fire and an extreme runoff eventis the most probable reason for the gully formation. An extensivefire could have cleared forest cover substantially, thereby increasingslope erodibility. Charcoal particles are dated to 4360±90 14C yearsBP (Ki-11554) in soil and 4140±80 14C years BP (Ki-11553) insediments. Calibration 2σ intervals overlap at 2750–2900 BC (nos. 13and 14 in Table 3); this is themost probable interval of the initiation ofthe Volchiy Gully.
The Buiniy Gully (no. 7) cuts a steep sandy valley side that waseroded laterally by the Protva River channel 5000–6000 radiocarbonyears ago. This is evidenced by a palaeochannel fill, which is dated atthe base to 4970±10014C years BP (Ki-6175) (Fig. 4b). Thepalaeochannel was most probably abandoned around 5300 14C yearsBP which corresponds to a phase of considerable channel transforma-tion (Vlasov, 2005). Catchment area is small, hence gully initiationwas probably triggered by lateral slope undercutting (Fig. 1 and Table2). The larger proportion of gully erosion took place when the gullymouth was directly coupled to the active Protva River channel. Thiscan be inferred from the small size of the modern fanwhich is only 4%of the gully volume (Fig. 7 and Table 2). The fan sediments containcoarse-grained charcoal particles at the base that are dated to 3420±105 14C years BP (Ki-6160). Apparently the gully was stable between5300 and 3400 14C years BP and resumed its activity due to an extremerainstorm event which coincided with a strong forest fire.
The Uzkiy Gully (no. 1 in Table 2) initiation can be dated only in-directly. There is almost no fan though the gully volume is considerable
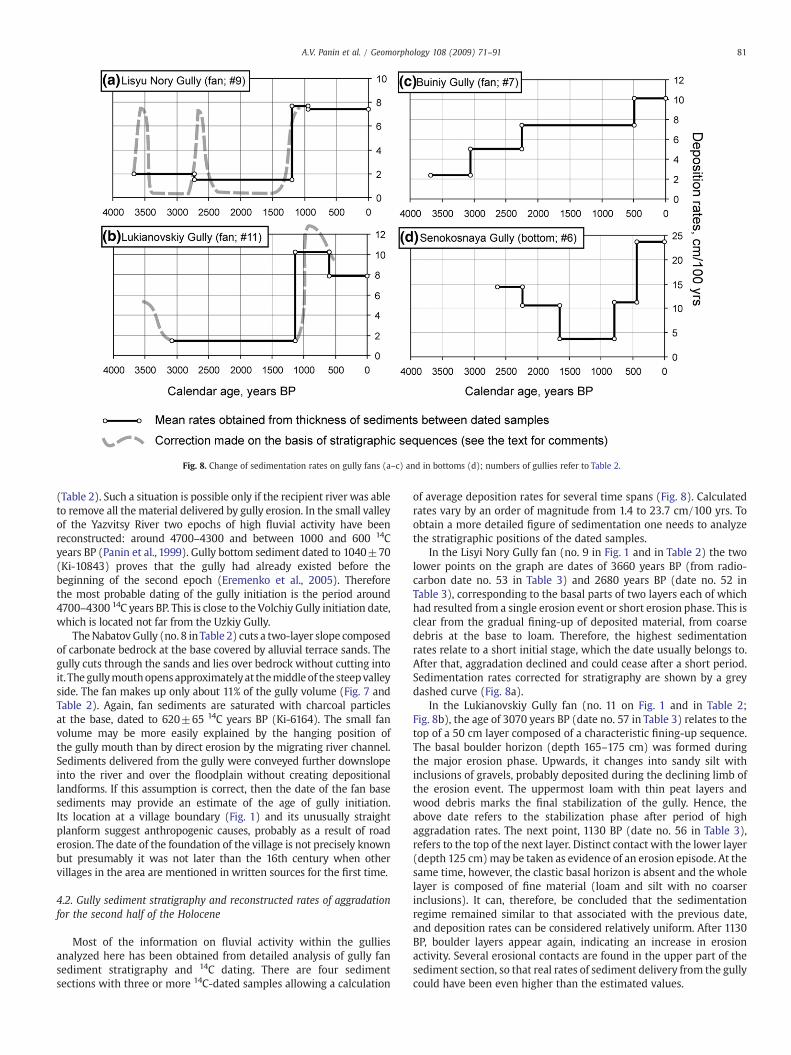
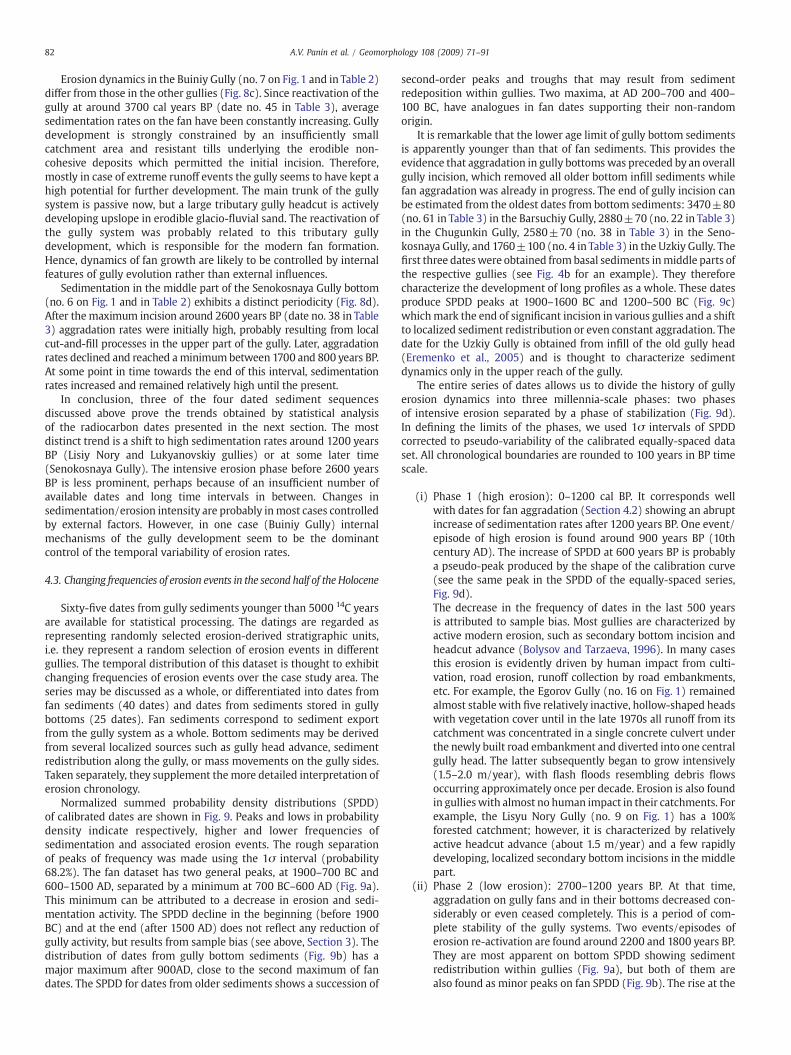
Fig. 8. Change of sedimentation rates on gully fans (a–c) and in bottoms (d); numbers of gullies refer to Table 2.
81A.V. Panin et al. / Geomorphology 108 (2009) 71–91
(Table 2). Such a situation is possible only if the recipient river was ableto remove all the material delivered by gully erosion. In the small valleyof the Yazvitsy River two epochs of high fluvial activity have beenreconstructed: around 4700–4300 and between 1000 and 600 14Cyears BP (Panin et al., 1999). Gully bottom sediment dated to 1040±70(Ki-10843) proves that the gully had already existed before thebeginning of the second epoch (Eremenko et al., 2005). Thereforethe most probable dating of the gully initiation is the period around4700–4300 14C years BP. This is close to the Volchiy Gully initiation date,which is located not far from the Uzkiy Gully.
TheNabatovGully (no. 8 inTable 2) cuts a two-layer slope composedof carbonate bedrock at the base covered by alluvial terrace sands. Thegully cuts through the sands and lies over bedrock without cutting intoit. The gullymouthopensapproximatelyat themiddle of the steepvalleyside. The fan makes up only about 11% of the gully volume (Fig. 7 andTable 2). Again, fan sediments are saturated with charcoal particlesat the base, dated to 620±65 14C years BP (Ki-6164). The small fanvolume may be more easily explained by the hanging position ofthe gully mouth than by direct erosion by the migrating river channel.Sediments delivered from the gully were conveyed further downslopeinto the river and over the floodplain without creating depositionallandforms. If this assumption is correct, then the date of the fan basesediments may provide an estimate of the age of gully initiation.Its location at a village boundary (Fig. 1) and its unusually straightplanform suggest anthropogenic causes, probably as a result of roaderosion. The date of the foundation of the village is not precisely knownbut presumably it was not later than the 16th century when othervillages in the area are mentioned in written sources for the first time.
4.2. Gully sediment stratigraphy and reconstructed rates of aggradationfor the second half of the Holocene
Most of the information on fluvial activity within the gulliesanalyzed here has been obtained from detailed analysis of gully fansediment stratigraphy and 14C dating. There are four sedimentsections with three or more 14C-dated samples allowing a calculation
of average deposition rates for several time spans (Fig. 8). Calculatedrates vary by an order of magnitude from 1.4 to 23.7 cm/100 yrs. Toobtain a more detailed figure of sedimentation one needs to analyzethe stratigraphic positions of the dated samples.
In the Lisyi Nory Gully fan (no. 9 in Fig. 1 and in Table 2) the twolower points on the graph are dates of 3660 years BP (from radio-carbon date no. 53 in Table 3) and 2680 years BP (date no. 52 inTable 3), corresponding to the basal parts of two layers each of whichhad resulted from a single erosion event or short erosion phase. This isclear from the gradual fining-up of deposited material, from coarsedebris at the base to loam. Therefore, the highest sedimentationrates relate to a short initial stage, which the date usually belongs to.After that, aggradation declined and could cease after a short period.Sedimentation rates corrected for stratigraphy are shown by a greydashed curve (Fig. 8a).
In the Lukianovskiy Gully fan (no. 11 on Fig. 1 and in Table 2;Fig. 8b), the age of 3070 years BP (date no. 57 in Table 3) relates to thetop of a 50 cm layer composed of a characteristic fining-up sequence.The basal boulder horizon (depth 165–175 cm) was formed duringthe major erosion phase. Upwards, it changes into sandy silt withinclusions of gravels, probably deposited during the declining limb ofthe erosion event. The uppermost loam with thin peat layers andwood debris marks the final stabilization of the gully. Hence, theabove date refers to the stabilization phase after period of highaggradation rates. The next point, 1130 BP (date no. 56 in Table 3),refers to the top of the next layer. Distinct contact with the lower layer(depth 125 cm)may be taken as evidence of an erosion episode. At thesame time, however, the clastic basal horizon is absent and the wholelayer is composed of fine material (loam and silt with no coarserinclusions). It can, therefore, be concluded that the sedimentationregime remained similar to that associated with the previous date,and deposition rates can be considered relatively uniform. After 1130BP, boulder layers appear again, indicating an increase in erosionactivity. Several erosional contacts are found in the upper part of thesediment section, so that real rates of sediment delivery from the gullycould have been even higher than the estimated values.
82 A.V. Panin et al. / Geomorphology 108 (2009) 71–91
Erosion dynamics in the Buiniy Gully (no. 7 on Fig. 1 and in Table 2)differ from those in the other gullies (Fig. 8c). Since reactivation of thegully at around 3700 cal years BP (date no. 45 in Table 3), averagesedimentation rates on the fan have been constantly increasing. Gullydevelopment is strongly constrained by an insufficiently smallcatchment area and resistant tills underlying the erodible non-cohesive deposits which permitted the initial incision. Therefore,mostly in case of extreme runoff events the gully seems to have kept ahigh potential for further development. The main trunk of the gullysystem is passive now, but a large tributary gully headcut is activelydeveloping upslope in erodible glacio-fluvial sand. The reactivation ofthe gully system was probably related to this tributary gullydevelopment, which is responsible for the modern fan formation.Hence, dynamics of fan growth are likely to be controlled by internalfeatures of gully evolution rather than external influences.
Sedimentation in the middle part of the Senokosnaya Gully bottom(no. 6 on Fig. 1 and in Table 2) exhibits a distinct periodicity (Fig. 8d).After themaximum incision around 2600 years BP (date no. 38 in Table3) aggradation rates were initially high, probably resulting from localcut-and-fill processes in the upper part of the gully. Later, aggradationrates declined and reached aminimumbetween 1700 and 800 years BP.At some point in time towards the end of this interval, sedimentationrates increased and remained relatively high until the present.
In conclusion, three of the four dated sediment sequencesdiscussed above prove the trends obtained by statistical analysisof the radiocarbon dates presented in the next section. The mostdistinct trend is a shift to high sedimentation rates around 1200 yearsBP (Lisiy Nory and Lukyanovskiy gullies) or at some later time(Senokosnaya Gully). The intensive erosion phase before 2600 yearsBP is less prominent, perhaps because of an insufficient number ofavailable dates and long time intervals in between. Changes insedimentation/erosion intensity are probably inmost cases controlledby external factors. However, in one case (Buiniy Gully) internalmechanisms of the gully development seem to be the dominantcontrol of the temporal variability of erosion rates.
4.3. Changing frequencies of erosion events in the second half of the Holocene
Sixty-five dates from gully sediments younger than 5000 14C yearsare available for statistical processing. The datings are regarded asrepresenting randomly selected erosion-derived stratigraphic units,i.e. they represent a random selection of erosion events in differentgullies. The temporal distribution of this dataset is thought to exhibitchanging frequencies of erosion events over the case study area. Theseries may be discussed as a whole, or differentiated into dates fromfan sediments (40 dates) and dates from sediments stored in gullybottoms (25 dates). Fan sediments correspond to sediment exportfrom the gully system as a whole. Bottom sediments may be derivedfrom several localized sources such as gully head advance, sedimentredistribution along the gully, or mass movements on the gully sides.Taken separately, they supplement the more detailed interpretation oferosion chronology.
Normalized summed probability density distributions (SPDD)of calibrated dates are shown in Fig. 9. Peaks and lows in probabilitydensity indicate respectively, higher and lower frequencies ofsedimentation and associated erosion events. The rough separationof peaks of frequency was made using the 1σ interval (probability68.2%). The fan dataset has two general peaks, at 1900–700 BC and600–1500 AD, separated by a minimum at 700 BC–600 AD (Fig. 9a).This minimum can be attributed to a decrease in erosion and sedi-mentation activity. The SPDD decline in the beginning (before 1900BC) and at the end (after 1500 AD) does not reflect any reduction ofgully activity, but results from sample bias (see above, Section 3). Thedistribution of dates from gully bottom sediments (Fig. 9b) has amajor maximum after 900AD, close to the second maximum of fandates. The SPDD for dates from older sediments shows a succession of
second-order peaks and troughs that may result from sedimentredeposition within gullies. Two maxima, at AD 200–700 and 400–100 BC, have analogues in fan dates supporting their non-randomorigin.
It is remarkable that the lower age limit of gully bottom sedimentsis apparently younger than that of fan sediments. This provides theevidence that aggradation in gully bottomswas preceded by an overallgully incision, which removed all older bottom infill sediments whilefan aggradation was already in progress. The end of gully incision canbe estimated from the oldest dates from bottom sediments: 3470±80(no. 61 in Table 3) in the Barsuchiy Gully, 2880±70 (no. 22 in Table 3)in the Chugunkin Gully, 2580±70 (no. 38 in Table 3) in the Seno-kosnaya Gully, and 1760±100 (no. 4 in Table 3) in the Uzkiy Gully. Thefirst three dateswere obtained from basal sediments inmiddle parts ofthe respective gullies (see Fig. 4b for an example). They thereforecharacterize the development of long profiles as a whole. These datesproduce SPDD peaks at 1900–1600 BC and 1200–500 BC (Fig. 9c)whichmark the end of significant incision in various gullies and a shiftto localized sediment redistribution or even constant aggradation. Thedate for the Uzkiy Gully is obtained from infill of the old gully head(Eremenko et al., 2005) and is thought to characterize sedimentdynamics only in the upper reach of the gully.
The entire series of dates allows us to divide the history of gullyerosion dynamics into three millennia-scale phases: two phasesof intensive erosion separated by a phase of stabilization (Fig. 9d).In defining the limits of the phases, we used 1σ intervals of SPDDcorrected to pseudo-variability of the calibrated equally-spaced dataset. All chronological boundaries are rounded to 100 years in BP timescale.
(i) Phase 1 (high erosion): 0–1200 cal BP. It corresponds wellwith dates for fan aggradation (Section 4.2) showing an abruptincrease of sedimentation rates after 1200 years BP. One event/episode of high erosion is found around 900 years BP (10thcentury AD). The increase of SPDD at 600 years BP is probablya pseudo-peak produced by the shape of the calibration curve(see the same peak in the SPDD of the equally-spaced series,Fig. 9d).The decrease in the frequency of dates in the last 500 yearsis attributed to sample bias. Most gullies are characterized byactive modern erosion, such as secondary bottom incision andheadcut advance (Bolysov and Tarzaeva, 1996). In many casesthis erosion is evidently driven by human impact from culti-vation, road erosion, runoff collection by road embankments,etc. For example, the Egorov Gully (no. 16 on Fig. 1) remainedalmost stable with five relatively inactive, hollow-shaped headswith vegetation cover until in the late 1970s all runoff from itscatchment was concentrated in a single concrete culvert underthe newly built road embankment and diverted into one centralgully head. The latter subsequently began to grow intensively(1.5–2.0 m/year), with flash floods resembling debris flowsoccurring approximately once per decade. Erosion is also foundin gullieswith almost no human impact in their catchments. Forexample, the Lisyu Nory Gully (no. 9 on Fig. 1) has a 100%forested catchment; however, it is characterized by relativelyactive headcut advance (about 1.5 m/year) and a few rapidlydeveloping, localized secondary bottom incisions in the middlepart.
(ii) Phase 2 (low erosion): 2700–1200 years BP. At that time,aggradation on gully fans and in their bottoms decreased con-siderably or even ceased completely. This is a period of com-plete stability of the gully systems. Two events/episodes oferosion re-activation are found around 2200 and 1800 years BP.They are most apparent on bottom SPDD showing sedimentredistribution within gullies (Fig. 9a), but both of them arealso found as minor peaks on fan SPDD (Fig. 9b). The rise at the
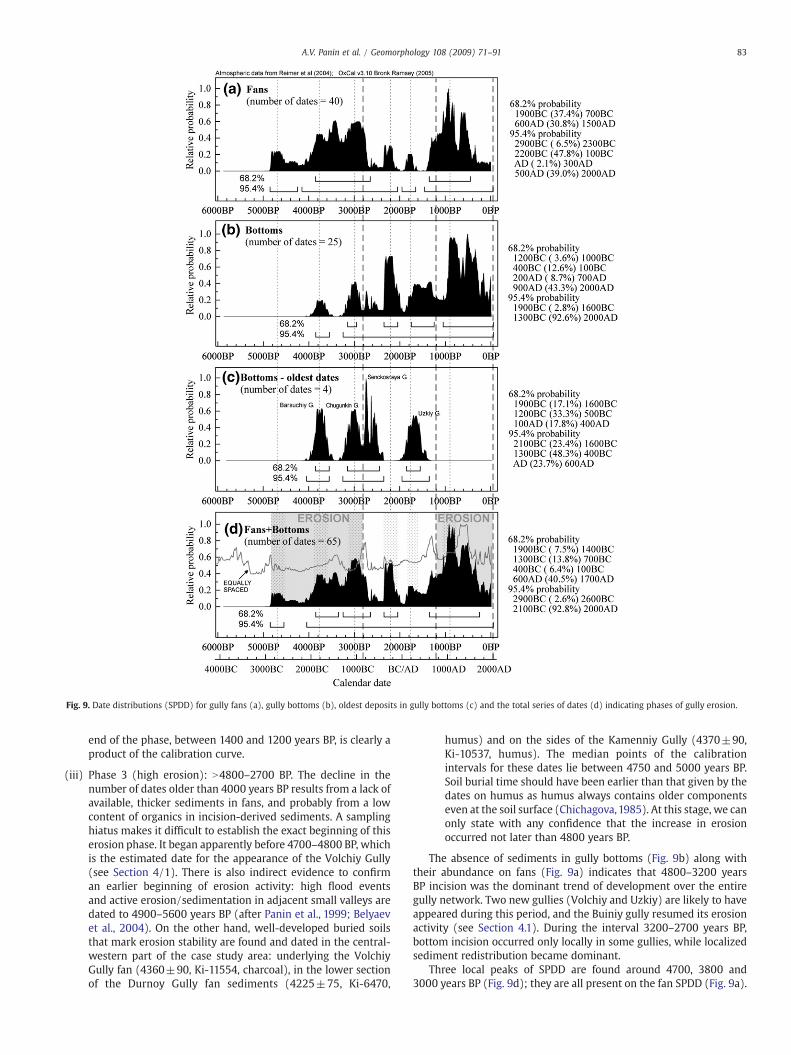
Fig. 9. Date distributions (SPDD) for gully fans (a), gully bottoms (b), oldest deposits in gully bottoms (c) and the total series of dates (d) indicating phases of gully erosion.
83A.V. Panin et al. / Geomorphology 108 (2009) 71–91
end of the phase, between 1400 and 1200 years BP, is clearly aproduct of the calibration curve.
(iii) Phase 3 (high erosion): N4800–2700 BP. The decline in thenumber of dates older than 4000 years BP results from a lack ofavailable, thicker sediments in fans, and probably from a lowcontent of organics in incision-derived sediments. A samplinghiatus makes it difficult to establish the exact beginning of thiserosion phase. It began apparently before 4700–4800 BP, whichis the estimated date for the appearance of the Volchiy Gully(see Section 4/1). There is also indirect evidence to confirman earlier beginning of erosion activity: high flood eventsand active erosion/sedimentation in adjacent small valleys aredated to 4900–5600 years BP (after Panin et al., 1999; Belyaevet al., 2004). On the other hand, well-developed buried soilsthat mark erosion stability are found and dated in the central-western part of the case study area: underlying the VolchiyGully fan (4360±90, Ki-11554, charcoal), in the lower sectionof the Durnoy Gully fan sediments (4225±75, Ki-6470,
humus) and on the sides of the Kamenniy Gully (4370±90,Ki-10537, humus). The median points of the calibrationintervals for these dates lie between 4750 and 5000 years BP.Soil burial time should have been earlier than that given by thedates on humus as humus always contains older componentseven at the soil surface (Chichagova,1985). At this stage, we canonly state with any confidence that the increase in erosionoccurred not later than 4800 years BP.
The absence of sediments in gully bottoms (Fig. 9b) along withtheir abundance on fans (Fig. 9a) indicates that 4800–3200 yearsBP incision was the dominant trend of development over the entiregully network. Two new gullies (Volchiy and Uzkiy) are likely to haveappeared during this period, and the Buiniy gully resumed its erosionactivity (see Section 4.1). During the interval 3200–2700 years BP,bottom incision occurred only locally in some gullies, while localizedsediment redistribution became dominant.
Three local peaks of SPDD are found around 4700, 3800 and3000 years BP (Fig. 9d); they are all present on the fan SPDD (Fig. 9a).

84 A.V. Panin et al. / Geomorphology 108 (2009) 71–91
The first peak correlates to the Volchiy Gully initiation. The second andthe third peaks correspond to the oldest sediments, i.e. the respectivedeepest incisions in the Barsuchiy and Chugunkin gullies (Fig. 9c).The rank of these peaks is not clear as they may correspond bothto decadal or century-scale highs in erosion dynamics and to singleevents spread across the time axis because of uncertainties of radio-carbon dating. Another peak at 3400 years BP has been found to be aproduct of a step in the calibration curve as it is evident also on theSPDD of the equally-spaced series of dates (Fig. 9d).
5. Discussion
5.1. Human impact on erosion activity
Direct or indirect human impact is the major, or one of mostimportant, factors of erosion dynamics in the Holocene (Bork et al.,1998; Edwards and Whittington, 2001; Dotterweich, 2003; Bork and
Fig. 10. Erosion chronology at the Satino case study site (a) compared to: (b) the number ohistorical and economic events in the case study area (after Proshkin,1992; Osipov,1999; Kasin the Moscow Region (after Turmanina, 1980).
Lang, 2003; Valentin et al., 2005; Schmitt et al., 2006; etc.). We haveused the systematic description of all known archaeological sites inthe Kaluga Region (Kashkin at el., 2006) to quantify human presencein the case study region. The Kaluga Region is divided into 24 districts.In order to focus on the case study site, we used data only on theBorovsk District (760 km2, 2.6% of the Kaluga Region). There are106 human settlements dating from various archaeological periods:Mesolithic (11.5–8 ka BP), Neolithic (8–5 ka BP), Early Iron Age(EIA: 2.8–1.8 ka BP), and four subdivisions of the Middle Ages: 3rd–8th, 9th–10th, 11th–13th and 14th–17th centuries AD. We calculatedthe number of settlements for each period and divided them by theduration of the period to obtain a time-specific index, the numberof settlements per century. Though people already lived in the regionin Mesolithic and Neolithic (0.11 and 0.10 sites per 100 yearsrespectively), the graph in Fig. 10 shows that no settlements areknown from the Bronze Age (5.0–2.8 ka BP). In the whole BorovskDistrict only six artefact findings are dated to this epoch (Osipov,
f ancient settlements in the Borovsk District (data from Kashkin et al., 2006), (c) majorhkin et al., 2006; Bublikov et al., 2008), and (d) changing area of forested and arable land
85A.V. Panin et al. / Geomorphology 108 (2009) 71–91
1999). It makes sense to suppose that population density was low atthat time and humans did not influence the landscape. Thus, Phase 3of high erosion is probably not influenced by humans. The appearanceof settlements during the Early Iron Age and their increase in numbersduring the Early Medieval period coincide with low-erosion Phase 2.The increase in erosion at the beginning of Phase 1 coincided with astable density of settlements although it also coincides with the Slaviccolonizationof the region. Evidence of human impact becomes obviousfrom the 11th century when an increase of erosion (episode 1b) co-incides with a marked increase in the density of settlements. Thepopulation of the region has been generally increasing further, whichprobably provided a basis for constant anthropogenic influence on thelandscape. This dynamic correlates well with the overall demographicboom in the south of the forest zone in the 12th–early 13th centuries(Rier, 2000).
Local colonization developed in accordance with regional pop-ulation dynamics. There are three archaeological sites near or withinthe case study area that provide a chronology of the local presenceof inhabitants. The oldest Slavic settlement in the vicinity of theSatino Experimental Station is Benitsy village on the left bank of theMezhilovka River just outside the western edge of the map in Fig. 1. Itis first mentioned inwritten sources as a local administrative centre inAD 1150, but it was founded at least a century earlier as finds from the11th century were made during archaeological excavations (Osipov,1999.). The second site is a part of the 8–10 m terrace of the ProtvaRiver 300 m south-east of gully no. 3 in Fig. 1. Slavic burial moundsfrom this site have recently been dated to the 10th–first half of the11th century AD (Bublikov et al., 2008). The mounds buried a culturallayer, which belongs to a settlement from the first half of the firstmillennium AD (Bublikov et al., 2008). The third site is Malamakhovovillage on the Isma River 1.0 km north of the northern edge of themap in Fig. 1. Here an archaeological complex was found, consistingof nine settlements dated to different periods: Late Mesolithic(seventh–sixthmillennia BC), first half–middle of the first millenniumAD, 11th–13th centuries AD and 14th–17th centuries AD (Proshkin,1992). There is, therefore, a population ‘gap’ in the last centuries of thefirst millennium AD, and signs of population activity appear again atthe transition from the 10th–11th centuries.
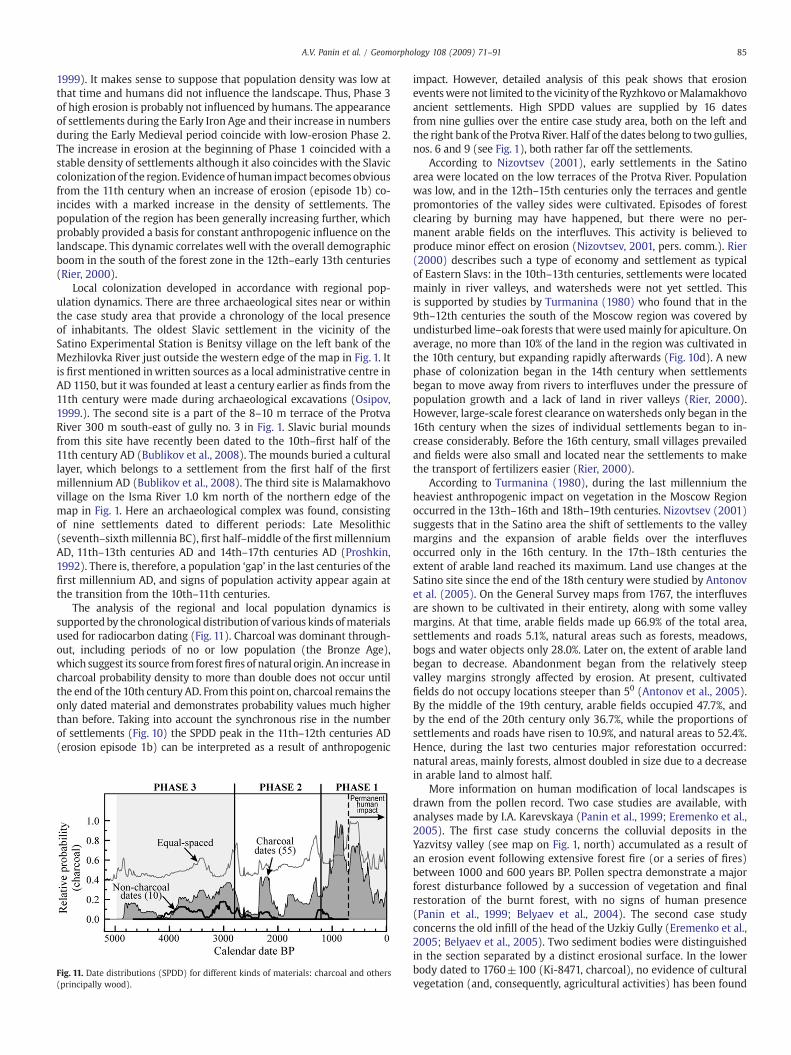
The analysis of the regional and local population dynamics issupported by the chronological distribution of various kinds ofmaterialsused for radiocarbon dating (Fig. 11). Charcoal was dominant through-out, including periods of no or low population (the Bronze Age),which suggest its source from forestfires of natural origin. An increase incharcoal probability density to more than double does not occur untilthe end of the 10th century AD. From this point on, charcoal remains theonly dated material and demonstrates probability values much higherthan before. Taking into account the synchronous rise in the numberof settlements (Fig. 10) the SPDD peak in the 11th–12th centuries AD(erosion episode 1b) can be interpreted as a result of anthropogenic
Fig. 11. Date distributions (SPDD) for different kinds of materials: charcoal and others(principally wood).
impact. However, detailed analysis of this peak shows that erosioneventswere not limited to the vicinity of the Ryzhkovo orMalamakhovoancient settlements. High SPDD values are supplied by 16 datesfrom nine gullies over the entire case study area, both on the left andthe right bank of the Protva River. Half of the dates belong to two gullies,nos. 6 and 9 (see Fig. 1), both rather far off the settlements.
According to Nizovtsev (2001), early settlements in the Satinoarea were located on the low terraces of the Protva River. Populationwas low, and in the 12th–15th centuries only the terraces and gentlepromontories of the valley sides were cultivated. Episodes of forestclearing by burning may have happened, but there were no per-manent arable fields on the interfluves. This activity is believed toproduce minor effect on erosion (Nizovtsev, 2001, pers. comm.). Rier(2000) describes such a type of economy and settlement as typicalof Eastern Slavs: in the 10th–13th centuries, settlements were locatedmainly in river valleys, and watersheds were not yet settled. Thisis supported by studies by Turmanina (1980) who found that in the9th–12th centuries the south of the Moscow region was covered byundisturbed lime–oak forests that were usedmainly for apiculture. Onaverage, no more than 10% of the land in the region was cultivated inthe 10th century, but expanding rapidly afterwards (Fig. 10d). A newphase of colonization began in the 14th century when settlementsbegan to move away from rivers to interfluves under the pressure ofpopulation growth and a lack of land in river valleys (Rier, 2000).However, large-scale forest clearance onwatersheds only began in the16th century when the sizes of individual settlements began to in-crease considerably. Before the 16th century, small villages prevailedand fields were also small and located near the settlements to makethe transport of fertilizers easier (Rier, 2000).
According to Turmanina (1980), during the last millennium theheaviest anthropogenic impact on vegetation in the Moscow Regionoccurred in the 13th–16th and 18th–19th centuries. Nizovtsev (2001)suggests that in the Satino area the shift of settlements to the valleymargins and the expansion of arable fields over the interfluvesoccurred only in the 16th century. In the 17th–18th centuries theextent of arable land reached its maximum. Land use changes at theSatino site since the end of the 18th century were studied by Antonovet al. (2005). On the General Survey maps from 1767, the interfluvesare shown to be cultivated in their entirety, along with some valleymargins. At that time, arable fields made up 66.9% of the total area,settlements and roads 5.1%, natural areas such as forests, meadows,bogs and water objects only 28.0%. Later on, the extent of arable landbegan to decrease. Abandonment began from the relatively steepvalley margins strongly affected by erosion. At present, cultivatedfields do not occupy locations steeper than 50 (Antonov et al., 2005).By the middle of the 19th century, arable fields occupied 47.7%, andby the end of the 20th century only 36.7%, while the proportions ofsettlements and roads have risen to 10.9%, and natural areas to 52.4%.Hence, during the last two centuries major reforestation occurred:natural areas, mainly forests, almost doubled in size due to a decreasein arable land to almost half.
More information on human modification of local landscapes isdrawn from the pollen record. Two case studies are available, withanalyses made by I.A. Karevskaya (Panin et al., 1999; Eremenko et al.,2005). The first case study concerns the colluvial deposits in theYazvitsy valley (see map on Fig. 1, north) accumulated as a result ofan erosion event following extensive forest fire (or a series of fires)between 1000 and 600 years BP. Pollen spectra demonstrate a majorforest disturbance followed by a succession of vegetation and finalrestoration of the burnt forest, with no signs of human presence(Panin et al., 1999; Belyaev et al., 2004). The second case studyconcerns the old infill of the head of the Uzkiy Gully (Eremenko et al.,2005; Belyaev et al., 2005). Two sediment bodies were distinguishedin the section separated by a distinct erosional surface. In the lowerbody dated to 1760±100 (Ki-8471, charcoal), no evidence of culturalvegetation (and, consequently, agricultural activities) has been found

86 A.V. Panin et al. / Geomorphology 108 (2009) 71–91
in the pollen spectra. In the upper body dated to 430±100 (Ki-8470,charcoal) and 220±100 (Ki-8469, charcoal), pollen of cereals alongwith ruderal and segetal species were found, which indicates ongoingagricultural activity.
In conclusion from the above, the older phase of high erosion, whichoccurred during the Bronze Age seems to be not related to humanactivity. Likewise, the increase in erosion in the 8th century AD, isunlikely to have anthropogenic origins as it happened during a local‘population gap’ one to two centuries before the establishment of thefirst settlements in the studyarea. Some indications of human impact onerosion are dated to the 11th century, but reliable evidence of humancauses for erosion is found only later for the 14th–early 16th century.
5.2. Climatic influence on erosion activity
For the comparison of erosion chronology with palaeoclimatedynamics, we use the palaeoclimatic data obtained in neighboringareas in the south of the forest zone. Khotinskiy (1977, 1989) com-pleted a set of palynological analyses of peat sections in the upperVolga River region at latitudes 56°–58°N. He constructed a qualitativescheme of temperature and precipitation changes in the Holocene upto the present (Fig. 12b). Klimanov and Serebryannaya (1986) made aquantitative estimate of palaeoclimatic parameters based on palyno-logical studies of four peat sections in the Srednerusskaya Upland atlatitudes 51°–54°N (Fig. 12c).
The first observation is that recognized erosion phases correlatewell with major climatic boundaries of the Middle and Late Holocene(Fig. 12). Phase 3 probably began at the Atlantic–Subboreal transitionand ended at the Subboreal–Subatlantic transition. The beginning ofPhase 1 coincideswith the onset of theMedievalWarm Period (MWP)in Europe (note that both MWP and LIA in Khotinskiy's scheme(Fig. 12b) begin much earlier than it is usually accepted for Europe:Klimanov and Serebryannaya, 1986 — see Fig. 13; Hughes and Diaz,1994; Grove, 2004). However, this correlation does not appear to be asimple one as each erosion phase covers rather contrasting climaticphases in Khotinskiy's graph. There is no exact correlation providingus with a simple model according to which erosion is favoured bywarm or cool, moist or dry climate. Short erosion episodes demon-strate even less correlation with climatic parameters. Episodes 3a and3b refer to warm temperature anomalies, episodes 1b and 3c to coldanomalies, and episode 2b corresponds to average thermal conditions.The comparison with precipitation changes shows that high erosionrates during episodes 1b, 2a and 3a occurred in a high precipitationanomaly, while the others correspond to conditions similar to thepresent.
Integral changes of water balance can be illustrated by changesof groundwater and lake levels. Diakonov and Abramova (1998)estimated changes in groundwater levels in the Meschera Lowland,100 km east of Moscow (Fig. 12d). During the Atlantic thermaloptimum 5–6 14C ka BP, the groundwater level at the studied bog wasdeep and the bog was drying repeatedly. In the second half of theHolocene, groundwater levels tended to rise, which is indicative of agenerally wetter climate. The same trend is visible from the graph oflake levels in the upper Volga River region produced by Tarasov et al.(1997) (Fig. 12e). An overlay of the erosion history shows that Phase 3of intensive erosion corresponds to a relatively less humid periodwhile Phases 2 and 1 are characterized by similar humidity thoughthey differ greatly in erosion intensity. Again, no clear correlation isfound.
A more detailed climate reconstruction for the last 2000 yearswas produced by Klimanov et al. (1995) on the basis of pollen datafrom the Polovetsko–Kupavenskiy peat bog (57°N). According to thesedata, the Medieval Warm Period (MWP) was marked in the center ofthe Russian Plain (Fig. 13). In the period 1200–1000 BP summer andwinter temperatures were 1.50–2.00 higher, and annual precipitation50 mm lower than at present, and the bog could dry up entirely.
The onset of MWP coincided with the beginning of the last phaseof intensive erosion (Phase 1) around 1200 BP. The deep and steadydecrease of precipitation in the first half of MWP seems to have beennot favourable for erosion. However, the reconstruction was made onthe basis of average precipitation, while extremes are more importantfor triggering erosion. For example, important high-magnitude erosionevents could occur due to rare but heavy rainstorms of convectionalorigin that are triggered by hot summer conditions in a generally drierclimate.
The Little Ice Age in the centre of the Russian Plain is thoughtto have occurred from the middle of the 13th century until the end ofthe 19th century, with themajor cold phase in the 17th–19th centuries(Fig. 13). Long cold winters should have promoted large snow storageand high snowmelt runoff that could have been responsible for higherosion rates. However, it is not yet possible to distinguish betweenclimatic and human impact, which had already been substantialduring the major LIA.
The above analysis shows that erosion activity can be correlatedto climate changes only at themillennial scale. Amore detailed pictureof climate dynamics fails to explain the dynamics of erosion. The firstreason for this may be the low resolution of climatic reconstructionsavailable for this region. Second, in humid climates palynological dataprovide a reliable estimate of thermal conditions, but precipitationestimates are much less reliable, as is demonstrated by Guiot et al.(1993). Moreover, erosion events are usually triggered by climaticextremes such as thunderstorms or unusually intensive snowmelt.The correlation between the probability of anomalies and averagecharacteristics of climate is not a well-studied topic in palaeogeo-graphy. The amount of water that produces erosion effects is lost forvegetation. Therefore, extreme meteorological and hydrologicalevents may be overlooked in the vegetation response and the relatedpalynological record. Still, those events are documented in geologicalrecords and fluvial topography. In this way, reconstructions of pasterosion events can contribute to the better understanding of palaeo-climatic patterns.
It has generally been assumed that anomalous climatic periodsare distinguished by more frequent occurrence of weather and hydro-logical extremes able to exceed threshold levels in fluvial systems.Active erosion episodes coincided with the climatic extremes of thesecondhalf of theHolocene: early Sub-Boreal cooling—phase 3 c— theVolchiy Gully formation; middle Sub-Boreal warming— phase 3b— re-activation of the Buiniy Gully; MWP — phase 1b (the most intensiveerosion during the last 5000 years, with possible human impact); LIA—
the Nabatov Gully formation or major re-activation. During periods ofstable climate similar to that in the middle of the 20th century, thefrequency andmagnitude of extremesmay have been relatively low anderosion systems were rather stable.
Valuable information on weather anomalies is also provided bywritten records. In Russian historical chronicles, the systematic re-cording of natural anomalies began in the last quarter of the 10thcentury (Borisenkov and Pasetskiy, 1988). Unfortunately, they do notcover the entire duration of the modern phase of intensive erosion(Phase 1). Hence, that information cannot be used to discover thecause of the transition from a relatively stable state of gully systems tothe beginning of active erosion at around 1200 BP. However, the MWPand LIA that may possibly serve as analogues of preceding warmand cold epochs in terms of extreme event occurrence are coveredby chronicle data. Krenke and Chernavskaya (1995) counted relativefrequencies of extreme events mentioned in chronicles of the MoscowRegion during the MWP and LIA. Severe winters, intensive summerrainstorms and high spring floods were, respectively, 2.8, 1.7 and 2.9times more frequent in the LIA than in the MWP, whereas rainfall-induced floods, storms and thunderstorms were 1.5, 2.7 and 1.6 timesmore frequent in the MWP than in the LIA (Fig. 14). According tothe authors, some types of weather anomalies showa high correlation,i.e. a high probability of joint occurrence in the same year: these are

Fig.12. Erosion chronology in the Satino case study area (a) compared to climatic changes in the center of the East European Plain in the second half of the Holocene; (b) temperatureand annual precipitation in the Upper Volga River region: deviation from the present (Khotinskiy, 1989); (c) seasonal and annual temperature and annual precipitation in the TulaRegion: deviation from the present (Klimanov and Serebryannaya, 1986); (d) ground water level in the Meschera Lowland (Diakonov and Abramova, 1998); (e) lake levels in theUpper Volga River region (Tarasov et al., 1997).
87A.V. Panin et al. / Geomorphology 108 (2009) 71–91
severe winters and high spring floods. In this case, the correlation isbased on causal relations: a long winter without thaws provides largesnow storage.
The chronological variation of the frequency ratio of various typesof climatic extremes explained above makes it possible to suggest thatduring periods of warm climatic anomalies, such as the MWP, rainfallerosion dominated over snowmelt erosion. By contrast, during cold
anomalies such as the LIA snowmelt erosion was probably predomi-nant. Consequently, the ratio of snowmelt to rainfall erosion is likelyto have been variable in the past. The key point is that differentkinds of erosion can play specific roles in new gully formation or inmaintaining the growth of existing gullies, as has been established bydirect gully monitoring at present. For example, Rysin (1998) foundthat in Udmurtia (East European Russia) rain-induced growth of
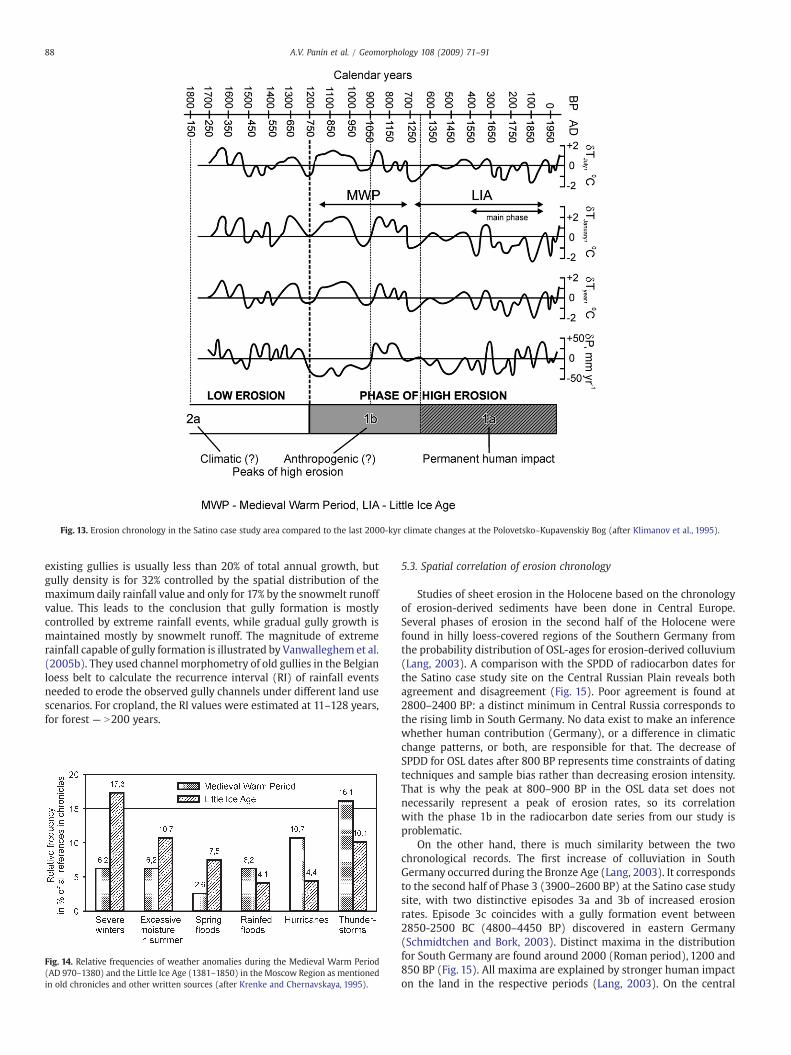
Fig. 13. Erosion chronology in the Satino case study area compared to the last 2000-kyr climate changes at the Polovetsko–Kupavenskiy Bog (after Klimanov et al., 1995).
88 A.V. Panin et al. / Geomorphology 108 (2009) 71–91
existing gullies is usually less than 20% of total annual growth, butgully density is for 32% controlled by the spatial distribution of themaximum daily rainfall value and only for 17% by the snowmelt runoffvalue. This leads to the conclusion that gully formation is mostlycontrolled by extreme rainfall events, while gradual gully growth ismaintained mostly by snowmelt runoff. The magnitude of extremerainfall capable of gully formation is illustrated by Vanwalleghem et al.(2005b). They used channel morphometry of old gullies in the Belgianloess belt to calculate the recurrence interval (RI) of rainfall eventsneeded to erode the observed gully channels under different land usescenarios. For cropland, the RI values were estimated at 11–128 years,for forest — N200 years.
Fig. 14. Relative frequencies of weather anomalies during the Medieval Warm Period(AD 970–1380) and the Little Ice Age (1381–1850) in the Moscow Region as mentionedin old chronicles and other written sources (after Krenke and Chernavskaya, 1995).
5.3. Spatial correlation of erosion chronology
Studies of sheet erosion in the Holocene based on the chronologyof erosion-derived sediments have been done in Central Europe.Several phases of erosion in the second half of the Holocene werefound in hilly loess-covered regions of the Southern Germany fromthe probability distribution of OSL-ages for erosion-derived colluvium(Lang, 2003). A comparison with the SPDD of radiocarbon dates forthe Satino case study site on the Central Russian Plain reveals bothagreement and disagreement (Fig. 15). Poor agreement is found at2800–2400 BP: a distinct minimum in Central Russia corresponds tothe rising limb in South Germany. No data exist to make an inferencewhether human contribution (Germany), or a difference in climaticchange patterns, or both, are responsible for that. The decrease ofSPDD for OSL dates after 800 BP represents time constraints of datingtechniques and sample bias rather than decreasing erosion intensity.That is why the peak at 800–900 BP in the OSL data set does notnecessarily represent a peak of erosion rates, so its correlationwith the phase 1b in the radiocarbon date series from our study isproblematic.
On the other hand, there is much similarity between the twochronological records. The first increase of colluviation in SouthGermany occurred during the Bronze Age (Lang, 2003). It correspondsto the second half of Phase 3 (3900–2600 BP) at the Satino case studysite, with two distinctive episodes 3a and 3b of increased erosionrates. Episode 3c coincides with a gully formation event between2850-2500 BC (4800–4450 BP) discovered in eastern Germany(Schmidtchen and Bork, 2003). Distinct maxima in the distributionfor South Germany are found around 2000 (Roman period), 1200 and850 BP (Fig. 15). All maxima are explained by stronger human impacton the land in the respective periods (Lang, 2003). On the central
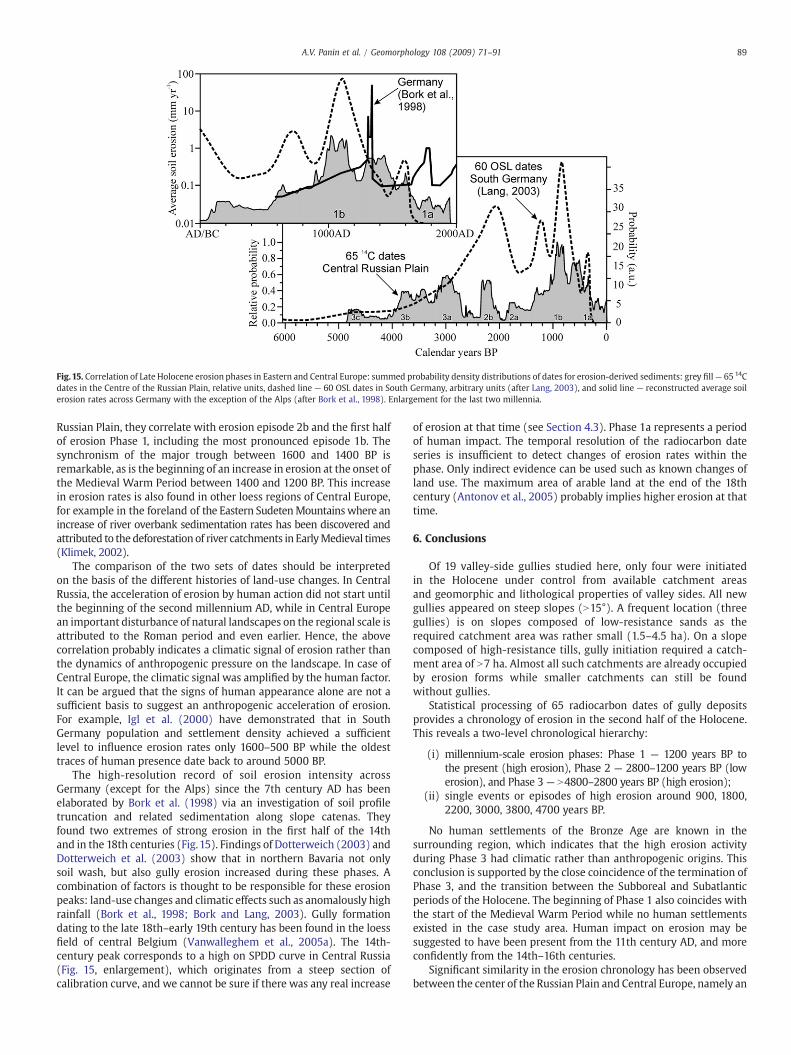
Fig.15. Correlation of Late Holocene erosion phases in Eastern and Central Europe: summed probability density distributions of dates for erosion-derived sediments: grey fill— 65 14Cdates in the Centre of the Russian Plain, relative units, dashed line — 60 OSL dates in South Germany, arbitrary units (after Lang, 2003), and solid line — reconstructed average soilerosion rates across Germany with the exception of the Alps (after Bork et al., 1998). Enlargement for the last two millennia.
89A.V. Panin et al. / Geomorphology 108 (2009) 71–91
Russian Plain, they correlate with erosion episode 2b and the first halfof erosion Phase 1, including the most pronounced episode 1b. Thesynchronism of the major trough between 1600 and 1400 BP isremarkable, as is the beginning of an increase in erosion at the onset ofthe Medieval Warm Period between 1400 and 1200 BP. This increasein erosion rates is also found in other loess regions of Central Europe,for example in the foreland of the Eastern SudetenMountainswhere anincrease of river overbank sedimentation rates has been discovered andattributed to the deforestation of river catchments in EarlyMedieval times(Klimek, 2002).
The comparison of the two sets of dates should be interpretedon the basis of the different histories of land-use changes. In CentralRussia, the acceleration of erosion by human action did not start untilthe beginning of the second millennium AD, while in Central European important disturbance of natural landscapes on the regional scale isattributed to the Roman period and even earlier. Hence, the abovecorrelation probably indicates a climatic signal of erosion rather thanthe dynamics of anthropogenic pressure on the landscape. In case ofCentral Europe, the climatic signal was amplified by the human factor.It can be argued that the signs of human appearance alone are not asufficient basis to suggest an anthropogenic acceleration of erosion.For example, Igl et al. (2000) have demonstrated that in SouthGermany population and settlement density achieved a sufficientlevel to influence erosion rates only 1600–500 BP while the oldesttraces of human presence date back to around 5000 BP.
The high-resolution record of soil erosion intensity acrossGermany (except for the Alps) since the 7th century AD has beenelaborated by Bork et al. (1998) via an investigation of soil profiletruncation and related sedimentation along slope catenas. Theyfound two extremes of strong erosion in the first half of the 14thand in the 18th centuries (Fig.15). Findings of Dotterweich (2003) andDotterweich et al. (2003) show that in northern Bavaria not onlysoil wash, but also gully erosion increased during these phases. Acombination of factors is thought to be responsible for these erosionpeaks: land-use changes and climatic effects such as anomalously highrainfall (Bork et al., 1998; Bork and Lang, 2003). Gully formationdating to the late 18th–early 19th century has been found in the loessfield of central Belgium (Vanwalleghem et al., 2005a). The 14th-century peak corresponds to a high on SPDD curve in Central Russia(Fig. 15, enlargement), which originates from a steep section ofcalibration curve, and we cannot be sure if there was any real increase
of erosion at that time (see Section 4.3). Phase 1a represents a periodof human impact. The temporal resolution of the radiocarbon dateseries is insufficient to detect changes of erosion rates within thephase. Only indirect evidence can be used such as known changes ofland use. The maximum area of arable land at the end of the 18thcentury (Antonov et al., 2005) probably implies higher erosion at thattime.
6. Conclusions
Of 19 valley-side gullies studied here, only four were initiatedin the Holocene under control from available catchment areasand geomorphic and lithological properties of valley sides. All newgullies appeared on steep slopes (N15°). A frequent location (threegullies) is on slopes composed of low-resistance sands as therequired catchment area was rather small (1.5–4.5 ha). On a slopecomposed of high-resistance tills, gully initiation required a catch-ment area of N7 ha. Almost all such catchments are already occupiedby erosion forms while smaller catchments can still be foundwithout gullies.
Statistical processing of 65 radiocarbon dates of gully depositsprovides a chronology of erosion in the second half of the Holocene.This reveals a two-level chronological hierarchy:
(i) millennium-scale erosion phases: Phase 1 — 1200 years BP tothe present (high erosion), Phase 2 — 2800–1200 years BP (lowerosion), and Phase 3 — N4800–2800 years BP (high erosion);
(ii) single events or episodes of high erosion around 900, 1800,2200, 3000, 3800, 4700 years BP.
No human settlements of the Bronze Age are known in thesurrounding region, which indicates that the high erosion activityduring Phase 3 had climatic rather than anthropogenic origins. Thisconclusion is supported by the close coincidence of the termination ofPhase 3, and the transition between the Subboreal and Subatlanticperiods of the Holocene. The beginning of Phase 1 also coincides withthe start of the Medieval Warm Period while no human settlementsexisted in the case study area. Human impact on erosion may besuggested to have been present from the 11th century AD, and moreconfidently from the 14th–16th centuries.
Significant similarity in the erosion chronology has been observedbetween the center of the Russian Plain and Central Europe, namely an
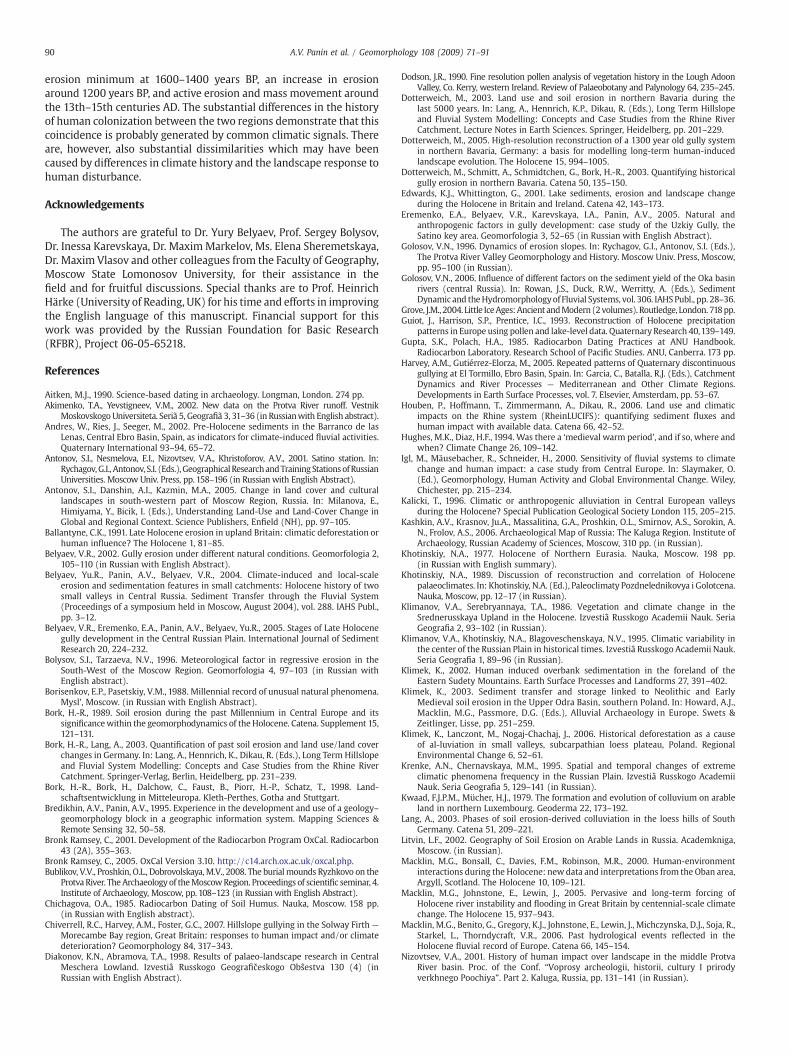
90 A.V. Panin et al. / Geomorphology 108 (2009) 71–91
erosion minimum at 1600–1400 years BP, an increase in erosionaround 1200 years BP, and active erosion and mass movement aroundthe 13th–15th centuries AD. The substantial differences in the historyof human colonization between the two regions demonstrate that thiscoincidence is probably generated by common climatic signals. Thereare, however, also substantial dissimilarities which may have beencaused by differences in climate history and the landscape response tohuman disturbance.
Acknowledgements
The authors are grateful to Dr. Yury Belyaev, Prof. Sergey Bolysov,Dr. Inessa Karevskaya, Dr. MaximMarkelov, Ms. Elena Sheremetskaya,Dr. Maxim Vlasov and other colleagues from the Faculty of Geography,Moscow State Lomonosov University, for their assistance in thefield and for fruitful discussions. Special thanks are to Prof. HeinrichHärke (University of Reading, UK) for his time and efforts in improvingthe English language of this manuscript. Financial support for thiswork was provided by the Russian Foundation for Basic Research(RFBR), Project 06-05-65218.
References
Aitken, M.J., 1990. Science-based dating in archaeology. Longman, London. 274 pp.Akimenko, T.A., Yevstigneev, V.M., 2002. New data on the Protva River runoff. Vestnik
MoskovskogoUniversiteta. Seriã 5, Geografiã 3, 31–36 (in Russianwith English abstract).Andres, W., Ries, J., Seeger, M., 2002. Pre-Holocene sediments in the Barranco de las
Lenas, Central Ebro Basin, Spain, as indicators for climate-induced fluvial activities.Quaternary International 93–94, 65–72.
Antonov, S.I., Nesmelova, E.I., Nizovtsev, V.A., Khristoforov, A.V., 2001. Satino station. In:Rychagov,G.I., Antonov, S.I. (Eds.),GeographicalResearchandTrainingStationsofRussianUniversities. Moscow Univ. Press, pp. 158–196 (in Russian with English Abstract).
Antonov, S.I., Danshin, A.I., Kazmin, M.A., 2005. Change in land cover and culturallandscapes in south-western part of Moscow Region, Russia. In: Milanova, E.,Himiyama, Y., Bicik, I. (Eds.), Understanding Land-Use and Land-Cover Change inGlobal and Regional Context. Science Publishers, Enfield (NH), pp. 97–105.
Ballantyne, C.K., 1991. Late Holocene erosion in upland Britain: climatic deforestation orhuman influence? The Holocene 1, 81–85.
Belyaev, V.R., 2002. Gully erosion under different natural conditions. Geomorfologia 2,105–110 (in Russian with English Abstract).
Belyaev, Yu.R., Panin, A.V., Belyaev, V.R., 2004. Climate-induced and local-scaleerosion and sedimentation features in small catchments: Holocene history of twosmall valleys in Central Russia. Sediment Transfer through the Fluvial System(Proceedings of a symposium held in Moscow, August 2004), vol. 288. IAHS Publ.,pp. 3–12.
Belyaev, V.R., Eremenko, E.A., Panin, A.V., Belyaev, Yu.R., 2005. Stages of Late Holocenegully development in the Central Russian Plain. International Journal of SedimentResearch 20, 224–232.
Bolysov, S.I., Tarzaeva, N.V., 1996. Meteorological factor in regressive erosion in theSouth-West of the Moscow Region. Geomorfologia 4, 97–103 (in Russian withEnglish abstract).
Borisenkov, E.P., Pasetskiy, V.M., 1988. Millennial record of unusual natural phenomena.Mysl', Moscow. (in Russian with English Abstract).
Bork, H.-R., 1989. Soil erosion during the past Millennium in Central Europe and itssignificancewithin the geomorphodynamics of the Holocene. Catena. Supplement 15,121–131.
Bork, H.-R., Lang, A., 2003. Quantification of past soil erosion and land use/land coverchanges in Germany. In: Lang, A., Hennrich, K., Dikau, R. (Eds.), Long Term Hillslopeand Fluvial System Modelling: Concepts and Case Studies from the Rhine RiverCatchment. Springer-Verlag, Berlin, Heidelberg, pp. 231–239.
Bork, H.-R., Bork, H., Dalchow, C., Faust, B., Piorr, H.-P., Schatz, T., 1998. Land-schaftsentwicklung in Mitteleuropa. Kleth-Perthes, Gotha and Stuttgart.
Bredikhin, A.V., Panin, A.V., 1995. Experience in the development and use of a geology–geomorphology block in a geographic information system. Mapping Sciences &Remote Sensing 32, 50–58.
Bronk Ramsey, C., 2001. Development of the Radiocarbon Program OxCal. Radiocarbon43 (2A), 355–363.
Bronk Ramsey, C., 2005. OxCal Version 3.10. http://c14.arch.ox.ac.uk/oxcal.php.Bublikov, V.V., Proshkin, O.L., Dobrovolskaya,M.V., 2008. The burialmounds Ryzhkovo on the
ProtvaRiver. TheArchaeologyof theMoscowRegion. Proceedings of scientific seminar, 4.Institute of Archaeology, Moscow, pp. 108–123 (in Russian with English Abstract).
Chichagova, O.A., 1985. Radiocarbon Dating of Soil Humus. Nauka, Moscow. 158 pp.(in Russian with English abstract).
Chiverrell, R.C., Harvey, A.M., Foster, G.C., 2007. Hillslope gullying in the Solway Firth —Morecambe Bay region, Great Britain: responses to human impact and/or climatedeterioration? Geomorphology 84, 317–343.
Diakonov, K.N., Abramova, T.A., 1998. Results of palaeo-landscape research in CentralMeschera Lowland. Izvestiâ Russkogo Geografičeskogo Obŝestva 130 (4) (inRussian with English Abstract).
Dodson, J.R., 1990. Fine resolution pollen analysis of vegetation history in the Lough AdoonValley, Co. Kerry, western Ireland. Review of Palaeobotany and Palynology 64, 235–245.
Dotterweich, M., 2003. Land use and soil erosion in northern Bavaria during thelast 5000 years. In: Lang, A., Hennrich, K.P., Dikau, R. (Eds.), Long Term Hillslopeand Fluvial System Modelling: Concepts and Case Studies from the Rhine RiverCatchment, Lecture Notes in Earth Sciences. Springer, Heidelberg, pp. 201–229.
Dotterweich, M., 2005. High-resolution reconstruction of a 1300 year old gully systemin northern Bavaria, Germany: a basis for modelling long-term human-inducedlandscape evolution. The Holocene 15, 994–1005.
Dotterweich, M., Schmitt, A., Schmidtchen, G., Bork, H.-R., 2003. Quantifying historicalgully erosion in northern Bavaria. Catena 50, 135–150.
Edwards, K.J., Whittington, G., 2001. Lake sediments, erosion and landscape changeduring the Holocene in Britain and Ireland. Catena 42, 143–173.
Eremenko, E.A., Belyaev, V.R., Karevskaya, I.A., Panin, A.V., 2005. Natural andanthropogenic factors in gully development: case study of the Uzkiy Gully, theSatino key area. Geomorfologia 3, 52–65 (in Russian with English Abstract).
Golosov, V.N., 1996. Dynamics of erosion slopes. In: Rychagov, G.I., Antonov, S.I. (Eds.),The Protva River Valley Geomorphology and History. Moscow Univ. Press, Moscow,pp. 95–100 (in Russian).
Golosov, V.N., 2006. Influence of different factors on the sediment yield of the Oka basinrivers (central Russia). In: Rowan, J.S., Duck, R.W., Werritty, A. (Eds.), SedimentDynamic and theHydromorphologyof Fluvial Systems, vol. 306. IAHSPubl., pp. 28–36.
Grove, J.M., 2004. Little IceAges:AncientandModern(2volumes).Routledge, London.718pp.Guiot, J., Harrison, S.P., Prentice, I.C., 1993. Reconstruction of Holocene precipitation
patterns in Europe using pollen and lake-level data. Quaternary Research 40,139–149.Gupta, S.K., Polach, H.A., 1985. Radiocarbon Dating Practices at ANU Handbook.
Radiocarbon Laboratory. Research School of Pacific Studies. ANU, Canberra. 173 pp.Harvey, A.M., Gutiérrez-Elorza, M., 2005. Repeated patterns of Quaternary discontinuous
gullying at El Tormillo, Ebro Basin, Spain. In: Garcia, C., Batalla, R.J. (Eds.), CatchmentDynamics and River Processes — Mediterranean and Other Climate Regions.Developments in Earth Surface Processes, vol. 7. Elsevier, Amsterdam, pp. 53–67.
Houben, P., Hoffmann, T., Zimmermann, A., Dikau, R., 2006. Land use and climaticimpacts on the Rhine system (RheinLUCIFS): quantifying sediment fluxes andhuman impact with available data. Catena 66, 42–52.
Hughes, M.K., Diaz, H.F., 1994. Was there a ‘medieval warm period’, and if so, where andwhen? Climate Change 26, 109–142.
Igl, M., Mäusebacher, R., Schneider, H., 2000. Sensitivity of fluvial systems to climatechange and human impact: a case study from Central Europe. In: Slaymaker, O.(Ed.), Geomorphology, Human Activity and Global Environmental Change. Wiley,Chichester, pp. 215–234.
Kalicki, T., 1996. Climatic or anthropogenic alluviation in Central European valleysduring the Holocene? Special Publication Geological Society London 115, 205–215.
Kashkin, A.V., Krasnov, Ju.A., Massalitina, G.A., Proshkin, O.L., Smirnov, A.S., Sorokin, A.N., Frolov, A.S., 2006. Archaeological Map of Russia: The Kaluga Region. Institute ofArchaeology, Russian Academy of Sciences, Moscow, 310 pp. (in Russian).
Khotinskiy, N.A., 1977. Holocene of Northern Eurasia. Nauka, Moscow. 198 pp.(in Russian with English summary).
Khotinskiy, N.A., 1989. Discussion of reconstruction and correlation of Holocenepalaeoclimates. In: Khotinskiy, N.A. (Ed.), Paleoclimaty Pozdnelednikovya i Golotcena.Nauka, Moscow, pp. 12–17 (in Russian).
Klimanov, V.A., Serebryannaya, T.A., 1986. Vegetation and climate change in theSrednerusskaya Upland in the Holocene. Izvestiâ Russkogo Academii Nauk. SeriaGeografia 2, 93–102 (in Russian).
Klimanov, V.A., Khotinskiy, N.A., Blagoveschenskaya, N.V., 1995. Climatic variability inthe center of the Russian Plain in historical times. Izvestiâ Russkogo Academii Nauk.Seria Geografia 1, 89–96 (in Russian).
Klimek, K., 2002. Human induced overbank sedimentation in the foreland of theEastern Sudety Mountains. Earth Surface Processes and Landforms 27, 391–402.
Klimek, K., 2003. Sediment transfer and storage linked to Neolithic and EarlyMedieval soil erosion in the Upper Odra Basin, southern Poland. In: Howard, A.J.,Macklin, M.G., Passmore, D.G. (Eds.), Alluvial Archaeology in Europe. Swets &Zeitlinger, Lisse, pp. 251–259.
Klimek, K., Lanczont, M., Nogaj-Chachaj, J., 2006. Historical deforestation as a causeof al-luviation in small valleys, subcarpathian loess plateau, Poland. RegionalEnvironmental Change 6, 52–61.
Krenke, A.N., Chernavskaya, M.M., 1995. Spatial and temporal changes of extremeclimatic phenomena frequency in the Russian Plain. Izvestiâ Russkogo AcademiiNauk. Seria Geografia 5, 129–141 (in Russian).
Kwaad, F.J.P.M., Mücher, H.J., 1979. The formation and evolution of colluvium on arableland in northern Luxembourg. Geoderma 22, 173–192.
Lang, A., 2003. Phases of soil erosion-derived colluviation in the loess hills of SouthGermany. Catena 51, 209–221.
Litvin, L.F., 2002. Geography of Soil Erosion on Arable Lands in Russia. Academkniga,Moscow. (in Russian).
Macklin, M.G., Bonsall, C., Davies, F.M., Robinson, M.R., 2000. Human-environmentinteractions during the Holocene: new data and interpretations from the Oban area,Argyll, Scotland. The Holocene 10, 109–121.
Macklin, M.G., Johnstone, E., Lewin, J., 2005. Pervasive and long-term forcing ofHolocene river instability and flooding in Great Britain by centennial-scale climatechange. The Holocene 15, 937–943.
Macklin, M.G., Benito, G., Gregory, K.J., Johnstone, E., Lewin, J., Michczynska, D.J., Soja, R.,Starkel, L., Thorndycraft, V.R., 2006. Past hydrological events reflected in theHolocene fluvial record of Europe. Catena 66, 145–154.
Nizovtsev, V.A., 2001. History of human impact over landscape in the middle ProtvaRiver basin. Proc. of the Conf. “Voprosy archeologii, historii, cultury I prirodyverkhnego Poochiya”. Part 2. Kaluga, Russia, pp. 131–141 (in Russian).

91A.V. Panin et al. / Geomorphology 108 (2009) 71–91
Nogueras, P., Burjachs, F., Gallart, F., Puigdefàbregas, J., 2000. Recent gully erosion in theEl Cautivo badlands (Tabernas, SE Spain). Catena 40, 203–215.
Osipov, V.I., 1999. The Borovsk Land in Russian History. Part 1. The Borovsk Landsince Ancient Times Till the End of the XVII Century. Borovsk Historical Museum,Borovsk. 116 pp. (in Russian).
Panin, A.V., 2000. Lateglacial and Holocene development of a gravel-bed river (the ProtvaRiver, Central Russia). Proc. 4th Int. Conf. on Global Continental PalaeohydrologyGLOCOPH-2000. Moscow, Russia, pp. 52–54.
Panin, A.V., Karevskaya, I.A., 2000. Floodplain development history in the Protva Riverat the Satino key area. Vestnik Moskovskogo Universiteta. Seriã 5, Geografiã 4,55–62 (in Russian with English Abstract).
Panin, A.V., Karevskaya, I.A., Markelov, M.V., 1999. Evolution of the Yazvitsy Valley in theProtva River basin in the second half of the Holocene. Vestnik MoskovskogoUniversiteta. Seriã 5, Geografiã 2, 63–72 (in Russian with English Abstract).
Proshkin, O.L., 1992. Archaeological complex at the Malamakhovo village. BorovskRegional Studies. Borovsk Historical Museum, Borovsk, 4, pp. 7–12 (in Russian).
Reimer, P.J., Baillie, M.G.L., Bard, E., Bayliss, A., Beck, J.W., Bertrand, C., Blackwell, P.G.,Buck, C.E., Burr, G., Cutler, K.B., Damon, P.E., Edwards, R.L., Fairbanks, R.G., Friedrich,M., Guilderson, T.P., Hughen, K.A., Kromer, B., McCormac, F.G., Manning, S.,Bronk Ramsey, C., Reimer, R.W., Remmele, S., Southon, J.R., Stuiver, M., Talamo, S.,Taylor, F.W., van der Plicht, J., Weyhenmeyer, C.E., 2004. IntCal04 terrestrialradiocarbon age calibration, 0–26 Cal Kyr BP. Radiocarbon 46, 1029–1058.
Rier, J.G., 2000. AgrarianWorld of Eastern and Central Europe in Middle Ages Accordingto Archaeological Data. Mogilev State University, Belorussia. 264 pp. (in Russian).
Rychagov, G.I., 2006. General Geomorphology. 3rd edition. Moscow University & NaukaPubl. (in Russian).
Rysin, I.I., 1998. Gully Erosion in Udmurtia. University of Udmurtia Publ., Izhevsk.(in Russian).
Schmidtchen, G., Bork, H.-R., 2003. . Changing human impact during the period ofagriculture in Central Europe: the case study Biesdorfer Kehlen, Brandenburg. In:Lang, A., Hennrich, K., Dikau, R. (Eds.), Long Term Hillslope and Fluvial SystemModelling: Concepts and Case Studies from the Rhine River Catchment. Springer-Verlag, Berlin, Heidelberg, pp. 183–200.
Schmitt, A., Dotterweich, M., Schmidtchen, G., Bork, H.-R., 2003. Vineyards, hopgardensand recent afforestation: effects of late Holocene land use change on soil erosion innorthern Bavaria, Germany. Catena 51, 241–254.
Schmitt, A., Rodzik, J., Zgłobicki, W., Russok, C., Dotterweich, M., Bork, H.-R., 2006. Timeand scale of gully erosion in the Jedliczny Dol gully system, south-east Poland.Catena 68, 124–132.
Simonov, J.G., Panin, A.V., Ulianov, V.A., 1996. Study of topographical inheritance on thebasis of GIS. Geomorfologia 27 (4), 74–81 (in Russian with Englisn abstract).
Smolska, E., 2007. Development of gullies and sediment fans in last-glacial areas on theexample of the Suwałki Lakeland (NE Poland). Catena 71, 122–131.
Starkel, L., 2005. Anthropogenic soil erosion since the Neolithic in Poland. Zeitschrift fürGeomorphologie. Supplementband 139, 189–201.
Starkel, L., Soja, R., Michczynska, D.J., 2006. Past hydrological events reflected inHolocene history of Polish rivers. Catena 66, 24–33.
Stuiver, M., Polach, H.A., 1977. Discussion: reporting of 14C data. Radiocarbon 19, 355–363.Sycheva, S.A., 2006. Long-term pedolithogenic rhythms in the Holocene. Quaternary
International 152–153, 181–191.Tarasov, P.E., Gunova, V.S., Uspenskaya, O.N., 1997. Lake levels of the Volga river basin as
indicators of the Holocene climate changes. Vestnik Moskovskogo Universiteta.Seriã 5, Geografiã 3 36–41 (in Russian with English Abstract).
Turmanina, V.I., 1980. Influence of land use and climate change on vegetation in theMoscow Region during the last millennium. Voprosy Geografii, 114. Mysl', Moscow,pp. 34–44 (in Russian).
Valentin, C., Poesen, J., Li, Y., 2005. Gully erosion: impacts, factors and control. Catena 63,132–153.
Vanwalleghem, T., Bork,H.-R., Poesen, J., Schmidtchen,G., Dotterweich,M.,Nachtergaele, J.,Bork, H., Deckers, J., Brüsch, B., Bungeneers, J., De Bie, M., 2005a. Rapid developmentand infilling of a buried gully under cropland, central Belgium. Catena 63, 221–243.
Vanwalleghem, T., Poesen, J., Van Den Eeckhaut, M., Nachtergaele, J., Deckers, J., 2005b.Reconstructing rainfall and land-use conditions leading to the development of oldgullies. The Holocene 15, 378–386.
Vanwalleghem, T., Bork, H.R., Poesen, J., Dotterweich, M., Schmidtchen, G., Deckers, J.,Scheers, S., Martens, M., 2006. Prehistoric and Roman gullying in the Europeanloess belt: a case study from central Belgium. The Holocene 16, 393–401.
Vlasov, M.V., 2005. Holocene river morphodynamics in the center of the Russian Plain.Unpubl. PhD Thesis. Faculty of Geography, Moscow State University (in Russian).
Zielhofer, C., Faust, D., Linstädter, J., 2008. Late Pleistocene and Holocene alluvialarchives in the Southwestern Mediterranean: changes in fluvial dynamics and pasthuman response. Quaternary International 181, 39–54.
Zolitschka, B., Behre, K.-E., Schneider, J., 2003. Human and climatic impact on theenvironment as derived from colluvial, fluvial and lacustrine archives — examplesfrom theBronze Age to theMigrationperiod, Germany. Quaternary Science Reviews 22,81–100.
Zorina, E.F., 2003. Gully Erosion: Development Patterns and Potential. GEOS, Moscow.(in Russian).
Zygmunt, E., 2004. Archaeological and radiocarbon dating of alluvial fans as an indicatorof prehistoric colonisation of the Glubczyce Plateau (Southwestern Poland).Geochronometria 23, 101–107.