Long Term Culvert Replacement Training Project
92
Long Term Culvert Replacement Training Project for Ashfield, Massachusetts Baptist Corner Road Unnamed Tributary to Bear River June 2016 Prepared For: Division of Ecological Restoration Massachusetts Department of Fish and Game 251 Causeway Street Boston, MA 02114 Prepared By: Comprehensive Environmental Inc. 225 Cedar Hill Street Marlborough, Massachusetts 01752
Transcript of Long Term Culvert Replacement Training Project

Long Term Culvert Replacement Training Project
for
Ashfield, Massachusetts Baptist Corner Road
Unnamed Tributary to Bear River
June 2016
Prepared For: Division of Ecological Restoration
Massachusetts Department of Fish and Game 251 Causeway Street
Boston, MA 02114
Prepared By: Comprehensive Environmental Inc.
225 Cedar Hill Street Marlborough, Massachusetts 01752

Ashfield, MA – Baptist Corner Road DER – Technical Report
Long Term Culvert Replacement Training Project
Table of Contents
1.0 Introduction ........................................................................................................................1 2.0 Site Reconnaissance ...........................................................................................................1
3.0 Geotechnical Evaluation ....................................................................................................2
3.1 Subsurface Evaluation .............................................................................................2 3.2 Foundation System Alternatives ..............................................................................3 3.3 Geotechnical Evaluation/Soil Properties .................................................................4
3.4 Soil Parameters for Foundation Design ...................................................................5 3.5 Geotechnical Design Parameters .............................................................................5 3.6 Seismic Considerations ............................................................................................7
3.7 Construction Considerations ....................................................................................8 4.0 Hydrologic and Hydraulic Evaluation .............................................................................8
4.1 Hydrologic Study .....................................................................................................8 4.2 Hydraulic Study .......................................................................................................9 4.3 Construction Considerations ..................................................................................10
5.0 Structure Type Evaluation ..............................................................................................10
5.1 Cost Considerations ...............................................................................................11 5.2 Site Considerations ................................................................................................11 5.3 Hydraulic Considerations.......................................................................................13
5.4 Geotechnical Considerations .................................................................................14 5.5 Alternatives Analysis .............................................................................................15 5.5.1 Concrete Box Culvert ...................................................................................15 5.5.2 Concrete Arch Culvert ..................................................................................16 5.5.3 Metal Arch Culvert .......................................................................................17 5.5.4 Steel Stringer Bridge .....................................................................................18 5.6 Structure Type Selection ........................................................................................18

Ashfield, MA – Baptist Corner Road DER – Technical Report
List of Tables Table 4.1 – 10-Year Storm Event Hydraulic Summary ...................................................................9 Table 5.1 – Typical Cost Summary ...............................................................................................11 Table 5.2 – VAP Adjustment Factors ............................................................................................15 List of Figures Figure 1 – Project Locus Map ..................................................................................... End of Report Attachments Appendix A - Stream Plan View, Longitudinal Profile, and Cross-Sections Appendix B - Pebble Count Appendix C - Site Photographs Appendix D - Soil Boring Logs Appendix E - Soil Laboratory Test Results Appendix F - Hydrologic Computations Appendix G - Hydraulic Computations Appendix H - VAP Calculation
Ashfield, MA – Baptist Corner Road DER – Technical Report
Page 1 of 18
DER - Long Term Culvert Replacement Training Project Ashfield, MA – Baptist Corner Road
1. Introduction
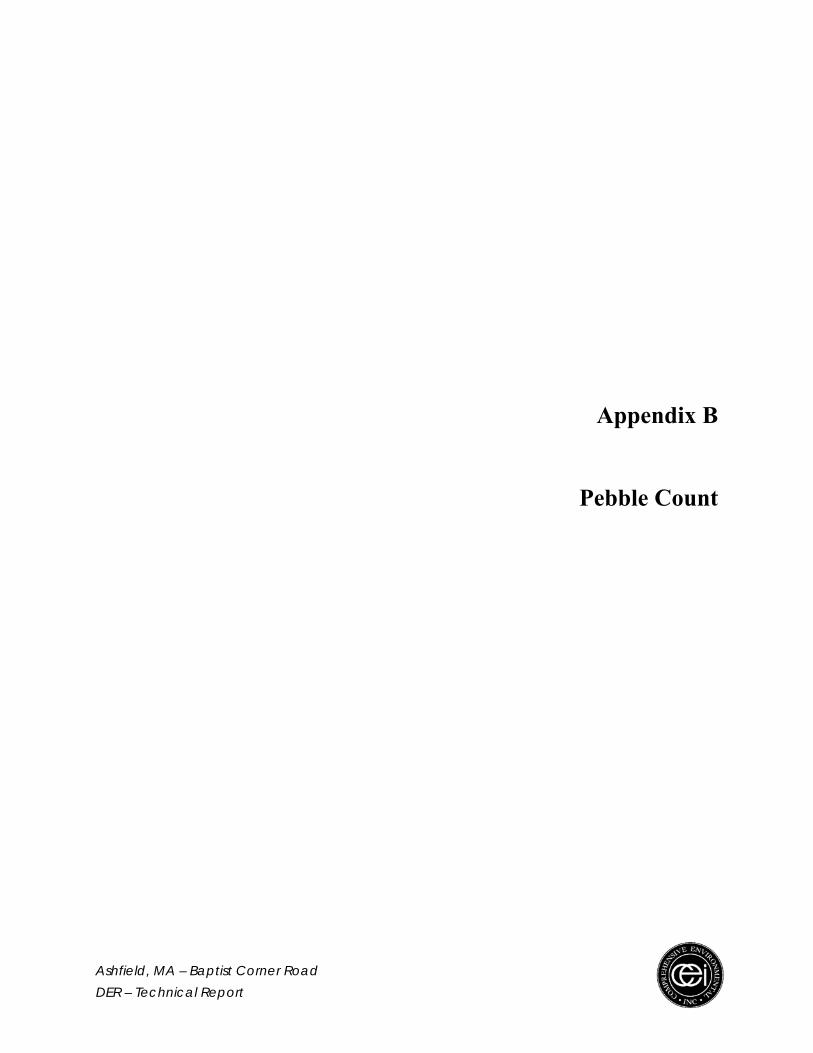
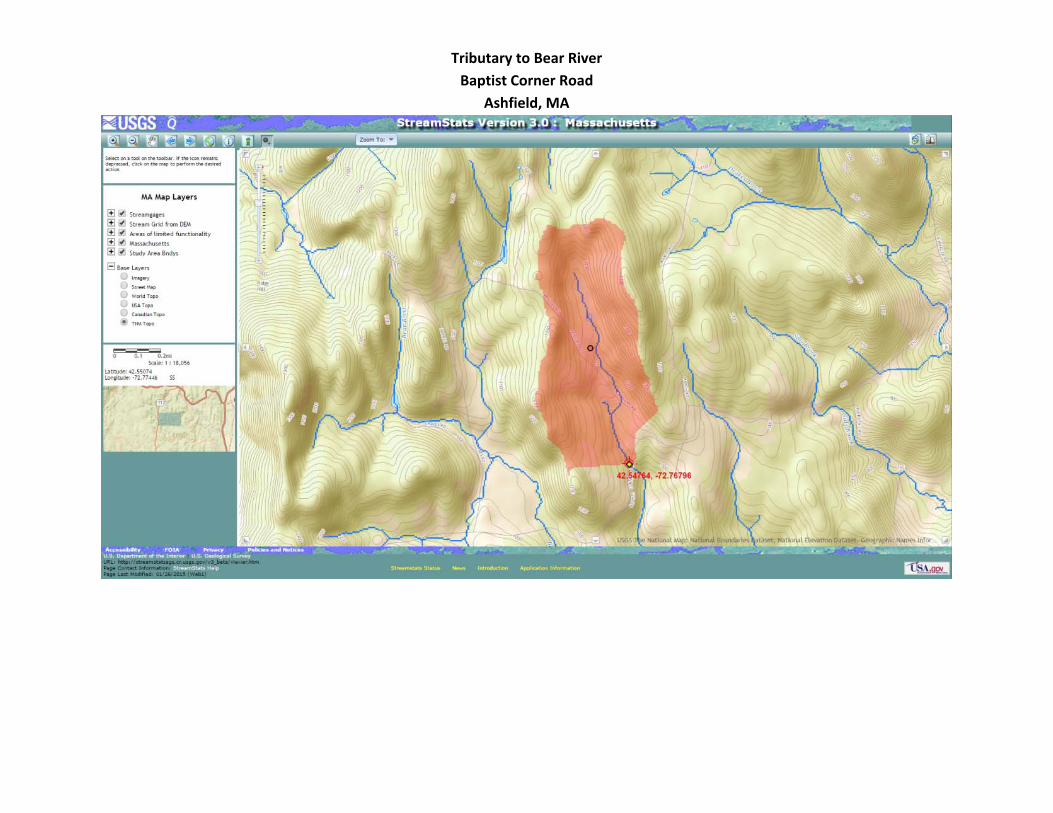
The culvert replacement project site is located in Ashfield, MA on Baptist Corner Road. This crossing is within the Deerfield River watershed in the northeast corner of town on an unnamed tributary to Bear River. The project site is approximately one quarter mile southwest of Phillips Road on Baptist Corner Road. A project locus map is attached as Figure 1. The stream flows through thick wooded areas both upstream and downstream of the crossing. The stream flows within a defined channel through the wooded area with relatively high entrenchment in the immediate vicinity of the roadway-stream crossing. Much of the existing stream is influenced by large woody debris within the channel and consists of large cobbles and boulders creating step-pool and pool-riffle bedforms.
The existing roadway-stream crossing consists of a 60-inch round corrugated metal pipe (CMP) culvert measuring 30.5 feet in length with an approximate 5.7% slope. The invert of the existing culvert is approximately 16-feet below the roadway elevation creating the need for a large amount of fill above the culvert and headwalls over 16-feet in height. The stone masonry headwalls upstream and downstream have deteriorated and stones have become displaced. The steep embankments, specifically downstream, show signs of roadway runoff channelization and erosion along the slope. Excessive loading due to roadway fill and cover create potential concerns with the foundation design. There are no water, sewer, or gas mains in the vicinity of the existing structure, overhead wires are present along the upstream side of the roadway.
The culvert replacement project will aim to replace the existing roadway-stream crossing with a cost effective structure that will better allow for wildlife and aquatic organism passage while providing passage of storm event flows, debris and flood resiliency.
2. Site Reconnaissance
Topographical and stream survey was performed at the site by a subcontracted survey field crew. The survey included typical relevant roadway, utility, property line, and landmark features for a distance of 50-feet in either direction along the road from the culvert. Topographical survey of existing contours is required, at a minimum, along the roadway embankments and in the immediate vicinity of the culvert. Stream survey was performed approximately 300-feet in each direction upstream and downstream from the culvert. The stream features surveyed and documented are further described below within this section.
Initial site reconnaissance and resource area delineation was performed at the site to document existing conditions. Wetland scientists examined and flagged the ordinary high water and bordering vegetated wetlands (BVW) resource areas. Stream bankfull width measurements at representative cross-sections outside of the influence of the existing culvert were also identified and flagged. The locations of these flags were subsequently surveyed by the subcontracted survey field crew for inclusion on the project base map.

Ashfield, MA – Baptist Corner Road DER – Technical Report
Page 2 of 18
Site reconnaissance included the documentation of the existing stream conditions upstream and downstream of the crossing. The type and integrity of stream grade controls were documented on field sketches to be used in determining the proper replacement structure placement, both horizontally and vertically. These stream features were surveyed to produce a longitudinal profile and representative cross-section views of the stream. The survey base map plan view, longitudinal profile and cross-sections with field notes are attached in Appendix A.
A reference reach was identified downstream of the existing culvert crossing outside of any influence by the existing structure. The reference reach was determined to be a representative section of the stream with similar slope characteristics to the replacement structure location. A streambed substrate analysis, known as a pebble count, was performed within the reference reach to understand the existing streambed material gradation which will be used to calculate and design the proposed streambed within the replacement structure. The pebble count information collected in the field and tabulated into graph format is attached in Appendix B.
Photographs of the representative site reconnaissance features are attached in Appendix C.
3. Geotechnical Evaluation
3.1. Subsurface Evaluation
CEI subcontracted General Borings, Inc. of Prospect, CT to perform two borings within Baptist Corner Road on each side of the existing culvert. Soil Boring No. B-1 was completed approximately 35 feet north of the existing culvert within the northbound travelled way of Baptist Corner Road. Soil Boring No. B-2 was completed approximately 40 feet south of the existing culvert footprint within the northbound travelled way of Baptist Corner Road. Typically, borings would be performed in alternate travelled ways, however the location of the existing overhead wires limited the borings to only the downstream travel lane. The information from these borings and laboratory analysis of soils samples will be utilized as the basis for the design of the proposed replacement structure foundation.
Each boring was intended to have a 40-feet depth beneath the roadway surface or to refusal, whichever was encountered first. Borings B-1 and B-2 were completed to depths of 28 feet and 21.4 feet below the surface of the roadway, respectively, with refusal at the bottom of each boring. Soil boring logs for borings B-1 and B-2 are attached in Appendix D.
Split spoon samples were taken every 10 feet or change in soil material type. Select soil samples were sent to a Massachusetts Certified lab, GeoTesting Express, Inc. of Acton, MA to perform analysis for: Atterberg Limits (ASTM D4318), USCS – Classification (ASTM D2487), Grain Size Sieve (ASTM D422), Density (ASTM D7263), and Moisture Content (ASTM D2216). These laboratory results are attached in Appendix E.
Based on the collected geotechnical information, there is a 6-inch thick layer of asphalt followed by a 7-foot layer of dense to very dense, fine brown sand with trace gravel. The underlying soil strata consists of medium dense, gray-brown silty sand at the elevations above and around the

Ashfield, MA – Baptist Corner Road DER – Technical Report
Page 3 of 18
culvert pipe. Immediately beneath the existing culvert pipe is very dense, light gray silty clayey sand which has the characteristics of glacial till. Cobbles and boulders were encountered beneath the till material, until refusal was ultimately reached in each boring location. Groundwater was encountered at approximately 16-feet below the surface of the roadway in each boring, near the existing streambed elevation.
3.2. Foundation System Alternatives
Three basic foundation types have been considered for this crossing replacement site. Those alternatives are: deep pile foundation – associated with bridges and large bottomless arch structures; shallow spread footing foundation – associated with three-sided bottomless structures; and mat or slab foundation - closed bottom structure or closed pipe. Based on the subsurface test results, soil improvements options at and below the foundation to increase soil bearing capacity and minimize vulnerability to scour, settlement and potential liquefaction will not be necessary. Soil improvement options typically include over excavation/ soil replacement, geogrid/ fabric installation, and chemical grouting/ soil mixing.
Preliminary foundation characteristics to consider during conceptual design include:
Costs; Foundation design complexity; Construction & phasing feasibility; Roadway Type and Condition; Environmental concerns; Stability; Scour Protection; Soil Properties.
The deep pile foundation typically consists of a strip footing acting as a pile cap with piles of specific length, diameter, and material driven down to refusal or through adequate soils to act as friction piles. For piles that would extend down to refusal and be set on or be embedded into rock, additional rock core testing and analysis would be required to verify the capacity of the bedrock. At this site refusal is fairly close to the streambed elevation making a foundation which bears directly on the bedrock an option to consider. However, piles would not be a likely option at this site, as the pile length would be very short and installation would make it cost prohibitive. The deep foundation would likely include a cast-in-place concrete knee wall set directly on the bedrock. The cost of over excavation down to bedrock depths for this option would need to be compared to the installation cost of short piles. A foundation directly on bedrock would require dowelling into the ledge to create an anchored connection for the concrete footing. The weathered bedrock would require chipping and cleaning to ensure the connection is made to sound materials. These details would be determined from the rock core results. This alternative would be the most costly in testing, design, and construction. This foundation would typically provide the highest stability and unsuitable soils above refusal would become less of a concern.

Ashfield, MA – Baptist Corner Road DER – Technical Report
Page 4 of 18
The shallow spread footing would provide an enlarged area for dead and live loads to be evenly distributed across the footprint and be dependent upon on the bearing capacity of the underlying soils. A shallow spread footing at this site would bear on the glacial till layer which is an ideal soil for this application based on the very dense characteristics determined from the standard penetration test (SPT) results conducted during the borings. Based on preliminary review, the high silt and clay fractions located within the very dense till layer are non-plastic leaving little concern for settlement depending on the anticipated loading. A spread footing bearing on the glacial till layer at this site could conservatively support loading up to two tons per square foot. A deep pile foundation or a foundation on bedrock would need to be considered if loading requirements are anticipated to exceed two tons per square foot. The construction footprint and amount of proposed backfill / overburden required for this alternative would not vary greatly from other foundation alternatives based on the extensive excavation required to reach the existing culvert and streambed elevation in any scenario. This foundation is a practical alternative for this site depending on the overall structure type selected.
A mat or slab footing consists of a closed bottom structure or closed pipe which acts to disperse the live and dead loads across bottom of the structure, avoiding any point load concentration concerns leading to settlement. Typically, this option poses the most cost effective solution at a site, with the greatest ease of constructability, and minimized environmental concerns. Similar to the shallow spread footing, the high silt and clay fractions located within the very dense till layer do not present a settlement concern. However, the streambed slope and bankfull width at this site may limit the effectiveness of a closed bottom structure, this determination is discussed further in the Structure Type Selection memo.
Design of the streambed materials and bedform within the crossing will be imperative to prevent against scour and minimize vulnerability of undermining soils during very large storm events. It is not anticipated that the very dense glacial till layer with considerable fines would have high permeability. Therefore, it is not likely that this layer would be susceptible to impacts of high groundwater, scour or piping and soil amendment options would not be considered for this site.
3.3. Geotechnical Evaluation/Soil Properties
The laboratory dry density of soil encountered in boring B-1 from approx. 20’-21’ was equivalent to 116.9 pcf, and from 25’-27’ was 124.4 pcf. The material sampled varied from dense to medium for the soil deposit. The soil was generally classified as a moist, dense, silty, clayey sand or gravel. The analyzed material had 75%-92% passing the #4 sieve and 39%-44% passing the #200 sieve. The Unified Soil Classification (ASTM D2487) for the materials was assumed to be somewhere between a SC-SM – Silty Clayey Sand and a GM – Silty Gravel with Sand. Atterberg Limits Testing (ASTM D4318) performed on the soils encountered in B-1 resulted in a Plasticity Index (PI) of 6 and in B-2 soils were determined to be non-plastic. In accordance with IBC 2009 Chapter 16 Structural Design, Table 1613.5.2, and Massachusetts amendments, the encountered soils would be classified as Site Class C – Very Dense Soils.
These classifications were used in conjunction with the laboratory bulk density to determine a representative unit weight of soil for design calculations and determination of design

Ashfield, MA – Baptist Corner Road DER – Technical Report
Page 5 of 18
parameters. Encountered soils had moisture contents ranging between 9% and 11%. An in-situ unit weight of 135 pounds per cubic foot was assumed and a wet unit weight of 140 pounds per cubic foot was used to represent all the encountered soils at the site. Those unit weights also fall within typical empirical values based on the average Standard Penetration Numbers (SPT N Values) for the soils encountered.
3.4. Soil Parameters for Foundation Design
Generally, soils were analyzed from 0 feet down to an average of 25 feet below grade for foundation design based on an approximate foundation depth for the proposed culvert and fairly consistent soil profile both above and below the proposed culvert elevations. This provided a representative estimate for soil design parameters based on the consistency of encountered soil densities and gradations.
Friction Angle
The internal friction angles for soils classified as dense, silty, clayey sand or gravel are at a minimum of 38 degrees and a maximum of 43 degrees. Using the assumed unit weights, boring depths and average SPT blow counts, CEI completed SPT corrections to represent the encountered soils. Corrected blow counts varied from 40 to in excess of 80 blows per foot between depths of 0 to 27 feet below the ground surface in two of the representative borings. Based on these correct blow counts, CEI selected an average friction angle of 43 degrees as a design parameter.
Please note that the friction angle of soil is used as a variable to select several soil strength properties and should not be confused with the angle of repose for the soil. The angle of repose would provide an estimate of the maximum stable slope angle for the soil to be used for grading and excavation purposes. This angle would likely be less than the friction angle selected for strength estimations. The angle of repose for soils is highly variable depending on depth of water table, soil type, cohesive vs. cohesionless properties, effective stresses and saturated vs. unsaturated conditions. Generally, a 3H:1V is the most stable slope for most soils encountered, but due to variability, it is recommended that a design consultant provide the proper angle of repose based on a detailed geotechnical analysis.
Allowable Bearing Capacity
An allowable bearing pressure range was identified based on the Unified Soil Classification of the encountered materials and a refined value was selected from that range based on corrected blow count data determined from the boring analysis. Based the boring data, the allowable bearing capacity could range between 2,000 psf and 2,500 psf.
3.5. Geotechnical Design Parameters
Based on the completed geotechnical analysis, the following design parameters are recommended for foundation designs for building and chamber footings, foundation walls and any required retaining walls that may be required in the design. As noted above, the following

Ashfield, MA – Baptist Corner Road DER – Technical Report
Page 6 of 18
assumptions were made to select these design parameters:
Average Corrected SPT N values (0-27 feet deep) = 60 - 70 bpf Assume ground water at an approximate depth of 15 feet Laboratory Dry Unit Weight = 120 pcf In-Situ Unit Weight = 135 pcf For design purposes, a wet unit weight of 140 pcf should be used. Internal Friction Angle = 43 degrees % Relative Dry Density = 90%-95%
Bearing Capacity Factors
Bearing capacity factors are provided below for informational purposes only. It is recommended that the allowable bearing capacity of 2,000 psf be used. Based on a selected internal friction angle of 43 degrees for the encountered material, the following bearing capacity design factors are provided for estimating bearing resistance of slabs on grade and footings:
Cohesion bearing capacity factor - Nc = 105.1 Surcharge bearing capacity factor - Nq = 99.0 Unit Weight bearing capacity factor - NƔ = 186.5
Shape and depth factors should be adjusted accordingly based on the foundation design when determining soil bearing resistance of foundation elements.
Modulus of Subgrade Reaction
A typical modulus of subgrade reaction for fine grained soils with a relative density of approx. 90%-95% is 230 to 290 lbs per cubic inch (200 - 250 tons per cubic feet).
Active, Passive & At-rest Earth Pressure Coefficients
Earth pressure coefficients for fine and coarse grained sands were calculated based on the assumed internal friction angle of soil. Based on the friction angle of 43 degrees, the Rankine earth pressure coefficients are as follows:
At-rest Earth Pressure Coeff. (Ko) = 0.318 Active Earth Pressure Coeff. (Ka) = 0.189 Passive Earth Pressure Coeff. (Kp) = 5.289
Earth Pressures & Stresses
Effective stresses were calculated down to 27 feet based on the extent of soil exploration. Based on subsurface exploration, ground water depths ranged between 16 to 17 feet below roadway level. However, for design purposes, it is recommended that an average groundwater depth of 15 feet be used for this site.
Assuming a design wet unit weight of 140 pcf and estimated groundwater depth of 15 feet, the

Ashfield, MA – Baptist Corner Road DER – Technical Report
Page 7 of 18
effective stresses could range from 0 – 2,100 psf from 0-15 feet deep and 2,100 to 3,030 psf from 15 to 27 feet deep. Based on this scenario, maximum active lateral earth pressures could be up to 570 psf and maximum passive earth pressures could be in excess of 16,000 psf at the 27-foot depth.
Settlement Factors
Some immediate elastic settlement is expected for foundation elements. The material is somewhat compressible /expansive based on the silt content, however, the settlement factors are low. Immediate settlement computations cannot be completed without foundation element depths, sizes and anticipated loads. The following are recommended design parameters that should be used to complete future anticipated settlement computations.
For a dense silty sand mixture, the range for Young’s Modulus is 3.4 to 27.8 ksi. Based on the corrected SPT N values, Young’s Modulus is estimated to be 5,820 psi (5.28 ksi). Poisson’s Ratio is estimated at 0.30, but can be as high as 0.35. The void ratio for the encountered materials could range between 0.18 and 0.28 and for this material is assumed to be approximately 0.25. Foundation Shape Factors will vary based on foundation element type.
3.6. Seismic Considerations
Liquefaction Potential
Based on Hazard mapping, Ashfield, MA is located within a Seismic Zone 2A and has relatively low hazard for seismic activity. Despite the low hazard, the encountered soils through the 27-foot depth were generally dense silts and sands or gravels with low plasticity which would have low susceptibility to liquefaction. The encountered groundwater tables were very deep and based on observations during subsurface exploration, groundwater is estimated at the 15 feet. Based on boring samples, the material was not highly saturated (average moisture content near 10%) with corrected blow count (N1)60 values greater than 50 blows/ft. It is unlikely that the soils could experience liquefaction during seismic activity and the ten percent probability peak ground acceleration (PGA) for Ashfield, MA is less than 0.15 g, therefore the potential for liquefaction is very low.
Seismic Design Category Evaluation
Site Class Definition: C. Very Dense Soils with SPT N Values < 50 in accordance with IBC 2009 Chapter 16 Structural Design, Table 1613.5.2 - Site Class Definitions and associated Massachusetts Amendments covered under 780 CMR Chapter 16.
Earthquake response accelerations for the maximum considered earthquake Ss= 0.220 g and Si = 0.068 g for Ashfield, MA according to 780 CMR Chapter 16, Table 1604.11.
Based on the USGS Earthquake Hazards Program, the Seismic Factors for Design (ASCE 7-05) are as follows: Ss= 0.171 g, Si = 0.068 g.

Ashfield, MA – Baptist Corner Road DER – Technical Report
Page 8 of 18
3.7. Construction Considerations
Construction phasing, site restrictions and impacts to environmentally sensitive resource areas during construction are major factors in the foundation design and ultimately the structure type selection. Any changes in the roadway profile such as increased roadway elevation will affect the stress profile of the roadway and impact the structures and piping below. Typical expected traffic loadings have been considered at the site as well, the structure design and foundation design will provide for H-20 or higher loading. Headwalls and wingwalls will be required at this site to act as retaining walls supporting the backfill and roadway materials.
It is anticipated that the roadway will need to be completely detoured during construction due to the excavation depth required from the roadway elevation to the roadway-stream crossing structure invert. Maintaining alternating one-way traffic through the construction site would not be practical or feasible.
Bypass piping or cofferdams will be required to divert the stream through the construction site. If an open bottom structure is chosen, cofferdams will be an appropriate option to allow the stream to flow along its current channel while working outside of the streambanks to construct the footings. Construction should typically be performed during low flow months (July-September). The contractor will be required to control groundwater elevations using an acceptable practice, such as well points and groundwater pumps, with discharge into sedimentation bags located on relatively level ground in vegetated, stabilized areas prior to entering the stream downstream of the project site.
4. Hydrologic and Hydraulic Evaluation
4.1. Hydrologic Study
CEI utilized Autodesk Storm and Sanitary Analysis (SSA) modeling software to perform TR-20 and TR-55 calculations to estimate peak discharge rates for the Baptist Corner Road roadway-stream crossing watershed. USGS StreamStats was used to delineate the watershed contributing to the unnamed tributary. StreamStats provided the estimated watershed area, percentage of area covered by forest, and estimated bankfull flow statistics. Additional input data included NRCS precipitation data (Cornell Study), NRCS soils survey, GIS land use information, and USGS topographical maps for estimating Time of Concentration.
The following peak flow flood discharges in cubic feet per second (cfs) were calculated from the SSA model:
1 year-24 hour Storm – 30.3 cfs 5 year-24 hour Storm – 101.9 cfs 10 year-24 hour Storm – 148.7 cfs 25 year-24 hour Storm – 229.0 cfs 50 year-24 hour Storm – 309.4 cfs 100 year-24 hour Storm – 408.5 cfs

Ashfield, MA – Baptist Corner Road DER – Technical Report
Page 9 of 18
Hydrologic computations are attached in Appendix F.
4.2. Hydraulic Study
Based on the hydrologic calculations, the Hydrologic Engineering Center River Analysis System (HEC-RAS) software provided by the U.S. Army Corps of Engineers was used to determine peak water surface elevations and velocities at several stream stations within the study area. Stream station data was input into the model using detailed survey information at cross-sections determined during the site reconnaissance. The existing culvert pipe inlet invert is at elevation 989.61 and the outlet invert is at elevation 987.86. The proposed alternatives have been modeled to meet bankfull width and elevation requirements with bed forms to be constructed of cobbles and boulders to mimic the geometry of the reference reach. The proposed alternatives have been modeled with the same streambed elevations as existing conditions, inlet at elevation 989.61 and the outlet elevation at 987.86.
The existing conditions and several proposed structure alternatives were analyzed and compared for various flood return frequencies. The structure alternatives consist of: embedded concrete box, concrete arch, metal arch, and a bridge. Peak water surface elevations and peak flow velocities at stream cross sections upstream and downstream of the structure are provided for each alternative in Appendix G.
Table 4.1 – 10-Year Storm Event Hydraulic Summary
Embedment
Peak Water Surface Elevation (feet)
Peak Flow Velocity (ft/sec)
Upstream of Culvert
Downstream of Culvert
Upstream of Culvert
Downstream of Culvert
Existing 5’CMP None 995.46 987.99 1.69 7.70
Prop. 19’ Span by 10.4’ Rise Concrete Box
4.4-feet 991.79 989.52 4.98 6.87
Prop. 19’ Span by 8’-6” Rise Concrete Arch
Open-Bottom
991.79 989.52 5.00 6.88
Prop. 19’ Span by 9’-6” Rise Metal Arch
Open-Bottom
991.79 989.52 4.98 6.87
Prop. 24’ Span Steel Stringer Bridge
Open-Bottom
991.77 989.52 4.99 6.83
Baptist Corner Road has a highway functional classification of local rural road as determined by MassDOT. This classification provides applicable guidelines for designing a new or replacement culvert. According to the MassDOT LRFD Bridge Manual, the hydraulic design flood return frequency for a local rural roadway is the 10-year event. A stream crossing structure should provide ample clearance between the peak water surface elevations during the design storm event and the proposed structure low chord; MassDOT typically requires 2-feet. Ideally, the replacement structure should provide some freeboard during the design storm event to avoid pressurized flow conditions due to a submerged inlet. The scour design and scour check flood

Ashfield, MA – Baptist Corner Road DER – Technical Report
Page 10 of 18
return frequencies are the 25-year and 50-year storm events, respectively, for structures requiring foundation designs.
Under proposed conditions, the overall culvert length of 30.5-feet will remain unchanged, except for the bridge scenario which due to typical manufacturer sizes will be extended to 32.0-feet. The roadway built on top of the proposed structure will be a minimum of 21-feet wide to provide a consistent width for vehicles travelling over the crossing. This length modification does not alter the hydraulic modeling results of the HEC-RAS program.
A uniform shape and slope of the streambed has been modeled throughout the proposed crossings to comply with the Massachusetts River and Stream Crossing Standards. The proposed stream crossings will create a larger effective flow area, which increases velocity upstream of the crossing and peak water surface elevations downstream of the crossing. Although these values are higher than the existing conditions, they more closely reflect the conditions in the natural stream.
The hydraulic results of the proposed stream crossings are all very similar. This is due to meeting bankfull width within the structures and eliminating pressurized flow for all modeled storm events.
4.3. Construction Considerations
Roadway cover above the proposed structure will be a determining factor in the replacement alternative. The roadway shoulders are at approximate elevation 1004.00 at the crossing site with proposed streambed inverts in the range of 990.0-987.0 within the replacement structure. The structure selection process should consider the amount of properly constructed backfill that will be required, in addition to the need for retaining walls to replace the existing masonry structure. In some cases, selecting a structure with a higher rise may help reduce overall material and construction costs.
Cofferdams may be required to divert the stream through the construction site if an open bottom structure is chosen. Alternatively, it may be feasible to use the existing pipe while foundations are installed for the replacement structure. Bypass piping may be required if a closed bottom box is used.
Construction should typically be performed during low flow months (July-September). The contractor will be required to control groundwater elevations using an acceptable practice, such as well points and groundwater pumps, with discharge into sedimentation bags located on relatively level ground in vegetated, stabilized areas prior to entering the stream downstream of the project site.
5. Structure Type Evaluation
The structure type selection considerations outlined below highlight the typical factors to be used during the initial decision making process.

Ashfield, MA – Baptist Corner Road DER – Technical Report
Page 11 of 18
5.1. Cost Considerations
Overall cost of the proposed replacement is one of the top factors in determining the structure type. Costs associated with engineering design and permitting, materials, and construction will be compared and weighed for each alternative. The following table highlights standard cost implication rankings.
Table 5.1 – Typical Cost Summary
Costs Design & Permitting Materials Construction
Low < $10,000 < $25,000 < $25,000
Medium $10,000 - $35,000 $25,000 - $50,000 $25,000 - $100,000
High > $35,000 > $50,000 > $100,000
Low cost options for materials and construction should be considered and prioritized as applicable to the replacement project. The life expectancy of the material will need to be considered and no aspects shall compromise safety.
Prioritize: replacement structures capable of being installed by local municipal forces; structures that can be designed and provided a structural engineering stamp by a manufacturer; and, structures that can be made available with the shortest lead time.
Structure types with materials that require excessive equipment, cranes, staging areas, traffic management, and the like, should be considered less desirable options. Engineering and design phase costs should not weigh as heavily in the structure type selection process.
Cost Factor: The costs associated with each proposed alternative will be weighed with the strongest consideration given to the least expensive options.
5.2. Site Considerations
Roadway Cover
The Ashfield site presents a situation where a large amount of fill and properly compacted soil over the replacement structure will be required during backfill operations. This amount of material and construction labor presents an adverse cost impact. Minimizing the amount of fill required by providing a structure with a higher rise will aid in construction and material costs.
The available roadway cover facilitates the construction of a structure that will provide ample clearance between peak water surface elevations during storm events and the proposed structure low chord. The proposed alternatives will be able to provide freeboard during the design storm event to allow for non-pressurized flow conditions, as well as meet MassDOT recommendations of 2-feet of freeboard to allow for debris and ice passage.
The streambed elevation is approximately 16-feet lower than the existing roadway elevation.

Ashfield, MA – Baptist Corner Road DER – Technical Report
Page 12 of 18
This may create constructability issues for certain structure types due to weight restrictions of installation equipment across the required far distances.
Roadway Cover Factor: Minimize backfill and compaction requirements to control costs. Provide the recommended 2-feet of freeboard during the design storm event for each proposed structure. One of the biggest concerns, take into account constructability of each alternative based on extended distances from roadway to streambed.
Traffic
The existing bituminous concrete roadway pavement is approx. 21 feet wide north and south of the crossing, while only 18 feet wide at the crossing. Guardrail is present on both sides of the roadway. The proposed alternatives will be designed to accommodate, at a minimum, a 21-foot wide roadway over the crossing. The existing culvert pipe has been measured as 30.5 feet in length. The proposed crossings can maintain this culvert length and provide the necessary roadway width through the use of proposed headwalls and wingwalls.
Preliminary meetings with the Town have determined that vehicle traffic can be detoured completely around the site during construction. No phasing of construction work is required.
Traffic Factor: Proposed culvert crossing alternatives will provide, at a minimum, a 21-foot wide roadway over the crossing. Traffic management will be the same for all alternatives.
Utilities
There are no water, sewer, or gas mains in the vicinity of the existing structure. Overhead wires are present above the upstream travelled way of Baptist Corner Road. Constructability of the proposed alternatives will need to consider placement of the structure with regards to the overhead wires. Overhead wire protection or pole relocation may be required for certain alternatives that will require a crane or other large equipment for placement. These alternatives would create higher cost implications.
Utilities Factor: Alternatives will be limited by constructability concerns because of the overhead wires and equipment required to set the proposed structure.
Resource Areas
The existing culvert carries a stream/ wetland crossing beneath the roadway. Therefore, the structure is located within: the riverfront area, the inland bank buffer zone, bordering vegetated wetlands, and wetlands buffer zone. Wetland replication areas will need to be considered during the permitting phase due to this proposed shoulder widening which may impact wetlands in the vicinity. The culvert site is not located within Natural Heritage and Endangered Species Program (NHESP) rare or endangered species habitat. The culvert is not located in any known historic or cultural areas, and the site is not known to be located in any areas that would warrant the expectation of hazardous materials or contaminants.
Resource Areas Factor: All alternatives will require permitting. The overall extents of permitting

Ashfield, MA – Baptist Corner Road DER – Technical Report
Page 13 of 18
and environmental impacts will be similar for each alternative.
Aquatic Organism Presence
Bear River is approximately 2,200 feet downstream of the culvert and is known to be a habitat for trout. The presence of trout upstream of the crossing also exists. It is important that the replacement structure is able to reconnect the habitats upstream and downstream of the crossing.
Macro invertebrates in the stream currently contribute to improving water quality and act as a food source for other aquatic organisms. Semi-Aquatic Organisms, such as turtle and frogs are able to cross the road, but are susceptible to traffic fatalities from vehicles that travel the road daily.
Aquatic Organism Presence Factor: Alternatives that can provide an ecological connection from the upstream end to downstream end of the roadway-stream crossing will receive priority consideration.
5.3. Hydraulic Considerations
Bankfull Width
Bankfull width measurements were taken as part of the initial site reconnaissance and survey effort. Five total measurements were taken, two upstream and three downstream within the reference reach. The average bankfull width measurement was calculated to be 14.6-feet. All replacement structures will be proposed with a span to meet the Massachusetts Stream Crossing Standards requirement of 1.2 times bankfull width, 17.5-feet minimum.
For replacement structures under 10-feet in width the municipality should use the services of a registered professional engineer to develop the design. Structures between 10-feet and 20-feet in width will require MassDOT review under MGL Chapter 85 Section 35 with a more involved design process. Structures over 20-feet in width will require the most stringent design process pertaining to full compliance with the MassDOT LRFD Bridge Manual. These scenarios should be carefully considered when selecting the proposed alternative as the additional review processes will increase costs.
Bankfull Width Factor: Proposed alternatives shall meet the minimum bankfull width requirements, while keeping in mind the design review process cost implications.
Embedment & Substrate
Open-bottom structures are the preferred replacement type according to Massachusetts Stream Crossing Standards. Based on the Ashfield geotechnical data, the shallow spread footing foundation type for open-bottom structures will be a practical alternative for this site. A deep pile foundation is likely not needed at this site due to the suspected presence of bedrock, a pile foundation associate with the bedrock would likely be cost prohibitive at this site. Closed bottom pipes and box culverts act as their own mat or slab footing and require a minimum of 2-feet of embedment with matching stream substrate within the crossing. Embedment required at this site

Ashfield, MA – Baptist Corner Road DER – Technical Report
Page 14 of 18
due to vertical adjustment potential, described below, may limit the feasibility of a closed bottom structure.
All proposed crossings will need to be designed with pool-riffle and step-pool bedforms within the structure to match the reference reach characteristics found in the field.
Embedment & Substrate Factor: All proposed alternatives shall meet, at a minimum, embedment and substrate requirements of the Massachusetts River and Stream Crossing Standards. Proposed alternatives must allow for bedform material and large key pieces to be installed within the structures.
Water Depth & Velocity
Structure type alternatives have been modelled for a variety of typical storm events to examine the change in peak water surface elevation and velocity when compared to existing conditions.
Water Depth & Velocity Factor: Proposed conditions shall not create a rise in the peak water surface elevation, and shall not create abrupt changes in velocity at the upstream or downstream end which may cause aggradation and degradation.
FEMA
There have been no reported issues of historic flooding in the area of the existing structure. The roadway-stream crossing culvert is not located within the 100-year flood zone, no FEMA flood mapping concerns exist.
FEMA Factor: The stream is not located within the 100-year flood zone, potential changes in water surface elevation will not require map revisions.
5.4. Geotechnical Considerations
Foundation Design
Based on the geotechnical data collected from the site a foundation type has been considered for each alternative. The shallow spread footing alternative is highly compatible with the underlying soil characteristics and will aid in meeting additional site and hydraulic considerations. Deep pile foundations and slab footings present more costly alternatives or create conflicting issues with a variety of other considerations.
Foundation Design Factor: The cost, compatibility with underlying soils, construction effort, and permitting implications of each foundation alternative will affect the ultimate structure type selection.
Vertical Adjustment Potential
Short-term and long-term stream degradation and aggradation must be considered when proposing a replacement stream crossing structure. Potential degradation and scour are major concerns with open-bottom structures to ensure the foundations are protected and set at the

Ashfield, MA – Baptist Corner Road DER – Technical Report
Page 15 of 18
appropriate elevation. Both open-bottom and closed structures must account for aggradation to ensure the hydraulic opening will remain sufficient for passage of flows and debris.
The anticipated variation in streambed elevation over time is known as the vertical adjustment potential (VAP). The VAP is estimated from field assessment of the stability of existing grade controls (such as existing boulder/cobble bed forms found at pool tail crests) upstream and downstream of the crossing. Using the survey of the longitudinal profile, pool depths are measured from the elevations of these grade control features, and used to estimate the maximum expected stream degradation over the length of the profile.
The following table shows adjustment factors used to calculate the lower VAP by multiplying the maximum surveyed pool depth in the surveyed stream reach by the VAP Factor associated with the stream bedform classification. The stream bedform classification is determined during site reconnaissance.
Table 5.2 –VAP Adjustment Factors
Stream Bedform Classification VAP Factor
Step-pool channels, Slope > 5%, boulder-cobble boundaries 1.00 x Pool Max Depth
Step-pool channels, Slope < 5%, cobble-gravel boundaries 1.25 x Pool Max Depth
Steep riffles with ribs, cobble-gravel boundaries 1.50 x Pool Max Depth
Riffles, gravel-cobble boundaries 1.75 x Pool Max Depth
Riffles, sand-fine gravel boundaries 2.00 x Pool Max Depth
Bedrock No adjustment Source: USDA Forest Service - Eastern Region-R9, “Designing for Aquatic Organism Passage at Road-Stream Crossings (Stream Simulation)”
The lower VAP for the Ashfield site was calculated based off the upstream pool depths and the downstream cascade high stability grade control elevations. The VAP determination process is illustrated in the profile attached in Appendix H, calculating a lower VAP of 2.4-feet.
Vertical Adjustment Potential Factor: Degradation and aggradation of the streambed elevation must be considered to ensure the crossing foundation is protected, and passage of flow does not become limited.
5.5. Alternatives Analysis
5.5.1. Concrete Box Culvert
A proposed 19-foot wide by 10.4-foot high concrete box culvert with 4.4-feet of embedment has been examined as a potential replacement alternative.
Site Consideration: The proposed box culvert will have 8.2-feet of cover over the structure which is the largest cover height of all the alternatives. The weight and size of the proposed

Ashfield, MA – Baptist Corner Road DER – Technical Report
Page 16 of 18
concrete sections will make constructability an issue. When excavating to the required footing depth the limits of the excavation will push equipment further away horizontally, adding to the constraints of the vertical elevation difference. It will be difficult to install such large sections nearly 20-feet below the roadway with an extended crane arm. Overhead wires will also create an obstruction for the crane required to move such heavy sections.
Hydraulic Considerations: This option performs relatively equal to the other proposed alternatives with respect to water surface elevation and flow velocity. While this closed bottom option is proposed to meet the bankfull width requirement, the structure will require embedment filled within the structure to create bedforms within the crossing.
Geotechnical Considerations: The closed box culvert would be considered a slab footing and act as its own spread footing foundation, this option would be the most cost effective foundation type. The lower VAP of 2.4-feet would require a minimum of 4.4-feet of embedment within the structure when constructed. This would create a much deeper excavation across the entire culvert footprint, as well as a much larger and heavier structure than the other alternatives.
Cost Considerations: The closed bottom box culvert will likely generate a lower cost for design and materials than the other alternatives relative to the standard cost rankings. The design and materials are anticipated to be in the medium ranking for costs. Construction costs, however, will register in the high ranking due to concerns with the large, heavy structure sections and the installation of these pieces with respect to the excavation depth and overhead wires. Bypass piping for stream flow diversion and water management will also be more costly than open-bottom alternatives. Flows will need to be completely routed around the project site adding to costs and project timeline.
5.5.2. Concrete Arch Culvert
A proposed 19-foot span by 8.5-foot rise precast concrete arch culvert with open-bottom has been examined as a potential replacement alternative.
Site Consideration: The proposed concrete arch culvert will have 6.1-feet of cover over the structure which is comparable to the other arch structure alternative. The weight and size of the proposed concrete sections will make constructability an issue. When excavating to the required footing depth the limits of the excavation will push equipment further away horizontally, adding to the constraints of the vertical elevation difference. It will be difficult to install such large sections nearly 20-feet below the roadway with an extended crane arm. Overhead wires will also create an obstruction for the crane required to move such heavy sections.
Hydraulic Considerations: This option performs relatively equal to the other proposed alternatives with respect to water surface elevation and flow velocity. The open-bottom option allows for fully meeting the Massachusetts Stream Crossing Standards including the preference for spanning the stream channel. Because the project involves removing an existing closed bottom culvert, the stream channel will need to be restored. This structure type will allow for simplified creation of the bedforms within the crossing. Once the foundation footings are in

Ashfield, MA – Baptist Corner Road DER – Technical Report
Page 17 of 18
place the streambed can be constructed prior to the placement of the precast arch sections.
Placement of an open-bottom structure will require assessment of scour protection and provision of scour mitigation measures that comply with MassDOT standards, which will likely add to the cost of the structure.
Geotechnical Considerations: The arch structure will require a footing design compatible with the underlying soils. A shallow spread footing bearing on the glacial till layer will be the most cost effective foundation for this option. The elevation of the footing must be designed in accordance with the lower VAP of 2.4-feet, and to meet scour protection requirements.
Cost Considerations: The open-bottom precast concrete arch culvert will likely generate high rankings for all cost considerations relative to the standard cost rankings. Design and materials will be more costly due to the foundation requirements. Construction costs will register in the high ranking due to the foundation installation and concerns with the large, heavy structure sections and the installation of these pieces with respect to the excavation depth and overhead wires.
5.5.3. Metal Arch Culvert
A proposed 19-foot span by 9.5-foot rise metal arch culvert with open-bottom has been examined as a potential replacement alternative.
Site Consideration: The proposed concrete arch culvert will have 5.6-feet of cover over the structure which is comparable to the other arch structure alternative. The weight and size of the proposed metal arch sections will be much more manageable than the concrete options. The metal sections will be much lighter and easy to install during construction making this an ideal material for the proposed crossing. Maneuvering the metal sections with respect to the existing overhead wires will be much easier than the other options.
Hydraulic Considerations: This option performs relatively equal to the other proposed alternatives with respect to water surface elevation and flow velocity. The open-bottom option is proposed to meet the bankfull width requirement. This structure type will allow for simplified creation of the bedforms within the crossing. Once the foundation footings are in place the streambed can be constructed prior to the placement of the metal arch sections.
Placement of an open-bottom structure will require assessment of scour protection and provision of scour mitigation measures that comply with MassDOT standards, which will likely add to the cost of the structure.
Geotechnical Considerations: The arch structure will require a footing design compatible with the underlying soils. A shallow spread footing bearing on the glacial till layer will be the most cost effective foundation for this option. The elevation of the footing must be designed in accordance with the lower VAP of 2.4-feet, and to meet scour protection requirements.
Cost Considerations: The open-bottom metal arch culvert will likely generate the lowest cost for the overall structure replacement than the other alternatives relative to the standard cost

Ashfield, MA – Baptist Corner Road DER – Technical Report
Page 18 of 18
rankings. While the design, materials and construction costs are anticipated to register in the high ranking, these components will cumulatively add up to the lowest cost total of the alternatives. This is due to lower material costs for metal than precast concrete and lower construction costs for installation of lighter more easily handled metal sections.
The life expectancy of the metal material will typically not be as long as concrete alternatives. The metal structure life span will vary depending on soil conditions, and pH levels. Typically, an aluminum structure will have a 50-year life span, while bridges and pre-cast concrete structures will have a 50-75-year life span. However, considering the condition of the existing metal pipe, replacement with a metal arch is a viable option.
5.5.4. Steel Stringer Bridge
A proposed 24-foot span steel stringer bridge with engineered abutments and an open-bottom has been examined as a potential replacement alternative.
Site Consideration: The cover over the proposed bridge will only consist of the required roadway pavement and base section. Installation of the concrete abutments and steel stringers will not be inhibited by the overhead wires.
Hydraulic Considerations: This option performs relatively equal to the other proposed alternatives with respect to water surface elevation and flow velocity. The bridge span is proposed to exceed the bankfull width requirement. The bridge opening will allow for simplified creation of the bedforms within the crossing. Once the foundation footings and abutments are in place the streambed can be constructed prior to the placement of the steel stringers.
Geotechnical Considerations: The bridge will require a footing design compatible with the underlying soils. A shallow spread footing bearing on the glacial till layer will be the most cost effective foundation for this option. The elevation of the footing must be designed in accordance with the lower VAP of 2.4-feet.
Cost Considerations: The bridge option will likely generate the highest cost for the overall structure replacement than the other alternatives relative to the standard cost rankings. The design, materials and construction costs are anticipated to register in the high ranking and exceed all other options. There are no apparent site, hydraulic or geotechnical benefits to the bridge option over the other alternatives.
5.6. Structure Type Selection
The recommended replacement structure for the Baptist Corner Road-Unnamed Tributary to Bear River roadway-stream crossing culvert is the 19-foot span by 9.5-foot rise metal arch culvert with open-bottom. This alternative offers the most compatible option for the site considering site constraints, hydraulic and geotechnical aspects, optimized with the lowest total cost implications associated with design, permitting, materials, and construction.

Ashfield, MA – Baptist Corner Road DER – Technical Report
Figures

Copyright:© 2013 National Geographic Society, i-cubed
Site Locus Map
ProjectLocation
µ ComprehensiveEnvironmental, Inc.0 0.1 0.2 0.3
Miles
Tributary to Bear River,Baptist Corner Rd.,
Ashfield, MAData Source: USGS

Ashfield, MA – Baptist Corner Road DER – Technical Report
Appendix A
Stream Plan View, Longitudinal Profile, and Cross-Sections


Ashfield, MA – Baptist Corner Road DER – Technical Report
Appendix B
Pebble Count


Ashfield, MA – Baptist Corner Road DER – Technical Report
Appendix C
Site Photographs
Ashfield, MA – Baptist Corner Road
Upstream Headwall Downstream Headwall
Upstream Opening Downstream Opening
Reference Reach Reference Reach

Ashfield, MA – Baptist Corner Road DER – Technical Report
Appendix D
Soil Boring Logs

SHEET 1 OF 1
CLIENT: General Borings, Inc.Comprehensive Environmental Inc. P. O. BOX 7135 PROSPECT, CT 06712
FOREMAN/DRILLER: SOIL ENGINEER
Thomas McGovern PROJECT NAME: Baptist Corner RoadINSPECTOR: LOCATION: Ashfield, MA DESIGN ENGINEER
Surface Elevation: GBI JOB NO. 120-16Date Started: 5/17/16 TYPE S Auger Casing Sampler Core Bar Hole No. B-1Date Finished: 5/17/16 H Auger HA S . S. Line & Station
Groundwater Observations Size I. D. 3-1/4" 1-3/8" Offset L R AT 17.0 AFTER 0.0 HRS Hammer 140 LBS. Bit N CoordinateAT AFTER HRS Fall 30" E. Coordinate
D SAMPLE BLOWSE Casing PER 6 INCHES STRATA FIELD IDENTIFICATION OF SOIL,
P blows DEPTH PEN. REC. ON CHANGE: REMARKS (INCL. COLOR, LOSS
T per IN FEET NO. IN IN TYPE SAMPLER DEPTH, OF WASH WATER, ETC.)
H foot FROM - TO 0-6 6-12 12 18 18 24 ELEV..5' 6" Blacktop
1.0-3.0 1 24 10 SS 19 18 18 20 1) Dense-Brown fine SAND, little silt, SAND little coarse-fine gravel, trace coarse
sand.5
5.0-7.0 2 24 12 SS 26 50 30 25 2) Very dense-Brown silty fine SAND,SILTY little coarse-fine gravel, fractured cobbleSAND pieces.
10
10.0-12.0 3 24 16 SS 9 11 18 19 TILL 3) Medium-Gray-brown silty fine SAND,trace fine-medium gravel, little weatheredrock.
15
15.0-16.3 4 16 12 SS 14 26 50/4 4) Very dense- Same as S-3 (TILL)Boulder 16.5'-18.0'
Cobbles to 20.0'20
20.0-20.9 5 24 7 SS 18 50/5 5) Very dense-Same as S-4
Boulders and cobbles to 25.0'
25
25.0-27.0 6 24 14 SS 11 21 12 17 6) Medium-Same as S-4 (TILL)
28.0' Auger refused at 28.0'EOB END OF BORING 28.0'
30
35
40From Ground Surface to Feet Used in. Casing Then in. Casing For Feet
Feet in Earth 27 Feet in Rock 0 No. of Samples 6 Hole No. B-1
SAMPLE TYPE CODING: SS = DRIVEN C = CORE A = AUGER U = UNDISTURBED PISTONPROPORTIONS USED: TRACE = 1-10% LITTLE = 10-20% SOME = 20-35% AND = 35-50%

SHEET 1 OF 1
CLIENT: General Borings, Inc.Comprehensive Environmental Inc. P. O. BOX 7135 PROSPECT, CT 06712
FOREMAN/DRILLER: SOIL ENGINEER
Thomas McGovern PROJECT NAME: Baptist Corner RoadINSPECTOR: LOCATION: Ashfield, MA DESIGN ENGINEER
Surface Elevation: GBI JOB NO. 120-16Date Started: 5/17/16 TYPE S Auger Casing Sampler Core Bar Hole No. B-2Date Finished: 5/17/16 H Auger Ha S . S. Line & Station
Groundwater Observations Size I. D. 3-1/4" 1-3/8" Offset L R AT 16.0 AFTER 0.0 HRS Hammer 140 LBS. Bit N CoordinateAT AFTER HRS Fall 30" E. Coordinate
D SAMPLE BLOWSE Casing PER 6 INCHES STRATA FIELD IDENTIFICATION OF SOIL,
P blows DEPTH PEN. REC. ON CHANGE: REMARKS (INCL. COLOR, LOSS
T per IN FEET NO. IN IN TYPE SAMPLER DEPTH, OF WASH WATER, ETC.)
H foot FROM - TO 0-6 6-12 12 18 18 24 ELEV..5' 6" Blacktop, 1' FILL
1.0-3.0 1 24 10 SS 8 25 14 13 1) Medium-Brown fine-medium SAND,FILL little silt, trace fine-coarse gravel.
5
5.0-63 2 15 6 SS 7 7 50/3 2) Very dense-Brown fine SAND, some 7.0' silt trace roots, sticks, trace fine gravel.
Boulder to 7.0, Cobbles to 10.0'10
10.0-12.0 3 24 0 SS 23 18 14 21 3) No recovery
15
15.0-17.0 4 24 10 SS 21 59 21 39 SILTY 4) Very dense-Light gray brown silty SAND fine SAND, trace coarse-fine gavel, little
weathered rock (boulders)WEATHERED
20 ROCK
20.0-21.3 5 16 12 SS 43 25 50/4 21.4' 5) Very dense-Fractured rock pieces, EOB trace weathered .
Auger refused at 21.4'END OF BORING 21.4
25
30
Note: Could not do the hole on other sideof road due to overhead wires.
35
40From Ground Surface to Feet Used in. Casing Then in. Casing For Feet
Feet in Earth 21.4 Feet in Rock 0 No. of Samples 5 Hole No. B-2
SAMPLE TYPE CODING: SS = DRIVEN C = CORE A = AUGER U = UNDISTURBED PISTONPROPORTIONS USED: TRACE = 1-10% LITTLE = 10-20% SOME = 20-35% AND = 35-50%

Ashfield, MA – Baptist Corner Road DER – Technical Report
Appendix E
Soil Laboratory Test Results

Client: Comprehensive EnvironmentalProject: Spencer/AshfieldLocation: Spencer/Ashfield, MA Project No: GTX-304733Boring ID: ---Sample ID: ---Depth : ---
Sample Type: ---Test Date: 06/01/16Test Id: 379026
Tested By: GAChecked By: emm
Moisture Content of Soil and Rock - ASTM D2216
printed 6/1/2016 5:05:15 PM
Boring ID Sample ID Depth Description MoistureContent,%
B-1
B-1
B-2
S- 5
S- 6
S- 5
20-20 ft 11 in
25-27 ft
20-21 ft 4 in
Moist, dark gray silty, clayey sand
Moist, dark gray silty, clayey sand withgravel
Moist, dark gray silty gravel with sand
11.4
10.4
8.7
Notes: Temperature of Drying : 110º Celsius

Client: Comprehensive EnvironmentalProject: Spencer/AshfieldLocation: Spencer/Ashfield, MA Project No: GTX-304733Boring ID: ---Sample ID: ---Depth : ---
Sample Type: ---Test Date: 06/01/16Test Id: 379022
Tested By: GAChecked By: emm
Laboratory Determination of Density (Unit Weight)of Soil Specimens by ASTM D7263
printed 6/1/2016 5:07:41 PM
BoringID
SampleID
Depth Visual Description BulkDensity
pcf
MoistureContent
%
DryDensity
pcf
*
B-1
B-1
S- 5
S- 6
20-20 ft11 in
25-27 ft
Moist, dark gray silty, clayey sand
Moist, dark gray silty, clayey sand with gravel
130.3
137.0
11.42
10.38
116.9
124.2
(1)
(2)
* Sample Comments
(1): Method B-Volumetric, Reconstituted (compacted)
(2): Method B-Volumetric, Reconstituted (compacted)
Notes: Moisture Content determined by ASTM D2216.

Client: Comprehensive EnvironmentalProject: Spencer/AshfieldLocation: Spencer/Ashfield, MA Project No: GTX-304733Boring ID: ---Sample ID: ---Depth : ---
Sample Type: ---Test Date: 06/01/16Test Id: 379017
Tested By: GAChecked By: emm
USCS Classification - ASTM D2487
printed 6/1/2016 5:04:36 PM
Boring ID Sample ID Depth Group Name GroupSymbol
Gravel, % Sand, % Fines, %
B-1
B-1
B-2
S-5
S-6
S-5
20-20 ft 11 in
25-27 ft
20-21 ft 4 in
Silty, clayey sand
Silty, clayey sandwith gravel
Silty gravel withsand
SC-SM
SC-SM
GM
8.4
25.4
67.4
47.9
35.4
17.7
43.7
39.2
14.9
Remarks: Grain Size analysis performed by ASTM D422 results enclosed
Atterberg Limits performed by ASTM D4318, results enclosed

Client: Comprehensive EnvironmentalProject: Spencer/AshfieldLocation: Spencer/Ashfield, MA Project No: GTX-304733Boring ID: B-1Sample ID: S-5Depth : 20-20 ft 11 in
Sample Type: jarTest Date: 06/01/16Test Id: 379018
Tested By: GAChecked By: emm
Test Comment: ---Visual Description: Moist, dark gray silty, clayey sandSample Comment: ---
Particle Size Analysis - ASTM D422
printed 6/1/2016 5:03:45 PM
0
10
20
30
40
50
60
70
80
90
100
0.0010.010.11101001000
Per
cent
Fin
er
Grain Size (mm)
0.5
in
0.37
5 in
#4
#10
#20
#40
#60
#10
0
#20
0
% Cobble
---
% Gravel
8.4
% Sand
47.9
% Silt & Clay Size
43.7
Sieve Name Sieve Size, mm Percent Finer Spec. Percent Complies
0.5 in
0.375 in
#4
#10
#20
#40
#60
#100
#200
12.50
9.50
4.75
2.00
0.85
0.42
0.25
0.15
0.075
100
96
92
85
79
73
67
56
44
CoefficientsD =1.9536 mm85
D =0.1794 mm60
D =0.1062 mm50
D =N/A30
D =N/A15
D =N/A10
C =N/Au C =N/Ac
Classification ASTM Silty, clayey sand (SC-SM)
AASHTO Silty Soils (A-4 (0))
Sample/Test DescriptionSand/Gravel Particle Shape : ANGULAR
Sand/Gravel Hardness : HARD

Client: Comprehensive EnvironmentalProject: Spencer/AshfieldLocation: Spencer/Ashfield, MA Project No: GTX-304733Boring ID: B-1Sample ID: S-6Depth : 25-27 ft
Sample Type: jarTest Date: 06/01/16Test Id: 379019
Tested By: GAChecked By: emm
Test Comment: ---Visual Description: Moist, dark gray silty, clayey sand with gravelSample Comment: ---
Particle Size Analysis - ASTM D422
printed 6/1/2016 5:03:47 PM
0
10
20
30
40
50
60
70
80
90
100
0.0010.010.11101001000
Per
cent
Fin
er
Grain Size (mm)
1.0
in
0.75
in
0.5
in
0.37
5 in
#4
#10
#20
#40
#60
#10
0
#20
0
% Cobble
---
% Gravel
25.4
% Sand
35.4
% Silt & Clay Size
39.2
Sieve Name Sieve Size, mm Percent Finer Spec. Percent Complies
1.0 in
0.75 in
0.5 in
0.375 in
#4
#10
#20
#40
#60
#100
#200
25.00
19.00
12.50
9.50
4.75
2.00
0.85
0.42
0.25
0.15
0.075
100
82
82
79
75
70
65
61
56
49
39
CoefficientsD =19.9753 mm85
D =0.3886 mm60
D =0.1569 mm50
D =N/A30
D =N/A15
D =N/A10
C =N/Au C =N/Ac
Classification ASTM Silty, clayey sand with gravel (SC-SM)
AASHTO Silty Soils (A-4 (0))
Sample/Test DescriptionSand/Gravel Particle Shape : ANGULAR
Sand/Gravel Hardness : HARD

Client: Comprehensive EnvironmentalProject: Spencer/AshfieldLocation: Spencer/Ashfield, MA Project No: GTX-304733Boring ID: B-2Sample ID: S-5Depth : 20-21 ft 4 in
Sample Type: jarTest Date: 06/01/16Test Id: 379020
Tested By: GAChecked By: emm
Test Comment: ---Visual Description: Moist, dark gray silty gravel with sandSample Comment: ---
Particle Size Analysis - ASTM D422
printed 6/1/2016 5:03:48 PM
0
10
20
30
40
50
60
70
80
90
100
0.0010.010.11101001000
Per
cent
Fin
er
Grain Size (mm)
1.5
in
1.0
in
0.75
in
0.5
in
0.37
5 in
#4
#10
#20
#40
#60
#10
0
#20
0
% Cobble
---
% Gravel
67.4
% Sand
17.7
% Silt & Clay Size
14.9
Sieve Name Sieve Size, mm Percent Finer Spec. Percent Complies
1.5 in
1.0 in
0.75 in
0.5 in
0.375 in
#4
#10
#20
#40
#60
#100
#200
37.50
25.00
19.00
12.50
9.50
4.75
2.00
0.85
0.42
0.25
0.15
0.075
100
41
41
41
38
33
29
27
25
23
19
15
CoefficientsD =33.8461 mm85
D =28.5301 mm60
D =26.6453 mm50
D =2.3082 mm30
D =0.0768 mm15
D =N/A10
C =N/Au C =N/Ac
Classification ASTM Silty gravel with sand (GM)
AASHTO Stone Fragments, Gravel and Sand (A-1-a (0))
Sample/Test DescriptionSand/Gravel Particle Shape : ANGULAR
Sand/Gravel Hardness : HARD

Client: Comprehensive EnvironmentalProject: Spencer/AshfieldLocation: Spencer/Ashfield, MA Project No: GTX-304733Boring ID: B-1Sample ID: S-5Depth : 20-20 ft 11 in
Sample Type: jarTest Date: 06/01/16Test Id: 379012
Tested By: GAChecked By: emm
Test Comment: ---Visual Description: Moist, dark gray silty, clayey sandSample Comment: ---
Atterberg Limits - ASTM D4318
printed 6/1/2016 5:02:25 PM
0
10
20
30
40
50
60
0 10 20 30 40 50 60 70 80 90 100
Pla
stic
ity In
dex
Liquid Limit
Plasticity Chart
ML or OLCL-ML
CL or OL
MH or OH
CH or OH
"A" Line
"U" Line
Symbol Sample ID Boring Depth NaturalMoisture
Content,%
LiquidLimit
PlasticLimit
PlasticityIndex
LiquidityIndex
Soil Classification
S-5 B-1 20-20 ft11 in
11 22 16 6 -0.8 Silty, clayey sand (SC-SM)
Sample Prepared using the WET method
27% Retained on #40 Sieve
Dry Strength: LOW
Dilatancy: NONE
Toughness: LOW

Client: Comprehensive EnvironmentalProject: Spencer/AshfieldLocation: Spencer/Ashfield, MA Project No: GTX-304733Boring ID: B-1Sample ID: S-6Depth : 25-27 ft
Sample Type: jarTest Date: 06/01/16Test Id: 379013
Tested By: GAChecked By: emm
Test Comment: ---Visual Description: Moist, dark gray silty, clayey sand with gravelSample Comment: ---
Atterberg Limits - ASTM D4318
printed 6/1/2016 5:02:25 PM
0
10
20
30
40
50
60
0 10 20 30 40 50 60 70 80 90 100
Pla
stic
ity In
dex
Liquid Limit
Plasticity Chart
ML or OLCL-ML
CL or OL
MH or OH
CH or OH
"A" Line
"U" Line
Symbol Sample ID Boring Depth NaturalMoisture
Content,%
LiquidLimit
PlasticLimit
PlasticityIndex
LiquidityIndex
Soil Classification
S-6 B-1 25-27 ft 10 22 16 6 -0.9 Silty, clayey sand withgravel (SC-SM)
Sample Prepared using the WET method
39% Retained on #40 Sieve
Dry Strength: LOW
Dilatancy: NONE
Toughness: LOW

Client: Comprehensive EnvironmentalProject: Spencer/AshfieldLocation: Spencer/Ashfield, MA Project No: GTX-304733Boring ID: B-2Sample ID: S-5Depth : 20-21 ft 4 in
Sample Type: jarTest Date: 06/01/16Test Id: 379014
Tested By: GAChecked By: emm
Test Comment: ---Visual Description: Moist, dark gray silty gravel with sandSample Comment: ---
Atterberg Limits - ASTM D4318
printed 6/1/2016 5:02:26 PM
Symbol Sample ID Boring Depth NaturalMoisture
Content,%
LiquidLimit
PlasticLimit
PlasticityIndex
LiquidityIndex
Soil Classification
S-5 B-2 20-21 ft4 in
9 n/a n/a n/a n/a Silty gravel with sand (GM)
Sample Determined to be non-plastic
75% Retained on #40 Sieve
Dry Strength: NONE
Dilatancy: RAPID
Toughness: n/a
The sample was determined to be Non-Plastic

Ashfield, MA – Baptist Corner Road DER – Technical Report
Appendix F
Hydrologic Computations

scott
Oval

Extreme Precipitation TablesNortheast Regional Climate CenterData represents point estimates calculated from partial duration series. All precipitation amounts are displayed in inches.
Smoothing YesState Massachusetts
LocationLongitude 72.768 degrees WestLatitude 42.548 degrees NorthElevation Unknown/UnavailableDate/Time Tue, 31 May 2016 11:22:05 0400
Extreme Precipitation Estimates 5min 10min 15min 30min 60min 120min 1hr 2hr 3hr 6hr 12hr 24hr 48hr 1day 2day 4day 7day 10day
1yr 0.29 0.44 0.55 0.72 0.89 1.12 1yr 0.77 1.04 1.29 1.61 2.01 2.50 2.85 1yr 2.22 2.74 3.17 3.80 4.40 1yr2yr 0.34 0.53 0.65 0.86 1.08 1.36 2yr 0.94 1.24 1.57 1.96 2.43 3.03 3.41 2yr 2.68 3.28 3.79 4.51 5.18 2yr5yr 0.41 0.64 0.80 1.07 1.37 1.72 5yr 1.18 1.54 1.99 2.47 3.04 3.72 4.26 5yr 3.29 4.10 4.78 5.55 6.35 5yr10yr 0.46 0.73 0.92 1.25 1.62 2.06 10yr 1.40 1.81 2.39 2.94 3.59 4.36 5.05 10yr 3.85 4.86 5.71 6.50 7.41 10yr25yr 0.56 0.88 1.12 1.55 2.05 2.62 25yr 1.77 2.26 3.02 3.71 4.49 5.36 6.33 25yr 4.75 6.09 7.21 8.02 9.10 25yr50yr 0.63 1.01 1.30 1.82 2.45 3.15 50yr 2.11 2.66 3.63 4.44 5.31 6.28 7.51 50yr 5.56 7.23 8.62 9.41 10.63 50yr100yr 0.73 1.18 1.52 2.15 2.93 3.76 100yr 2.53 3.15 4.34 5.28 6.28 7.37 8.92 100yr 6.52 8.58 10.30 11.04 12.42 100yr200yr 0.84 1.37 1.77 2.54 3.50 4.52 200yr 3.02 3.72 5.21 6.30 7.44 8.64 10.60 200yr 7.65 10.20 12.31 12.96 14.52 200yr500yr 1.03 1.69 2.20 3.18 4.45 5.74 500yr 3.84 4.64 6.61 7.94 9.30 10.68 13.33 500yr 9.45 12.82 15.60 16.03 17.86 500yr
Lower Confidence Limits 5min 10min 15min 30min 60min 120min 1hr 2hr 3hr 6hr 12hr 24hr 48hr 1day 2day 4day 7day 10day
1yr 0.23 0.36 0.44 0.59 0.72 0.88 1yr 0.62 0.86 1.04 1.42 1.64 2.11 2.36 1yr 1.87 2.27 2.59 3.34 3.90 1yr2yr 0.33 0.51 0.63 0.85 1.05 1.23 2yr 0.91 1.20 1.39 1.79 2.31 2.92 3.27 2yr 2.58 3.14 3.65 4.36 5.02 2yr5yr 0.37 0.58 0.72 0.98 1.25 1.45 5yr 1.08 1.41 1.63 2.10 2.64 3.36 3.97 5yr 2.98 3.82 4.37 5.12 5.73 5yr10yr 0.42 0.64 0.79 1.11 1.43 1.62 10yr 1.24 1.58 1.79 2.35 2.94 3.64 4.57 10yr 3.22 4.40 5.00 5.78 6.29 10yr25yr 0.48 0.73 0.91 1.30 1.70 1.86 25yr 1.47 1.82 2.06 2.70 3.33 4.13 4.98 25yr 3.65 4.79 5.96 6.78 7.14 25yr50yr 0.53 0.81 1.01 1.45 1.95 2.08 50yr 1.68 2.03 2.28 3.00 3.66 4.52 5.59 50yr 4.00 5.38 6.77 7.66 7.76 50yr100yr 0.60 0.90 1.13 1.63 2.24 2.31 100yr 1.93 2.26 2.53 3.33 4.03 4.98 6.28 100yr 4.41 6.04 7.72 8.67 8.47 100yr200yr 0.67 1.01 1.28 1.85 2.58 2.58 200yr 2.23 2.52 2.80 3.69 4.43 5.47 7.04 200yr 4.84 6.77 8.81 9.80 9.24 200yr500yr 0.79 1.18 1.51 2.20 3.13 2.98 500yr 2.70 2.91 3.18 4.23 5.03 6.22 8.20 500yr 5.50 7.89 8.88 11.57 10.33 500yr
Upper Confidence Limits 5min 10min 15min 30min 60min 120min 1hr 2hr 3hr 6hr 12hr 24hr 48hr 1day 2day 4day 7day 10day
1yr 0.31 0.48 0.59 0.79 0.98 1.17 1yr 0.84 1.14 1.34 1.72 2.17 2.76 3.27 1yr 2.44 3.15 3.46 4.08 4.75 1yr2yr 0.36 0.55 0.68 0.92 1.13 1.33 2yr 0.98 1.30 1.51 1.94 2.47 3.21 3.60 2yr 2.84 3.46 3.97 4.69 5.38 2yr5yr 0.44 0.69 0.85 1.17 1.49 1.69 5yr 1.28 1.65 1.91 2.46 3.08 4.07 4.59 5yr 3.60 4.42 5.24 6.05 7.01 5yr10yr 0.53 0.82 1.02 1.42 1.84 2.05 10yr 1.59 2.01 2.37 2.98 3.67 5.05 5.60 10yr 4.47 5.38 6.50 7.35 8.49 10yr25yr 0.68 1.04 1.29 1.84 2.42 2.65 25yr 2.09 2.59 3.09 3.84 4.64 6.58 7.80 25yr 5.82 7.50 8.65 9.49 10.93 25yr50yr 0.82 1.25 1.55 2.23 3.01 3.22 50yr 2.59 3.15 3.78 4.66 5.56 8.04 9.66 50yr 7.12 9.29 10.73 11.47 13.26 50yr100yr 0.99 1.50 1.88 2.72 3.73 3.93 100yr 3.22 3.84 4.65 5.67 6.66 9.83 11.97 100yr 8.70 11.51 13.33 13.93 16.10 100yr200yr 1.20 1.81 2.29 3.31 4.62 4.78 200yr 3.99 4.67 5.73 6.90 7.97 11.98 14.85 200yr 10.60 14.28 16.56 16.93 19.57 200yr500yr 1.55 2.31 2.97 4.31 6.13 6.21 500yr 5.29 6.07 7.54 8.94 10.10 15.62 19.71 500yr 13.83 18.95 24.18 21.89 25.37 500yr
scott
Highlight
scott
Highlight
scott
Highlight
scott
Highlight
scott
Highlight
scott
Highlight
Tributary to Bear River Baptist Corner Road
Ashfield, MA

Basin Characteristics Ungaged Site Report
Date: Mon Apr 11, 2016 4:52:28 PM GMT‐4Study Area: MassachusettsNAD 1983 Latitude: 42.5476 ( 42 32 51) NAD 1983 Longitude: ‐72.7678 (‐72 46 04)
Label Value Units Definition
DRNAREA 0.41 square miles Area that drains to a point on a streamSTRMTOT 0.81 miles Total length of mapped streams in basin
DRFTPERSTR 0 square mile permile Area of stratified drift per unit of stream length
MAREGION 1 dimensionless Region of Massachusetts 0 for Eastern 1 for WesternFOREST 83.72 percent Percentage of area covered by forestCRSDFT 0 percent Percentage of area of coarse‐grained stratified driftBSLDEM10M 17.262 percent Mean basin slope computed from 10 m DEMBSLDEM250 6.805 percent Mean basin slope computed from 1:250K DEMACRSDFT 0 square miles Area underlain by stratified driftLC11IMP 0.23 percent Average percentage of impervious area determined from NLCD 2011 impervious datasetLC11DEV 3.62 percent Percentage of land‐use from NLCD 2011 classes 21‐24ELEV 1190 feet Mean Basin ElevationPRECPRIS00 51.2 inches Basin average mean annual precipitation for 1971 to 2000 from PRISMLAKEAREA 0.08 percent Percentage of Lakes and Ponds
OUTLETX 95865 State planecoordinates Basin outlet horizontal (x) location in state plane coordinates
OUTLETY 922665 State planecoordinates Basin outlet vertical (y) location in state plane coordinates
MAXTEMPC 12.8 degrees Mean annual maximum air temperature over basin area, in degrees CentigradeWETLAND 2.75 percent Percentage of Wetlands
CENTROIDX 95606.4 State planecoordinates Basin centroid horizontal (x) location in state plane coordinates
CENTROIDY 923471.3 State planecoordinates Basin centroid vertical (y) location in state plane units
StreamStats Version 3.0

Flow Statistics Ungaged Site ReportDate: Mon Apr 11, 2016 4:54:21 PM GMT‐4Study Area: MassachusettsNAD 1983 Latitude: 42.5476 ( 42 32 51)NAD 1983 Longitude: ‐72.7678 (‐72 46 04)Drainage Area: 0.41 mi2
Low Flows Basin Characteristics
100% Statewide Low Flow WRIR00 4135 (0.41 mi2)
Parameter ValueRegression Equation Valid Range
Min MaxDrainage Area (square miles) 0.41 (below min value 1.61) 1.61 149Mean Basin Slope from 250K DEM (percent) 6.805 0.32 24.6Stratified Drift per Stream Length (square mile per mile) 0 0 1.29Massachusetts Region (dimensionless) 1 0 1
Warning: Some parameters are outside the suggested range. Estimates will be extrapolations with unknown errors.
Probability of Perennial Flow Basin Characteristics
100% Perennial Flow Probability (0.41 mi2)
Parameter ValueRegression Equation Valid RangeMin Max
Drainage Area (square miles) 0.41 0.01 1.99Percent Underlain By Sand And Gravel (percent) 0.00 0 100Percent Forest (percent) 83.72 0 100Massachusetts Region (dimensionless) 1 0 1
Bankfull Flows Basin Characteristics
100% Bankfull Statewide SIR2013 5155 (0.41 mi2)
Parameter ValueRegression Equation Valid Range
Min MaxDrainage Area (square miles) 0.41 (below min value 0.6) 0.6 329Mean Basin Slope from 10m DEM (percent) 17.262 2.2 23.9
Warning: Some parameters are outside the suggested range. Estimates will be extrapolations with unknown errors.
StreamStats Version 3.0

Low Flows Statistics
Statistic Value Unit Prediction Error (percent) Equivalent years of record90‐Percent Prediction Interval
Min MaxD50 0.38 ft3/sD60 0.23 ft3/sD70 0.14 ft3/sD75 0.1 ft3/sD80 0.0805 ft3/sD85 0.0588 ft3/sD90 0.0402 ft3/sD95 0.0235 ft3/sD98 0.0154 ft3/sD99 0.0106 ft3/sM7D2Y 0.0233 ft3/sAUGD50 0.0625 ft3/sM7D10Y 0.00908 ft3/s
http://pubs.usgs.gov/wri/wri004135/ (http://pubs.usgs.gov/wri/wri004135/)Ries_ K.G._ III_ 2000_ Methods for estimating low‐flow statistics for Massachusetts streams: U.S. Geological Survey Water Resources Investigations Report 00‐4135_ 81 p.
Probability of Perennial Flow Statistics
Statistic Value Unit Prediction Error (percent) Equivalent years of record90‐Percent Prediction Interval
Min MaxPROBPEREN 0.67 dim 0.2 0.55 0.76
http://pubs.usgs.gov/sir/2006/5031/pdfs/SIR_2006‐5031rev.pdf (http://pubs.usgs.gov/sir/2006/5031/pdfs/SIR_2006‐5031rev.pdf)Bent_ G.C._ and Steeves_ P.A._ 2006_ A revised logistic regression equation and an automated procedure for mapping the probability of a stream flowing perennially in Massachusetts: U.S.Geological Survey Scientific Investigations Report 2006–5031_ 107 p.
Bankfull Flows Statistics
Statistic Value Unit Prediction Error (percent) Equivalent years of record90‐Percent Prediction Interval
Min MaxBFWDTH 12.4 ftBFDPTH 0.83 ftBFAREA 10.1 ft2BFFLOW 37.3 ft3/s

1-Year Storm Event

Project DescriptionAshfield-Baptist_Corner_Rd.SPF
Project OptionsCFSElevationSCS TR-55SCS TR-55HydrodynamicYESYES
Analysis OptionsJul 17, 2013 00:00:00Jul 18, 2013 00:00:00Jul 17, 2013 00:00:000 days0 01:00:00 days hh:mm:ss0 00:05:00 days hh:mm:ss0 00:05:00 days hh:mm:ss30 seconds
Number of ElementsQty61101000000000000
Rainfall DetailsSN Rain Gage Data Data Source Rainfall Rain State County Return Rainfall Rainfall
ID Source ID Type Units Period Depth Distribution(years) (inches)
1 100-Year Time Series 100-Year Storm Cumulative inches User Defined2 10-Year Time Series 10-Year Storm Cumulative inches Massachusetts Franklin 10 4.36 SCS Type III 24-hr3 1-Year Time Series 1-Year Storm Cumulative inches User Defined4 25-Year Time Series 25-Year Storm Cumulative inches Massachusetts Franklin 25 5.36 SCS Type III 24-hr5 50-Year Time Series 50-Year Storm Cumulative inches Massachusetts Franklin 50 6.28 SCS Type III 24-hr6 5-Year Time Series 5-Year Storm Cumulative inches Massachusetts Franklin 5 3.72 SCS Type III 24-hr
Outlets .....................................................Pollutants .........................................................Land Uses ........................................................
Links.................................................................. Channels ................................................. Pipes ........................................................ Pumps ..................................................... Orifices .................................................... Weirs .......................................................
Nodes................................................................ Junctions ................................................. Outfalls .................................................... Flow Diversions ....................................... Inlets ........................................................ Storage Nodes .........................................
Runoff (Dry Weather) Time Step .....................Runoff (Wet Weather) Time Step ....................Reporting Time Step ........................................Routing Time Step ...........................................
Rain Gages ......................................................Subbasins.........................................................
Enable Overflow Ponding at Nodes .................Skip Steady State Analysis Time Periods ........
Start Analysis On .............................................End Analysis On ...............................................Start Reporting On ...........................................Antecedent Dry Days .......................................
File Name .........................................................
Flow Units ........................................................Elevation Type .................................................Hydrology Method ............................................Time of Concentration (TOC) Method .............Link Routing Method ........................................

Subbasin SummarySN Subbasin Area Weighted Total Total Total Peak Time of
ID Curve Rainfall Runoff Runoff Runoff ConcentrationNumber Volume
(ac) (in) (in) (ac-in) (cfs) (days hh:mm:ss)1 BptstCrnr_Culvert 262.40 67.68 2.50 0.38 99.19 30.31 0 01:12:05

Subbasin Hydrology
Subbasin : BptstCrnr_Culvert
Input Data
Area (ac) ........................................................................ 262.40Weighted Curve Number ............................................... 67.68Rain Gage ID ................................................................. 1-Year
Composite Curve Number Area Soil CurveSoil/Surface Description (acres) Group NumberWoods, Fair 131.20 B 60.00Woods, Fair 65.60 D 79.00Woods, Fair 10.50 A 36.00Woods, Poor 13.12 D 83.002 acre lots, 12% impervious 26.24 D 82.00Pasture, grassland, or range, Fair 15.74 B 69.00Composite Area & Weighted CN 262.40 67.68
Time of Concentration
TOC Method : SCS TR-55
Sheet Flow Equation :
Tc = (0.007 * ((n * Lf)^0.8)) / ((P^0.5) * (Sf^0.4))
Where :
Tc = Time of Concentration (hr) n = Manning's roughness Lf = Flow Length (ft) P = 2 yr, 24 hr Rainfall (inches) Sf = Slope (ft/ft)
Shallow Concentrated Flow Equation :
V = 16.1345 * (Sf^0.5) (unpaved surface) V = 20.3282 * (Sf^0.5) (paved surface) V = 15.0 * (Sf^0.5) (grassed waterway surface) V = 10.0 * (Sf^0.5) (nearly bare & untilled surface) V = 9.0 * (Sf^0.5) (cultivated straight rows surface) V = 7.0 * (Sf^0.5) (short grass pasture surface) V = 5.0 * (Sf^0.5) (woodland surface) V = 2.5 * (Sf^0.5) (forest w/heavy litter surface) Tc = (Lf / V) / (3600 sec/hr)
Where:
Tc = Time of Concentration (hr) Lf = Flow Length (ft) V = Velocity (ft/sec) Sf = Slope (ft/ft)
Channel Flow Equation :
V = (1.49 * (R^(2/3)) * (Sf^0.5)) / n R = Aq / Wp Tc = (Lf / V) / (3600 sec/hr)
Where :
Tc = Time of Concentration (hr) Lf = Flow Length (ft) R = Hydraulic Radius (ft) Aq = Flow Area (ft²) Wp = Wetted Perimeter (ft) V = Velocity (ft/sec) Sf = Slope (ft/ft) n = Manning's roughness

Flowpath Flowpath FlowpathSheet Flow Computations A B C Manning's Roughness : .4 0.00 0.00 Flow Length (ft) : 100 0.00 0.00 Slope (%) : 5 0.00 0.00 2 yr, 24 hr Rainfall (in) : 3.03 0.00 0.00 Velocity (ft/sec) : 0.11 0.00 0.00 Computed Flow Time (min) : 15.30 0.00 0.00
Flowpath Flowpath FlowpathShallow Concentrated Flow Computations A B C Flow Length (ft) : 1200 0.00 0.00 Slope (%) : 5 0.00 0.00 Surface Type : Forest Unpaved Unpaved Velocity (ft/sec) : 0.56 0.00 0.00 Computed Flow Time (min) : 35.71 0.00 0.00
Flowpath Flowpath FlowpathChannel Flow Computations A B C Manning's Roughness : 0.05 0.00 0.00 Flow Length (ft) : 4275 0.00 0.00 Channel Slope (%) : 2 0.00 0.00 Cross Section Area (ft²) : 10.1 0.00 0.00 Wetted Perimeter (ft) : 14.06 0.00 0.00 Velocity (ft/sec) : 3.38 0.00 0.00 Computed Flow Time (min) : 21.08 0.00 0.00Total TOC (min) ..................72.09
Subbasin Runoff Results
Total Rainfall (in) ............................................................ 2.50Total Runoff (in) ............................................................. 0.38Peak Runoff (cfs) ........................................................... 30.31Weighted Curve Number ............................................... 67.68Time of Concentration (days hh:mm:ss) ........................ 0 01:12:05

Subbasin : BptstCrnr_Culvert

5-Year Storm Event

Project DescriptionAshfield-Baptist_Corner_Rd.SPF
Project OptionsCFSElevationSCS TR-55SCS TR-55HydrodynamicYESYES
Analysis OptionsJul 17, 2013 00:00:00Jul 18, 2013 00:00:00Jul 17, 2013 00:00:000 days0 01:00:00 days hh:mm:ss0 00:05:00 days hh:mm:ss0 00:05:00 days hh:mm:ss30 seconds
Number of ElementsQty61101000000000000
Rainfall DetailsSN Rain Gage Data Data Source Rainfall Rain State County Return Rainfall Rainfall
ID Source ID Type Units Period Depth Distribution(years) (inches)
1 100-Year Time Series 100-Year Storm Cumulative inches User Defined2 10-Year Time Series 10-Year Storm Cumulative inches Massachusetts Franklin 10 4.36 SCS Type III 24-hr3 1-Year Time Series 1-Year Storm Cumulative inches User Defined4 25-Year Time Series 25-Year Storm Cumulative inches Massachusetts Franklin 25 5.36 SCS Type III 24-hr5 50-Year Time Series 50-Year Storm Cumulative inches Massachusetts Franklin 50 6.28 SCS Type III 24-hr6 5-Year Time Series 5-Year Storm Cumulative inches Massachusetts Franklin 5 3.72 SCS Type III 24-hr
Outlets .....................................................Pollutants .........................................................Land Uses ........................................................
Links.................................................................. Channels ................................................. Pipes ........................................................ Pumps ..................................................... Orifices .................................................... Weirs .......................................................
Nodes................................................................ Junctions ................................................. Outfalls .................................................... Flow Diversions ....................................... Inlets ........................................................ Storage Nodes .........................................
Runoff (Dry Weather) Time Step .....................Runoff (Wet Weather) Time Step ....................Reporting Time Step ........................................Routing Time Step ...........................................
Rain Gages ......................................................Subbasins.........................................................
Enable Overflow Ponding at Nodes .................Skip Steady State Analysis Time Periods ........
Start Analysis On .............................................End Analysis On ...............................................Start Reporting On ...........................................Antecedent Dry Days .......................................
File Name .........................................................
Flow Units ........................................................Elevation Type .................................................Hydrology Method ............................................Time of Concentration (TOC) Method .............Link Routing Method ........................................

Subbasin SummarySN Subbasin Area Weighted Total Total Total Peak Time of
ID Curve Rainfall Runoff Runoff Runoff ConcentrationNumber Volume
(ac) (in) (in) (ac-in) (cfs) (days hh:mm:ss)1 BptstCrnr_Culvert 262.40 67.68 3.72 1.01 266.07 101.93 0 01:12:05

Subbasin Hydrology
Subbasin : BptstCrnr_Culvert
Input Data
Area (ac) ........................................................................ 262.40Weighted Curve Number ............................................... 67.68Rain Gage ID ................................................................. 5-Year
Composite Curve Number Area Soil CurveSoil/Surface Description (acres) Group NumberWoods, Fair 131.20 B 60.00Woods, Fair 65.60 D 79.00Woods, Fair 10.50 A 36.00Woods, Poor 13.12 D 83.002 acre lots, 12% impervious 26.24 D 82.00Pasture, grassland, or range, Fair 15.74 B 69.00Composite Area & Weighted CN 262.40 67.68
Time of Concentration
TOC Method : SCS TR-55
Sheet Flow Equation :
Tc = (0.007 * ((n * Lf)^0.8)) / ((P^0.5) * (Sf^0.4))
Where :
Tc = Time of Concentration (hr) n = Manning's roughness Lf = Flow Length (ft) P = 2 yr, 24 hr Rainfall (inches) Sf = Slope (ft/ft)
Shallow Concentrated Flow Equation :
V = 16.1345 * (Sf^0.5) (unpaved surface) V = 20.3282 * (Sf^0.5) (paved surface) V = 15.0 * (Sf^0.5) (grassed waterway surface) V = 10.0 * (Sf^0.5) (nearly bare & untilled surface) V = 9.0 * (Sf^0.5) (cultivated straight rows surface) V = 7.0 * (Sf^0.5) (short grass pasture surface) V = 5.0 * (Sf^0.5) (woodland surface) V = 2.5 * (Sf^0.5) (forest w/heavy litter surface) Tc = (Lf / V) / (3600 sec/hr)
Where:
Tc = Time of Concentration (hr) Lf = Flow Length (ft) V = Velocity (ft/sec) Sf = Slope (ft/ft)
Channel Flow Equation :
V = (1.49 * (R^(2/3)) * (Sf^0.5)) / n R = Aq / Wp Tc = (Lf / V) / (3600 sec/hr)
Where :
Tc = Time of Concentration (hr) Lf = Flow Length (ft) R = Hydraulic Radius (ft) Aq = Flow Area (ft²) Wp = Wetted Perimeter (ft) V = Velocity (ft/sec) Sf = Slope (ft/ft) n = Manning's roughness

Flowpath Flowpath FlowpathSheet Flow Computations A B C Manning's Roughness : .4 0.00 0.00 Flow Length (ft) : 100 0.00 0.00 Slope (%) : 5 0.00 0.00 2 yr, 24 hr Rainfall (in) : 3.03 0.00 0.00 Velocity (ft/sec) : 0.11 0.00 0.00 Computed Flow Time (min) : 15.30 0.00 0.00
Flowpath Flowpath FlowpathShallow Concentrated Flow Computations A B C Flow Length (ft) : 1200 0.00 0.00 Slope (%) : 5 0.00 0.00 Surface Type : Forest Unpaved Unpaved Velocity (ft/sec) : 0.56 0.00 0.00 Computed Flow Time (min) : 35.71 0.00 0.00
Flowpath Flowpath FlowpathChannel Flow Computations A B C Manning's Roughness : 0.05 0.00 0.00 Flow Length (ft) : 4275 0.00 0.00 Channel Slope (%) : 2 0.00 0.00 Cross Section Area (ft²) : 10.1 0.00 0.00 Wetted Perimeter (ft) : 14.06 0.00 0.00 Velocity (ft/sec) : 3.38 0.00 0.00 Computed Flow Time (min) : 21.08 0.00 0.00Total TOC (min) ..................72.09
Subbasin Runoff Results
Total Rainfall (in) ............................................................ 3.72Total Runoff (in) ............................................................. 1.01Peak Runoff (cfs) ........................................................... 101.93Weighted Curve Number ............................................... 67.68Time of Concentration (days hh:mm:ss) ........................ 0 01:12:05

Subbasin : BptstCrnr_Culvert

10-Year Storm Event

Project DescriptionAshfield-Baptist_Corner_Rd.SPF
Project OptionsCFSElevationSCS TR-55SCS TR-55HydrodynamicYESYES
Analysis OptionsJul 17, 2013 00:00:00Jul 18, 2013 00:00:00Jul 17, 2013 00:00:000 days0 01:00:00 days hh:mm:ss0 00:05:00 days hh:mm:ss0 00:05:00 days hh:mm:ss30 seconds
Number of ElementsQty61101000000000000
Rainfall DetailsSN Rain Gage Data Data Source Rainfall Rain State County Return Rainfall Rainfall
ID Source ID Type Units Period Depth Distribution(years) (inches)
1 100-Year Time Series 100-Year Storm Cumulative inches User Defined2 10-Year Time Series 10-Year Storm Cumulative inches Massachusetts Franklin 10 4.36 SCS Type III 24-hr3 1-Year Time Series 1-Year Storm Cumulative inches User Defined4 25-Year Time Series 25-Year Storm Cumulative inches Massachusetts Franklin 25 5.36 SCS Type III 24-hr5 50-Year Time Series 50-Year Storm Cumulative inches Massachusetts Franklin 50 6.28 SCS Type III 24-hr6 5-Year Time Series 5-Year Storm Cumulative inches Massachusetts Franklin 5 3.72 SCS Type III 24-hr
Outlets .....................................................Pollutants .........................................................Land Uses ........................................................
Links.................................................................. Channels ................................................. Pipes ........................................................ Pumps ..................................................... Orifices .................................................... Weirs .......................................................
Nodes................................................................ Junctions ................................................. Outfalls .................................................... Flow Diversions ....................................... Inlets ........................................................ Storage Nodes .........................................
Runoff (Dry Weather) Time Step .....................Runoff (Wet Weather) Time Step ....................Reporting Time Step ........................................Routing Time Step ...........................................
Rain Gages ......................................................Subbasins.........................................................
Enable Overflow Ponding at Nodes .................Skip Steady State Analysis Time Periods ........
Start Analysis On .............................................End Analysis On ...............................................Start Reporting On ...........................................Antecedent Dry Days .......................................
File Name .........................................................
Flow Units ........................................................Elevation Type .................................................Hydrology Method ............................................Time of Concentration (TOC) Method .............Link Routing Method ........................................

Subbasin SummarySN Subbasin Area Weighted Total Total Total Peak Time of
ID Curve Rainfall Runoff Runoff Runoff ConcentrationNumber Volume
(ac) (in) (in) (ac-in) (cfs) (days hh:mm:ss)1 BptstCrnr_Culvert 262.40 67.68 4.36 1.42 371.82 148.65 0 01:12:05

Subbasin Hydrology
Subbasin : BptstCrnr_Culvert
Input Data
Area (ac) ........................................................................ 262.40Weighted Curve Number ............................................... 67.68Rain Gage ID ................................................................. 10-Year
Composite Curve Number Area Soil CurveSoil/Surface Description (acres) Group NumberWoods, Fair 131.20 B 60.00Woods, Fair 65.60 D 79.00Woods, Fair 10.50 A 36.00Woods, Poor 13.12 D 83.002 acre lots, 12% impervious 26.24 D 82.00Pasture, grassland, or range, Fair 15.74 B 69.00Composite Area & Weighted CN 262.40 67.68
Time of Concentration
TOC Method : SCS TR-55
Sheet Flow Equation :
Tc = (0.007 * ((n * Lf)^0.8)) / ((P^0.5) * (Sf^0.4))
Where :
Tc = Time of Concentration (hr) n = Manning's roughness Lf = Flow Length (ft) P = 2 yr, 24 hr Rainfall (inches) Sf = Slope (ft/ft)
Shallow Concentrated Flow Equation :
V = 16.1345 * (Sf^0.5) (unpaved surface) V = 20.3282 * (Sf^0.5) (paved surface) V = 15.0 * (Sf^0.5) (grassed waterway surface) V = 10.0 * (Sf^0.5) (nearly bare & untilled surface) V = 9.0 * (Sf^0.5) (cultivated straight rows surface) V = 7.0 * (Sf^0.5) (short grass pasture surface) V = 5.0 * (Sf^0.5) (woodland surface) V = 2.5 * (Sf^0.5) (forest w/heavy litter surface) Tc = (Lf / V) / (3600 sec/hr)
Where:
Tc = Time of Concentration (hr) Lf = Flow Length (ft) V = Velocity (ft/sec) Sf = Slope (ft/ft)
Channel Flow Equation :
V = (1.49 * (R^(2/3)) * (Sf^0.5)) / n R = Aq / Wp Tc = (Lf / V) / (3600 sec/hr)
Where :
Tc = Time of Concentration (hr) Lf = Flow Length (ft) R = Hydraulic Radius (ft) Aq = Flow Area (ft²) Wp = Wetted Perimeter (ft) V = Velocity (ft/sec) Sf = Slope (ft/ft) n = Manning's roughness

Flowpath Flowpath FlowpathSheet Flow Computations A B C Manning's Roughness : .4 0.00 0.00 Flow Length (ft) : 100 0.00 0.00 Slope (%) : 5 0.00 0.00 2 yr, 24 hr Rainfall (in) : 3.03 0.00 0.00 Velocity (ft/sec) : 0.11 0.00 0.00 Computed Flow Time (min) : 15.30 0.00 0.00
Flowpath Flowpath FlowpathShallow Concentrated Flow Computations A B C Flow Length (ft) : 1200 0.00 0.00 Slope (%) : 5 0.00 0.00 Surface Type : Forest Unpaved Unpaved Velocity (ft/sec) : 0.56 0.00 0.00 Computed Flow Time (min) : 35.71 0.00 0.00
Flowpath Flowpath FlowpathChannel Flow Computations A B C Manning's Roughness : 0.05 0.00 0.00 Flow Length (ft) : 4275 0.00 0.00 Channel Slope (%) : 2 0.00 0.00 Cross Section Area (ft²) : 10.1 0.00 0.00 Wetted Perimeter (ft) : 14.06 0.00 0.00 Velocity (ft/sec) : 3.38 0.00 0.00 Computed Flow Time (min) : 21.08 0.00 0.00Total TOC (min) ..................72.09
Subbasin Runoff Results
Total Rainfall (in) ............................................................ 4.36Total Runoff (in) ............................................................. 1.42Peak Runoff (cfs) ........................................................... 148.65Weighted Curve Number ............................................... 67.68Time of Concentration (days hh:mm:ss) ........................ 0 01:12:05

Subbasin : BptstCrnr_Culvert

25-Year Storm Event

Project DescriptionAshfield-Baptist_Corner_Rd.SPF
Project OptionsCFSElevationSCS TR-55SCS TR-55HydrodynamicYESYES
Analysis OptionsJul 17, 2013 00:00:00Jul 18, 2013 00:00:00Jul 17, 2013 00:00:000 days0 01:00:00 days hh:mm:ss0 00:05:00 days hh:mm:ss0 00:05:00 days hh:mm:ss30 seconds
Number of ElementsQty61101000000000000
Rainfall DetailsSN Rain Gage Data Data Source Rainfall Rain State County Return Rainfall Rainfall
ID Source ID Type Units Period Depth Distribution(years) (inches)
1 100-Year Time Series 100-Year Storm Cumulative inches User Defined2 10-Year Time Series 10-Year Storm Cumulative inches Massachusetts Franklin 10 4.36 SCS Type III 24-hr3 1-Year Time Series 1-Year Storm Cumulative inches User Defined4 25-Year Time Series 25-Year Storm Cumulative inches Massachusetts Franklin 25 5.36 SCS Type III 24-hr5 50-Year Time Series 50-Year Storm Cumulative inches Massachusetts Franklin 50 6.28 SCS Type III 24-hr6 5-Year Time Series 5-Year Storm Cumulative inches Massachusetts Franklin 5 3.72 SCS Type III 24-hr
Outlets .....................................................Pollutants .........................................................Land Uses ........................................................
Links.................................................................. Channels ................................................. Pipes ........................................................ Pumps ..................................................... Orifices .................................................... Weirs .......................................................
Nodes................................................................ Junctions ................................................. Outfalls .................................................... Flow Diversions ....................................... Inlets ........................................................ Storage Nodes .........................................
Runoff (Dry Weather) Time Step .....................Runoff (Wet Weather) Time Step ....................Reporting Time Step ........................................Routing Time Step ...........................................
Rain Gages ......................................................Subbasins.........................................................
Enable Overflow Ponding at Nodes .................Skip Steady State Analysis Time Periods ........
Start Analysis On .............................................End Analysis On ...............................................Start Reporting On ...........................................Antecedent Dry Days .......................................
File Name .........................................................
Flow Units ........................................................Elevation Type .................................................Hydrology Method ............................................Time of Concentration (TOC) Method .............Link Routing Method ........................................

Subbasin SummarySN Subbasin Area Weighted Total Total Total Peak Time of
ID Curve Rainfall Runoff Runoff Runoff ConcentrationNumber Volume
(ac) (in) (in) (ac-in) (cfs) (days hh:mm:ss)1 BptstCrnr_Culvert 262.40 67.68 5.36 2.11 554.71 229.01 0 01:12:05

Subbasin Hydrology
Subbasin : BptstCrnr_Culvert
Input Data
Area (ac) ........................................................................ 262.40Weighted Curve Number ............................................... 67.68Rain Gage ID ................................................................. 25-Year
Composite Curve Number Area Soil CurveSoil/Surface Description (acres) Group NumberWoods, Fair 131.20 B 60.00Woods, Fair 65.60 D 79.00Woods, Fair 10.50 A 36.00Woods, Poor 13.12 D 83.002 acre lots, 12% impervious 26.24 D 82.00Pasture, grassland, or range, Fair 15.74 B 69.00Composite Area & Weighted CN 262.40 67.68
Time of Concentration
TOC Method : SCS TR-55
Sheet Flow Equation :
Tc = (0.007 * ((n * Lf)^0.8)) / ((P^0.5) * (Sf^0.4))
Where :
Tc = Time of Concentration (hr) n = Manning's roughness Lf = Flow Length (ft) P = 2 yr, 24 hr Rainfall (inches) Sf = Slope (ft/ft)
Shallow Concentrated Flow Equation :
V = 16.1345 * (Sf^0.5) (unpaved surface) V = 20.3282 * (Sf^0.5) (paved surface) V = 15.0 * (Sf^0.5) (grassed waterway surface) V = 10.0 * (Sf^0.5) (nearly bare & untilled surface) V = 9.0 * (Sf^0.5) (cultivated straight rows surface) V = 7.0 * (Sf^0.5) (short grass pasture surface) V = 5.0 * (Sf^0.5) (woodland surface) V = 2.5 * (Sf^0.5) (forest w/heavy litter surface) Tc = (Lf / V) / (3600 sec/hr)
Where:
Tc = Time of Concentration (hr) Lf = Flow Length (ft) V = Velocity (ft/sec) Sf = Slope (ft/ft)
Channel Flow Equation :
V = (1.49 * (R^(2/3)) * (Sf^0.5)) / n R = Aq / Wp Tc = (Lf / V) / (3600 sec/hr)
Where :
Tc = Time of Concentration (hr) Lf = Flow Length (ft) R = Hydraulic Radius (ft) Aq = Flow Area (ft²) Wp = Wetted Perimeter (ft) V = Velocity (ft/sec) Sf = Slope (ft/ft) n = Manning's roughness
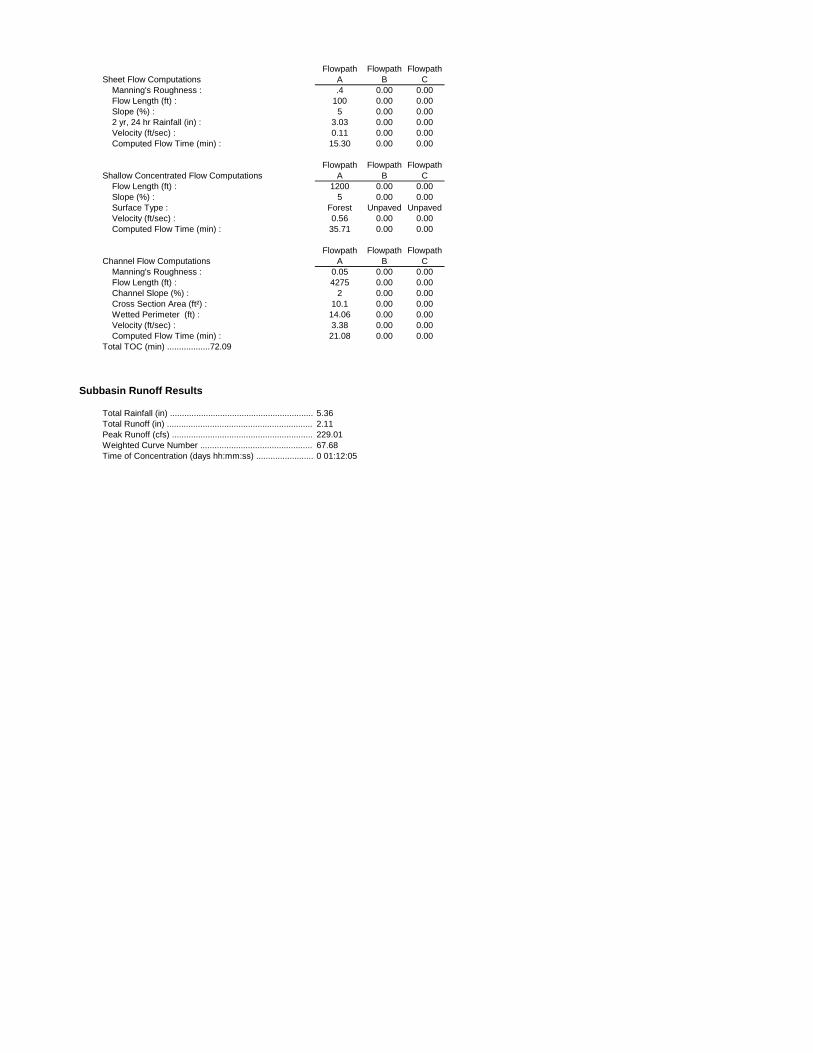
Flowpath Flowpath FlowpathSheet Flow Computations A B C Manning's Roughness : .4 0.00 0.00 Flow Length (ft) : 100 0.00 0.00 Slope (%) : 5 0.00 0.00 2 yr, 24 hr Rainfall (in) : 3.03 0.00 0.00 Velocity (ft/sec) : 0.11 0.00 0.00 Computed Flow Time (min) : 15.30 0.00 0.00
Flowpath Flowpath FlowpathShallow Concentrated Flow Computations A B C Flow Length (ft) : 1200 0.00 0.00 Slope (%) : 5 0.00 0.00 Surface Type : Forest Unpaved Unpaved Velocity (ft/sec) : 0.56 0.00 0.00 Computed Flow Time (min) : 35.71 0.00 0.00
Flowpath Flowpath FlowpathChannel Flow Computations A B C Manning's Roughness : 0.05 0.00 0.00 Flow Length (ft) : 4275 0.00 0.00 Channel Slope (%) : 2 0.00 0.00 Cross Section Area (ft²) : 10.1 0.00 0.00 Wetted Perimeter (ft) : 14.06 0.00 0.00 Velocity (ft/sec) : 3.38 0.00 0.00 Computed Flow Time (min) : 21.08 0.00 0.00Total TOC (min) ..................72.09
Subbasin Runoff Results
Total Rainfall (in) ............................................................ 5.36Total Runoff (in) ............................................................. 2.11Peak Runoff (cfs) ........................................................... 229.01Weighted Curve Number ............................................... 67.68Time of Concentration (days hh:mm:ss) ........................ 0 01:12:05

Subbasin : BptstCrnr_Culvert

50-Year Storm Event

Project DescriptionAshfield-Baptist_Corner_Rd.SPF
Project OptionsCFSElevationSCS TR-55SCS TR-55HydrodynamicYESYES
Analysis OptionsJul 17, 2013 00:00:00Jul 18, 2013 00:00:00Jul 17, 2013 00:00:000 days0 01:00:00 days hh:mm:ss0 00:05:00 days hh:mm:ss0 00:05:00 days hh:mm:ss30 seconds
Number of ElementsQty61101000000000000
Rainfall DetailsSN Rain Gage Data Data Source Rainfall Rain State County Return Rainfall Rainfall
ID Source ID Type Units Period Depth Distribution(years) (inches)
1 100-Year Time Series 100-Year Storm Cumulative inches User Defined2 10-Year Time Series 10-Year Storm Cumulative inches Massachusetts Franklin 10 4.36 SCS Type III 24-hr3 1-Year Time Series 1-Year Storm Cumulative inches User Defined4 25-Year Time Series 25-Year Storm Cumulative inches Massachusetts Franklin 25 5.36 SCS Type III 24-hr5 50-Year Time Series 50-Year Storm Cumulative inches Massachusetts Franklin 50 6.28 SCS Type III 24-hr6 5-Year Time Series 5-Year Storm Cumulative inches Massachusetts Franklin 5 3.72 SCS Type III 24-hr
Outlets .....................................................Pollutants .........................................................Land Uses ........................................................
Links.................................................................. Channels ................................................. Pipes ........................................................ Pumps ..................................................... Orifices .................................................... Weirs .......................................................
Nodes................................................................ Junctions ................................................. Outfalls .................................................... Flow Diversions ....................................... Inlets ........................................................ Storage Nodes .........................................
Runoff (Dry Weather) Time Step .....................Runoff (Wet Weather) Time Step ....................Reporting Time Step ........................................Routing Time Step ...........................................
Rain Gages ......................................................Subbasins.........................................................
Enable Overflow Ponding at Nodes .................Skip Steady State Analysis Time Periods ........
Start Analysis On .............................................End Analysis On ...............................................Start Reporting On ...........................................Antecedent Dry Days .......................................
File Name .........................................................
Flow Units ........................................................Elevation Type .................................................Hydrology Method ............................................Time of Concentration (TOC) Method .............Link Routing Method ........................................

Subbasin SummarySN Subbasin Area Weighted Total Total Total Peak Time of
ID Curve Rainfall Runoff Runoff Runoff ConcentrationNumber Volume
(ac) (in) (in) (ac-in) (cfs) (days hh:mm:ss)1 BptstCrnr_Culvert 262.40 67.68 6.28 2.81 736.56 309.40 0 01:12:05

Subbasin Hydrology
Subbasin : BptstCrnr_Culvert
Input Data
Area (ac) ........................................................................ 262.40Weighted Curve Number ............................................... 67.68Rain Gage ID ................................................................. 50-Year
Composite Curve Number Area Soil CurveSoil/Surface Description (acres) Group NumberWoods, Fair 131.20 B 60.00Woods, Fair 65.60 D 79.00Woods, Fair 10.50 A 36.00Woods, Poor 13.12 D 83.002 acre lots, 12% impervious 26.24 D 82.00Pasture, grassland, or range, Fair 15.74 B 69.00Composite Area & Weighted CN 262.40 67.68
Time of Concentration
TOC Method : SCS TR-55
Sheet Flow Equation :
Tc = (0.007 * ((n * Lf)^0.8)) / ((P^0.5) * (Sf^0.4))
Where :
Tc = Time of Concentration (hr) n = Manning's roughness Lf = Flow Length (ft) P = 2 yr, 24 hr Rainfall (inches) Sf = Slope (ft/ft)
Shallow Concentrated Flow Equation :
V = 16.1345 * (Sf^0.5) (unpaved surface) V = 20.3282 * (Sf^0.5) (paved surface) V = 15.0 * (Sf^0.5) (grassed waterway surface) V = 10.0 * (Sf^0.5) (nearly bare & untilled surface) V = 9.0 * (Sf^0.5) (cultivated straight rows surface) V = 7.0 * (Sf^0.5) (short grass pasture surface) V = 5.0 * (Sf^0.5) (woodland surface) V = 2.5 * (Sf^0.5) (forest w/heavy litter surface) Tc = (Lf / V) / (3600 sec/hr)
Where:
Tc = Time of Concentration (hr) Lf = Flow Length (ft) V = Velocity (ft/sec) Sf = Slope (ft/ft)
Channel Flow Equation :
V = (1.49 * (R^(2/3)) * (Sf^0.5)) / n R = Aq / Wp Tc = (Lf / V) / (3600 sec/hr)
Where :
Tc = Time of Concentration (hr) Lf = Flow Length (ft) R = Hydraulic Radius (ft) Aq = Flow Area (ft²) Wp = Wetted Perimeter (ft) V = Velocity (ft/sec) Sf = Slope (ft/ft) n = Manning's roughness

Flowpath Flowpath FlowpathSheet Flow Computations A B C Manning's Roughness : .4 0.00 0.00 Flow Length (ft) : 100 0.00 0.00 Slope (%) : 5 0.00 0.00 2 yr, 24 hr Rainfall (in) : 3.03 0.00 0.00 Velocity (ft/sec) : 0.11 0.00 0.00 Computed Flow Time (min) : 15.30 0.00 0.00
Flowpath Flowpath FlowpathShallow Concentrated Flow Computations A B C Flow Length (ft) : 1200 0.00 0.00 Slope (%) : 5 0.00 0.00 Surface Type : Forest Unpaved Unpaved Velocity (ft/sec) : 0.56 0.00 0.00 Computed Flow Time (min) : 35.71 0.00 0.00
Flowpath Flowpath FlowpathChannel Flow Computations A B C Manning's Roughness : 0.05 0.00 0.00 Flow Length (ft) : 4275 0.00 0.00 Channel Slope (%) : 2 0.00 0.00 Cross Section Area (ft²) : 10.1 0.00 0.00 Wetted Perimeter (ft) : 14.06 0.00 0.00 Velocity (ft/sec) : 3.38 0.00 0.00 Computed Flow Time (min) : 21.08 0.00 0.00Total TOC (min) ..................72.09
Subbasin Runoff Results
Total Rainfall (in) ............................................................ 6.28Total Runoff (in) ............................................................. 2.81Peak Runoff (cfs) ........................................................... 309.40Weighted Curve Number ............................................... 67.68Time of Concentration (days hh:mm:ss) ........................ 0 01:12:05

Subbasin : BptstCrnr_Culvert

100-Year Storm Event

Project DescriptionAshfield-Baptist_Corner_Rd.SPF
Project OptionsCFSElevationSCS TR-55SCS TR-55HydrodynamicYESYES
Analysis OptionsJul 17, 2013 00:00:00Jul 18, 2013 00:00:00Jul 17, 2013 00:00:000 days0 01:00:00 days hh:mm:ss0 00:05:00 days hh:mm:ss0 00:05:00 days hh:mm:ss30 seconds
Number of ElementsQty61101000000000000
Rainfall DetailsSN Rain Gage Data Data Source Rainfall Rain State County Return Rainfall Rainfall
ID Source ID Type Units Period Depth Distribution(years) (inches)
1 100-Year Time Series 100-Year Storm Cumulative inches User Defined2 10-Year Time Series 10-Year Storm Cumulative inches Massachusetts Franklin 10 4.36 SCS Type III 24-hr3 1-Year Time Series 1-Year Storm Cumulative inches User Defined4 25-Year Time Series 25-Year Storm Cumulative inches Massachusetts Franklin 25 5.36 SCS Type III 24-hr5 50-Year Time Series 50-Year Storm Cumulative inches Massachusetts Franklin 50 6.28 SCS Type III 24-hr6 5-Year Time Series 5-Year Storm Cumulative inches Massachusetts Franklin 5 3.72 SCS Type III 24-hr
Outlets .....................................................Pollutants .........................................................Land Uses ........................................................
Links.................................................................. Channels ................................................. Pipes ........................................................ Pumps ..................................................... Orifices .................................................... Weirs .......................................................
Nodes................................................................ Junctions ................................................. Outfalls .................................................... Flow Diversions ....................................... Inlets ........................................................ Storage Nodes .........................................
Runoff (Dry Weather) Time Step .....................Runoff (Wet Weather) Time Step ....................Reporting Time Step ........................................Routing Time Step ...........................................
Rain Gages ......................................................Subbasins.........................................................
Enable Overflow Ponding at Nodes .................Skip Steady State Analysis Time Periods ........
Start Analysis On .............................................End Analysis On ...............................................Start Reporting On ...........................................Antecedent Dry Days .......................................
File Name .........................................................
Flow Units ........................................................Elevation Type .................................................Hydrology Method ............................................Time of Concentration (TOC) Method .............Link Routing Method ........................................

Subbasin SummarySN Subbasin Area Weighted Total Total Total Peak Time of
ID Curve Rainfall Runoff Runoff Runoff ConcentrationNumber Volume
(ac) (in) (in) (ac-in) (cfs) (days hh:mm:ss)1 BptstCrnr_Culvert 262.40 67.68 7.37 3.68 964.84 408.50 0 01:12:05

Subbasin Hydrology
Subbasin : BptstCrnr_Culvert
Input Data
Area (ac) ........................................................................ 262.40Weighted Curve Number ............................................... 67.68Rain Gage ID ................................................................. 100-Year
Composite Curve Number Area Soil CurveSoil/Surface Description (acres) Group NumberWoods, Fair 131.20 B 60.00Woods, Fair 65.60 D 79.00Woods, Fair 10.50 A 36.00Woods, Poor 13.12 D 83.002 acre lots, 12% impervious 26.24 D 82.00Pasture, grassland, or range, Fair 15.74 B 69.00Composite Area & Weighted CN 262.40 67.68
Time of Concentration
TOC Method : SCS TR-55
Sheet Flow Equation :
Tc = (0.007 * ((n * Lf)^0.8)) / ((P^0.5) * (Sf^0.4))
Where :
Tc = Time of Concentration (hr) n = Manning's roughness Lf = Flow Length (ft) P = 2 yr, 24 hr Rainfall (inches) Sf = Slope (ft/ft)
Shallow Concentrated Flow Equation :
V = 16.1345 * (Sf^0.5) (unpaved surface) V = 20.3282 * (Sf^0.5) (paved surface) V = 15.0 * (Sf^0.5) (grassed waterway surface) V = 10.0 * (Sf^0.5) (nearly bare & untilled surface) V = 9.0 * (Sf^0.5) (cultivated straight rows surface) V = 7.0 * (Sf^0.5) (short grass pasture surface) V = 5.0 * (Sf^0.5) (woodland surface) V = 2.5 * (Sf^0.5) (forest w/heavy litter surface) Tc = (Lf / V) / (3600 sec/hr)
Where:
Tc = Time of Concentration (hr) Lf = Flow Length (ft) V = Velocity (ft/sec) Sf = Slope (ft/ft)
Channel Flow Equation :
V = (1.49 * (R^(2/3)) * (Sf^0.5)) / n R = Aq / Wp Tc = (Lf / V) / (3600 sec/hr)
Where :
Tc = Time of Concentration (hr) Lf = Flow Length (ft) R = Hydraulic Radius (ft) Aq = Flow Area (ft²) Wp = Wetted Perimeter (ft) V = Velocity (ft/sec) Sf = Slope (ft/ft) n = Manning's roughness

Flowpath Flowpath FlowpathSheet Flow Computations A B C Manning's Roughness : .4 0.00 0.00 Flow Length (ft) : 100 0.00 0.00 Slope (%) : 5 0.00 0.00 2 yr, 24 hr Rainfall (in) : 3.03 0.00 0.00 Velocity (ft/sec) : 0.11 0.00 0.00 Computed Flow Time (min) : 15.30 0.00 0.00
Flowpath Flowpath FlowpathShallow Concentrated Flow Computations A B C Flow Length (ft) : 1200 0.00 0.00 Slope (%) : 5 0.00 0.00 Surface Type : Forest Unpaved Unpaved Velocity (ft/sec) : 0.56 0.00 0.00 Computed Flow Time (min) : 35.71 0.00 0.00
Flowpath Flowpath FlowpathChannel Flow Computations A B C Manning's Roughness : 0.05 0.00 0.00 Flow Length (ft) : 4275 0.00 0.00 Channel Slope (%) : 2 0.00 0.00 Cross Section Area (ft²) : 10.1 0.00 0.00 Wetted Perimeter (ft) : 14.06 0.00 0.00 Velocity (ft/sec) : 3.38 0.00 0.00 Computed Flow Time (min) : 21.08 0.00 0.00Total TOC (min) ..................72.09
Subbasin Runoff Results
Total Rainfall (in) ............................................................ 7.37Total Runoff (in) ............................................................. 3.68Peak Runoff (cfs) ........................................................... 408.50Weighted Curve Number ............................................... 67.68Time of Concentration (days hh:mm:ss) ........................ 0 01:12:05
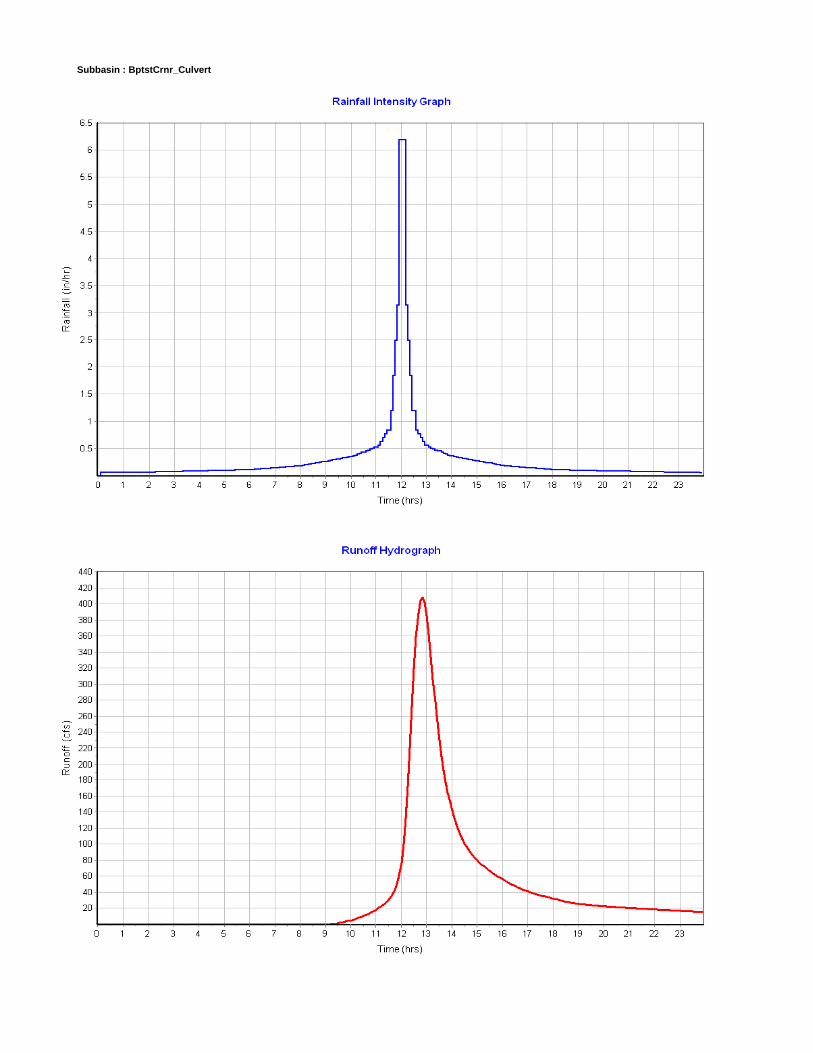
Subbasin : BptstCrnr_Culvert

Ashfield, MA – Baptist Corner Road DER – Technical Report
Appendix G
Hydraulic Computations

Project:
Culvert Inlet Invert Culvert Outlet Invert Inlet Low Chord Elev. Roadway Cover (ft)
989.61 987.86 994.61 9.7
Upstream of Culvert Downstream of Culvert Upstream of Culvert Downstream of Culvert
1‐Year 991.93 985.76 1.49 14.32
5‐Year 994.22 987.49 1.63 7.13
10‐Year 995.46 987.99 1.69 7.70
25‐Year 998.04 988.62 1.57 8.67
50‐Year 1002.31 989.16 1.27 9.43
100‐Year 1005.38 989.75 1.30 10.22
Culvert Inlet Invert Culvert Outlet Invert Inlet Low Chord Elev. Roadway Cover (ft)
989.61 987.86 995.61 7.9
Upstream of Culvert Downstream of Culvert Upstream of Culvert Downstream of Culvert
1‐Year 990.53 988.47 2.73 4.27
5‐Year 991.39 989.18 4.32 6.09
10‐Year 991.79 989.52 4.98 6.87
25‐Year 992.39 990.02 5.77 7.81
50‐Year 992.98 990.46 6.22 8.55
100‐Year 993.66 990.93 6.60 9.30
Culvert Inlet Invert Culvert Outlet Invert Inlet Low Chord Elev. Roadway Cover (ft)
989.61 987.86 998.11 5.7
Upstream of Culvert Downstream of Culvert Upstream of Culvert Downstream of Culvert
1‐Year 990.53 988.47 2.73 4.27
5‐Year 991.39 989.18 4.33 6.09
10‐Year 991.79 989.52 5.00 6.88
25‐Year 992.46 990.02 5.64 7.85
50‐Year 993.10 990.46 6.01 8.59
100‐Year 993.86 990.94 6.27 9.33
Culvert Inlet Invert Culvert Outlet Invert Inlet Low Chord Elev. Roadway Cover (ft)
989.61 987.86 999.11 5.2
Upstream of Culvert Downstream of Culvert Upstream of Culvert Downstream of Culvert
1‐Year 990.53 988.47 2.73 4.27
5‐Year 991.39 989.18 4.32 6.09
10‐Year 991.79 989.52 4.98 6.87
25‐Year 992.42 990.02 5.71 7.81
50‐Year 993.04 990.46 6.10 8.55
100‐Year 993.77 990.93 6.40 9.30
Culvert Inlet Invert Culvert Outlet Invert Inlet Low Chord Elev. Roadway Cover (ft)
989.61 987.86 1002.00 2.5
Upstream of Culvert Downstream of Culvert Upstream of Culvert Downstream of Culvert
1‐Year 990.51 988.47 2.80 4.27
5‐Year 991.37 989.19 4.36 6.09
10‐Year 991.77 989.52 4.99 6.83
25‐Year 992.37 990.03 5.76 7.71
50‐Year 992.94 990.45 6.21 8.46
100‐Year 993.61 990.91 6.61 9.23
Storm
Event
Storm
Event
Storm
Event
Proposed 24' Span Steel Stringer Bridge
Peak Flow Velocity (ft/sec)Peak Water Surface Elevation (feet)
Proposed 19' Span by 9'‐6" Rise Metal Arch
Peak Water Surface Elevation (feet) Peak Flow Velocity (ft/sec)
Existing 5' Diameter CMP
Storm
Event
Ashfield, MA ‐ Baptist Corner Road
Culvert Analysis at Unnamed Tributary to Bear River
Proposed 19' Span by 8'‐6" Rise Concrete Arch
Peak Water Surface Elevation (feet) Peak Flow Velocity (ft/sec)
Proposed 19' Span by 10.4' Rise Concrete Box Culvert (Embedded 4.4‐feet)
Peak Water Surface Elevation (feet) Peak Flow Velocity (ft/sec)Storm
Event
Peak Water Surface Elevation (feet) Peak Flow Velocity (ft/sec)

Ashfield, MA – Baptist Corner Road DER – Technical Report
Appendix H
VAP Calculation