Long Term Culture of the A549 Cancer Cell Line Promotes ...
20
RESEARCH ARTICLE Long Term Culture of the A549 Cancer Cell Line Promotes Multilamellar Body Formation and Differentiation towards an Alveolar Type II Pneumocyte Phenotype James Ross Cooper 1,2 *, Muhammad Bilal Abdullatif 3 , Edward C. Burnett 1 , Karen E. Kempsell 3 , Franco Conforti 2 , Howard Tolley 5 , Jane E. Collins 2 , Donna E. Davies 2,4 1 Public Health England, Culture Collections, Porton Down, Salisbury, Wiltshire, United Kingdom, 2 Academic Unit of Clinical and Experimental Sciences, Sir Henry Wellcome Laboratories, University of Southampton Faculty of Medicine, University Hospital Southampton, United Kingdom, 3 Public Health England, Diagnostic Technologies, Porton Down, Salisbury, Wiltshire, United Kingdom, 4 National Institute for Health Research, Respiratory Biomedical Research Unit, University Hospital Southampton, Southampton, United Kingdom, 5 Public Health England, Microbiology Services, Porton Down, Salisbury, Wiltshire, United Kingdom * [email protected] Abstract Pulmonary research requires models that represent the physiology of alveolar epithelium but concerns with reproducibility, consistency and the technical and ethical challenges of using primary or stem cells has resulted in widespread use of continuous cancer or other immortalized cell lines. The A549 ‘alveolar’ cell line has been available for over four decades but there is an inconsistent view as to its suitability as an appropriate model for pri- mary alveolar type II (ATII) cells. Since most work with A549 cells involves short term cul- ture of proliferating cells, we postulated that culture conditions that reduced proliferation of the cancer cells would promote a more differentiated ATII cell phenotype. We examined A549 cell growth in different media over long term culture and then used microarray analy- sis to investigate temporal regulation of pathways involved in cell cycle and ATII differentia- tion; we also made comparisons with gene expression in freshly isolated human ATII cells. Analyses indicated that long term culture in Ham’s F12 resulted in substantial modulation of cell cycle genes to result in a quiescent population of cells with significant up-regulation of autophagic, differentiation and lipidogenic pathways. There were also increased numbers of up- and down-regulated genes shared with primary cells suggesting adoption of ATII characteristics and multilamellar body (MLB) development. Subsequent Oil Red-O staining and Transmission Electron Microscopy confirmed MLB expression in the differentiated A549 cells. This work defines a set of conditions for promoting ATII differentiation charac- teristics in A549 cells that may be advantageous for studies with this cell line. PLOS ONE | DOI:10.1371/journal.pone.0164438 October 28, 2016 1 / 20 a11111 OPEN ACCESS Citation: Cooper JR, Abdullatif MB, Burnett EC, Kempsell KE, Conforti F, Tolley H, et al. (2016) Long Term Culture of the A549 Cancer Cell Line Promotes Multilamellar Body Formation and Differentiation towards an Alveolar Type II Pneumocyte Phenotype. PLoS ONE 11(10): e0164438. doi:10.1371/journal.pone.0164438 Editor: Francesco Cappello, University of Palermo, ITALY Received: May 24, 2016 Accepted: September 26, 2016 Published: October 28, 2016 Copyright: © 2016 Cooper et al. This is an open access article distributed under the terms of the Creative Commons Attribution License, which permits unrestricted use, distribution, and reproduction in any medium, provided the original author and source are credited. Data Availability Statement: Microarray data files used to generate this publication have now been uploaded, approved and accepted by the NCBI as part of the Gene Expression Omnibus (GEO). The full data series has the GEO accession number GSE88881 and will be available from the following link: http://www.ncbi.nlm.nih.gov/geo/query/acc. cgi?acc=GSE88881. There are also two subsets of data: http://www.ncbi.nlm.nih.gov/geo/query/acc. cgi?acc=GSE88879 and http://www.ncbi.nlm.nih. gov/geo/query/acc.cgi?acc=GSE88880. The
Transcript of Long Term Culture of the A549 Cancer Cell Line Promotes ...
RESEARCH ARTICLE
Long Term Culture of the A549 Cancer Cell
Line Promotes Multilamellar Body Formation
and Differentiation towards an Alveolar
Type II Pneumocyte Phenotype
James Ross Cooper1,2*, Muhammad Bilal Abdullatif3, Edward C. Burnett1, Karen
E. Kempsell3, Franco Conforti2, Howard Tolley5, Jane E. Collins2, Donna E. Davies2,4
1 Public Health England, Culture Collections, Porton Down, Salisbury, Wiltshire, United Kingdom,
2 Academic Unit of Clinical and Experimental Sciences, Sir Henry Wellcome Laboratories, University of
Southampton Faculty of Medicine, University Hospital Southampton, United Kingdom, 3 Public Health
England, Diagnostic Technologies, Porton Down, Salisbury, Wiltshire, United Kingdom, 4 National Institute
for Health Research, Respiratory Biomedical Research Unit, University Hospital Southampton,
Southampton, United Kingdom, 5 Public Health England, Microbiology Services, Porton Down, Salisbury,
Wiltshire, United Kingdom
Abstract
Pulmonary research requires models that represent the physiology of alveolar epithelium
but concerns with reproducibility, consistency and the technical and ethical challenges of
using primary or stem cells has resulted in widespread use of continuous cancer or other
immortalized cell lines. The A549 ‘alveolar’ cell line has been available for over four
decades but there is an inconsistent view as to its suitability as an appropriate model for pri-
mary alveolar type II (ATII) cells. Since most work with A549 cells involves short term cul-
ture of proliferating cells, we postulated that culture conditions that reduced proliferation of
the cancer cells would promote a more differentiated ATII cell phenotype. We examined
A549 cell growth in different media over long term culture and then used microarray analy-
sis to investigate temporal regulation of pathways involved in cell cycle and ATII differentia-
tion; we also made comparisons with gene expression in freshly isolated human ATII cells.
Analyses indicated that long term culture in Ham’s F12 resulted in substantial modulation of
cell cycle genes to result in a quiescent population of cells with significant up-regulation of
autophagic, differentiation and lipidogenic pathways. There were also increased numbers
of up- and down-regulated genes shared with primary cells suggesting adoption of ATII
characteristics and multilamellar body (MLB) development. Subsequent Oil Red-O staining
and Transmission Electron Microscopy confirmed MLB expression in the differentiated
A549 cells. This work defines a set of conditions for promoting ATII differentiation charac-
teristics in A549 cells that may be advantageous for studies with this cell line.
PLOS ONE | DOI:10.1371/journal.pone.0164438 October 28, 2016 1 / 20
a11111
OPENACCESS
Citation: Cooper JR, Abdullatif MB, Burnett EC,
Kempsell KE, Conforti F, Tolley H, et al. (2016)
Long Term Culture of the A549 Cancer Cell Line
Promotes Multilamellar Body Formation and
Differentiation towards an Alveolar Type II
Pneumocyte Phenotype. PLoS ONE 11(10):
e0164438. doi:10.1371/journal.pone.0164438
Editor: Francesco Cappello, University of Palermo,
ITALY
Received: May 24, 2016
Accepted: September 26, 2016
Published: October 28, 2016
Copyright: © 2016 Cooper et al. This is an open
access article distributed under the terms of the
Creative Commons Attribution License, which
permits unrestricted use, distribution, and
reproduction in any medium, provided the original
author and source are credited.
Data Availability Statement: Microarray data files
used to generate this publication have now been
uploaded, approved and accepted by the NCBI as
part of the Gene Expression Omnibus (GEO). The
full data series has the GEO accession number
GSE88881 and will be available from the following
link: http://www.ncbi.nlm.nih.gov/geo/query/acc.
cgi?acc=GSE88881. There are also two subsets of
data: http://www.ncbi.nlm.nih.gov/geo/query/acc.
cgi?acc=GSE88879 and http://www.ncbi.nlm.nih.
gov/geo/query/acc.cgi?acc=GSE88880. The
Introduction
Alveolar Type 1 (ATI) and 2 (ATII) cells are specialised epithelial cells of the distal lung. ATIcells are flattened squamous cells that cover around 95% of the alveolar surface and lie adjacentto capillary endothelial cells to form the pulmonary gas exchange region. ATII cells have acompact morphology and cover the remaining 5% of the alveolar surface. Unlike terminallydifferentiated and-non replicative ATI cells, ATII cells have multiple roles and have beendescribed as the ‘defenders of the alveolus’[1,2]. The ultrastructural hallmark of ATII cells isthe expression of multilamellar bodies (MLB)[3] containing dipalmitoylphosphatidyl choline(DPCC), the major lipid component of pulmonary surfactant that reduces surface tension inthe alveoli to prevent collapse of the lungs at the end of expiration. ATII cells play an importantrole in innate immune responses within the lung with evidence that lung surfactant proteinshave anti-microbial effects and reduce inflammation caused by the inhalation of irritants. ATIIcells also help clear alveolar fluid through active sodium transport and they act as self-renewingprogenitors to replace ATI cells that have been damaged[4] to maintain normal lung architec-ture[5–7].
Research into alveolar physiology and pathologies relevant to acute lung injury[8,9], anddiseases such as chronic obstructive pulmonary disease (COPD)[10,11] and interstitial lungdiseases such as idiopathic pulmonary fibrosis[12–15] requires in vitro models that representand mimic the alveolar epithelium, in particular the ATII cell. Primary ATII cell cultures arecurrently considered to be the most useful in vitro model for alveolar research, however theyare limited by tissue availability which requires ethical approval and patient consent for accessto histologically normal regions of resected lung tissue surplus to requirement for diagnosis oflung carcinoma [16,17]. While these cells are useful in short term culture, they spontaneouslydifferentiate to the ATI phenotype over 1–2 weeks[18]. Recent developments have promisedthe potential of alveolar models from human embryonic stem cells[19], mesenchymal stemcells[20] and induced pluripotent stem cells[21,22], however technical difficulties and issuespresented by these systems have limited their widespread uptake and use. As a consequence,there is still considerable reliance and widespread use of authentic[23] continuous cancer orother immortalized cell lines. Sometimes these cell lines are derived by retroviral transduction,as has been demonstrated with mammary and endothelial tissues[24], but more commonlythey have been derived from tumours—often many decades previously. These continuous celllines have the major advantage of ease of cultivation, reproducibility and relatively unlimitedsupply. However, although they can maintain a stable phenotype through many subcultures ifproperly maintained[25], this phenotype exhibits differences compared to the original tissue,compromising their ability to fully reproduce in vivo physiological state. Often their use is atrade-off of ‘ease of use’ against suitability, as the cells typically retain features more associatedto the original tumour, including uncontrolled proliferative growth and a de-differentiatedphenotype. One such commonly used cell model is the lung carcinoma cell line A549. Isolatedin 1973 from a pulmonary adenocarcinoma[26] and subsequently characterized as being repre-sentative of ATII cells[3,27–29], this cell line has been a mainstay of respiratory research fornearly four decades. However while work with early passage A549 cells provided evidence oftheir ability to exhibit features of an ATII epithelial cell phenotype[27–29], more recent studieshave led to conflicting results[30,31]. Based on early work with A549 cells which reported thatextended culture resulted in cellular ‘differentiation’, as evidenced by high numbers of MLB[3,32], we tested the hypothesis that culture conditions that reduce proliferation of the A549cell line would promote a more differentiated ATII cell phenotype, as evidenced by mRNAgene expression profiling over time, by comparison with primary cultures of ATII cells and byhistological and ultrastructural analysis.
Differentiation of A549 Cells by Long Term Culture
PLOS ONE | DOI:10.1371/journal.pone.0164438 October 28, 2016 2 / 20
citation for the GEO database is as follows: Edgar
R, Domrachev M, Lash AE. Gene Expression
Omnibus: NCBI gene expression and hybridization
array data repository Nucleic Acids Res. 2002 Jan
1;30(1):207-10.
Funding: This study was funded by the Pipeline
Funding Board of Public Health England (PHE) (at
that time the organization was known as the Health
Protection Agency (HPA)) as part of its 2012/13
call to fund studies which had the potential to aid
life science research. The original bid title was: "Use
of microarray analysis in the characterisation of
HPACC cell lines for the presence of cell
biomarkers". PHE like its predecessor HPA is an
executive agency sponsored by the Department of
Health (England). The funding was awarded to Dr
Edward Burnett of the Culture Collections of PHE; a
not for profit Bio-Resource within the PHE National
Infections Service (NIS). Five of the authors
(James R Cooper, Muhammad Abdullatif, Edward
C Burnett, Karen E Kempsell and Howard Tolley)
were employed by HPA/PHE during the study but
they were not and never have been members of the
Pipeline Funding Board. The HPA/PHE Pipeline
Funding Board had no role in study design, data
collection and analysis, decision to publish, or
preparation of the manuscript. Dr Franco Confort’s
contribution was funded by the British Lung
Foundation reference number IPFPG12-2.
Competing Interests: Public Health England, the
primary funder of this work and employer of five of
the authors is a "not for profit" supplier of the
subject of the manuscript: the A549 Cell Line. The
authors have declared that no other competing
interests exist. This does not alter our adherence to
PLOS ONE policies on sharing data and materials.
Materials and Methods
Cell Culture
Authentic A549 cells (European Collection of Cell Cultures (ECACC), Salisbury, UK), cata-logue number 86012804, were cultured in either Ham’s F12 Nutrient Medium (Ham’s F12) orDulbecco’s Modified Eagles Medium (DMEM) (both from Sigma Aldrich, Dorset, UnitedKingdom) supplemented with 2mM L-Glutamine and 10% v/v Foetal Bovine Serum (FBS)(Hyclone SH30071.03 (Hyclone Laboratories, Utah, USA). Proliferative cultures were incu-bated at 37°C in a humidified 5% CO2 incubator and subculture carried out by washing the cellmonolayers twice with calcium and magnesium-free phosphate buffered saline (PBS) (SevernBiotech (Kidderminster, UK, catalogue number 20–74) followed by addition of 1x Trypsin/EDTA solution (Sigma Aldrich) and incubation at 37°C until the cells detached. Trypsin wasinactivated by the addition of growth medium before seeding into fresh flasks at densities of1.5-2x10⁴ cells/cm2. For the long term 25 day cultures A549 cells were seeded into replicateT25 flasks and medium changed every 2–4 days. Phase contrast images were captured of themonolayers throughout the time course. Cell numbers, viability and size were assessed by Try-pan Blue staining and by DAPI dye exclusion using the Nucleocounter™ 3000 viability assay(Chemometec, Allerod, Denmark).
RNA Extraction
Cells were harvested using trypsin/EDTA, counted and washed with PBS by centrifugation at500g for 5 minutes and snap frozen in pellets of 1.5 x 10⁶ cells before storage at -80°C prior toRNA extraction. RNA was extracted using the Promega Maxwell1 Low Elution Volume (LEV)Simply RNA Cell kit according to the manufacturer’s instructions. In brief 16 samples wereprocessed at a time. Pellets were thawed rapidly and as briefly as possible in a 37°C water-bath,transferred to wet ice where 200μl of homogenisation solution was added to each sample andvortexed to mix before the addition of 200 μl of lysis solution and another vortex mix prior toloading into the Maxwell1 cassettes. DNAse was added to remove contaminating genomicDNA. RNA was eluted into 50μl of nuclease free water and supplemented with RNAse inhibi-tor (“Superase In™”, Ambion, Life Technologies, Paisley, UK) before being quantified by spec-trophotometry (Nanodrop, Labtech International, Uckfield East Sussex UK) and analyzed byelectrophoresis in a 1.4% agarose (Sigma Aldrich) gel and visualised using Ethidium Bromideand UV illumination to ensure there were intact 18S and 28S bands. Extracted RNA was storedat -80°C before RNA microarray analysis prior to which repeat assessment of RNA integritywas carried out using a bio-analyzer (BioAnalyzer 2100, Agilent Technologies, Santa Clara,USA).
Primary ATII Cells
Primary ATII cells were isolated by protease digestion and selective adherence according topublished protocols[16] and the commonly adopted strategy of using macroscopically normaltissue from three ex-smokers undergoing lung resection: Donor 1 (female, aged 57), Donor 2(female, aged 69) and Donor 3 (male, aged 69). Written consent from the donors of the pri-mary lung tissue was given under the governance of the National Health Service (NHS)England Southampton and South West Hampshire ‘A’ Research Ethics Committee. LocalResearch Ethics Committee (LREC) Reference Number 08/H0502/32.
The purified ATII cells were re-suspended in DCCM-1 medium (Biological Industries,Israel) supplemented with 1% penicillin, 1%streptomycin and 1% L-glutamine and 10% NCSbefore plating on collagen I (PureCol 5005-b, Advanced BioMatrix Inc, Carlsbad, USA) coated
Differentiation of A549 Cells by Long Term Culture
PLOS ONE | DOI:10.1371/journal.pone.0164438 October 28, 2016 3 / 20

24 well plates at 60% confluence. The presence of ATII cells was confirmed by staining for alka-line phosphatase. Replicate RNA samples were isolated from wells of the 24 well plate usingTrizol according to the manufacturer’s instructions (Life Technologies, Paisley, UK).
QRT-PCR. The extracted RNA was quantified (Denovix, Wilmington, Delaware, USA)and 3ng of each of the RNA samples was then reverse transcribed to cDNA using the Super-script 1 II Reverse Transcriptase Kit (Oligo dt) (Life Technologies, Paisley, UK) to the manu-facturer’s instructions.
QRT PCR was performed on the cDNA using a Quant-Studio 7 thermocycler (Life Technol-ogies, Paisley, UK), and curated Taqman assays (SFTPA1 (Taqman assay ID Hs00831305_m1),SFTPA2 (Taqman assay ID Hs00359837_m1), SFTPB (Taqman assay ID Hs01090667_m1),SFTPC (Taqman assay ID Hs00161628_m1), SFTPD (Taqman assay ID Hs01108490_m1) (LifeTechnologies, Paisley, UK) using delta-delta Ct analysis to determine relative gene expression[33]. Ct values were normalised to the geometric means of those obtained from the referencegenes topoisomerase (TOP1) (Taqman assay ID Hs00243257_m1) and ATP synthase subunitbeta, mitochondrial (ATP5B) (Taqman assay ID Hs 00969569_m1) based on the results of a‘genorm’ analysis[34] to determine the optimal reference genes. cDNA from log phase A549 cul-tures was used as the baseline for comparison of relative gene expression for all surfactant pro-teins except SFTPA2, where cDNA from 25 day differentiated A549 was used.
RNA Microarray Analysis
cRNA labelled with Cyanine 3 was generated from the extracted RNA samples using the Agi-lent Single Color Low Input Quick Amp Labelling kit and purified prior to hybridisation toAgilent Human Single Color 39494 array slides. Genespring version 13 (Agilent Technologies,Santa Clara, USA). Data was quality controlled by excluding any compromised entities andonly entities where all replicates were either detected or not detected. Samples were normalisedby shift to the 75th percentile and the baseline transformation on the median of all samplesand statistical and comparative analysis at the probe and gene level using parametric statisticalanalyses including analysis of variance (one way ANOVA) with Benjamini and Hochberg FalseDiscovery Rate (BH FDR) correction. Pathway analyses using Genespring and Wiki Pathways[35–37] were carried out on genes up or down regulated at a fold change of two or more andon the genes shared with differentiated A549 and the ATII cells.
Oil Red O staining
Cell monolayers were rinsed with phosphate buffered saline (PBS), fixed with two applicationsof 10% formalin before rinsing with purified water followed by addition of 60% isopropanol andair drying. The cells were stained using Oil red-O (Sigma Aldrich, Dorset, UK) (0.21g/ml in iso-propanol, filtered), rinsed four times in purified water before imaging by light microscopy.
Transmission Electron Microscopy
Cells were fixed in 2.5% glutaraldehyde solution before staining in osmium tetroxide andembedding in Araldite resin. The resulting blocks were sectioned, placed onto grids before fur-ther staining with 2% uranyl acetate and 0.1% lead citrate. Sections were imaged by transmis-sion electron microscopy using Philips CM100 (Philips Electron Optics, Cambridge, UK) andHitachi H7000 instruments (Hitachi Group, Maidenhead, Berkshire, UK).
To determine the proportion of cells expressing MLBs, 164 cells were assessed by directcounting of TEM micrographs.
Differentiation of A549 Cells by Long Term Culture
PLOS ONE | DOI:10.1371/journal.pone.0164438 October 28, 2016 4 / 20
Results
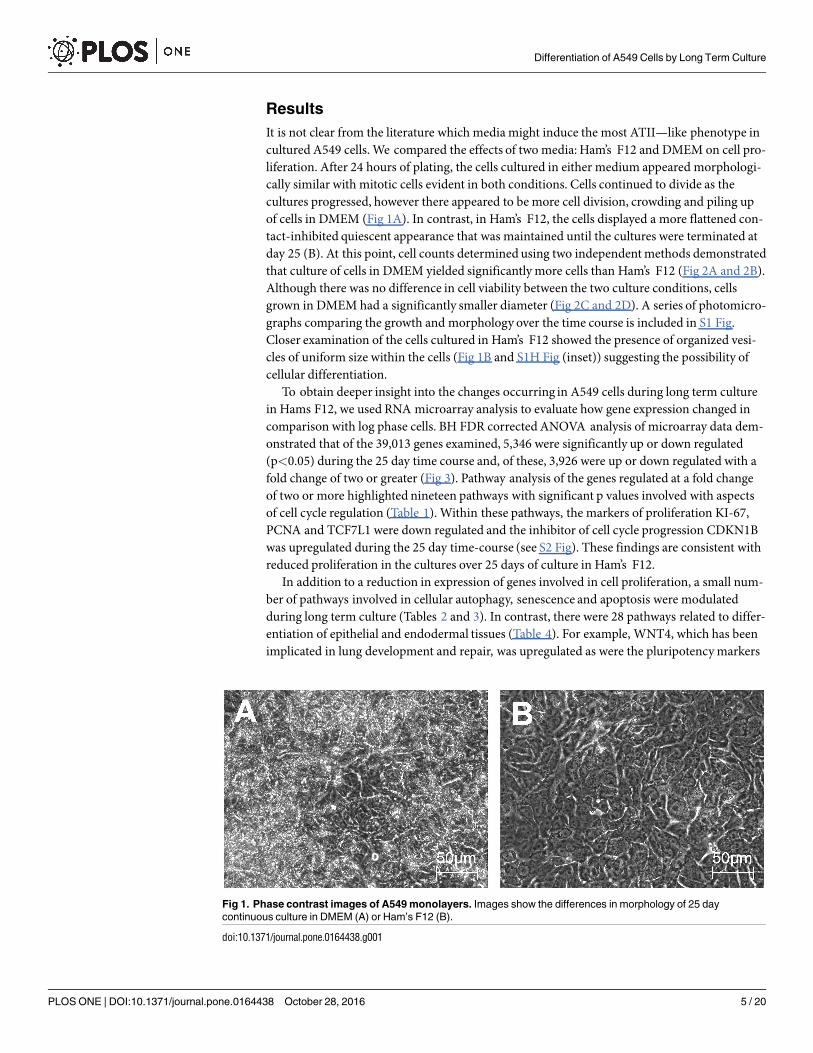
It is not clear from the literature which media might induce the most ATII—like phenotype incultured A549 cells. We compared the effects of two media: Ham’s F12 and DMEM on cell pro-liferation. After 24 hours of plating, the cells cultured in either medium appeared morphologi-cally similar with mitotic cells evident in both conditions. Cells continued to divide as thecultures progressed, however there appeared to be more cell division, crowding and piling upof cells in DMEM (Fig 1A). In contrast, in Ham’s F12, the cells displayed a more flattened con-tact-inhibited quiescent appearance that was maintained until the cultures were terminated atday 25 (B). At this point, cell counts determined using two independent methods demonstratedthat culture of cells in DMEM yielded significantly more cells than Ham’s F12 (Fig 2A and 2B).Although there was no difference in cell viability between the two culture conditions, cellsgrown in DMEM had a significantly smaller diameter (Fig 2C and 2D). A series of photomicro-graphs comparing the growth and morphology over the time course is included in S1 Fig.Closer examination of the cells cultured in Ham’s F12 showed the presence of organized vesi-cles of uniform size within the cells (Fig 1B and S1H Fig (inset)) suggesting the possibility ofcellular differentiation.
To obtain deeper insight into the changes occurring in A549 cells during long term culturein Hams F12, we used RNA microarray analysis to evaluate how gene expression changed incomparison with log phase cells. BH FDR corrected ANOVA analysis of microarray data dem-onstrated that of the 39,013 genes examined, 5,346 were significantly up or down regulated(p<0.05) during the 25 day time course and, of these, 3,926 were up or down regulated with afold change of two or greater (Fig 3). Pathway analysis of the genes regulated at a fold changeof two or more highlighted nineteen pathways with significant p values involved with aspectsof cell cycle regulation (Table 1). Within these pathways, the markers of proliferation KI-67,PCNA and TCF7L1 were down regulated and the inhibitor of cell cycle progression CDKN1Bwas upregulated during the 25 day time-course (see S2 Fig). These findings are consistent withreduced proliferation in the cultures over 25 days of culture in Ham’s F12.
In addition to a reduction in expression of genes involved in cell proliferation, a small num-ber of pathways involved in cellular autophagy, senescence and apoptosis were modulatedduring long term culture (Tables 2 and 3). In contrast, there were 28 pathways related to differ-entiation of epithelial and endodermal tissues (Table 4). For example, WNT4, which has beenimplicated in lung development and repair, was upregulated as were the pluripotency markers
Fig 1. Phase contrast images of A549 monolayers. Images show the differences in morphology of 25 day
continuous culture in DMEM (A) or Ham’s F12 (B).
doi:10.1371/journal.pone.0164438.g001
Differentiation of A549 Cells by Long Term Culture
PLOS ONE | DOI:10.1371/journal.pone.0164438 October 28, 2016 5 / 20

Nanog and SOX2. Parallel up-regulation of SOX9 was also observed along with the WNT tar-get Metalloproteinase 7 (MMP7) (see S3 Fig). A feature suggestive of ATII cell differentiationwas significant expression of complement component pathways with, for example, increasedexpression of C3, C4b and C5 (S4 Fig). In addition to induction of differentiation pathways,Table 5 shows 10 pathways involved in lipid metabolism that achieved statistical significanceover the 25 day time course.
To determine whether modulation of A549 cell growth and differentiation resulted in theirtransition towards an ATII cell phenotype, we compared gene expression of the long term cul-tured A549 cells to that of freshly isolated human primary ATII cultures. Comparison of rela-tive gene expression using primary ATII cells from three donors showed a similar pattern ofexpression of five surfactant proteins (SFTPD, A2, A1, B and C) (S5 Fig); therefore we selectedDonor 2 for RNA microarray studies to represent normal ATII cells. In this analysis each ofthe time-points of A549 differentiation and the primary ATII cells was compared to log phase
Fig 2. Cell metrics. Cell counts, viability and cell diameters from A549 cell cultures at day 25. A: cell yield
per unit area based on cell counting using Trypan blue dye exclusion (n = 3) and B: cell numbers as
measured by automated cell counting (n = 5). C: Cell viability based on DAPI dye exclusion (n = 5). D: cell
diameter using automated image analysis (n = 5). Data are plotted as mean ± SD; statistical analyses in A, B
and D used unpaired Student’s T Test. In C statistical testing showed no significant difference (NS).
doi:10.1371/journal.pone.0164438.g002
Differentiation of A549 Cells by Long Term Culture
PLOS ONE | DOI:10.1371/journal.pone.0164438 October 28, 2016 6 / 20

Fig 3. RNA Microarray Heatmap of Gene Expression. Hierarchically clustered (Euclidian similarity
measure, clustered using Ward’s linkage rule) heat map of gene expression changes in A549 cells cultured
in Ham’s F12 for up to 25 days; the heat map shows normalised intensity values of significant genes
regulated up or down two-fold or more.
doi:10.1371/journal.pone.0164438.g003
Differentiation of A549 Cells by Long Term Culture
PLOS ONE | DOI:10.1371/journal.pone.0164438 October 28, 2016 7 / 20

A549 cells as the point at which it is assumed that most researchers would use their A549 cellsin experiments.
The RNA microarray comparison of primary ATII cells with long term cultured A549showed that for a minimum of fold change of two, the number of shared up regulated genesincreased from 280 at day 7 of the differentiation time-course to 591 at day 25. Similarly thenumber shared down regulated genes increased from 458 at day 7 to 796 at day 25 (Fig 4).Analysis of the shared up regulated genes (Table 6) indicated pathways involved with the Com-plement System (C3 and C4b), senescence and autophagy, lipid metabolism (including fattyacid biosynthesis, adipogenesis, sphingolipid metabolism, cholesterol and lipid homeostasis,peroxisome proliferator activated receptor alpha), endodermal and cellular differentiation andTGF beta signalling.
Table 1. Pathways Associated with Cell Cycle Control.
Pathway Wiki-Pathway Reference P Value Number of regulated genes Number of genes in pathway
Cell Cycle WP179 70629 <0.001 51 103
S Phase WP2772 77049 <0.001 46 116
Mitotic G1-G1-S phases WP1858 76928 <0.001 46 120
Mitotic Metaphase and Anaphase WP2757 77009 <0.001 57 153
Synthesis of DNA WP1925 76968 <0.001 39 94
Nuclear Receptors Meta-Pathway WP2882 78569 <0.001 80 318
RB in Cancer WP2446 78573 <0.001 55 87
Mitotic Prometaphase WP2652 76819 <0.001 54 98
DNA Replication WP466 76196 <0.001 31 42
G1 to S cell cycle control WP45 71377 <0.001 34 68
Telomere Maintenance WP1928 76893 <0.001 24 37
Cell Cycle Checkpoints WP1775 76816 <0.001 38 115
Nucleosome assembly WP1874 76826 <0.001 15 22
miRNA Regulation of DNA Damage Response WP1530 78503 <0.001 28 98
DNA Damage Response WP707 78527 <0.001 27 68
Mitotic G2-G2-M phases WP1859 77022 <0.001 31 89
M-G1 Transition WP2785 77074 <0.001 27 79
Regulation of DNA replication WP1898 76824 <0.001 18 70
Mitotic Prophase WP2654 76823 0.002 12 44
Statistically significant pathways associated with cell cycle contrl for genes expressed over the 25 day time-course of A549 differentation in Ham’s F12
medium. Pathways were identified by Genespring pathway analysis after one way ANOVA of all of time points compared to log-phase A549 cells (P cut
off = 0.05, Fold change� 2.0).
doi:10.1371/journal.pone.0164438.t001
Table 2. Pathways Associated with Apoptosis.
Pathway Wiki-Pathway Reference P Value Number of regulated genes Number of genes in pathway
Apoptosis WP254 78808 0.021 17 84
FAS pathway and Stress induction of HSP
regulation
WP314 71366 0.033 9 38
Apoptotic execution phase WP1784 76813 0.033 10 46
Statistically significant pathways associated with apoptosis for genes expressed over the 25 day time-course of A549 differentiation in Ham’s F12 medium.
Pathways were identified using Genespring pathway analysis after one way ANOVA of all of the time points compared to log-phase A549 cells (P cut
off = 0.05, Fold change� 2.0).
doi:10.1371/journal.pone.0164438.t002
Differentiation of A549 Cells by Long Term Culture
PLOS ONE | DOI:10.1371/journal.pone.0164438 October 28, 2016 8 / 20

Table 3. Pathways Associated with Senescence and Autophagy.
Pathway Wiki-Pathway Reference P Value Number of regulated genes Number of genes in pathway
Senescence and Autophagy WP615 71375 <0.001 32 106
AMPK Signaling WP1403 78804 0.006 16 68
Folate Metabolism WP176 74202 0.020 14 67
Statistically significant pathways associated with senescence and autophagy for genes expressed over the 25 day time-course of A549 differentiation in
Ham’s F12 medium. Pathways were identified using Genespring pathway analysis after one way ANOVA of all of the time points compared to log-phase
A549 cells (P cut off = 0.05, Fold change� 2.0).
doi:10.1371/journal.pone.0164438.t003
Table 4. Pathways Associated with Epithelial and Endodermal Differentiation.
Pathway Wiki-Pathway
Reference
P Value Number of regulated
genes
Number of genes in
pathway
miR-targeted genes in epithelium—TarBase WP2002 78530 <0.001 69 345
Complement and Coagulation Cascades WP558 67786 <0.001 21 64
TGF Beta Signaling Pathway WP366 69026 <0.001 21 55
TGF Beta Signaling Pathway WP560 68944 <0.001 21 55
Cell junction organization WP1793 77057 <0.001 20 61
Human Complement System WP2806 78589 <0.001 28 136
Signaling by TGF-beta Receptor Complex WP2742 76980 <0.001 13 36
Focal Adhesion WP306 78800 <0.001 41 188
Integrin cell surface interactions WP1833 77019 <0.001 19 64
Oncostatin M Signaling Pathway WP2374 73668 <0.001 19 65
Integrin-mediated Cell Adhesion WP185 71391 <0.001 24 99
Complement cascade WP1798 77042 <0.001 13 192
Assembly of collagen fibrils and other multimeric
structures
WP2798 77089 8.62E-
04
11 33
Endoderm Differentiation WP2853 78496 <0.001 18 146
Differentiation Pathway WP2848 78558 0.001 14 50
Wnt Signaling Pathway and Pluripotency WP399 74897 0.003 22 100
Cell Differentiation—meta WP2023 68892 0.005 7 67
ID signaling pathway WP53 67360 0.006 6 16
Prostaglandin Synthesis and Regulation WP98 72088 0.008 9 31
Cell surface interactions at the vascular wall WP1794 77039 0.008 19 91
Constitutive Androstane Receptor Pathway WP2875 78537 0.009 8 32
EGF-EGFR Signaling Pathway WP437 78502 0.010 30 162
Complement Activation, Classical Pathway WP545 72062 0.011 6 17
Angiogenesis WP1539 78807 0.015 7 24
Mitotic Telophase-Cytokinesis WP2765 77030 0.020 5 14
Activation of Matrix Metalloproteinases WP2769 77041 0.035 5 16
Gap junction trafficking and regulation WP1820 76886 0.042 3 8
Wnt Signaling Pathway WP428 78532 0.046 12 61
Statistically significant pathways associated with epithelial and endodermal differentiation for genes expressed over the 25 day time-course of A549
differentiation in Ham’s F12 medium. Pathways were identified by Genespring pathway analysis after one way ANOVA of all of the time points compared to
log-phase A549 cells (P cut off = 0.05, Fold change�2.0).
doi:10.1371/journal.pone.0164438.t004
Differentiation of A549 Cells by Long Term Culture
PLOS ONE | DOI:10.1371/journal.pone.0164438 October 28, 2016 9 / 20

Table 7 summarizes the fold changes in gene expression in a selection of key genes andmarkers involved in ATII differentiation in our experiments by comparing the relative foldchange difference of differentiated A549 cells and primary ATII cells compared to log phaseA549 cells. ATP lipid transporters have been associated with the organized transport of lipidsinto developing MLB and are considered a key marker of ATII cells. ABCA3 was expressed inabundance in the primary ATII cells but not significantly upregulated in the differentiatedA549 cells. However, other lipid transporters were significantly upregulated in differentiatedA549 cells (S6 Fig).
Table 5. Pathways Associated with Lipid Synthesis and Metabolism.
Pathway Wiki-Pathway
Reference
P Value Number of regulated
genes
Number of genes in
pathway
Adipogenesis WP236 78584 <0.001 38 131
SREBF and miR33 in cholesterol and lipid homeostasis WP2011 75253 <0.001 9 18
Nuclear Receptors in Lipid Metabolism and Toxicity WP299 78587 <0.001 12 35
Ganglio Sphingolipid Metabolism WP1423 76323 0.002 7 18
Signal Transduction of S1P Receptor WP26 78492 0.005 8 25
Cholesterol biosynthesis WP1795 77044 0.020 6 21
Regulation of Lipid Metabolism by Peroxisome proliferator-activated
receptor alpha (PPARalpha)
WP2797 77088 0.025 21 118
Globo Sphingolipid Metabolism WP1424 71392 0.026 6 24
Cholesterol Biosynthesis WP197 78758 0.027 5 15
Fatty Acid Biosynthesis WP357 70641 0.041 6 22
Statistically significant pathways associated with lipid synthesis and metabolism for genes expressed over the 25 day time-course of A549 differentiation in
Ham’s F12 medium. Pathways were identified using Genespring pathway analysis after one way ANOVA of all of the time points compared to log-phase
A549 cells (P cut off = 0.05, Fold change� 2.0).
doi:10.1371/journal.pone.0164438.t005
Fig 4. Shared up regulated (� 2 fold) gene expression of differentiated A549 with freshly isolated
human primary ATII cultures. Gene expression in A549 cells that were cultured for 7, 11, 18 or 25 days or
primary ATII cells were compared to log phase A549 cells. The figure shows the number of shared up-
(hatched bars) or down- (clear bars) regulated genes between the A549 cells and ATII cells over the A549
time course.
doi:10.1371/journal.pone.0164438.g004
Differentiation of A549 Cells by Long Term Culture
PLOS ONE | DOI:10.1371/journal.pone.0164438 October 28, 2016 10 / 20

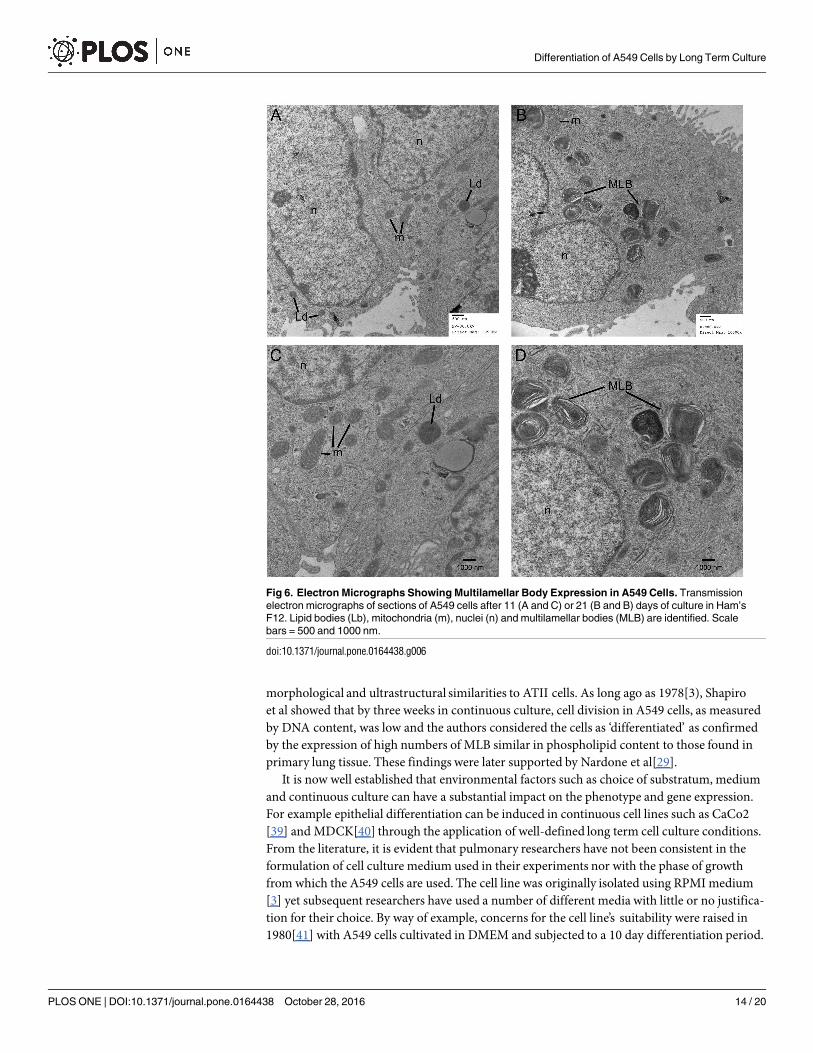
To confirm the presence of lipidogenesis and possible MLB formation, differentiated A549monolayers were stained with Oil-red-O. This showed that lipid production increased over thetime course of differentiation (Fig 5A–5D) and was manifested by an increase in number andsize of lipid inclusions, with more than half of the cells in the monolayer at day 18 showing evi-dence of lipid containing bodies. However from this staining it was not possible to discriminateMLB from oil droplets within the cells. Therefore, TEM microscopy was performed to assessthe ultrastructure of the lipid droplets. At day 11, lipid droplets appeared as uniform structureswith no evidence of MLB formation (Fig 6A and 6C). However by day 21 of differentiation, thelipid containing structures showed clear evidence of MLB formation (Fig 6B and 6D) with adistribution similar to that identified by the oil red-O staining. A differential count of 164 cellsin TEM micrographs of long term differentiated A549 cells showed that 90 (54.9%) of the cellsexamined contained MLBs.
Discussion
In this study, we report that long term culture of A549 cells in Ham’s F12 medium resulted insubstantial suppression of genes involved in cell division in association with significant up-reg-ulation of genes involved in autophagic, differentiation and lipidogenic pathways. There werealso increased numbers of up- and down-regulated genes shared with primary ATII cells iso-lated using conventional methodology[31] suggesting adoption of some ATII characteristicsincluding multilamellar body (MLB) development, a feature which was confirmed by electronmicroscopy. This work defines a set of conditions for promoting ATII differentiation charac-teristics in A549 cells that may be advantageous for functional studies with these cells. Novelalternative methods for ATII preparation have been defined from which future studies maybenefit[38].
The evidence for the A549 cell line’s suitability as an in vitro ATII model is conflicting andis not fully explored in contemporary literature. The cell line was originally reported to have
Table 6. Pathways Considered to be Associated with ATII Phenotype.
Pathway Wiki Pathways
Reference
Most significant
timepoint (Day)
P Value Number regulated
genes
Number genes in
pathway
Complement cascade WP1798 77042 25 <0.001 9 192
Human Complement System WP2806 78589 18 <0.001 12 136
Senescence and Autophagy WP615 71375 25 <0.001 9 106
Complement Activation, Classical Pathway WP545 72062 25 <0.001 4 17
Complement and Coagulation Cascades WP558 67786 18 <0.001 6 64
Adipogenesis WP236 78584 11 <0.001 10 131
Differentiation Pathway WP2848 78558 11 0.001 5 50
Globo Sphingolipid Metabolism WP1424 71392 18 0.005 3 24
Sphingolipid Metabolism WP1422 78591 25 0.006 3 21
Sphingolipid metabolism WP2788 77079 25 0.010 4 46
SREBF and miR33 in cholesterol and lipid homeostasis WP2011 75253 11 0.026 2 18
Ganglio Sphingolipid Metabolism WP1423 76323 7 0.010 2 18
Regulation of Lipid Metabolism by Peroxisome
proliferator-activated receptor alpha (PPARalpha)
WP2797 77088 11 0.009 6 118
TGF Beta Signaling Pathway WP366 69026 7 0.013 3 55
TGF Beta Signaling Pathway WP560 68944 7 0.013 3 55
Statistically significant pathways considered to be associated with ATII phenotype. Two fold (or greater) upregulated genes shared with primary ATII cells
and differentiated A549 cells over the 25 day time-course identified by Genespring pathway analysis of Venn diagram analysis of the two cell populations.
doi:10.1371/journal.pone.0164438.t006
Differentiation of A549 Cells by Long Term Culture
PLOS ONE | DOI:10.1371/journal.pone.0164438 October 28, 2016 11 / 20

Table 7. Genes Related to ATII Differentiation.
Gene
Symbol
Up or Down Regulation in A549 Cells
throughout time-course
Fold Change at Day 25
in A549 Cells
Up or Down Regulation in ATII primaries
compared to log phase A549
Fold Change (ATII vs
log Phase A549)
Proliferation Markers
Ki67 Down -5.08 Down -15.83
PCNA Down -2.19 Down -6.17
TCF7L1 Down -5.85 N/S
Cell Cycle Inhibitor
CDKN1B Up 3.05 N/S
Lipid Metabolism
PPAPDC1B Up 2.45 N/S
PPAPDC1A N/S Up 15.19
PPAP2A Up 2.62 Up 7.03
PPAP2B Up 2.90 N/S
DGAT2 Up 3.21 N/S
FABP5 Down -5.96 Down -3.6
ACSL5 Up 16.00 Up 16.00
Autophagy and Lysosomal
ULK4 Up 3.64 Down -3.53
LAMP2 Up 2.08 Up 3.23
LAMP3 Up 2.65 Up 16.00
PLD1 Up 2.0 N/S
PLD2 N/S Up 2.83
PLD5 Up 4.97 N/S
WNT Associated Differentiation
CASP1 Up 16.00 Up 16.00
CASP4 Up 6.28 Up 16.00
BIRC5 Down -16.00 Down -16.00
WNT4 Up 12.10 Up 6.12
Stem Cell Markers and Differentiation
NANOG Up 4.06 Up N/S
SOX2 Up 3.19 Up 4.75
SOX9 Up 2.79 N/S
Complement Components
C3 Up 14.92 Up 16.00
C4B Up 12.00 Up 9.06
C4BPA Up 16.00 Up 16.00
C5 Up 6.31 Down -3.25
Cellular Differentiation
IL1B Up 16.00 Up 15.56
AGT Up 16.00 Up 9.92
PPARA Up 3.71 Up 4.16
FST Up 8.81 Up 7.75
BMP4 Up 13.65 Up 7.98
TGFBR2 Up 2.93 Up 2.81
ATP Lipid Transporters
ABCA3 N/S Up 4.26
ABCC6P1 Up 5.07 Up 16.00
ABCC3 Up 2.7 Down -8.11
(Continued )
Differentiation of A549 Cells by Long Term Culture
PLOS ONE | DOI:10.1371/journal.pone.0164438 October 28, 2016 12 / 20
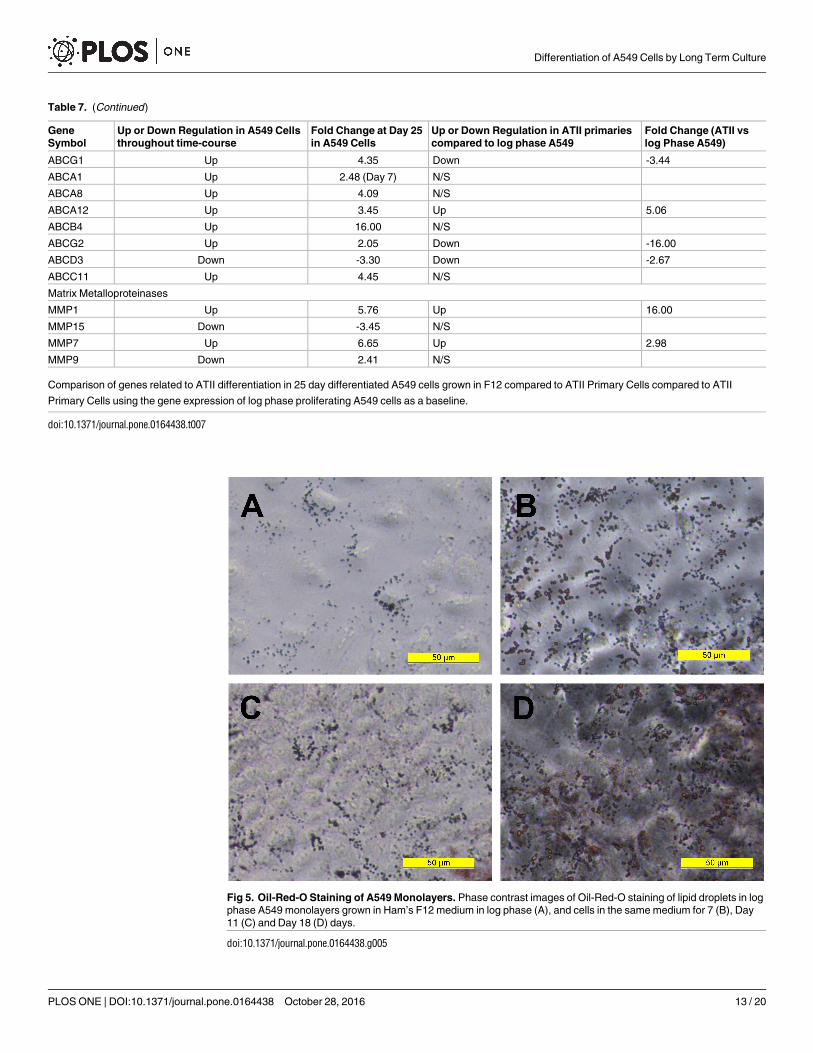
Table 7. (Continued)
Gene
Symbol
Up or Down Regulation in A549 Cells
throughout time-course
Fold Change at Day 25
in A549 Cells
Up or Down Regulation in ATII primaries
compared to log phase A549
Fold Change (ATII vs
log Phase A549)
ABCG1 Up 4.35 Down -3.44
ABCA1 Up 2.48 (Day 7) N/S
ABCA8 Up 4.09 N/S
ABCA12 Up 3.45 Up 5.06
ABCB4 Up 16.00 N/S
ABCG2 Up 2.05 Down -16.00
ABCD3 Down -3.30 Down -2.67
ABCC11 Up 4.45 N/S
Matrix Metalloproteinases
MMP1 Up 5.76 Up 16.00
MMP15 Down -3.45 N/S
MMP7 Up 6.65 Up 2.98
MMP9 Down 2.41 N/S
Comparison of genes related to ATII differentiation in 25 day differentiated A549 cells grown in F12 compared to ATII Primary Cells compared to ATII
Primary Cells using the gene expression of log phase proliferating A549 cells as a baseline.
doi:10.1371/journal.pone.0164438.t007
Fig 5. Oil-Red-O Staining of A549 Monolayers. Phase contrast images of Oil-Red-O staining of lipid droplets in log
phase A549 monolayers grown in Ham’s F12 medium in log phase (A), and cells in the same medium for 7 (B), Day
11 (C) and Day 18 (D) days.
doi:10.1371/journal.pone.0164438.g005
Differentiation of A549 Cells by Long Term Culture
PLOS ONE | DOI:10.1371/journal.pone.0164438 October 28, 2016 13 / 20
morphological and ultrastructural similarities to ATII cells. As long ago as 1978[3), Shapiroet al showed that by three weeks in continuous culture, cell division in A549 cells, as measuredby DNA content, was low and the authors considered the cells as ‘differentiated’ as confirmedby the expression of high numbers of MLB similar in phospholipid content to those found inprimary lung tissue. These findings were later supported by Nardone et al[29].
It is now well established that environmental factors such as choice of substratum, mediumand continuous culture can have a substantial impact on the phenotype and gene expression.For example epithelial differentiation can be induced in continuous cell lines such as CaCo2[39] and MDCK[40] through the application of well-defined long term cell culture conditions.From the literature, it is evident that pulmonary researchers have not been consistent in theformulation of cell culture medium used in their experiments nor with the phase of growthfrom which the A549 cells are used. The cell line was originally isolated using RPMI medium[3] yet subsequent researchers have used a number of different media with little or no justifica-tion for their choice. By way of example, concerns for the cell line’s suitability were raised in1980[41] with A549 cells cultivated in DMEM and subjected to a 10 day differentiation period.
Fig 6. Electron Micrographs Showing Multilamellar Body Expression in A549 Cells. Transmission
electron micrographs of sections of A549 cells after 11 (A and C) or 21 (B and B) days of culture in Ham’s
F12. Lipid bodies (Lb), mitochondria (m), nuclei (n) and multilamellar bodies (MLB) are identified. Scale
bars = 500 and 1000 nm.
doi:10.1371/journal.pone.0164438.g006
Differentiation of A549 Cells by Long Term Culture
PLOS ONE | DOI:10.1371/journal.pone.0164438 October 28, 2016 14 / 20

In this case the MLB content of the cells could be increased with 2 days of serum starvation,however, the lipid content of these A549 cells differed significantly from freshly isolated rat pri-mary ATII cells and the authors advised that the cell line should be considered as a model ofATII dysfunction. More recently, using Raman spectroscopy to investigate the biochemicalcharacteristics of A549 cells, Swain et al[30] cast further doubt on the A549 cell line’s perfor-mance as an ATII model but used cells grown in DMEM. Heijink et al[42] also reported func-tional deficiencies of the cell line using cells grown in RPMI 1640 medium. Based on ourobservations that DMEM supports a proliferative phenotype even in long term culture, it ispossible that inconsistency in the choice of medium and/or culture duration used for A549experiments may contribute to variability in phenotypic properties. This highlights the needfor standardization in the use of A549 cells, and speaks to a larger problem that has been identi-fied in life science research[43].
One of the key roles of ATII cells in vivo is to secrete surfactant, thus surfactant lipid pro-duction and evidence of MLB biogenesis in A549 cells, as originally reported[27] is supportiveof their suitability as an ATII model. Lung surfactant has a role in immune protectiveness andthe production of complement[44] and our finding of up-regulated gene expression of C3, C4band C5 suggest the synthesis of components of the classical and alternate complement path-ways by the long term A549 cell cultures consistent with their differentiation into a more ATII-like phenotype.
It is generally accepted that MLB biogenesis can be achieved by de novo synthesis of DPPCor alternatively through cellular autophagy[45,46]. Since MLB are thought to be lysosomal inorigin, the expression of the Lysosomal Associated Membrane Proteins (LAMP) 2, and 3[46,47] and the lytic phospholipase enzymes PLD1 and 5[45] observed in the present studysuggest that the long-term A549 cultures are developing lysosomes. Our data and pathwayanalyses further support the involvement of autophagy in MLB biogenesis with upregulation ofautophagic pathways including the autophagy gene ULK4[48] in the long term A549 cultures.Autophagy seems to be an important process in the early development of the lung in particu-larly in the intervening period of starvation between birth and nutrient supply from maternallactation. Autophagy provides a nutritional bridge at this critical stage at which point the lunghas to adapt from an environment of amniotic fluid to breathing air and the immediate secre-tion of surfactant from MLBs[49]. Failure to respond in this manner can lead to infant respira-tory distress syndrome[50] and mice with targeted deletions of individual autophagy genessuch as ATG16L1[51,52] have high mortality rates in their offspring.
Lipid and fatty acid (FA) precursors for DPPC are not only derived from autophagy in thedevelopment of MLB, they can also be synthesized de novo. In adults it is thought that FAs aresequestered from the circulation via Fatty Acid Binding Proteins (FABP)[1], however our datashow that FAB5 is down regulated throughout the A549 time course and in primary ATII cells,perhaps indicating that there are insufficient FAs provided in the culture medium or that thecells have switched to autophagic and biosynthetic generation of FAs. The significant upregula-tion of genes involved in lipid biosynthesis and metabolism support this hypothesis.
Membrane bound ATP lipid transporters, for example ABCA3[53], have been associatedwith the organized transport of lipids into developing MLB and are considered a key markerof ATII cells. Although ABCA3 was not significantly upregulated in the differentiated A549cells, other ATP lipid transporters are involved MLB formation and surfactant production.For example ABCA1, 2, 3, and 5, have been implicated[54] and ABCA2 has been shown to beassociated with the limiting membranes of MLB while other work has demonstrated thatABCA1 is enriched in the lung[55]. Our results with long-term cultures of A549 cells showthe upregulation of several candidate ATP Lipid transporters that could play a part in MLBassembly.
Differentiation of A549 Cells by Long Term Culture
PLOS ONE | DOI:10.1371/journal.pone.0164438 October 28, 2016 15 / 20

Analysis of up-regulated genes that are shared between primary ATII cells and differenti-ated A549 confirmed that over the 25 day time-course of differentiation the A549 cell linebecame more similar in terms of gene expression to the ATII cells than log phase A549 cells.However while the 25 day differentiated A549 cultures are more similar to primary ATII cellsthere are still many differences. This may be because A549 cells retain an abnormal phenotypeas a consequence of their malignant background, or because they consist of a phenotypicallyheterogeneous population possibly due to the presence of cancer stem cells with the potentialto differentiate to ATII or non-ciliated bronchial cell types [32]. Increases in expression of theprogenitor cell markers SOX2, SOX9 and NANOG in A549 cells seen in the present studycould be indicative of the presence of such a cancer stem cell population[56].
As with all models, recapitulation of the in vivo state is imperfect but the aim is to repro-duce, as faithfully as possible those aspects of the physiology (or pathology) that are beinginvestigated. The gene expression data of the A549 time-course, the upregulated pathways andgenes shared with primary ATII cells together with the confirmatory TEM data demonstratesthat we have defined a reproducible and standard set of conditions for promoting ATII differ-entiation characteristics in A549 cells. In conclusion, we suggest that whereas proliferating log-phase A549 cells are most suitable for cancer biology studies, the new long term culture systemwould be more suitable for in vitro studies requiring a more representative and continuoussource of ATII-like cells.
Supporting Information
S1 Fig. Images show the differences in morphologyover 25 days of continuous culture inDMEM (top row, A-D) or Ham’s F12 (bottom row, E-H). Photomicrographs show morphol-ogy at day 1 (A and E), days 8 (B and F) and 14 (C and G) and day 25 (D and H). (Inset in Hshows higher magnification of cells displaying organized vesicles in F12, inset in D shows ahigher magnification of cells grown in DMEM for comparison).(TIF)
S2 Fig. Box and whisker plots of microarrayRNA gene expression in A549 monolayersgrown in Ham’s F12 (normalized intensity values) of proliferation markers Ki-67 (A),PCNA (B) and TCF7L1 (C) and cell cycle inhibitor CDKN1B (D) over the 25 day timecourse. ‘Day 0’ is representative of log phase A549 monolayers.(TIF)
S3 Fig. Box and whisker plots of microarrayRNA gene expression in A549 monolayersgrown in Ham’s F12 (normalized intensity values) of the expression of WNT4 (A), Nanog(B), SOX2 (C), SOX9 (D) andMMP7 (E). ‘Day 0’ is representative of log phase A549 mono-layers.(TIF)
S4 Fig. Box and whisker plots of microarrayRNA gene expression in A549 monolayersgrown in Ham’s F12 (normalized intensity values) of the expression of complement com-ponents C3 (A), C4b (B) and C5 (C). ‘Day 0’ is representative of log phase A549 monolayers.(TIF)
S5 Fig. Relative expression of surfactant protein genes by delta-deltaCt QRT PCR Taqmananalysis of human primaryATII isolated from three separate donors. Donor 1 (chequeredbars), Donor 2 (hatched bars) and donor 3 (speckled bars). ATII cells from Donor 2 were usedfor the RNA micro array analysis. ATP5B and TOP1 were used as reference genes. SFTPD, A1,B and C expression was relative to log phase A549 cells. SFTPA2 expression was relative to 25
Differentiation of A549 Cells by Long Term Culture
PLOS ONE | DOI:10.1371/journal.pone.0164438 October 28, 2016 16 / 20

day differentiated A549 cells.(TIF)
S6 Fig. Box and whisker plots of microarray gene expression in A549 monolayers grown inHam’s F12 (normalized intensity values) of RNA expression ATP-binding cassette lipidtransporters;ABCC11 (A), ABCC3 (B), ABCG1 (C), ABCA1 (D), ABCD4 (E), ABCC8 (F),ABCA12 (G), ABCB4 (H), ABCG2 (I), ABCC6P1 (J), ABCD3 (K) and ABCC6 (L). ‘Day 0’is representative of log phase A549 monolayers.(TIF)
Author Contributions
Conceptualization:ECB DED JEC JRC.
Data curation:MBA KEK JRC DED JEC.
Formal analysis: JRC MBA KEK DED JEC HT.
Funding acquisition: ECB DED.
Investigation: JRC FC MBA HT.
Methodology:FC JRC.
Project administration:ECB DED JEC.
Resources:ECB DED.
Supervision:DED JEC ECB.
Validation: JRC HT MBA DED JEC.
Visualization: JRC DED JEC.
Writing – original draft: JRC DED MBA FC.
Writing – review& editing: JRC DED JEC MBA HT FC KEK.
References
1. Mason RJ. Biology of alveolar type II cells. Respirology. 2006; 11: S12–S15. doi: 10.1111/j.1440-1843.
2006.00800.x PMID: 16423262
2. Fehrenbach H. Alveolar epithelial type II cell: defender of the alveolus revisited. Respir Res. 2001; 2:
33–46. doi: 10.1186/rr36 PMID: 11686863
3. Shapiro DL, Nardone LL, Rooney SA, Motoyama EK, Munoz JL. Phospholipid biosynthesis and secre-
tion by a cell line (A549) which resembles type II aleveolar epithelial cells. Biochim Biophys Acta. 1978;
530: 197–207. PMID: 352403
4. Barkauskas CE, Cronce MJ, Rackley CR, Bowie EJ, Keene DR, Stripp BR, et al. Type 2 alveolar cells are
stem cells in adult lung. J Clin Invest. 2013; 123: 3025–3036. doi: 10.1172/JCI68782 PMID: 23921127
5. Kotton DN, Fine A. Lung stem cells. Cell Tissue Res. 2007; 331: 145–156. doi: 10.1007/s00441-007-
0479-2 PMID: 17805578
6. Rock JR, Hogan BLM. Epithelial Progenitor Cells in Lung Development, Maintenance, Repair, and Dis-
ease. Annu Rev Cell Dev Biol. 2011; 27: 493–512. doi: 10.1146/annurev-cellbio-100109-104040
PMID: 21639799
7. Anversa P, Kajstura J, Leri A, Loscalzo J. Tissue-specific adult stem cells in the human lung. Nat Med.
2011; 17: 1038–1039. doi: 10.1038/nm.2463 PMID: 21900912
8. Miyake Y, Kaise H, Isono K, Koseki H, Kohno K, Tanaka M. Protective Role of Macrophages in Nonin-
flammatory Lung Injury Caused by Selective Ablation of Alveolar Epithelial Type II Cells. J Immunol.
2007; 178: 5001–5009. doi: 10.4049/jimmunol.178.8.5001 PMID: 17404282
Differentiation of A549 Cells by Long Term Culture
PLOS ONE | DOI:10.1371/journal.pone.0164438 October 28, 2016 17 / 20

9. McElroy MC, Kasper M. The use of alveolar epithelial type I cell-selective markers to investigate lung
injury and repair. Eur Respir J. 2004; 24: 664–673. doi: 10.1183/09031936.04.00096003 PMID:
15459148
10. Petrache I, Natarajan V, Zhen L, Medler TR, Richter AT, Cho C, et al. Ceramide upregulation causes
pulmonary cell apoptosis and emphysema-like disease in mice. Nat Med. 2005; 11: 491–498. doi: 10.
1038/nm1238 PMID: 15852018
11. Rennard SI, Wachenfeldt K von. Rationale and Emerging Approaches for Targeting Lung Repair and
Regeneration in the Treatment of Chronic Obstructive Pulmonary Disease. Proc Am Thorac Soc.
2011; 8: 368–375. doi: 10.1513/pats.201102-019RM PMID: 21816994
12. Drakopanagiotakis F, Xifteri A, Polychronopoulos V, Bouros D. Apoptosis in lung injury and fibrosis.
Eur Respir J. 2008; 32: 1631–1638. doi: 10.1183/09031936.00176807 PMID: 19043009
13. Sisson TH, Mendez M, Choi K, Subbotina N, Courey A, Cunningham A, et al. Targeted Injury of Type II
Alveolar Epithelial Cells Induces Pulmonary Fibrosis. Am J Respir Crit Care Med. 2010; 181: 254–263.
doi: 10.1164/rccm.200810-1615OC PMID: 19850947
14. du Bois RM. Strategies for treating idiopathic pulmonary fibrosis. Nat Rev Drug Discov. 2010; 9: 129–
140. doi: 10.1038/nrd2958 PMID: 20094055
15. King TE, Pardo A, Selman M. Idiopathic pulmonary fibrosis. The Lancet. 2011; 378: 1949–1961. doi:
10.1016/S0140-6736(11)60052-4
16. Rogers DF, Donnelly LE, editors. Human airway inflammation: sampling techniques and analytical pro-
tocols. Totowa, N.J: Humana; 2001.
17. Thorley AJ, Ford PA, Giembycz MA, Goldstraw P, Young A, Tetley TD. Differential Regulation of Cyto-
kine Release and Leukocyte Migration by Lipopolysaccharide-Stimulated Primary Human Lung Alveo-
lar Type II Epithelial Cells and Macrophages. J Immunol. 2007; 178: 463–473. doi: 10.4049/jimmunol.
178.1.463 PMID: 17182585
18. Fuchs S, Hollins A, Laue M, Schaefer U, Roemer K, Gumbleton M, et al. Differentiation of human alveolar
epithelial cells in primary culture: morphological characterization and synthesis of caveolin-1 and surfac-
tant protein-C. Cell Tissue Res. 2003; 311: 31–45. doi: 10.1007/s00441-002-0653-5 PMID: 12483282
19. Fehrenbach H. Alveolar epithelial type II cells from embryonic stem cells: knights in shining armour?
Eur Respir J. 2012; 39: 240–241. doi: 10.1183/09031936.00162111 PMID: 22298611
20. Cerrada A, de la Torre P, Grande J, Haller T, Flores AI, Perez-Gil J. Human Decidua-Derived Mesen-
chymal Stem Cells Differentiate into Functional Alveolar Type II-Like Cells that Synthesize and Secrete
Pulmonary Surfactant Complexes. PLoS ONE. 2014; 9: e110195. doi: 10.1371/journal.pone.0110195
PMID: 25333871
21. Ghaedi M, Calle EA, Mendez JJ, Gard AL, Balestrini J, Booth A, et al. Human iPS cell-derived alveolar
epithelium repopulates lung extracellular matrix. J Clin Invest. 2013; 123: 4950–4962. doi: 10.1172/
JCI68793 PMID: 24135142
22. Ghaedi M, Mendez JJ, Bove PF, Sivarapatna A, Raredon MSB, Niklason LE. Alveolar epithelial differ-
entiation of human induced pluripotent stem cells in a rotating bioreactor. Biomaterials. 2014; 35: 699–
710. doi: 10.1016/j.biomaterials.2013.10.018 PMID: 24144903
23. Marx V. Cell-line authentication demystified. Nat Methods. 2014; 11: 483–488. doi: 10.1038/nmeth.
2932
24. O’Hare MJ, Bond J, Clarke C, Takeuchi Y, Atherton AJ, Berry C, et al. Conditional immortalization of
freshly isolated human mammary fibroblasts and endothelial cells. Proc Natl Acad Sci U S A. 2001; 98:
646–651. doi: 10.1073/pnas.98.2.646 PMID: 11209060
25. Geraghty RJ, Capes-Davis A, Davis JM, Downward J, Freshney RI, Knezevic I, et al. Guidelines for
the use of cell lines in biomedical research. Br J Cancer. 2014; 111: 1021–1046. doi: 10.1038/bjc.
2014.166 PMID: 25117809
26. Giard DJ, Aaronson SA, Todaro GJ, Arnstein P, Kersey JH, Dosik H, et al. In vitro cultivation of human
tumors: establishment of cell lines derived from a series of solid tumors. J Natl Cancer Inst. 1973; 51:
1417–1423. PMID: 4357758
27. Lieber M, Smith B, Szakal A, Nelson-Rees W, Todaro G. A continuous tumor-cell line from a human
lung carcinoma with properties of type II alveolar epithelial cells. Int J Cancer J Int Cancer. 1976; 17:
62–70.
28. Foster KA, Oster CG, Mayer MM, Avery ML, Audus KL. Characterization of the A549 Cell Line as a
Type II Pulmonary Epithelial Cell Model for Drug Metabolism. Exp Cell Res. 1998; 243: 359–366. doi:
10.1006/excr.1998.4172 PMID: 9743595
29. Nardone LL, Andrews SB. Cell line A549 as a model of the type II pneumocyte: Phospholipid biosyn-
thesis from native and organometallic precursors. Biochim Biophys Acta BBA—Lipids Lipid Metab.
1979; 573: 276–295. doi: 10.1016/0005-2760(79)90061-4
Differentiation of A549 Cells by Long Term Culture
PLOS ONE | DOI:10.1371/journal.pone.0164438 October 28, 2016 18 / 20

30. Swain RJ, Kemp SJ, Goldstraw P, Tetley TD, Stevens MM. Assessment of Cell Line Models of Primary
Human Cells by Raman Spectral Phenotyping. Biophys J. 2010; 98: 1703–1711. doi: 10.1016/j.bpj.
2009.12.4289 PMID: 20409492
31. Corbière V, Dirix V, Norrenberg S, Cappello M, Remmelink M, Mascart F. Phenotypic characteristics
of human type II alveolar epithelial cells suitable for antigen presentation to T lymphocytes. Respir
Res. 2011; 12: 15. doi: 10.1186/1465-9921-12-15 PMID: 21261956
32. Balis JU, Bumgarner SD, Paciga JE, Paterson JF, Shelley SA. Synthesis of lung surfactant-associated
glycoproteins by A549 cells: description of an in vitro model for human type II cell dysfunction. Exp
Lung Res. 1984; 6: 197–213. PMID: 6092046
33. Livak KJ, Schmittgen TD. Analysis of Relative Gene Expression Data Using Real-Time Quantitative
PCR and the 2−ΔΔCT Method. Methods. 2001; 25: 402–408. doi: 10.1006/meth.2001.1262 PMID:
11846609
34. Vandesompele J, De Preter K, Pattyn F, Poppe B, Van Roy N, De Paepe A, et al. Accurate normaliza-
tion of real-time quantitative RT-PCR data by geometric averaging of multiple internal control genes.
Genome Biol. 2002; 3: research0034.1–research0034.11.
35. Kelder T, Pico AR, Hanspers K, van Iersel MP, Evelo C, Conklin BR. Mining Biological Pathways Using
WikiPathways Web Services. PLoS ONE. 2009; 4. doi: 10.1371/journal.pone.0006447 PMID:
19649250
36. Kelder T, van Iersel MP, Hanspers K, Kutmon M, Conklin BR, Evelo CT, et al. WikiPathways: building
research communities on biological pathways. Nucleic Acids Res. 2011; gkr1074. doi: 10.1093/nar/
gkr1074 PMID: 22096230
37. Pico AR, Kelder T, van Iersel MP, Hanspers K, Conklin BR, Evelo C. WikiPathways: Pathway Editing
for the People. PLoS Biol. 2008; 6: e184. doi: 10.1371/journal.pbio.0060184 PMID: 18651794
38. Wang D, Haviland DL, Burns AR, Zsigmond E, Wetsel RA. A pure population of lung alveolar epithelial
type II cells derived from human embryonic stem cells. Proc Natl Acad Sci. 2007; 104: 4449–4454. doi:
10.1073/pnas.0700052104 PMID: 17360544
39. Pinto M, Robine-Leon S, Appay M-D, Kedinger M, Triadou N, Dussaulx E, et al. Enterocyte-like differ-
entiation and polarization of the human colon carcinoma cell line Caco-2 in culture. Biol Cell. 1983; 47:
323–330.
40. Cereijido M, Robbins ES, Dolan WJ, Rotunno CA, Sabatini DD. Polarized monolayers formed by epi-
thelial cells on a permeable and translucent support. J Cell Biol. 1978; 77: 853–880. PMID: 567227
41. Mason RJ, Williams MC. Phospholipid composition and ultrastructure of A549 cells and other cultured
pulmonary epithelial cells of presumed type II cell origin. Biochim Biophys Acta. 1980; 617: 36–50.
PMID: 6243488
42. Heijink IH, Brandenburg SM, Noordhoek JA, Postma DS, Slebos D-J, van Oosterhout AJM. Character-
isation of cell adhesion in airway epithelial cell types using electric cell–substrate impedance sensing.
Eur Respir J. 2010; 35: 894–903. doi: 10.1183/09031936.00065809 PMID: 19741028
43. Begley CG, Ellis LM. Drug development: Raise standards for preclinical cancer research. Nature.
2012; 483: 531–533. doi: 10.1038/483531a PMID: 22460880
44. Strunk RC, Eidlen DM, Mason RJ. Pulmonary alveolar type II epithelial cells synthesize and secrete
proteins of the classical and alternative complement pathways. J Clin Invest. 1988; 81: 1419–1426.
doi: 10.1172/JCI113472 PMID: 2966814
45. Schmitz G, Muller G. Structure and function of lamellar bodies, lipid-protein complexes involved in stor-
age and secretion of cellular lipids. J Lipid Res. 1991; 32: 1539–1570. PMID: 1797938
46. Hariri M, Millane G, Guimond M-P, Guay G, Dennis JW, Nabi IR. Biogenesis of Multilamellar Bodies
via Autophagy. Mol Biol Cell. 2000; 11: 255–268. PMID: 10637306
47. Lajoie P, Guay G, Dennis JW, Nabi IR. The lipid composition of autophagic vacuoles regulates expres-
sion of multilamellar bodies. J Cell Sci. 2005; 118: 1991–2003. doi: 10.1242/jcs.02324 PMID:
15840653
48. Liang C, Jung JU. Autophagy Genes as Tumor Suppressors. Curr Opin Cell Biol. 2010; 22: 226–233.
doi: 10.1016/j.ceb.2009.11.003 PMID: 19945837
49. Kuma A, Hatano M, Matsui M, Yamamoto A, Nakaya H, Yoshimori T, et al. The role of autophagy dur-
ing the early neonatal starvation period. Nature. 2004; 432: 1032–1036. doi: 10.1038/nature03029
PMID: 15525940
50. Copland IB, Post M. Understanding the Mechanisms of Infant Respiratory Distress and Chronic Lung
Disease. Am J Respir Cell Mol Biol. 2002; 26: 261–265. doi: 10.1165/ajrcmb.26.3.f231 PMID: 11867331
51. Saitoh T, Fujita N, Jang MH, Uematsu S, Yang B-G, Satoh T, et al. Loss of the autophagy protein
Atg16L1 enhances endotoxin-induced IL-1β production. Nature. 2008; 456: 264–268. doi: 10.1038/
nature07383 PMID: 18849965
Differentiation of A549 Cells by Long Term Culture
PLOS ONE | DOI:10.1371/journal.pone.0164438 October 28, 2016 19 / 20

52. Cadwell K, Liu J, Brown SL, Miyoshi H, Loh J, Lennerz J, et al. A unique role for autophagy and
Atg16L1 in Paneth cells in murine and human intestine. Nature. 2008; 456: 259–263. doi: 10.1038/
nature07416 PMID: 18849966
53. Mulugeta S, Gray JM, Notarfrancesco KL, Gonzales LW, Koval M, Feinstein SI, et al. Identification of
LBM180, a Lamellar Body Limiting Membrane Protein of Alveolar Type II Cells, as the ABC Trans-
porter Protein ABCA3. J Biol Chem. 2002; 277: 22147–22155. doi: 10.1074/jbc.M201812200 PMID:
11940594
54. Agassandian M, Mallampalli RK. Surfactant phospholipid metabolism. Biochim Biophys Acta. 2013;
1831: 612–625. doi: 10.1016/j.bbalip.2012.09.010 PMID: 23026158
55. Weaver TE, Na C-L, Stahlman M. Biogenesis of lamellar bodies, lysosome-related organelles involved
in storage and secretion of pulmonary surfactant. Semin Cell Dev Biol. 2002; 13: 263–270. doi: 10.
1016/S1084952102000551 PMID: 12243725
56. Seo D-C, Sung J-M, Cho H-J, Yi H, Seo K-H, Choi I-S, et al. Gene expression profiling of cancer stem
cell in human lung adenocarcinoma A549 cells. Mol Cancer. 2007; 6: 75. doi: 10.1186/1476-4598-6-75
PMID: 18034892
Differentiation of A549 Cells by Long Term Culture
PLOS ONE | DOI:10.1371/journal.pone.0164438 October 28, 2016 20 / 20