High impact weather nowcasting and short-range forecasting using advanced IR soundings
1
4.09 LONG RANGE LIGHTNING NOWCASTING APPLICATIONS FOR METEOROLOGY
Nicholas W.S. Demetriades, Martin J. Murphy and Ronald L. HolleVaisala, Inc., Tucson, Arizona
1. INTRODUCTION
Real-time lightning detection data are used for avariety of meteorological and aviation applications overland areas where cloud-to-ground lightning (CG)networks cover all or part of 40 countries. Real-time CGdata are typically combined with radar and otherinformation to identify significant weather over a widerange of time and space scales.
The outer limit of land-based CG flash detectionnetworks is set at 625 km from sensors in the U.S.National Lightning Detection Network (NLDN) and theCanadian Lightning Detection Network (CLDN). Thisdistance is determined by characteristics of the radiationemitted by the ground waves from CG flashes (Section2). While 625 km is beyond the range of coastalmeteorological radars, it is not especially far from landfor convective weather systems that often translate andevolve at velocities of 50 km per hour or more.
The primary sources of information aboutthunderstorms over the oceans beyond the 625-kmrange are satellite imagery, as well as pilot and shipreports. Satellite scans are often collected at 30-minuteintervals with a subsequent time delay in availability.Ship reports are sparse, and sporadic pilot reports areoften delayed in time. As a result, flights over oceanscan enter convective regions with little or no warning.Aircraft can encounter turbulence, icing, direct lightningstrikes, and other hazards that can be avoided over andnear land regions where there are CG lightning andradar networks (Nierow et al., 2002). Similarly, shippingand other offshore interests have a relatively smallamount of information on convective activity beyond therange of the nearest land-based radar.
Vaisala is conducting an ongoing experiment tooperate a VLF long-range lightning detection network(LLDN) over the Atlantic and Pacific Oceans to detectflashes thousands of kilometers from sensors in NorthAmerica, Europe and Asia. The following studydescribes results in two regions, the extratropical areasand the tropics. In extratropical regions, frequentlightning has been found in cyclones during the coldseason over the oceans. The detection of lightning insuch cyclones has shown that flashes are often anindicator of future storm development, intensification,and precipitation intensity. In the tropics, outbreaks oflightning within eyewalls of some hurricanes near thecoast had been studied with respect to eyewallcontraction or secondary eyewall replacement. Theprior research has been expanded to strong hurricanesover much larger areas than previously possible. In
*Corresponding author address: Nicholas W.S.Demetriades, Vaisala, Inc., Tucson, AZ 85706; e-mail:[email protected].
addition, detection of flashes in outer rainbands oftropical cyclones may provide forecasters with avaluable diagnostic tool. For many areas that do notexperience the inner core of the hurricane, intense outerrainbands contain the most hazardous weather. Inweaker tropical cyclones, such as tropical depressionsand storms, intense rainbands often contain the highestwind speeds and heaviest rainfall.
2. LONG-RANGE LIGHTNING DETECTIONNETWORK (LLDN)
NLDN and CLDN wideband sensors operate in thefrequency range from about 0.5 and 400 kHz wherereturn strokes in CG flashes radiate most strongly. Thepeak radiation from CG flashes comes near 10 kHz inthe middle of the very low frequency (VLF) band of 3-30kHz. Signals in the VLF band are trapped in the earth-ionosphere waveguide and suffer relatively less severeattenuation than higher frequency signals. Lowfrequency (LF) and VLF ground wave signals from CGsare attenuated strongly, and are almost imperceptibleafter a propagation distance of 500 to 1000 km.However VLF signals may be detected severalthousand kilometers away after one or more reflectionsoff the ground and the ionosphere. Detection is bestwhen both a lightning source and a sensor are on thenight side of the earth, because of better ionosphericpropagation conditions at night. The NLDN can easilydetect and process signals from lightning at longdistances because the standard sensors in the networksdetect across a broad band that includes all of the VLF.
Standard NLDN sensors have been part of anongoing experimental long-range detection networkconsisting of the combination of the CLDN, theJapanese Lightning Detection Network, the Meteo-France network, and the BLIDS, Benelux, and CentralEuropean networks operated by Siemens in Germany.This combination of networks detects CG flashes insufficient numbers and with sufficient accuracy toidentify small thunderstorm areas. The network detectsCGs to varying degrees over the northern Atlantic andPacific oceans, and also over some areas of Asia andLatin America not covered by local ground-basedlightning detection networks.
3. OCEANIC EXTRATROPICAL CYCLONELIGHTNING NOWCASTING APPLICATIONS
Section 3 will review some of the effects thatoceanic convection and latent heat release have onextratropical cyclogenesis, and discuss how lightningdata can identify these areas. Other applications arethe ability of lightning information to help identify short-

2
wave troughs, the rapid intensification of oceanicextratropical cyclones, and deep tropical moisturetransported along a cold front into the cold sector of astorm. The potential for long-range lightning data toimprove numerical simulations of extratropical cyclonesis also an advantage of the LLDN. Lightning data,GOES infrared satellite images and surface maps willbe used to show examples of these applications. Anextended description of these and other cases is inDemetriades and Holle (2005a).
The nature of LLDN data is shown by two examplesoff the U.S. west and east coasts in December 2002.Figure 1 shows a cyclone approaching the west coastduring flow with a westerly component. While the NLDNshows some flashes (red) when the storm comes closeto land, the LLDN (blue) detects many more flashesmuch further offshore. Figure 2 shows the rate toexceed 1600 flashes per hour with the long-range data.
Along the east coast, Figs. 3 and 4 indicate how theNLDN depicted a fairly large portion of the flash extentduring a cyclone that developed into a nor’easter.However, the long period of flashes and very high ratesexceeding 12,000 flashes per hour are much betterdepicted by the LLDN.
Figure 1. Map of cloud-to-ground (CG) flashes during theapproach to the U.S. west coast of a Pacific storm from 17 to20 December 2002. NLDN flashes are shown in red, and long-range flashes in blue.
0
200
400
600
800
1000
1200
1400
1600
1800
12/1
7/20
02 1
830
12/1
7/20
02 2
130
12/1
8/20
02 0
030
12/1
8/20
02 0
330
12/1
8/20
02 0
630
12/1
8/20
02 0
930
12/1
8/20
02 1
230
12/1
8/20
02 1
530
12/1
8/20
02 1
830
12/1
8/20
02 2
130
12/1
9/20
02 0
030
12/1
9/20
02 0
330
12/1
9/20
02 0
630
12/1
9/20
02 0
930
12/1
9/20
02 1
230
12/1
9/20
02 1
530
12/1
9/20
02 1
830
12/1
9/20
02 2
130
12/2
0/20
02 0
030
12/2
0/20
02 0
330
12/2
0/20
02 0
630
12/2
0/20
02 0
930
Time (MM/DD/YYYY HH:mm) UTC
Num
ber o
f CG
Fla
shes
NLDN ILRN
Figure 2. Time series of flashes for Pacific storm in Fig. 1.NLDN flashes in red, and long-range flashes in blue.
From these examples, it can be seen that long-range flashes from the LLDN compared to land-basedCGs:� Cover a larger area,� Extend the time periods with lightning,� Detect many more flashes.
3.1 Extratropical Cyclogenesis
Lightning indicates areas of convection where latentheat release into the troposphere is enhanced. Inparticular, high flash rates over relatively large areasidentify regions of large latent heat release that cancause enhanced vertical motion and pressure falls atthe surface. Therefore, a widespread area ofconcentrated lightning activity over the ocean may beone of the first signs of extratropical cyclogenesis.
Lightning can also be generated by the enhancedlift and relatively cold air aloft associated with shortwave troughs. As these areas of enhanced upwardvertical motion and colder air propagate over relativelywarm ocean waters during the winter, they oftengenerate lightning. These short wave troughs can thentrigger rapid cyclogenesis as they round the base of along wave trough. As a result, relatively compact areas
Figure 3. Same as Fig. 1 for Atlantic nor’easter from24 to 26 December 2002.
0
2000
4000
6000
8000
10000
12000
14000
12/2
4/20
02 0
030
12/2
4/20
02 0
330
12/2
4/20
02 0
630
12/2
4/20
02 0
930
12/2
4/20
02 1
230
12/2
4/20
02 1
530
12/2
4/20
02 1
830
12/2
4/20
02 2
130
12/2
5/20
02 0
030
12/2
5/20
02 0
330
12/2
5/20
02 0
630
12/2
5/20
02 0
930
12/2
5/20
02 1
230
12/2
5/20
02 1
530
12/2
5/20
02 1
830
12/2
5/20
02 2
130
12/2
6/20
02 0
030
12/2
6/20
02 0
330
12/2
6/20
02 0
630
12/2
6/20
02 0
930
12/2
6/20
02 1
230
12/2
6/20
02 1
530
12/2
6/20
02 1
830
12/2
6/20
02 2
130
Num
ber o
f CG
Fla
shes
Figure 4. Same as Fig. 2 for storm in Fig. 3.

3
of lightning activity propagating over the oceans canhelp identify the existence and intensity of short wavetroughs that play a critical role in oceanic cyclogenesis.
Figures 5 to 8 show lightning development over alarge area preceding surface extratropical cyclogenesisover the oceans in winter. Figure 5 depicts majorpressure centers and fronts at 0000 UTC 7 January2003. A low is east of the southern New England coast,and a cold front extends through Florida into the Gulf ofMexico. Figure 6 shows substantial lightning developingalong the cold front. Lightning continues 6 hours lateras a wave of low pressure developed (Fig. 7). By 0900UTC, a fairly intense extratropical cyclone haddeveloped with a minimum pressure of 996 mb (Fig. 8).
Figure 5. Surface map showing locations of major pressurecenters and fronts at 0000 UTC 7 January 2003.
Figure 6. Long range lightning data and infrared satelliteimage on 6 January 2003. Lightning is for 3 hours from 2053to 2353 UTC. Yellow dots are flashes detected during the firsttwo hours from 2053 to 2253 UTC, and red are from the latesthour from 2253 to 2353. Satellite image is at 2353.
3.2 Extratropical Cyclone Intensity
3.2.1 Lightning near center of an extratropical cyclone
Latent heat release associated with convection cancause rapid intensification of a system if large areas ofconvection, and by implication lightning, are presentnear a developing low (Reed and Albright, 1986; Martinand Otkin, 2004). Similarly, large areas of convectionalong a frontal boundary will cause enhancedfrontogenesis due to the increased lift, and byimplication convergence, created by latent heating. Asa result, the existence of significant lightning rates overopen areas of the oceans can help forecasters toidentify areas where deep cumulus convection islocated and then may influence storm and frontaldevelopment.
Figure 7. Same as Fig. 6, except for lightning from 0553 to0853 UTC 7 January 2003. Satellite image is at 0853.
Figure 8. Same as Fig. 5, except for 0900 UTC 7 January.

4
Lightning development near an existingextratropical cyclone center sometimes may be aresponse to rapid intensification, rather than a precursorto subsequent intensification. During explosivecyclogenesis, pressure falls cause increasedconvergence and lift. Lightning may develop if this liftoccurs over relatively warm ocean waters with its amplesupply of moisture. This sequence is shown by long-range lightning data near the center of an extratropicalcyclone southeast of Newfoundland (Figs. 9 and 10).Lightning in Fig. 9 was detected between 1753 and2053 UTC on 7 January 2003, and the surface map inFig. 10 is at 2100. The area of active convection isprobably not large enough to cause rapid intensificationthrough latent heating. But the initiation of lightning 3
Figure 9. Same as Fig. 6, except for lightning between 1753and 2053 UTC 7 January 2003. Satellite image is at 2053.
Figure 10. Same as Fig. 5, except at 2100 UTC 7 January.
hours earlier near the center of this storm between 1453and 1753 UTC (not shown), and its persistence through2053, was coincident with a 13 mb drop in pressurefrom 992 to 979 mb from 1500 to 2100 UTC 7 January.
3.2.2 Lightning in a short wave trough
Short wave troughs can produce lightning throughenhanced lift and colder temperatures aloft. Flashesproduced by a short wave trough may be an importantcomplement to satellite imagery to help forecastersidentify these important impulses. Such impulses willoften round the base of a long-wave trough and causeexplosive cyclogenesis as they interact with a pre-existing extratropical cyclone center. Figures 11 and 12show lightning produced by a short wave trough that isabout to interact with a coastal low located off the NorthCarolina coast. Figure 11 shows the low with a centralpressure of 997 mb at 0900 UTC 25 December 2002,and Fig. 12 shows lightning detected between 0600 and0900 UTC. In this case, the short wave trough and thelightning it was producing were located over NorthCarolina. This short wave trough caused explosivedeepening of the coastal low and by 1800 UTC, itsminimum pressure was 979 mb (Fig. 13).
3.2.3 Role of downstream convection on extratropicalcyclone intensity and track
Large areas of convection that develop downstreamfrom an extratropical cyclone can greatly influence thestorm’s intensity, track and precipitation distribution(Alexander et al., 1999; Atallah and Bosart, 2003;Chang et al., 2001). This convection typically developsbetween the long wave trough and downstream ridgeassociated with an extratropical cyclone. Theconvection releases massive amounts of latent heat thatraise the heights of mid- and upper-level pressure fields.
Figure 11. Same as Fig. 5 except for 0900 UTC 25December 2002. A low is developing just E of North Carolina.

5
Depending on the location of this convection, it caneither amplify the trough and downstream ridge, orcause the trough and downstream ridge to deamplify.The amplification or deamplification of the trough anddownstream ridge can cause important changes inextratropical cyclone intensity, track and precipitationdistribution. An example in Fig. 14 shows an extremelylarge area of downstream convection east of the sameextratropical cyclone approaching the west coast as wasshown by Figs. 1 and 2.
3.2 Cold Front Convection and Winter Precipitation
Very intense lightning activity along the cold front ofan extratropical cyclone - but not near the center of thestorm - can be an indication of deep tropical moisture
Figure 12. NLDN CG flashes detected between 0600 and0900 UTC 25 December 2002. The short wave trough overcentral North Carolina is producing CG lightning.
Figure 13. Same as Fig. 5, except for 1800 UTC 25December 2002. The coastal low is near southern New Jerseyand has a central pressure of 979 mb.
available to the storm. Such deep tropical moisture canbe transported into the cold sector of a storm and causelarge amounts of winter precipitation including snow,sleet, freezing rain and rain.
The Presidents’ Day Snowstorm of 2003 producedfrequent lightning along its cold front, as well as highsnowfall totals in the Mid-Atlantic and southern NewEngland states. However, the minimum centralpressure never dropped below 1000 mb. Figure 15shows CG flashes from the long-range lightningdetection network within this extratropical cyclonebetween 0853 and 1153 UTC 16 February. Veryfrequent lightning was occurring within large areas ofconvection south of the storm center, along the coldfront. The southerly flow associated with this systemwas transporting moisture northward into the Mid-Atlantic and Southern New England states wheretemperatures were well below freezing. Snowfall totalswere generally between 2 and 4 feet (60 to 120 cm).
Figure 14. Same as Fig. 6, except for lightning between 1452and 1752 UTC 18 December 2002. Satellite image is at 1752.
Figure 15. Same as Fig. 6, except for lightning from 0853 to1153 UTC 16 February 2003. Satellite image is at 1153.
6
This example shows how the location and amountof lightning within extratropical cyclones can helpdetermine its potential impacts. Extremely largeamounts of lightning activity may be useful forprecipitation nowcasting and forecasting.
4. TROPICAL CYCLONE LIGHTNINGNOWCASTING APPLICATIONS
Section 4 will review how LLDN data over oceanicregions can be used to monitor tropical cyclones farfrom land. The LLDN continuously monitors lightningactivity in tropical cyclones over a large portion of theAtlantic and Eastern Pacific tropical cyclone basins.
Lightning activity in tropical cyclones has beenexamined in several studies (Molinari et al., 1994;Molinari et al., 1999; Lyons and Keen, 1994; Black andHallett, 1999; Cecil et al., 2002; Samsury and Orville,1994). Most studies used NLDN data, and one usedlightning detected by the Lightning Imaging Sensor (LIS)located onboard the Tropical Rainfall Measuring Mission(TRMM) satellite. Past analyses of lightning activity intropical cyclones from the NLDN were limited to regionswithin ~400 km of the U.S. coastline. Analysis oflightning activity in tropical cyclones from LIS werelimited to TRMM overpasses that occurred no more thantwice a day for 90 seconds at a time.
Tropical depressions and tropical storms aregenerally more prolific lightning producers thanhurricanes. Lightning activity in these systems does notshow a preferential spatial pattern. New observations ofCG lightning activity within numerous tropical cyclonesover the Atlantic and Eastern Pacific Oceans away fromland have reinforced many of the findings of Molinari etal. (1999). An extended description of these cases is inDemetriades and Holle (2005b).
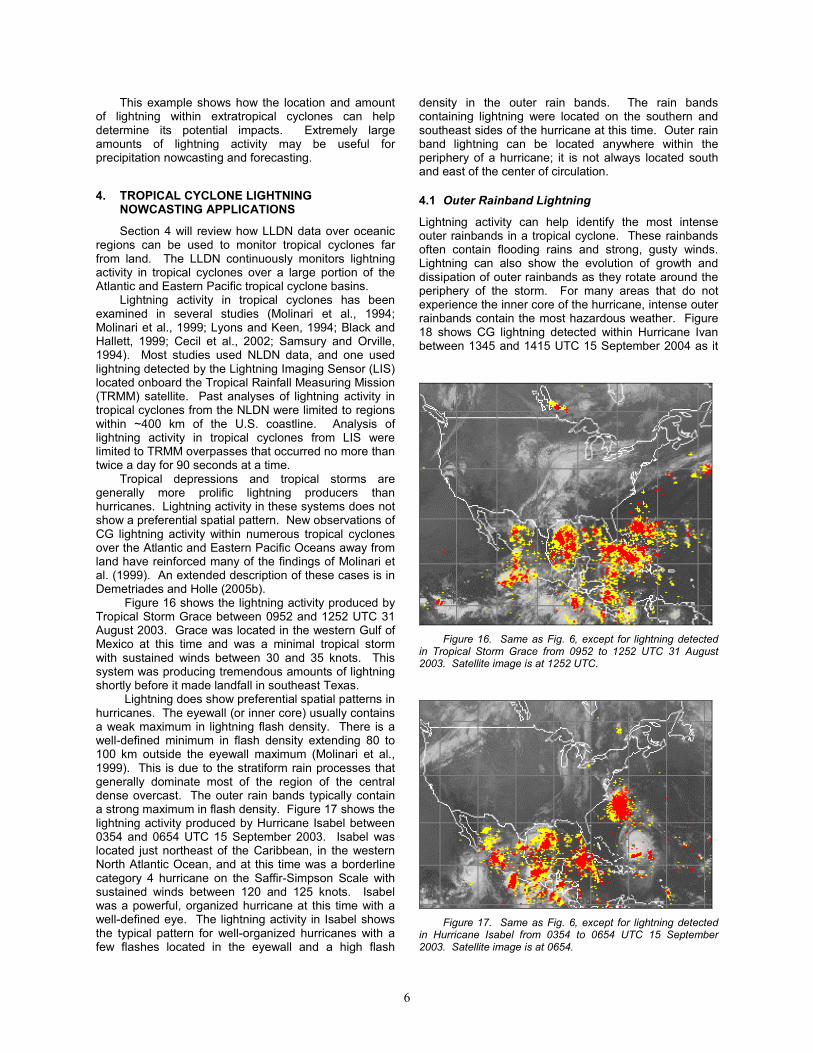
Figure 16 shows the lightning activity produced byTropical Storm Grace between 0952 and 1252 UTC 31August 2003. Grace was located in the western Gulf ofMexico at this time and was a minimal tropical stormwith sustained winds between 30 and 35 knots. Thissystem was producing tremendous amounts of lightningshortly before it made landfall in southeast Texas.
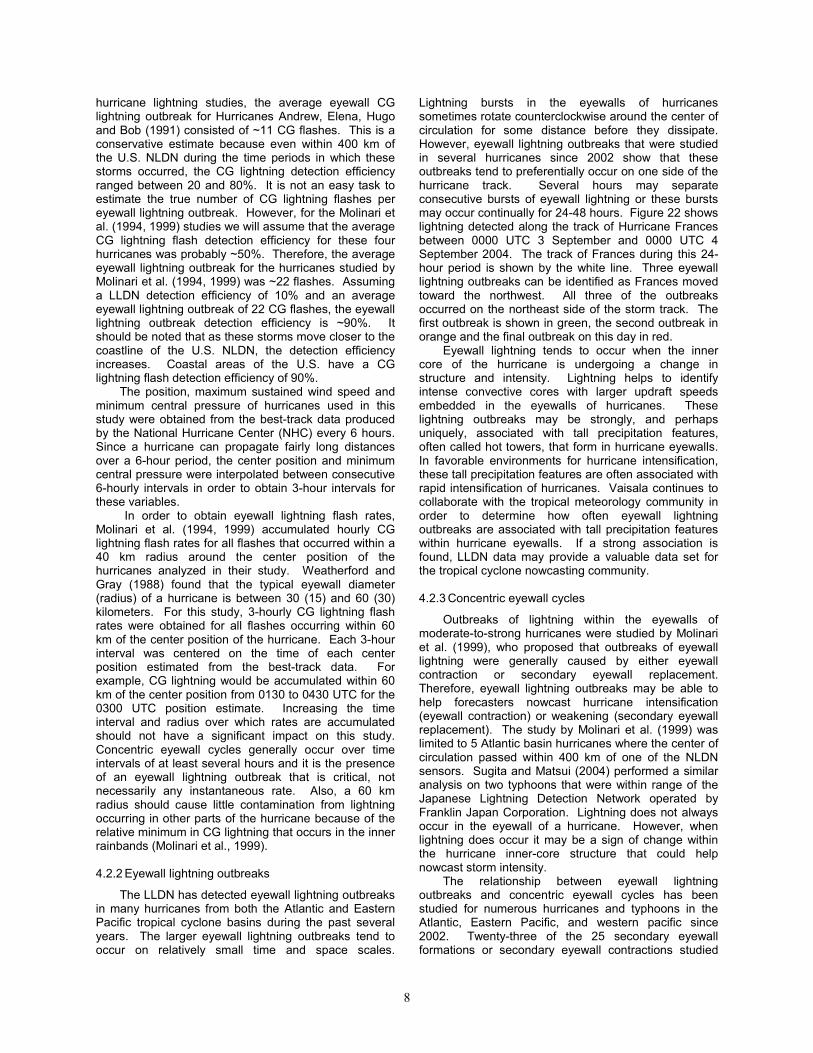
Lightning does show preferential spatial patterns inhurricanes. The eyewall (or inner core) usually containsa weak maximum in lightning flash density. There is awell-defined minimum in flash density extending 80 to100 km outside the eyewall maximum (Molinari et al.,1999). This is due to the stratiform rain processes thatgenerally dominate most of the region of the centraldense overcast. The outer rain bands typically containa strong maximum in flash density. Figure 17 shows thelightning activity produced by Hurricane Isabel between0354 and 0654 UTC 15 September 2003. Isabel waslocated just northeast of the Caribbean, in the westernNorth Atlantic Ocean, and at this time was a borderlinecategory 4 hurricane on the Saffir-Simpson Scale withsustained winds between 120 and 125 knots. Isabelwas a powerful, organized hurricane at this time with awell-defined eye. The lightning activity in Isabel showsthe typical pattern for well-organized hurricanes with afew flashes located in the eyewall and a high flash
density in the outer rain bands. The rain bandscontaining lightning were located on the southern andsoutheast sides of the hurricane at this time. Outer rainband lightning can be located anywhere within theperiphery of a hurricane; it is not always located southand east of the center of circulation.
4.1 Outer Rainband Lightning
Lightning activity can help identify the most intenseouter rainbands in a tropical cyclone. These rainbandsoften contain flooding rains and strong, gusty winds.Lightning can also show the evolution of growth anddissipation of outer rainbands as they rotate around theperiphery of the storm. For many areas that do notexperience the inner core of the hurricane, intense outerrainbands contain the most hazardous weather. Figure18 shows CG lightning detected within Hurricane Ivanbetween 1345 and 1415 UTC 15 September 2004 as it
Figure 16. Same as Fig. 6, except for lightning detectedin Tropical Storm Grace from 0952 to 1252 UTC 31 August2003. Satellite image is at 1252 UTC.
Figure 17. Same as Fig. 6, except for lightning detectedin Hurricane Isabel from 0354 to 0654 UTC 15 September2003. Satellite image is at 0654.

7
moved toward the U.S. coastline in the Gulf of Mexico.Lightning activity clearly delineates an intense outerrainband located on the east side of Ivan. Some otherstrong rainbands are shown by lightning data toward thesouth and southeast of the center of Ivan.
Hurricane Frances was a powerful category 3hurricane on the Saffir-Simpson scale during the timeperiod shown in Figure 19. Usually, high rates oflightning activity occur in one or two dominant rainbandslocated on one side of the hurricane. Frances wassomewhat unique during this time as lightning activityindicated intense outer rainbands surrounding most ofthe periphery of the storm.
Figure 20 shows the evolution of an outer rainbandas it rotates counterclockwise around the center ofHurricane Fabian on 5 September 2003. Between 1253and 1553 UTC, lightning activity indicated that the mostintense outer rainband rotated from a position locatedtoward the east of the center of Fabian (yellow) to aposition located to the north of Fabian (red).
In weaker tropical cyclones, such as tropicaldepressions and storms, intense rainbands oftencontain the highest wind speeds and heaviest rainfall.In order to properly issue tropical depression and stormadvisories and warnings, it is critical to be able toidentify the location and evolution of these features.Lightning activity provides a valuable dataset for
Figure 18. CG lightning detected in Hurricane Ivan between1345 and 1415 UTC 15 September 2004.
Figure 19. CG lightning detected in Hurricane Francesbetween 0945 and 1015 UTC 1 September 2004.
outer rainbands were identified by high rates of lightningactivity located toward the southeast of Tropical StormKyle (Figure 21).
4.2 Eyewall Lightning
4.2.1 Methodology
For the eyewall study, tropical cyclones wereexamined only when they:• Reached hurricane strength for at least 24 hours,• Achieved category 3, 4 or 5 status on the Saffir-
Simpson Scale at some point during their lifetime,• Had their center within an area covered by at least
10% daytime CG lightning flash detection efficiencyaccording to Vaisala’s LLDN models.
The minimum CG lightning detection efficiencythreshold of 10% means that the center of circulation foran Atlantic Basin hurricane had to be west of 65 W if thecenter was located south of 30 N, and west of 45 W ifthe center was north of 30 N. For Eastern Pacific Basinhurricanes, the center of the storm had to be locatednorth of 20 N.
A 10% CG lightning detection threshold waschosen because it should still yield a relatively highdetection efficiency for an eyewall lightning outbreak.Upon inspection of the Molinari et al. (1994, 1999)
Figure 20. Same as Fig. 6, except for lightning detected inHurricane Fabian from 1253 to 1553 UTC 5 September 2003.
Figure 21. Same as Fig. 6, except for lightning detected inTropical Storm Kyle from 1453 to 1753 UTC 2 October 2002.
8
hurricane lightning studies, the average eyewall CGlightning outbreak for Hurricanes Andrew, Elena, Hugoand Bob (1991) consisted of ~11 CG flashes. This is aconservative estimate because even within 400 km ofthe U.S. NLDN during the time periods in which thesestorms occurred, the CG lightning detection efficiencyranged between 20 and 80%. It is not an easy task toestimate the true number of CG lightning flashes pereyewall lightning outbreak. However, for the Molinari etal. (1994, 1999) studies we will assume that the averageCG lightning flash detection efficiency for these fourhurricanes was probably ~50%. Therefore, the averageeyewall lightning outbreak for the hurricanes studied byMolinari et al. (1994, 1999) was ~22 flashes. Assuminga LLDN detection efficiency of 10% and an averageeyewall lightning outbreak of 22 CG flashes, the eyewalllightning outbreak detection efficiency is ~90%. Itshould be noted that as these storms move closer to thecoastline of the U.S. NLDN, the detection efficiencyincreases. Coastal areas of the U.S. have a CGlightning flash detection efficiency of 90%.
The position, maximum sustained wind speed andminimum central pressure of hurricanes used in thisstudy were obtained from the best-track data producedby the National Hurricane Center (NHC) every 6 hours.Since a hurricane can propagate fairly long distancesover a 6-hour period, the center position and minimumcentral pressure were interpolated between consecutive6-hourly intervals in order to obtain 3-hour intervals forthese variables.
In order to obtain eyewall lightning flash rates,Molinari et al. (1994, 1999) accumulated hourly CGlightning flash rates for all flashes that occurred within a40 km radius around the center position of thehurricanes analyzed in their study. Weatherford andGray (1988) found that the typical eyewall diameter(radius) of a hurricane is between 30 (15) and 60 (30)kilometers. For this study, 3-hourly CG lightning flashrates were obtained for all flashes occurring within 60km of the center position of the hurricane. Each 3-hourinterval was centered on the time of each centerposition estimated from the best-track data. Forexample, CG lightning would be accumulated within 60km of the center position from 0130 to 0430 UTC for the0300 UTC position estimate. Increasing the timeinterval and radius over which rates are accumulatedshould not have a significant impact on this study.Concentric eyewall cycles generally occur over timeintervals of at least several hours and it is the presenceof an eyewall lightning outbreak that is critical, notnecessarily any instantaneous rate. Also, a 60 kmradius should cause little contamination from lightningoccurring in other parts of the hurricane because of therelative minimum in CG lightning that occurs in the innerrainbands (Molinari et al., 1999).
4.2.2 Eyewall lightning outbreaks
The LLDN has detected eyewall lightning outbreaksin many hurricanes from both the Atlantic and EasternPacific tropical cyclone basins during the past severalyears. The larger eyewall lightning outbreaks tend tooccur on relatively small time and space scales.
Lightning bursts in the eyewalls of hurricanessometimes rotate counterclockwise around the center ofcirculation for some distance before they dissipate.However, eyewall lightning outbreaks that were studiedin several hurricanes since 2002 show that theseoutbreaks tend to preferentially occur on one side of thehurricane track. Several hours may separateconsecutive bursts of eyewall lightning or these burstsmay occur continually for 24-48 hours. Figure 22 showslightning detected along the track of Hurricane Francesbetween 0000 UTC 3 September and 0000 UTC 4September 2004. The track of Frances during this 24-hour period is shown by the white line. Three eyewalllightning outbreaks can be identified as Frances movedtoward the northwest. All three of the outbreaksoccurred on the northeast side of the storm track. Thefirst outbreak is shown in green, the second outbreak inorange and the final outbreak on this day in red.
Eyewall lightning tends to occur when the innercore of the hurricane is undergoing a change instructure and intensity. Lightning helps to identifyintense convective cores with larger updraft speedsembedded in the eyewalls of hurricanes. Theselightning outbreaks may be strongly, and perhapsuniquely, associated with tall precipitation features,often called hot towers, that form in hurricane eyewalls.In favorable environments for hurricane intensification,these tall precipitation features are often associated withrapid intensification of hurricanes. Vaisala continues tocollaborate with the tropical meteorology community inorder to determine how often eyewall lightningoutbreaks are associated with tall precipitation featureswithin hurricane eyewalls. If a strong association isfound, LLDN data may provide a valuable data set forthe tropical cyclone nowcasting community.
4.2.3 Concentric eyewall cycles
Outbreaks of lightning within the eyewalls ofmoderate-to-strong hurricanes were studied by Molinariet al. (1999), who proposed that outbreaks of eyewalllightning were generally caused by either eyewallcontraction or secondary eyewall replacement.Therefore, eyewall lightning outbreaks may be able tohelp forecasters nowcast hurricane intensification(eyewall contraction) or weakening (secondary eyewallreplacement). The study by Molinari et al. (1999) waslimited to 5 Atlantic basin hurricanes where the center ofcirculation passed within 400 km of one of the NLDNsensors. Sugita and Matsui (2004) performed a similaranalysis on two typhoons that were within range of theJapanese Lightning Detection Network operated byFranklin Japan Corporation. Lightning does not alwaysoccur in the eyewall of a hurricane. However, whenlightning does occur it may be a sign of change withinthe hurricane inner-core structure that could helpnowcast storm intensity.
The relationship between eyewall lightningoutbreaks and concentric eyewall cycles has beenstudied for numerous hurricanes and typhoons in theAtlantic, Eastern Pacific, and western pacific since2002. Twenty-three of the 25 secondary eyewallformations or secondary eyewall contractions studied

Figure 22. CG lightning detected by the LLDN in Hurricane Frances between 0000 UTC 3 Septemberand 0000 UTC 4 September 2004. The track of the center of Frances during this 24-hour period is shown bythe yellow line. Three bursts of eyewall lightning are along the right side of the track of Frances as the stormmoved toward the northwest (upper left). The first burst of eyewall lightning is in green, the second burst is inorange, and the third burst is in red.
were associated with eyewall lightning outbreaks. Thelocations of these discreet lightning bursts may aidforecasters when trying to identify secondary eyewallformation and secondary eyewall contraction. Theformer situations implies that the rapid intensification ofa hurricane is coming to an end, and the latter situationimplies that the hurricane is about ready to rapidlyintensify.
4.2.4 Hurricane Charley
Charley developed just east of the WindwardIslands and moved WNW into the Caribbean Sea.Charley then turned to the north and made landfall as acategory 1 hurricane in western Cuba on 13 August.After crossing Cuba, Charley rapidly intensified andturned NNE, making landfall near Charlotte Harbor,Florida at ~2030 UTC 13 August. Charley attained
category 4 status shortly before landfall and reached amaximum intensity of 125 knots.
Eyewall lightning from Hurricane Charley wasanalyzed for the 19 hours preceding landfall. Data werenot analyzed before this time period due to high centerposition error estimates by the NHC, and poor LLDNgeometry relative to Charley’s position on 11-12 August.Figure 23 shows the eyewall flash rate superimposed oncentral pressure. Low-to-moderate rates of eyewalllightning occurred as Charley intensified at a moderaterate between 0300 and 1200 UTC. As the primaryeyewall of Charley contracted and the storm rapidlyintensified, eyewall flash rates increased dramatically.LLDN eyewall flash rates increased to 230 and 340 at1500 and 1800 UTC, respectively. At this time, asecondary eyewall developed around the primaryeyewall. The high flash rates at 2100 UTC may be atleast partially due to landfall of Charley at ~2030 UTC.
10
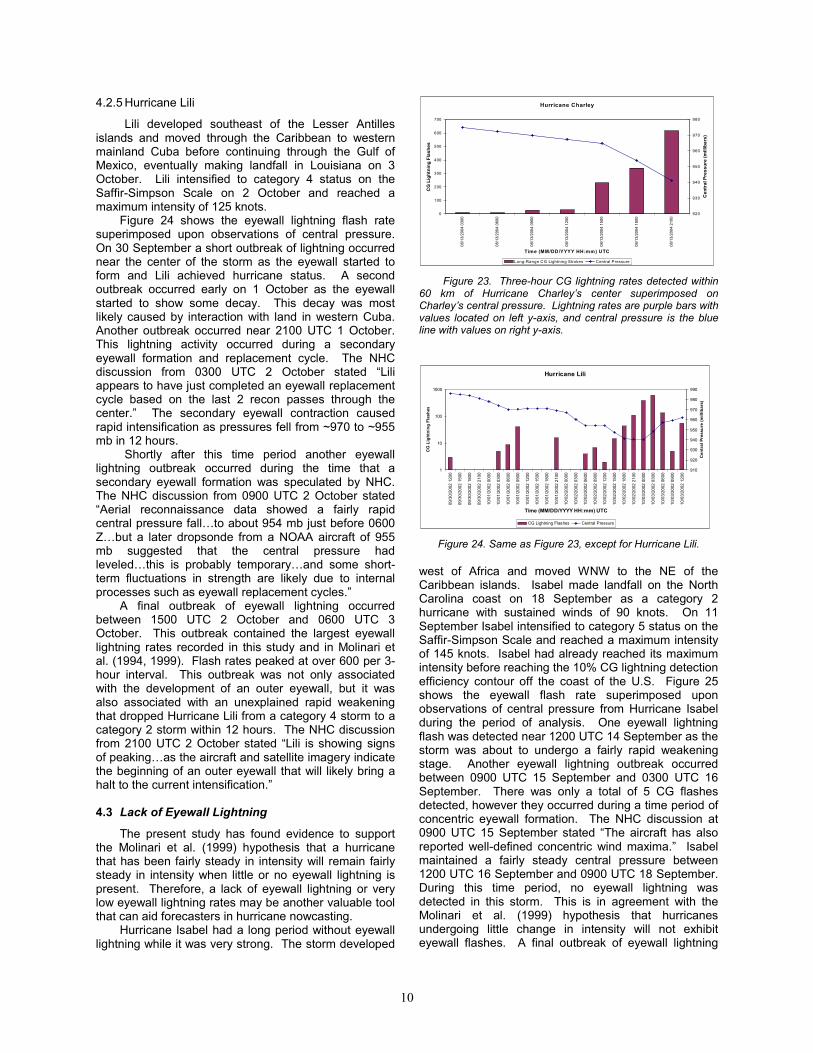
4.2.5 Hurricane Lili
Lili developed southeast of the Lesser Antillesislands and moved through the Caribbean to westernmainland Cuba before continuing through the Gulf ofMexico, eventually making landfall in Louisiana on 3October. Lili intensified to category 4 status on theSaffir-Simpson Scale on 2 October and reached amaximum intensity of 125 knots.
Figure 24 shows the eyewall lightning flash ratesuperimposed upon observations of central pressure.On 30 September a short outbreak of lightning occurrednear the center of the storm as the eyewall started toform and Lili achieved hurricane status. A secondoutbreak occurred early on 1 October as the eyewallstarted to show some decay. This decay was mostlikely caused by interaction with land in western Cuba.Another outbreak occurred near 2100 UTC 1 October.This lightning activity occurred during a secondaryeyewall formation and replacement cycle. The NHCdiscussion from 0300 UTC 2 October stated “Liliappears to have just completed an eyewall replacementcycle based on the last 2 recon passes through thecenter.” The secondary eyewall contraction causedrapid intensification as pressures fell from ~970 to ~955mb in 12 hours.
Shortly after this time period another eyewalllightning outbreak occurred during the time that asecondary eyewall formation was speculated by NHC.The NHC discussion from 0900 UTC 2 October stated“Aerial reconnaissance data showed a fairly rapidcentral pressure fall…to about 954 mb just before 0600Z…but a later dropsonde from a NOAA aircraft of 955mb suggested that the central pressure hadleveled…this is probably temporary…and some short-term fluctuations in strength are likely due to internalprocesses such as eyewall replacement cycles.”
A final outbreak of eyewall lightning occurredbetween 1500 UTC 2 October and 0600 UTC 3October. This outbreak contained the largest eyewalllightning rates recorded in this study and in Molinari etal. (1994, 1999). Flash rates peaked at over 600 per 3-hour interval. This outbreak was not only associatedwith the development of an outer eyewall, but it wasalso associated with an unexplained rapid weakeningthat dropped Hurricane Lili from a category 4 storm to acategory 2 storm within 12 hours. The NHC discussionfrom 2100 UTC 2 October stated “Lili is showing signsof peaking…as the aircraft and satellite imagery indicatethe beginning of an outer eyewall that will likely bring ahalt to the current intensification.”
4.3 Lack of Eyewall Lightning
The present study has found evidence to supportthe Molinari et al. (1999) hypothesis that a hurricanethat has been fairly steady in intensity will remain fairlysteady in intensity when little or no eyewall lightning ispresent. Therefore, a lack of eyewall lightning or verylow eyewall lightning rates may be another valuable toolthat can aid forecasters in hurricane nowcasting.
Hurricane Isabel had a long period without eyewalllightning while it was very strong. The storm developed
Hurricane Charley
0
100
200
300
400
500
600
700
08/1
3/20
04 0
300
08/1
3/20
04 0
600
08/1
3/20
04 0
900
08/1
3/20
04 1
200
08/1
3/20
04 1
500
08/1
3/20
04 1
800
08/1
3/20
04 2
100
Time (MM/DD/YYYY HH:mm) UTC
CG
Lig
htni
ng F
lash
es
920
930
940
950
960
970
980
Cen
tral
Pre
ssur
e (m
illib
ars)
Long-Range CG Lightning Strokes Central Pressure
Figure 23. Three-hour CG lightning rates detected within60 km of Hurricane Charley’s center superimposed onCharley’s central pressure. Lightning rates are purple bars withvalues located on left y-axis, and central pressure is the blueline with values on right y-axis.
Hurricane Lili
1
10
100
1000
09/3
0/20
02 1
200
09/3
0/20
02 1
500
09/3
0/20
02 1
800
09/3
0/20
02 2
100
10/0
1/20
02 0
000
10/0
1/20
02 0
300
10/0
1/20
02 0
600
10/0
1/20
02 0
900
10/0
1/20
02 1
200
10/0
1/20
02 1
500
10/0
1/20
02 1
800
10/0
1/20
02 2
100
10/0
2/20
02 0
000
10/0
2/20
02 0
300
10/0
2/20
02 0
600
10/0
2/20
02 0
900
10/0
2/20
02 1
200
10/0
2/20
02 1
500
10/0
2/20
02 1
800
10/0
2/20
02 2
100
10/0
3/20
02 0
000
10/0
3/20
02 0
300
10/0
3/20
02 0
600
10/0
3/20
02 0
900
10/0
3/20
02 1
200
Time (MM/DD/YYYY HH:mm) UTC
CG
Lig
htni
ng F
lash
es
910
920
930
940
950
960
970
980
990
Cen
tral
Pre
ssur
e (m
illib
ars)
CG Lightning Flashes Central Pressure
Figure 24. Same as Figure 23, except for Hurricane Lili.
west of Africa and moved WNW to the NE of theCaribbean islands. Isabel made landfall on the NorthCarolina coast on 18 September as a category 2hurricane with sustained winds of 90 knots. On 11September Isabel intensified to category 5 status on theSaffir-Simpson Scale and reached a maximum intensityof 145 knots. Isabel had already reached its maximumintensity before reaching the 10% CG lightning detectionefficiency contour off the coast of the U.S. Figure 25shows the eyewall flash rate superimposed uponobservations of central pressure from Hurricane Isabelduring the period of analysis. One eyewall lightningflash was detected near 1200 UTC 14 September as thestorm was about to undergo a fairly rapid weakeningstage. Another eyewall lightning outbreak occurredbetween 0900 UTC 15 September and 0300 UTC 16September. There was only a total of 5 CG flashesdetected, however they occurred during a time period ofconcentric eyewall formation. The NHC discussion at0900 UTC 15 September stated “The aircraft has alsoreported well-defined concentric wind maxima.” Isabelmaintained a fairly steady central pressure between1200 UTC 16 September and 0900 UTC 18 September.During this time period, no eyewall lightning wasdetected in this storm. This is in agreement with theMolinari et al. (1999) hypothesis that hurricanesundergoing little change in intensity will not exhibiteyewall flashes. A final outbreak of eyewall lightning

11
Hurricane Isabel
0
2
4
6
8
10
1209
/14/
2003
120
0
09/1
4/20
03 1
800
09/1
5/20
03 0
000
09/1
5/20
03 0
600
09/1
5/20
03 1
200
09/1
5/20
03 1
800
09/1
6/20
03 0
000
09/1
6/20
03 0
600
09/1
6/20
03 1
200
09/1
6/20
03 1
800
09/1
7/20
03 0
000
09/1
7/20
03 0
600
09/1
7/20
03 1
200
09/1
7/20
03 1
800
09/1
8/20
03 0
000
09/1
8/20
03 0
600
09/1
8/20
03 1
200
09/1
8/20
03 1
800
09/1
9/20
03 0
000
Time (MM/DD/YYYY HH:mm) UTC
CG
Lig
htni
ng F
lash
es
910
920
930
940
950
960
970
980
Cen
tral P
ress
ure
(mill
ibar
s)
CG Lightning Flashes Central Pressure
Figure 25. Same as Figure 23, except for Hurricane Isabel.
occurred between 1500 and 1800 UTC 18 September.This outbreak was probably initially caused byconcentric eyewall formation before being influenced bylandfall. The NHC discussion at 0900 UTC 18September stated “WSR-88D radar data from MoreheadCity shows what looks like a classic concentric eyewallformation…with a poorly-defined ring of convection nearthe center and a stronger ring 40-50 nm out.”
5. CONCLUSIONS
Lightning data over otherwise data-sparse regionsare expected to be valuable for meteorologists. Flashinformation is especially important for nowcasting andforecasting for aviation and maritime interests. Inaddition, long-range CG flash data identifies convectionthat can have significant subsequent impacts on landareas adjacent to oceans. Both extratropical andtropical regions can benefit from data from the LLDN.
In extratropical cyclones, a variety of situationshave been described where lightning data over theoceans have the potential to be very useful sources ofinformation about convection. The existence of CGflashes at specific times and locations over the oceanhelps identify features that form and intensifyextratropical cyclones. The spatial and temporal extent,and the pattern of such flashes can also be useful fordiagnosing the stage and extent of development of suchsystems. Flash data can be assimilated continuouslyinto numerical weather prediction models to betteridentify the presence of latent heat release that stronglyinfluences the progression of the track and intensity ofcyclonic systems in the model (Pessi et al., 2004). Inaddition the time, location, and amount of upstreamlightning may identify deep moisture that can beimportant in producing heavy downstream precipitation,including frozen precipitation on the ground in winter.The vertical structure of cold pools also may beidentified with flash data.
In tropical cyclones, LLDN data may provideforecasters a valuable diagnostic tool for observingconcentric eyewall cycles and other important dynamicchanges in the core of a hurricane, since concentriceyewall cycles are often obscured on visible andinfrared satellite imagery. Observations from this studysuggest that eyewall lightning outbreaks occur whenthere is a change in the dynamic structure of the eyewall
or center of circulation. Outbreaks were often observedwhen the eyewall became ragged or elongated inshape, dry air started to intrude on the storm center, ahurricane came under the influence of increased verticalwind shear, or during landfall. In addition, lightning inthe outer rainbands may identify which bands are themost intense. For areas outside the inner core, and inweaker tropical cyclones, intense rainbands oftencontain the highest wind speeds and heaviest rainfall.Appropriate advisories and warnings need to be able toidentify the location and evolution of such outerrainbands in those situations.
REFERENCES
Alexander, G.D., J.A. Weinman, V.M. Karyampudi, W.S.Olson, and A.C. Lee, 1999: The impact of theassimilation of rain rates from satellites andlightning on forecasts of the 1993 Superstorm.Mon. Wea. Rev., 127, 1433-1457.
Atallah, E.H., and L.R. Bosart, 2003: The extratropicaltransition and precipitation distribution of HurricaneFloyd (1999). Mon. Wea. Rev., 131, 1063-1081.
Black, R.A., and J. Hallett, 1999: Electrification of thehurricane. J. Atmos. Sci., 56, 2004-2028.
Cecil, D.J., E.J. Zipser and S.W. Nesbitt., 2002:Reflectivity, ice scattering, and lightningcharacteristics of hurricane eyewalls and rainbands.Part I: Quantitative description. Mon. Wea. Rev.,130, 769–784.
Chang, D.-E., J.A. Weinman, C.A. Morales, and W.S.Olson, 2001: The effect of spaceborne microwaveand ground-based continuous lightningmeasurements on forecasts of the 1998Groundhog-Day storm. Mon. Wea. Rev., 129,1809-1833.
Demetriades, N.W.S., and R.L. Holle, 2005a: Lightningproduced by cold season oceanic extratropicalcyclones: Observations related to nowcasting stormdevelopment, intensity and precipitation amounts.Preprints, Conf. on Meteor. Appl. of Lightning Data,San Diego, Jan. 9-13, Amer. Meteor. Soc., 7 pp.
—, and —, 2005b: Long-range lightning applications forhurricane intensity and precipitation nowcasting.Preprints, Conf. on Meteor. Appl. of Lightning Data,San Diego, Jan. 9-13, Amer. Meteor. Soc., 9 pp.
Lyons, W.A., and C.S. Keen, 1994: Observations oflightning in convective supercells within tropicalstorms and hurricanes. Mon. Wea. Rev., 122,1897-1916.
Martin, J.E. and J.A. Otkin, 2004: The rapid growth anddecay of an extratropical cyclone over the CentralPacific Ocean. Wea. Forecast., 19, 358-376.
Molinari, J., P. Moore, and V. Idone, 1999: Convectivestructure of hurricanes as revealed by lightninglocations. Mon. Wea. Rev., 127, 520-534.
—, P.K. Moore, V.P. Idone, R.W. Henderson, and A.B.Saljoughy, 1994: Cloud-to-ground lightning inHurricane Andrew. J. Geophys. Res., 99, 16665-16676.

12
Nierow, A., R.C. Showalter, F.R. Mosher, and T.Lindholm, 2002: Mitigating the impact of oceanicweather hazards on transoceanic flights. Preprints,17th Intl. Lightning Detection Conf., Tucson,Arizona, October 16-18, Vaisala, 4 pp.
Pessi, A., S. Businger, K.L. Cummins, and T. Turner,2004: On the relationship between lightning andconvective rainfall over the central Pacific Ocean.Preprints, 18th Intl. Lightning Detection Conf., June7-9, Helsinki, Finland, Vaisala, 9 pp.
Reed, R.J. and M.D. Albright, 1986: A case study ofexplosive cyclogenesis in the Eastern Pacific. Mon.Wea. Rev., 114, 2297-2319.
Samsury, C.E., and R.E. Orville, 1994: Cloud-to-groundlightning in tropical cyclones: A study of HurricanesHugo (1989) and Jerry (1989). Mon. Wea. Rev.,122, 1887-1896.
Sugita, A., and M. Matsui, 2004: Lightning in typhoonsobserved by JLDN. Proceedings, 18th Intl.Lightning Detection Conf., June 7-9, Helsinki,Finland, Vaisala, 4 pp.
Weatherford, C. and W.M. Gray, 1988: Typhoonstructure as revealed by aircraft reconnaissance.Part II: Structural variability. Mon. Wea. Rev., 116,1044-1056.