London Sumatra Plantation - PhillipCapital
20
Page | 1 | PHILLIP SECURITIES INDONESIA MCI (P) 019/11/2014_0013 Ref. No.: INDO2014_0017 London Sumatra Plantation (LSIP ID) Planting Through Tough Period INDONESIA | AGRICULTURE | INITIATION 18 December 2014 Company Background PT. PP London Sumatra Indonesia Tbk. (Lonsum) is one of the largest Indonesian-based plantation companies. It engages in plant breeding, planting, harvesting, processing, and selling of palm products, rubber, cocoa, and tea. The company owns a sizeable land bank, having over 100,000 ha planted nucleus area in North Sumatra, South Sumatra, Java, East Kalimantan, North Sulawesi, and South Sulawesi producing approximately 195,000 tons of Certified Sustainable Palm Oil (CSPO) per year. With relatively young age profile and ISO 14001 certification across all estates, all crop sectors, and all factories, bulking stations and research stations to support its growth potential going forward. Investment Merits One of the largest CPO players in Indonesia with 90,707 hectares planted oil palm area and is expected to produce 456,000 tons of Crude Palm Oil (CPO) in 2014. Young palm trees age profile averaging at 12.8 years to support its high quality FFB production. Maintain healthy financial position with cash and cash equivalent amounting to IDR 1.3 trillion sitting on its balance sheet. These sizeable cash reserves will provide a great opportunity for Lonsum to expand and grow its business portfolio. Best palm kernel extractor with 5.5 percent kernel extraction rate while industry average only stood at 4.7 percent. High quality FFB processed also contributed to an above-average palm oil extraction rate of 22.9 percent per ton. Highly efficient plantation company generated net profit of IDR 10.27 million per hectares in 2013, higher than the industry average of only IDR 8.45 million per hectares. Zero-debt Company as an indication of its resilience during severe commodities price volatility and reduce its exposure to interest rate risk as they are insulated from any rise in borrowing costs. Furthermore, Lonsum is in a better shape as there is no cash outflow on interest payments and hence, able to keep its costs to a minimum. Key Risk Factors High volatility in CPO prices has been our main concern for plantation companies. As a pure upstream producer, Lonsum’s financial performance is highly dependent to the volatility in its commodities selling prices. Both CPO and rubber have gone through a tough year and lack of positive catalyst to the commodities prices next year will cast a shadow on the share price. Accumulate CMP IDR 1,885 TARGET IDR 2,040 (+8.2%) COMPANY DATA O/S SHARES (MN) : 6,822.9 MARKET CAP (IDR BN) : 12,861.1 MARKET CAP (USDMN) : 1,013.3 52 - WK HI/LO (IDR) : 2,480 / 1,470 LIQUIDITY 3M (USDMN) : 22 PAR VALUE (IDR) : 100 MAJOR SHAREHOLDERS, % SALIM IVOMAS PRATAMA Tbk 59.51 PUBLIC 40.49 PRICE VS. JCI 80 90 100 110 120 130 140 Nov-13 Mar-14 Jul-14 Nov-14 LSIP IJ JCI Rebased Source: Phillip Securities Indonesia Research KEY FINANCIALS IDR bn FY14 FY15 FY16F FY17F Net Sales 4,651 5,087 5,598 6,076 EBIDTA 1,468 1,647 1,966 2,174 Net Profit 842 975 1,186 1,306 EPS, IDR 123 143 174 192 PER, x 15.27 13.18 10.84 9.84 EV/EBIDTA, x 7.85 6.77 5.59 4.96 P/BV, x 1.81 1.66 1.50 1.37 ROE, % 11.8 12.6 13.9 13.9 Debt/Equity (%) 0 0 0 0 Source: Phillip Securities Indonesia Research Est. Valuation Method: Discounted Cash Flow (DCF) Analyst Phillip Research Team (+65 6531 1240) [email protected]
Transcript of London Sumatra Plantation - PhillipCapital

Page | 1 | PHILLIP SECURITIES INDONESIA MCI (P) 019/11/2014_0013 Ref. No.: INDO2014_0017
London Sumatra Plantation (LSIP ID)
Planting Through Tough Period
INDONESIA | AGRICULTURE | INITIATION
18 December 2014
Company Background
PT. PP London Sumatra Indonesia Tbk. (Lonsum) is one of the largest
Indonesian-based plantation companies. It engages in plant breeding,
planting, harvesting, processing, and selling of palm products, rubber,
cocoa, and tea. The company owns a sizeable land bank, having over
100,000 ha planted nucleus area in North Sumatra, South Sumatra,
Java, East Kalimantan, North Sulawesi, and South Sulawesi producing
approximately 195,000 tons of Certified Sustainable Palm Oil (CSPO) per
year. With relatively young age profile and ISO 14001 certification across
all estates, all crop sectors, and all factories, bulking stations and
research stations to support its growth potential going forward.
Investment Merits
One of the largest CPO players in Indonesia with 90,707 hectares
planted oil palm area and is expected to produce 456,000 tons of Crude
Palm Oil (CPO) in 2014. Young palm trees age profile averaging at 12.8
years to support its high quality FFB production.
Maintain healthy financial position with cash and cash equivalent
amounting to IDR 1.3 trillion sitting on its balance sheet. These sizeable
cash reserves will provide a great opportunity for Lonsum to expand and
grow its business portfolio.
Best palm kernel extractor with 5.5 percent kernel extraction rate
while industry average only stood at 4.7 percent. High quality FFB
processed also contributed to an above-average palm oil extraction rate
of 22.9 percent per ton.
Highly efficient plantation company generated net profit of IDR
10.27 million per hectares in 2013, higher than the industry average of
only IDR 8.45 million per hectares.
Zero-debt Company as an indication of its resilience during severe
commodities price volatility and reduce its exposure to interest rate risk
as they are insulated from any rise in borrowing costs. Furthermore,
Lonsum is in a better shape as there is no cash outflow on interest
payments and hence, able to keep its costs to a minimum.
Key Risk Factors
High volatility in CPO prices has been our main concern for plantation
companies. As a pure upstream producer, Lonsum’s financial
performance is highly dependent to the volatility in its commodities
selling prices. Both CPO and rubber have gone through a tough year and
lack of positive catalyst to the commodities prices next year will cast a
shadow on the share price.
Accumulate
CMP IDR 1,885
TARGET IDR 2,040 (+8.2%) COMPANY DATA
O/S SHARES (MN) : 6,822.9
MARKET CAP (IDR BN) : 12,861.1
MARKET CAP (USDMN) : 1,013.3
52 - WK HI/LO (IDR) : 2,480 / 1,470
LIQUIDITY 3M (USDMN) : 22
PAR VALUE (IDR) : 100
MAJOR SHAREHOLDERS, %
SALIM IVOMAS PRATAMA Tbk 59.51
PUBLIC 40.49
PRICE VS. JCI
80
90
100
110
120
130
140
Nov-13 Mar-14 Jul-14 Nov-14
LSIP IJ JCI Rebased
Source: Phillip Securities Indonesia Research
KEY FINANCIALS
IDR bn FY14 FY15 FY16F FY17F
Net Sales 4,651 5,087 5,598 6,076
EBIDTA 1,468 1,647 1,966 2,174
Net Profit 842 975 1,186 1,306
EPS, IDR 123 143 174 192
PER, x 15.27 13.18 10.84 9.84
EV/EBIDTA, x 7.85 6.77 5.59 4.96
P/BV, x 1.81 1.66 1.50 1.37
ROE, % 11.8 12.6 13.9 13.9
Debt/Equity (%) 0 0 0 0
Source: Phillip Securities Indonesia Research Est.
Valuation Method: Discounted Cash Flow (DCF)
Analyst Phillip Research Team (+65 6531 1240) [email protected]
PHILLIP SECURITIES INDONESIA | 2 | P a g e
LONDON SUMATRA PLANTATION INITIATING COVERAGE
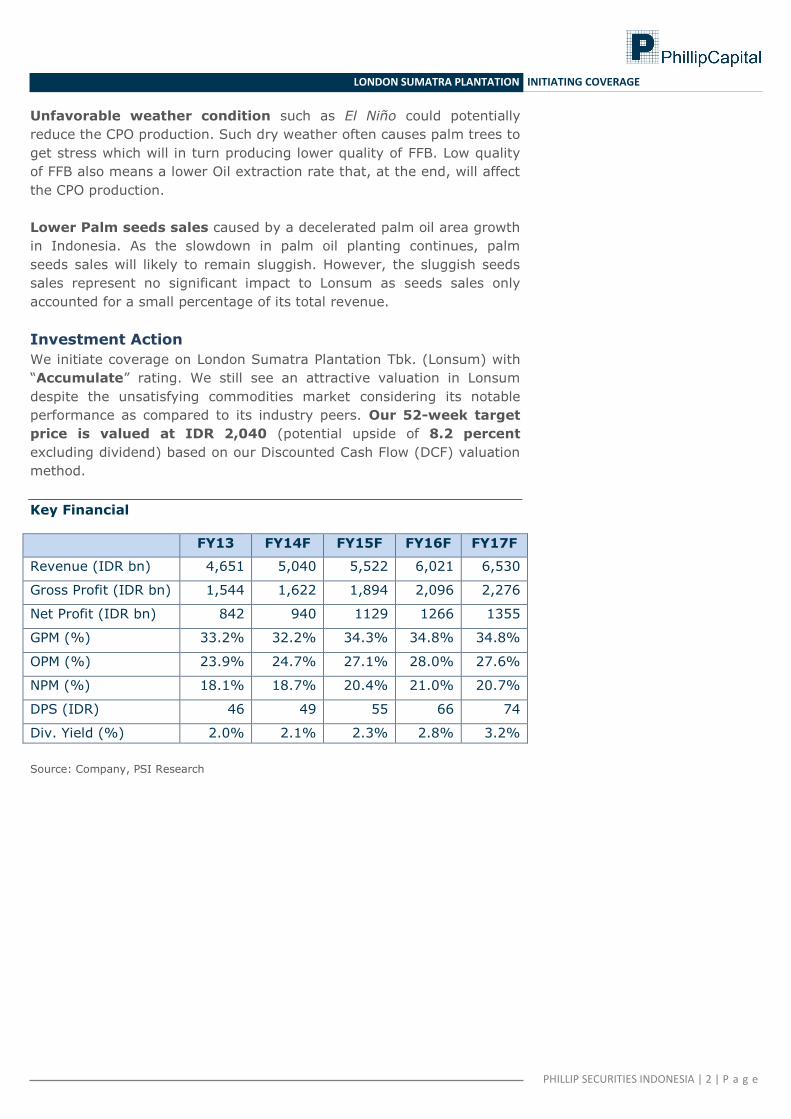
Unfavorable weather condition such as El Niño could potentially
reduce the CPO production. Such dry weather often causes palm trees to
get stress which will in turn producing lower quality of FFB. Low quality
of FFB also means a lower Oil extraction rate that, at the end, will affect
the CPO production.
Lower Palm seeds sales caused by a decelerated palm oil area growth
in Indonesia. As the slowdown in palm oil planting continues, palm
seeds sales will likely to remain sluggish. However, the sluggish seeds
sales represent no significant impact to Lonsum as seeds sales only
accounted for a small percentage of its total revenue.
Investment Action
We initiate coverage on London Sumatra Plantation Tbk. (Lonsum) with
“Accumulate” rating. We still see an attractive valuation in Lonsum
despite the unsatisfying commodities market considering its notable
performance as compared to its industry peers. Our 52-week target
price is valued at IDR 2,040 (potential upside of 8.2 percent
excluding dividend) based on our Discounted Cash Flow (DCF) valuation
method.
Key Financial
FY13 FY14F FY15F FY16F FY17F
Revenue (IDR bn) 4,651 5,040 5,522 6,021 6,530
Gross Profit (IDR bn) 1,544 1,622 1,894 2,096 2,276
Net Profit (IDR bn) 842 940 1129 1266 1355
GPM (%) 33.2% 32.2% 34.3% 34.8% 34.8%
OPM (%) 23.9% 24.7% 27.1% 28.0% 27.6%
NPM (%) 18.1% 18.7% 20.4% 21.0% 20.7%
DPS (IDR) 46 49 55 66 74
Div. Yield (%) 2.0% 2.1% 2.3% 2.8% 3.2%
Source: Company, PSI Research

PHILLIP SECURITIES INDONESIA | 3 | P a g e
LONDON SUMATRA PLANTATION INITIATING COVERAGE
Background of Company
PP London Sumatra Indonesia (Lonsum) was established back 100 years
ago in 1906 by Harrison and Crossfield, a general trading and plantation
management services firm. In 2007, PT. Indofood Sukses Makmur,
through its subsidiaries – Indofood Agri Resources Ltd (IndoAgri) and
PT. Salim Ivomas Pratama Tbk (SIMP) took over Lonsum from
Singapore-based First Durango and London-based Ashmore Funds.
Lonsum is currently one of the largest Indonesian listed plantation
companies with sizeable land bank, having over 100,000 ha planted
nucleus area with relatively young age profile for growth potential.
Location Map
In its early years, Lonsum diversified its business into rubber, cocoa,
and tea and concentrated on rubber throughout Indonesia’s formative
years as an independent nation. Lonsum then started commencing its oil
palm production in 1980s, and since then, oil palm has become the
Company’s primary commodity. Lonsum currently operates 11 palm oil
mills, four in North Sumatra, six in South Sumatra and one in East
Kalimantan with total annual processing capacity of 2,295,000 tons of
FFB per annum. Lonsum also owns 4 crumb rubber factory with 42,720
tons of Dry Rubber annual processing capacity as well as 3 sheet rubber
factory with annual processing capacity of 11,100 tons of dry rubber.
In 2012, Lonsum planted 4,522 hectares of new oil palm plantation area
in its estates in East Kalimantan. In 2013, the company continued to
expand its plantation area by adding another 4,541 hectares of new oil
palm in East Kalimantan as well as South Sumatra. As of September
2014, Lonsum owned a total of 90,707 hectares of oil palm plantation
across its nucleus estates in North Sumatra, South Sumatra, and East
Kalimantan, of which 76,658 hectares comprised of mature crops and
14,049 hectares of immature crops. In addition, Lonsum also managed

PHILLIP SECURITIES INDONESIA | 4 | P a g e
LONDON SUMATRA PLANTATION INITIATING COVERAGE
more than 36,000 hectares of planted plasma area of oil palm
plantations in South Sumatra and East Kalimantan.
Lonsum’s rubber plantation areas are located in North Sumatra, South
Sumatra, and South Sulawesi estates. As of September 2014, Lonsum
owned more than 17,100 hectares of rubber plantation, comprising
13,302 hectares of mature plantation and 3,843 hectares of immature
plantation areas.
On top of oil palm and rubber, Lonsum also operates tea and cocoa
plantations in East Java, North Sulawesi and North Sumatra. The
company’s total tea and cocoa plantation area was 2,804 hectares by
the end of September 2014.
Shareholding Structure
Industry Highlights
Palm Oil is the largest vegetable oil produced and consumed
worldwide. Palm Oil is widely-known for its stability and efficiency as a
common ingredient for food products, cosmetics, candles, detergents,
and all the way to biodiesel. The list of products that rely on the unique
properties of palm oil is long, that one estimate suggesting about half of

PHILLIP SECURITIES INDONESIA | 5 | P a g e
LONDON SUMATRA PLANTATION INITIATING COVERAGE
all packages items found in supermarkets contains palm oil. In terms of
world edible oil productions, Crude palm oil (CPO) dominates the market
with production amounting to 30 percent of global edible oils
productions followed by soya oil with 22.70 percent market shares in
terms of production volume.
Indonesia and Malaysia dominate the world’s CPO productions
with combined contribution of around 85 - 90 percent of total world CPO
output. Indonesia remains the largest CPO producer and exporter in the
world with total planted area of more than 10 million hectares, consists
of roughly 4.54 million hectares of plasma area, 4.98 million hectares of
private-owned and 690 thousand hectares of state-owned area.
Indonesia is expected to produce around 31 million tons of CPO which
accounted for 57 percent of the world’s CPO production in 2014. Experts
predict that next year’s production will be around 32.5 million tons and
will grow further to 41.7 million tons in 2020 and 51 million tons in
2025.
Edible Oils Production and CPO Production in 2014
Source: Index Mundi
CPO production growth increase at the same pace as the growth in new
planted area. With Indonesia oil palm expansion area that is still
growing, CPO production is expected to increase further for years to
come. However, as the growth rate of planted area started to slow in
2012, growth rate of mature area is expected to start slowing in 2015.
The slowdown in palm oil planting is largely due to land use conflicts,
the first and second phases of Indonesia’s forest moratorium, and also a
strong push to comply with both International and national sustainability
requirements.

PHILLIP SECURITIES INDONESIA | 6 | P a g e
LONDON SUMATRA PLANTATION INITIATING COVERAGE
Indonesia Oil Palm Area
Source: U.S. Department of Agriculture (USDA)
Indonesia Oil Palm Area Growth (hectares)
Source: U.S. Department of Agriculture (USDA)
Outlook for CPO
In 2013, world consumption of palm oil increased to 55.6 million tons,
up from 52.1 million tons in 2012. European Union (EU), China, India,
and Indonesia consume more than 10 percent each of world CPO supply
in 2013. This year, Indonesia is expected to produce around 31 million
tons of CPO where more than 21 million tons of the production will be
exported and the rest will be consumed domestically for industrial use
as well as in food making processes. Indonesia exports majority of its
production to China, India, and also European Union.

PHILLIP SECURITIES INDONESIA | 7 | P a g e
LONDON SUMATRA PLANTATION INITIATING COVERAGE
Indonesia’s CPO Export
Source: Indonesian Palm Oil Association
As seen from the chart above, India has been the largest single importer
of Indonesia’s CPO production over the years, followed by European
Union and China. These three largest importers absorb more than 60
percent of Indonesia’s exports volume in 2013.
Stable outlook from CPO exports
In 2014, CPO export is facing a sluggish demand, especially from India
and China. The slowing economic growth in these countries is the main
factor affecting the demand. An excess supply of soy bean harvested in
US made it even worse as the price of soybean became more
competitive. However, up to third quarter of 2014, we have seen an
increasing demand from other countries like Pakistan, Bangladesh, USA,
and other parts of the world. The growing demand for CPO is expected
to continue in the long run as the increasing world population will act as
the driving force for higher CPO consumptions.
Biodiesel to fuel demand for CPO
Indonesia has to depend on its domestic demand to absorb its huge CPO
output; one of which is by imposing a higher mandate for biodiesel.
Since September 2013, Indonesia has boosted the amount of biodiesel
blending from 7.5 percent to 10 percent, also requested power plants to
use gasoil blended with 20 percent biodiesel from January this year
onwards. The government plans to increase the biodiesel blending
mandatory to 20 percent effective in 2016 and 30 percent blending
mandatory in 2020. Plans to move to B20 in 2016 has become more
promising after the B20 road test involving various car brands and
models was successfully being done 40,000 kilometers in West Java
Province. The test will be continued to 100,000 kilometers by some car
manufacturers. Stakeholders are also working closely to implement the
Bioavtur mandatory in 2016.

PHILLIP SECURITIES INDONESIA | 8 | P a g e
LONDON SUMATRA PLANTATION INITIATING COVERAGE
Indonesia Biodiesel Production
Source: Pertamina, Indonesian Biodiesel Producers Association
Factors affecting CPO price
Economic Slowdown in main exporting countries especially China
and India poses a threat that would result in reduced demand for palm
oil. Up to September 2014, Indonesian export of CPO to India fell by 38
percent to 305,000 tons on month-on-month basis. On year-on-year
basis, exports to India have declined by 26 percent to 3.3 million tons in
the first month of 2014. The substantial decline in exports was caused
by India’s higher import tariffs for CPO, the depreciated rupee currency
vs. the U.S dollar, and India’s high inflation.
Meanwhile, Indonesian CPO exports to China fell 31 percent month-on-
month to 56,000 tons in September and declined by 10 percent on year-
on-year basis to 1.6 million tons in the first nine-month period. Chinese
palm oil imports slowed as buyers are struggling to obtain funding amid
Beijing’s crackdown on commodity financing that caused banks to be
more stringent in lending. A slower GDP growth in China, as a result of a
slumping real-estate market as well as a weak domestic demand and
industrial production, also acts as a contributing factor to the sluggish
CPO imports.
Good harvest of substitute seeds such as soybean and rapeseed.
With an expected record high U.S. soybean production in 2014, soybean
oil prices have responded by moving sharply lower; narrowing the price
gap of CPO discount to soybean. Historically, palm oil is known for its
big price gap to soybean oil of around US$ 150 – 200 discount per ton
range. However, with the excess supply of soybean production, the price
gap shrank to an average of US$ 84 each ton; making it more price
competitive as compared to CPO.

PHILLIP SECURITIES INDONESIA | 9 | P a g e
LONDON SUMATRA PLANTATION INITIATING COVERAGE
Price gaps among major edible oils
Source: LMC International.
Indonesia’s “Toothless Mandate” for Biodiesel is hurting CPO
prices. Indonesia introduced a regulation last September to boost the
use of palm-based biodiesel in a move to cut its oil import bill. The
government raised its minimum blending requirement to 10 percent for
biodiesel fuel used for transportations and 20 percent blending
requirement for power plant generators with a target for biodiesel
consumption in 2014 to be 3.3 million tons. Despite the ambitious
regulations, Indonesia is predicted to use not more than 2 million tons of
biodiesel; blaming the failure to live up to their commitment for use of
palm biodiesel as transport fuels. The government is pushed to impose
rewards and punishments in order to effectively implement the biodiesel
mandate. At the time being, the mandate acts as a request rather than
a mandate itself as there has been no direct penalty for non-compliance.
Unless if the government is committed to expand its palm-based
biodiesel through strict rules, the palm oil industry is expected to face a
challenging time in the last half of 2015.
Declining crude oil prices makes palm oil less appealing for
blending into biodiesel. Crude oil prices have tumbled to five-year low
amid ample supply and came under pressure as OPEC decided not to cut
oil output. The decline in crude oil prices will have a big impact on the
use of palm oils for biodiesel. It is estimated that the world will consume
29 million tons of oils and fats as fuel this year. Palm oil will account for
a third of the total feedstock used to produce biodiesel. This means that
9.3 million tons or 16 percent of the global CPO production is for fuel.
The weak crude oil price is expected to dent palm oil demand by making
it less appealing for blending into biodiesel. With that said palm oil
prices might need to go below premium over Brent in order to increase
its comparative advantages in blending into biodiesel.

PHILLIP SECURITIES INDONESIA | 10 | P a g e
LONDON SUMATRA PLANTATION INITIATING COVERAGE
CPO Prices Premium over Brent
Source: LMC International.
Growing population acts as catalyst to boost CPO consumptions.
As we all know, CPO is used globally as an ingredient to produce almost
all kinds of food products. With the fast population growth in the
developing countries, the needs for foods are also growing at the same
rate; hence will increase the demand for CPO in the future. An increase
in income per capita is also one of the main reason driving up the CPO
consumptions. Moreover, the CPO consumptions rate is still low in
developing countries which will have a huge potential to absorb the
growing supply of CPO in years to come.
CPO Price Outlook
Considering all the factors that we discussed above, the short-term
demand for CPO is still sensitive to the economic growth in main
importing countries and CPO prices are also under pressure as the drop
in Brent oil will lessen the attractiveness of palm oil to produce biodiesel
as CPO price is currently trading above the Brent oil. In the first half of
2015, we expect CPO price to have a little gain as the low-harvesting
season hits and dry up the supply of CPO. The benchmark for CPO will
range between MYR 2,200 – 2,400 in the first half of 2015 and
the price movement towards the end of the year will strongly be tied to
the decisions made by Indonesian government on the biodiesel
mandate. If the mandate is implemented in full, prices will rise; vice
versa.
Investment Thesis
One of the largest CPO players in Indonesia with more than 90,000
hectares of planted nucleus area and also supported by 36,000 hectares
of planted plasma area, Lonsum is expected to increase its CPO
production for 2014 to be around 456,000 tons, or increased by 15
percent yoy. We expect Lonsum’s CPO production to increase steadily
for the upcoming years as the droughts that impacted some of its
plantation areas were not significant. The growing CPO production is

PHILLIP SECURITIES INDONESIA | 11 | P a g e
LONDON SUMATRA PLANTATION INITIATING COVERAGE
also supported by Lonsum’s young palm trees’ profile with average age
at 12.8 years.
Lonsum plans to increase its palm oil estates by 3,500 hectares
this year. Up to 9-month of 2014, Lonsum has increased its palm oil
area to 90,707 hectares or up by 862 hectares. The additional areas up
to the third quarter are still well below its full year target; however, the
company remains confident that they will hit the target as most of the
acquisitions and planting activities are done near the end of the year.
Lonsum’s expansion program has been quite modest, around 4,000 –
5,000 hectares per annum.
High Cash Reserves
In 3Q14, Lonsum reported a strong cash position as compared to its
peers. Lonsum cash and cash equivalent worth more than IDR 1.38 tn in
3Q14. These vast cash reserves will help to finance the company’s
expansion plan of IDR 1 tn to build their infrastructure facilities as well
as the new plantation areas as their key expansion programs in the
future.
No debt track record. Since the issuance of new shares as the
conversion of company’s debt in 2004, Lonsum’s balance sheet position
continued to be strong with vast cash reserves and no funded debt.
Gross debt to equity and net debt to equity ratio were 0.00 times and -
0.21 times in 2013. The finalized debt restructuring provides Lonsum
with a much stronger balance sheet and greater liquidity for the
company to focus on the operational improvements.
Cash Ratio Peers Comparison
Source: Company Data

PHILLIP SECURITIES INDONESIA | 12 | P a g e
LONDON SUMATRA PLANTATION INITIATING COVERAGE
Gearing Ratio Peers Comparison
Source: Company Data
Best Palm Kernel Extractor. Lonsum’s Kernel Extraction Rate (KER) is
the highest among its industry peers. In its 1H14 report, Lonsum posted
the Palm Kernel Extraction Rate at 5.5 percent; where majority of the
industry players posted KER below 5 percent mark. Palm Kernel
production up to 3Q14, consequently, increased by 26.2 percent yoy to
80,921 tons. Palm kernel revenue also grew by 105.7 percent yoy in
3Q14 supported by the increase in production as well as a jump in the
average selling price.
FFB Yield, Oil Extraction Rate (%), Kernel Extraction Rate (%)
Peers
Comparison
Source: Company Data
Lonsum is among the largest seeds producers in Indonesia. With
more than 70 years experience, Lonsum’s research arm, Sumatra
Bioscience “SumBio”, has gained reputation as top seed producer in

PHILLIP SECURITIES INDONESIA | 13 | P a g e
LONDON SUMATRA PLANTATION INITIATING COVERAGE
Indonesia producing around 20,000 superior oil palm seeds which have
been commercially proven in Indonesia to be at least equal and
generally outperform the yield performance as compared to other seeds
from local and overseas suppliers. Unlike seeds from overseas suppliers,
SumBio seeds have been developed and selected in breeding trials in
both North and South Sumatra for the specific environments of
Indonesian customers.
Key risks
Risk of CPO price fluctuation
Palm Oil is a globally traded commodity where the price mechanism is
derived from the supply and demand in the market. The fluctuations of
CPO prices have direct exposure to the company’s top and bottom line
due to the sizeable amount of CPO that they produce. As a typical price
taker company, Lonsum will bear the fluctuation risk where in times of
weak CPO prices, Lonsum will likely to book lower revenue if outputs
remain the same; vice versa. For instance, Lonsum experienced an
increase in revenue up to the third quarter this year as the average
selling price of CPO went higher than last year. We still expect that
Lonsum will be able to maintain its revenue growth through the end of
the year despite the reversal signs in CPO prices from its peak.
Adverse weather conditions have traditionally been the single biggest
risk for planters. The abnormal warming of sea water temperatures in
the Pacific, or formally called El Niño phenomenon, can drench parts of
the globe and parch others, damaging crops and food supply. Although
this year’s El Niño failed to materialize, fears of its appearance have not
entirely subsided. An El Niño weather phenomenon, which is typically
associated with dryness, could cause tree stress in some of plantation
estates and hence, reducing Fresh Fruit Bunch (FFB) harvesting yield.
Planters with lower FFB will in turn produce lower CPO outputs and
damaging their financial performance. Although the El Niño phenomenon
has usually been compensated by higher CPO selling prices, the question
remains on how severe the droughts impacts to the palm trees.
Investment Correlation
The correlation between Lonsum’s stock price and CPO price has been
44.55 percent over the past 12 months. Among the big plantation
companies, Lonsum has the highest correlation rate with CPO price
movement. Hence, it is very crucial that we pay a close attention to CPO
price developments.
Correlation – r
London Sumatra Plantation 44.55 %
Sampoerna Agro 31.39 %
Astra Agro Lestari 30.82 %
Salim Ivomas Pratama 25.11 %
Sawit Sumbermas Sarana 8.52 %
Source: Bloomberg, PSI Research

PHILLIP SECURITIES INDONESIA | 14 | P a g e
LONDON SUMATRA PLANTATION INITIATING COVERAGE
Share Price Correlation with CPO
Source: Bloomberg, PSI Research
Valuation and Sensitivity Analysis
We value London Sumatra based on our Discounted Cash Flow (DCF)
valuation method for the next 52 weeks at IDR 2,040 per share with
WACC at 9.39 percent and terminal growth rate at 1 percent per annum.
Our price target implies P/E 14.27x. Plantation is a longer dated
business with a long harvesting period before the crops are fructified
and processed into commodities. Commodities prices can be extremely
volatile in those periods hence we believe DCF is a better valuation
method to value the business throughout the cycle.
Valuation Summary
(IDR bn) FY13 FY14F FY15F FY16F FY17F
Operating Cashflow 1,284 1,456 1,694 1,914 2,104
Less: Capex (1,036) (1,030) (1,133) (1,206) (1,317)
Add: Investment in associates 54 295 - - -
Free Cash Flow (FCF) 302 720 561 707 786
WACC Components
PV of FCFF (growth + terminal) 13,914 Risk Free Rate 7.69%
Beta 0.48
Fair Value per share (IDR) 2,040 Required Return 11.23%
2015 EPS (IDR) 143 Equity Risk Premium3.54%
Target PER (X) 14.27 WACC 9.39%
Source: Company, PSI Research

PHILLIP SECURITIES INDONESIA | 15 | P a g e
LONDON SUMATRA PLANTATION INITIATING COVERAGE
DCF Fair Value Sensitivity
7.89% 8.39% 8.89% 9.39% 9.89% 10.39% 10.89%
-0.5% 2,229 2,091 1,969 1,859 1,761 1,671 1,590
0.0% 2,313 2,163 2,031 1,913 1,808 1,712 1,626
0.5% 2,409 2,245 2,101 1,973 1,859 1,758 1,666
1.0% 2,518 2,337 2,179 2,040 1,917 1,808 1,710
1.5% 2,645 2,442 2,268 2,115 1,982 1,863 1,758
2.0% 2,793 2,565 2,369 2,201 2,054 1,926 1,811
2.5% 2,969 2,707 2,487 2,299 2,137 1,996 1,871
IDRWACC
Terminal
Growth
Source: PSI Research
Sensitivity Analysis
We have identified the following 3 variables that are vital to the earnings
performance and price target: (1) Fresh Fruit Bunch (FFB) yield, (2) CPO
Production, and (3) CPO price assumption. In the analysis below, we will
vary the FFB yield, CPO production, and CPO price assumption by 10
percent. Other variables are kept constant.
FY14F FY15F FY16F FY14F FY15F FY16F FY14F FY15F FY16F
FFB Yield (tons / ha) 15.8 15.9 16.2 17.5 17.7 18.0 19.3 19.5 19.8
Sales 4,347 4,740 5,220 4,651 5,087 5,598 4,972 5,434 5,976
Gross Profit 1,240 1,321 1,592 1,544 1,669 1,970 1,865 2,016 2,348
Net Profit 614 715 903 842 975 1,186 1,083 1,236 1,469
EPS 90 105 132 123 143 174 159 181 215
Price Target
CPO Production ('000 tons) 385.2 417.6 450.9 428.4 463.6 501.0 470.8 510.4 551.1
Sales 4,276 4,685 5,152 4,651 5,087 5,598 5,019 5,496 6,043
Gross Profit 1,169 1,267 1,524 1,544 1,669 1,970 1,912 2,078 2,415
Net Profit 561 674 852 842 975 1,186 1,118 1,282 1,519
EPS 82 99 125 123 143 174 164 188 223
Price Target
CPO Price (IDR / ton) 7,740 7,785 7,920 8,600 8,650 8,800 9,460 9,515 9,680
Sales 4,279 4,682 5,153 4,651 5,087 5,598 5,023 5,492 6,044
Gross Profit 1,172 1,264 1,525 1,544 1,669 1,970 1,916 2,074 2,415
Net Profit 563 671 852 842 975 1,186 1,121 1,279 1,520
EPS 83 98 125 123 143 174 164 188 223
Price Target
2,040
2,040
2,040
1,963 2,117
2,131
2,131
1,950
1,950
IDR bn -10% vs. base Base estimates +10% vs. base
Source: PSI Research

PHILLIP SECURITIES INDONESIA | 16 | P a g e
LONDON SUMATRA PLANTATION INITIATING COVERAGE
SWOT Analysis
Strength
One of the largest palm oil plantation company in Indonesia
having over 100,000 hectares of planted area
Cash-rich Plantation Company with more than IDR 1.3 trillion
sitting on its balance sheet to support its long-term expansion
program
Financially healthy with no debt burden
Strong earnings power, measured by revenue and net income
per hectare
Young trees age profile producing high extraction rate FFB
Well-known for its strong research and development division
High-quality palm seeds producer
Weakness
High concentration on upstream production line
Exposed to CPO price volatility
Sells majority of CPO production to one company; Lonsum
business nature is to supply CPO to parent company, PT Salim
Ivomas Pratama Tbk
Opportunities
Upcoming palm-based Biodiesel mandate in several countries,
Malaysia and Indonesia
Growing number of population to serve as a backbone for higher
CPO consumptions
Growing demand from developing countries, such as Pakistan
and Bangladesh
Threats
Slowing economic growth in importing countries like China and
India
Falling crude oil prices that have close association with CPO will
suppress CPO prices
European Union’s anti-palm oil campaign where “Without Palm
Oil” labels are placed on food products
Adverse weather conditions to affect output
Competition from other edible oils
Land ownership issues

PHILLIP SECURITIES INDONESIA | 17 | P a g e
LONDON SUMATRA PLANTATION INITIATING COVERAGE
Financial Statement
Key Ratios
FY13 FY14F FY15F FY16F FY17F FY18F FY19F
P/E (X) 20.36 15.27 13.18 10.84 9.84 9.05 8.14
P/B (X) 2.43 1.81 1.66 1.50 1.37 1.25 1.14
EV/EBITDA (X) 11.52 7.85 6.77 5.59 4.96 4.42 3.85
Div. Yield (%) 2.4% 2.5% 2.6% 3.0% 3.7% 4.1% 4.4%
EPS 116 123 143 174 192 208 232
ROE (%) 11.6% 11.8% 12.6% 13.9% 13.9% 13.8% 14.0%
ROA (%) 9.6% 9.7% 10.3% 11.3% 11.3% 11.1% 11.2%
DER - - - - - - -
Income Statement
FY13 FY14F FY15F FY16F FY17F FY18F FY19F
Revenue 4,134 4,651 5,087 5,598 6,076 6,618 7,179
Cost of Goods Sold (2,880) (3,107) (3,418) (3,628) (3,926) (4,255) (4,605)
Gross Profit 1,253 1,544 1,669 1,970 2,150 2,363 2,574
Operating expense (228) (431) (375) (396) (408) (475) (473)
Finance income (29) 10 6 7 (0) 5 5
Profit Before Tax 997 1,123 1,300 1,581 1,742 1,893 2,106
Taxation (228) (281) (325) (395) (435) (473) (527)
Profit After Tax 769 842 975 1,186 1,306 1,420 1,580
Cash Flow Statement
FY13 FY14F FY15F FY16F FY17F FY18F FY19F
CFO
Net Income 769 842 975 1,186 1,306 1,420 1,580
WC Changes 1,195 1,125 1,472 1,640 1,834 2,064 2,412
Others (649) (682) (992) (1,132) (1,227) (1,381) (1,658)
Cashflow from operation 1,314 1,285 1,456 1,694 1,914 2,104 2,334
CFI
Capex, net (1,071) (1,036) (1,030) (1,133) (1,206) (1,317) (1,399)
Others (207) 20 280 (14) (17) (23) (25)
Cashflow from investment (1,277) (1,016) (750) (1,148) (1,223) (1,340) (1,424)
CFF
Dividends (450) (315) (337) (390) (474) (523) (568)
Others 21 (21) - - - - -
Cashflow from financing (429) (337) (337) (390) (474) (523) (568)
Net changes in cash (392) (67) 369 156 216 241 342
Ending CCE 1,401 1,334 1,703 1,859 2,075 2,316 2,658

PHILLIP SECURITIES INDONESIA | 18 | P a g e
LONDON SUMATRA PLANTATION INITIATING COVERAGE
Balance Sheet
FY13 FY14F FY15F FY16F FY17F FY18F FY19F
PPE 5,270 5,960 6,643 7,391 8,165 8,993 9,850
Investments 348 295 - - - - -
Others 358 392 411 430 452 480 511
Total non-current assets 5,976 6,647 7,054 7,821 8,617 9,473 10,361
CCE 1,401 1,334 1,703 1,859 2,075 2,316 2,658
Inventories 374 421 461 507 550 600 650
Receivables 117 135 153 173 194 218 245
Others 106 130 138 148 163 179 193
Total current assets 1,999 2,021 2,455 2,688 2,983 3,314 3,747
Total Assets 7,975 8,668 9,509 10,509 11,600 12,787 14,107
Payables 427 505 559 583 632 681 722
Short-term employee benefit 224 247 271 299 329 361 397
Others 153 144 152 166 189 206 215
Total current liabilities 804 896 982 1,048 1,149 1,249 1,334
Long-term employee benefit 547 643 759 897 1,056 1,244 1,468
Others 10 10 10 10 10 10 10
Total non-current assets 556 653 769 907 1,066 1,254 1,478
Shareholders Equity 6,614 7,119 7,758 8,554 9,386 10,283 11,295
Total Liabilities and Equity 7,975 8,668 9,509 10,509 11,600 12,787 14,107 Source: PSI Research

PHILLIP SECURITIES INDONESIA | 19 | P a g e
LONDON SUMATRA PLANTATION INITIATING COVERAGE
Contact Information (Singapore Research Team) Management Chan Wai Chee (CEO, Research - Special Opportunities)
+65 6531 1231 Research Operations Officer Jaelyn Chin +65 6531 1240
Joshua Tan (Head, Research - Equities & Macro)
+65 6531 1249
Macro | Equities Market Analyst | Equities US Equities Soh Lin Sin +65 6531 1516 Kenneth Koh +65 6531 1791 Wong Yong Kai +65 6531 1685 Bakhteyar Osama +65 6531 1793 Finance | Offshore Marine Real Estate Benjamin Ong +65 6531 1535 Caroline Tay +65 6531 1792 Telecoms | Technology Transport & Logistics Colin Tan +65 6531 1221 Richard Leow, CFTe +65 6531 1735
Contact Information (Regional Member Companies) SINGAPORE
Phillip Securities Pte Ltd Raffles City Tower
250, North Bridge Road #06-00 Singapore 179101 Tel +65 6533 6001 Fax +65 6535 6631
Website: www.poems.com.sg
MALAYSIA Phillip Capital Management Sdn Bhd
B-3-6 Block B Level 3 Megan Avenue II, No. 12, Jalan Yap Kwan Seng, 50450
Kuala Lumpur Tel +603 2162 8841 Fax +603 2166 5099
Website: www.poems.com.my
HONG KONG Phillip Securities (HK) Ltd
11/F United Centre 95 Queensway Hong Kong
Tel +852 2277 6600 Fax +852 2868 5307
Websites: www.phillip.com.hk
JAPAN
Phillip Securities Japan, Ltd. 4-2 Nihonbashi Kabuto-cho Chuo-ku,
Tokyo 103-0026 Tel +81-3 3666 2101 Fax +81-3 3666 6090
Website: www.phillip.co.jp
INDONESIA PT Phillip Securities Indonesia
ANZ Tower Level 23B, Jl Jend Sudirman Kav 33A Jakarta 10220 – Indonesia
Tel +62-21 5790 0800 Fax +62-21 5790 0809
Website: www.phillip.co.id
CHINA Phillip Financial Advisory (Shanghai) Co Ltd
No 550 Yan An East Road, Ocean Tower Unit 2318,
Postal code 200001 Tel +86-21 5169 9200 Fax +86-21 6351 2940
Website: www.phillip.com.cn
THAILAND Phillip Securities (Thailand) Public Co. Ltd
15th Floor, Vorawat Building, 849 Silom Road, Silom, Bangrak,
Bangkok 10500 Thailand Tel +66-2 6351700 / 22680999
Fax +66-2 22680921 Website www.phillip.co.th
FRANCE King & Shaxson Capital Limited
3rd Floor, 35 Rue de la Bienfaisance 75008 Paris France
Tel +33-1 45633100 Fax +33-1 45636017
Website: www.kingandshaxson.com
UNITED KINGDOM King & Shaxson Capital Limited
6th Floor, Candlewick House, 120 Cannon Street, London, EC4N 6AS
Tel +44-20 7426 5950 Fax +44-20 7626 1757
Website: www.kingandshaxson.com
UNITED STATES Phillip Futures Inc
141 W Jackson Blvd Ste 3050 The Chicago Board of Trade Building
Chicago, IL 60604 USA Tel +1-312 356 9000 Fax +1-312 356 9005
Website: www.phillipusa.com
AUSTRALIA Phillip Capital Limited
Level 12, 15 William Street, Melbourne, Victoria 3000, Australia
Tel +61-03 9629 8288 Fax +61-03 9629 8882
Website: www.phillipcapital.com.au
SRI LANKA Asha Phillip Securities Limited
No-10 Prince Alfred Tower, Alfred House Gardens, Colombo 03, Sri Lanka Tel: (94) 11 2429 100 Fax: (94) 11 2429 199
Website: www.ashaphillip.net
INDIA PhillipCapital (India) Private Limited
No.1, 18th Floor Urmi Estate
95, Ganpatrao Kadam Marg Lower Parel West, Mumbai 400-013
Maharashtra, India Tel: +91-22-2300 2999 / Fax: +91-22-2300 2969
Website: www.phillipcapital.in
TURKEY PhillipCapital Menkul Degerler
Dr. Cemil Bengü Cad. Hak Is Merkezi No. 2 Kat. 6A Caglayan 34403 Istanbul, Turkey
Tel: 0212 296 84 84 Fax: 0212 233 69 29
Website: www.phillipcapital.com.tr
DUBAI Phillip Futures DMCC
Member of the Dubai Gold and Commodities Exchange (DGCX)
Unit No 601, Plot No 58, White Crown Bldg, Sheikh Zayed Road, P.O.Box 212291
Dubai-UAE Tel: +971-4-3325052 / Fax: + 971-4-3328895
Website: www.phillipcapital.in

PHILLIP SECURITIES INDONESIA | 20 | P a g e
LONDON SUMATRA PLANTATION INITIATING COVERAGE
Important Information
This publication is prepared by Phillip Securities Research Pte Ltd., 250 North Bridge Road, #06-00, Raffles City Tower, Singapore 179101 (Registration Number: 198803136N), which is regulated by the Monetary Authority of Singapore (“Phillip Securities Research”). By receiving or reading this publication, you agree to be bound by the terms and limitations set out below. This publication has been provided to you for personal use only and shall not be reproduced, distributed or published by you in whole or in part, for any purpose. If you have received this document by mistake, please delete or destroy it, and notify the sender immediately. Phillip Securities Research shall not be liable for any direct or consequential loss arising from any use of material contained in this publication.
The information contained in this publication has been obtained from public sources, which Phillip Securities Research has no reason to believe are unreliable and any analysis, forecasts, projections, expectations and opinions (collectively, the “Research”) contained in this publication are based on such information and are expressions of belief of the individual author or the indicated source (as applicable) only. Phillip Securities Research has not verified this information and no representation or warranty, express or implied, is made that such information or Research is accurate, complete, appropriate or verified or should be relied upon as such. Any such information or Research contained in this publication is subject to change, and Phillip Securities Research shall not have any responsibility to maintain or update the information or Research made available or to supply any corrections, updates or releases in connection therewith. In no event will Phillip Securities Research or persons associated with or connected to Phillip Securities Research, including but not limited its officers, directors, employees or persons involved in the preparation or issuance of this report, (i) be liable in any manner whatsoever for any consequences (including but not limited to any special, direct, indirect, incidental or consequential losses, loss of profits and damages) of any reliance or usage of this publication or (ii) accept any legal responsibility from any person who receives this publication, even if it has been advised of the possibility of such damages. You must make the final investment decision and accept all responsibility for your investment decision, including, but not limited to your reliance on the information, data and/or other materials presented in this publication.
Any opinions, forecasts, assumptions, estimates, valuations and prices contained in this material are as of the date indicated and are subject to change at any time without prior notice. Past performance of any product referred to in this publication is not indicative of future results.
This report does not constitute, and should not be used as a substitute for, tax, legal or investment advice. This publication should not be relied upon exclusively or as authoritative, without further being subject to the recipient’s own independent verification and exercise of judgment. The fact that this publication has been made available constitutes neither a recommendation to enter into a particular transaction, nor a representation that any product described in this material is suitable or appropriate for the recipient. Recipients should be aware that many of the products, which may be described in this publication involve significant risks and may not be suitable for all investors, and that any decision to enter into transactions involving such products should not be made, unless all such risks are understood and an independent determination has been made that such transactions would be appropriate. Any discussion of the risks contained herein with respect to any product should not be considered to be a disclosure of all risks or a complete discussion of such risks. Nothing in this report shall be construed to be an offer or solicitation for the purchase or sale of any product. Any decision to purchase any product mentioned in this research should take into account existing public information, including any registered prospectus in respect of such product.
Phillip Securities Research, or persons associated with or connected to Phillip Securities Research, including but not limited to its officers, directors, employees or persons involved in the preparation or issuance of this report, may provide an array of financial services to a large number of corporations in Singapore and worldwide, including but not limited to commercial / investment banking activities (including sponsorship, financial advisory or underwriting activities), brokerage or securities trading activities. Phillip Securities Research, or persons associated with or connected to Phillip Securities Research, including but not limited to its officers, directors, employees or persons involved in the preparation or issuance of this report, may have participated in or invested in transactions with the issuer(s) of the securities mentioned in this publication, and may have performed services for or solicited business from such issuers. Additionally, Phillip Securities Research, or persons associated with or connected to Phillip Securities Research, including but not limited to its officers, directors, employees or persons involved in the preparation or issuance of this report, may have provided advice or investment services to such companies and investments or related investments, as may be mentioned in this publication.
Phillip Securities Research or persons associated with or connected to Phillip Securities Research, including but not limited to its officers, directors, employees or persons involved in the preparation or issuance of this report may, from time to time maintain a long or short position in securities referred to herein, or in related futures or options, purchase or sell, make a market in, or engage in any other transaction involving such securities, and earn brokerage or other compensation in respect of the foregoing. Investments will be denominated in various currencies including US dollars and Euro and thus will be subject to any fluctuation in exchange rates between US dollars and Euro or foreign currencies and the currency of your own jurisdiction. Such fluctuations may have an adverse effect on the value, price or income return of the investment.
To the extent permitted by law, Phillip Securities Research, or persons associated with or connected to Phillip Securities Research, including but not limited to its officers, directors, employees or persons involved in the preparation or issuance of this report, may at any time engage in any of the above activities as set out above or otherwise hold a interest, whether material or not, in respect of companies and investments or related investments, which may be mentioned in this publication. Accordingly, information may be available to Phillip Securities Research, or persons associated with or connected to Phillip Securities Research, including but not limited to its officers, directors, employees or persons involved in the preparation or issuance of this report, which is not reflected in this material, and Phillip Securities Research, or persons associated with or connected to Phillip Securities Research, including but not limited to its officers, directors, employees or persons involved in the preparation or issuance of this report, may, to the extent permitted by law, have acted upon or used the information prior to or immediately following its publication. Phillip Securities Research, or persons associated with or connected to Phillip Securities Research, including but not limited its officers, directors, employees or persons involved in the preparation or issuance of this report, may have issued other material that is inconsistent with, or reach different conclusions from, the contents of this material.
The information, tools and material presented herein are not directed, intended for distribution to or use by, any person or entity in any jurisdiction or country where such distribution, publication, availability or use would be contrary to the applicable law or regulation or which would subject Phillip Securities Research to any registration or licensing or other requirement, or penalty for contravention of such requirements within such jurisdiction. Section 27 of the Financial Advisers Act (Cap. 110) of Singapore and the MAS Notice on Recommendations on Investment Products (FAA-N01) do not apply in respect of this publication.
This material is intended for general circulation only and does not take into account the specific investment objectives, financial situation or particular needs of any particular person. The products mentioned in this material may not be suitable for all investors and a person receiving or reading this material should seek advice from a professional and financial adviser regarding the legal, business, financial, tax and other aspects including the suitability of such products, taking into account the specific investment objectives, financial situation or particular needs of that person, before making a commitment to invest in any of such products.
Please contact Phillip Securities Research at [65 65311240] in respect of any matters arising from, or in connection with, this document. This report is only for the purpose of distribution in Singapore.