LOJAS AMERICANAS ANNOUNCES CONSOLIDATED GROSS REVENUE … · B2W DIGITAL, the result of the merger...
19
1 / 19 EARNINGS RELEASE 2Q13 LOJAS AMERICANAS ANNOUNCES CONSOLIDATED GROSS REVENUE OF R$ 6.7 BILLION IN 1H13 Rio de Janeiro, August 14 th , 2013 – Lojas Americanas S.A. [BOVESPA: LAME3 (common) and LAME4 (preferred)], one of the leading retail chains in Brazil with 749 stores and present in 25 states plus the Federal District, announces today its results for the 2 nd quarter of 2013 (2Q13) and 1 st half of 2013 (1H13). The accounting information that serves as the basis for the comments that follow are presented in accordance with the international financial reporting standards (IFRS), to the rules issued by the Brazilian Securities Exchange Commission (CVM) and in Reais (R$). The comparisons refer to the 2 nd quarter of 2012 (2Q12) and 1 st half of 2012 (1H12). OPERATIONAL AND FINANCIAL HIGHLIGHTS Executive Summary 1H13 – Comparison to 1H12 Consolidated Gross Revenue (R$ MM) 3,376 4,211 4,388 4,844 5,380 5,651 6,681 1H07 1H08 1H09 1H10 1H11 1H12 1H13 +12.1% CAGR Consolidated Gross Profit (R$ MM) 798 978 1,132 1,265 1,434 1,408 1,681 1S07 1S08 1S09 1S10 1S11 1S12 1S13 +13.2% CAGR Consolidated Adjusted EBITDA (R$ MM) and Adjusted EBITDA Margin (%NR) 259.3 330.2 398.0 482.6 579.5 575.4 661.2 10.3% 10.4% 11.1% 11.5% 12.4% 11.7% 11.5% 1H07 1H08 1H09 1H10 1H11 1H12 1H13 +16.9% CAGR Evolution in Number of Stores 370 418 469 479 565 643 744 1H07 1H08 1H09 1H10 1H11 1H12 1H13 1H13 1H12 Var. (%) Financial Highlights (R$ MM) 1H13 1H12 Var. (%) 3,396.5 3,010.9 12.8% Net Revenue 5,772.7 4,903.7 17.7% 1,047.3 922.9 13.5% Gross Profit 1,680.9 1,408.3 19.4% 30.8% 30.7% +0.1 p.p. Gross Margin (%NR) 29.1% 28.7% +0.4 p.p. 499.5 443.1 12.7% Adjusted EBITDA 661.2 575.4 14.9% 14.7% 14.7% - Adjusted EBITDA Margin (%NR) 11.5% 11.7% -0.2 p.p. 86.3 69.2 24.7% Net Income 92.7 78.7 17.8% 2.5% 2.3% +0.2 p.p. Net Margin (%NR) 1.6% 1.6% - Parent Company Consolidated Gross Revenue In 1H13, the parent company gross revenue totaled R$ 3.947 billion, a growth of 11.4% over 1H12. In the consolidated view, the gross revenue reached R$ 6.681 billion, an increase of more than R$ 1 billion in comparison with 1H12; Net Revenue In 1H13, the parent company net revenue reached R$ 3.397 billion, an increase of 12.8% in relation to 1H12. In the consolidated, the net revenue grew 17.7%, reaching R$ 5.773 billion; “Same Stores” Net Revenue Growth in “same stores” net revenue of 8% in the first half of the year; Gross Margin In the parent company, the gross margin was 30.8% of net revenue in 1H13, an increase of 0.1 p.p.. The consolidated gross margin was 29.1% of net revenue, a variation of +0.4 p.p.; Selling, General and Administrative Expenses (SG&A) The selling, general and administrative expenses in the parent company totaled 16.1% of net revenue in 1H13, a variation of +0.1 p.p. in relation to 1H12. In the consolidated, the selling, general and administrative expenses reached 17.7% of net revenue in 1H13; Adjusted EBITDA In the parent company, Adjusted EBITDA totaled R$ 499.5 million in 1H13, a growth of 12.7% in relation to 1H12. The parent company Adjusted EBITDA margin was 14.7% of net revenue, the same level reported in 1H12. The consolidated Adjusted EBITDA reached R$ 661.2 million in 1H13, an increase of 14.9% in relation to 1H12. The consolidated Adjusted EBITDA margin was 11.5% of net revenue in 1H13, a variation of -0.2 p.p.; Net Income In the parent company, the net income summed up to R$ 86.3 million in 1H13, a gain of 24.7%. The consolidated net income grew 17.8%, reaching R$ 92.7 million; Fitch Ratings upgraded Lojas Americanas and B2W’s ratings to AA- The rating agency Fitch Ratings upgraded the long-term corporate rating of Lojas Americanas and B2W from A+ to AA- with a stable outlook; B2W DIGITAL In 1H13, the consolidated gross revenue totaled R$ 2.886 billion, a growth of 29.8% over 1H12; Expansion The “SEMPRE MAIS BRASIL” program is in line with the opening stores schedule. As of today we opened 21 stores in 2013 and have more than 80 stores with contract signed or in an advanced stage of negotiation. Charts – “2Q” means second quarter of each year and “1H” means first half of each year. Only the data from 1H09 to 1H13 are presented in accordance with the IFRS. The historic data are in compliance with the corporate norms in effect for each period. Only the data from 1H12 and 1H13 present FAI’s operation results consolidated in the discontinuity line. Adjusted EBITDA - Operating profit before interest, taxes, depreciation and amortization, other operating income/expenses, equity accounting, minority participation, statutory participation and discontinued operations.
Transcript of LOJAS AMERICANAS ANNOUNCES CONSOLIDATED GROSS REVENUE … · B2W DIGITAL, the result of the merger...

1 / 19
EARNINGS RELEASE 2Q13
LOJAS AMERICANAS ANNOUNCES CONSOLIDATED GROSS REVENUE OF R$ 6.7 BILLION IN 1H13
Rio de Janeiro, August 14th
, 2013 – Lojas Americanas S.A. [BOVESPA: LAME3 (common) and LAME4 (preferred)], one of the leading retail chains in Brazil with 749 stores and present in 25 states plus the Federal District, announces today its results for the 2
nd quarter of 2013 (2Q13)
and 1st
half of 2013 (1H13). The accounting information that serves as the basis for the comments that follow are presented in accordance with the international financial reporting standards (IFRS), to the rules issued by the Brazilian Securities Exchange Commission (CVM) and in Reais (R$). The comparisons refer to the 2
nd quarter of 2012 (2Q12) and 1
st half of 2012 (1H12).
OPERATIONAL AND FINANCIAL HIGHLIGHTS
Executive Summary 1H13 – Comparison to 1H12
Consolidated Gross Revenue (R$ MM)
3,3764,211 4,388
4,8445,380 5,651
6,681
1H07 1H08 1H09 1H10 1H11 1H12 1H13
+12.1%
CAGR
Consolidated Gross Profit (R$ MM)
798978
1,1321,265
1,434 1,408
1,681
1S07 1S08 1S09 1S10 1S11 1S12 1S13
+13.2%
CAGR
Consolidated Adjusted EBITDA (R$ MM) and Adjusted EBITDA Margin (%NR)
259.3330.2
398.0482.6
579.5 575.4661.2
10.3% 10.4% 11.1% 11.5% 12.4% 11.7% 11.5%
1H07 1H08 1H09 1H10 1H11 1H12 1H13
+16.9%
CAGR
Evolution in Number of Stores
370418
469 479
565
643
744
1H07 1H08 1H09 1H10 1H11 1H12 1H13
1H13 1H12 Var. (%) Financial Highlights (R$ MM) 1H13 1H12 Var. (%)
3,396.5 3,010.9 12.8% Net Revenue 5,772.7 4,903.7 17.7%
1,047.3 922.9 13.5% Gross Profit 1,680.9 1,408.3 19.4%
30.8% 30.7% +0.1 p.p. Gross Margin (%NR) 29.1% 28.7% +0.4 p.p.
499.5 443.1 12.7% Adjusted EBITDA 661.2 575.4 14.9%
14.7% 14.7% - Adjusted EBITDA Margin (%NR) 11.5% 11.7% -0.2 p.p.
86.3 69.2 24.7% Net Income 92.7 78.7 17.8%
2.5% 2.3% +0.2 p.p. Net Margin (%NR) 1.6% 1.6% -
Parent Company Consolidated
Gross Revenue
In 1H13, the parent company gross revenue totaled R$ 3.947 billion, a growth of 11.4% over 1H12.
In the consolidated view, the gross revenue reached R$ 6.681 billion, an increase of more than
R$ 1 billion in comparison with 1H12;
Net Revenue
In 1H13, the parent company net revenue reached R$ 3.397 billion, an increase of 12.8% in
relation to 1H12. In the consolidated, the net revenue grew 17.7%, reaching R$ 5.773 billion;
“Same Stores” Net Revenue
Growth in “same stores” net revenue of 8% in the first half of the year;
Gross Margin
In the parent company, the gross margin was 30.8% of net revenue in 1H13, an increase of 0.1
p.p.. The consolidated gross margin was 29.1% of net revenue, a variation of +0.4 p.p.;
Selling, General and Administrative Expenses (SG&A)
The selling, general and administrative expenses in the parent company totaled 16.1% of net
revenue in 1H13, a variation of +0.1 p.p. in relation to 1H12. In the consolidated, the selling,
general and administrative expenses reached 17.7% of net revenue in 1H13;
Adjusted EBITDA
In the parent company, Adjusted EBITDA totaled R$ 499.5 million in 1H13, a growth of 12.7% in
relation to 1H12. The parent company Adjusted EBITDA margin was 14.7% of net revenue, the
same level reported in 1H12. The consolidated Adjusted EBITDA reached R$ 661.2 million in
1H13, an increase of 14.9% in relation to 1H12. The consolidated Adjusted EBITDA margin was
11.5% of net revenue in 1H13, a variation of -0.2 p.p.;
Net Income
In the parent company, the net income summed up to R$ 86.3 million in 1H13, a gain of 24.7%.
The consolidated net income grew 17.8%, reaching R$ 92.7 million;
Fitch Ratings upgraded Lojas Americanas and B2W’s ratings to AA-
The rating agency Fitch Ratings upgraded the long-term corporate rating of Lojas Americanas and
B2W from A+ to AA- with a stable outlook;
B2W DIGITAL
In 1H13, the consolidated gross revenue totaled R$ 2.886 billion, a growth of 29.8% over 1H12;
Expansion
The “SEMPRE MAIS BRASIL” program is in line with the opening stores schedule. As of today we
opened 21 stores in 2013 and have more than 80 stores with contract signed or in an advanced
stage of negotiation.
Charts – “2Q” means second quarter of each year and “1H” means first half of each year.
Only the data from 1H09 to 1H13 are presented in accordance with the IFRS.
The historic data are in compliance with the corporate norms in effect for each period.
Only the data from 1H12 and 1H13 present FAI’s operation results consolidated in the discontinuity line.
Adjusted EBITDA - Operating profit before interest, taxes, depreciation and amortization, other operating income/expenses, equity accounting,
minority participation, statutory participation and discontinued operations.

2 / 19
MULTICHANNEL RETAIL STRUCTURE Lojas Americanas operates through a multichannel service structure. In addition to the bricks-and-mortar store chain, the Company reaches customers with a wide range of products and services sold via the Internet, telephone, catalogues, TV and kiosks. B2W DIGITAL, the result of the merger of Americanas.com and Submarino in 2006, has a portfolio that includes the Americanas.com, Submarino, Shoptime, B2W Viagens, Ingresso.com, Submarino Finance, BLOCKBUSTER® Online and SouBarato brands, which offer more than 35 categories of products and services through the Internet, TV, telephone sales, catalogues and kiosks distribution channels. Lojas Americanas’ stake in B2W DIGITAL at the end of the first half of 2013 was 62.72%. The following organizational chart illustrates the integrated approach of Lojas Americanas:
Bricks-and-Mortar
Multichannel Retailer
Ecommerce, TV, Telephone Sales, Catalogues and Kiosks
Participation: 62.72% Results Consolidation: 100.00%
3 / 19
COMMENTS ON OPERATING PERFORMANCE
EASTER MISMATCH In 2013, the Easter event took place on March 31 whereas last year it occurred on April 8. Therefore, the sales related to this important event were more concentrated in the 1Q13 in comparison with the same period in 2012. In order to remove this effect, the results’ analyses will be oriented to the accumulated of the first half of the year (1S13).
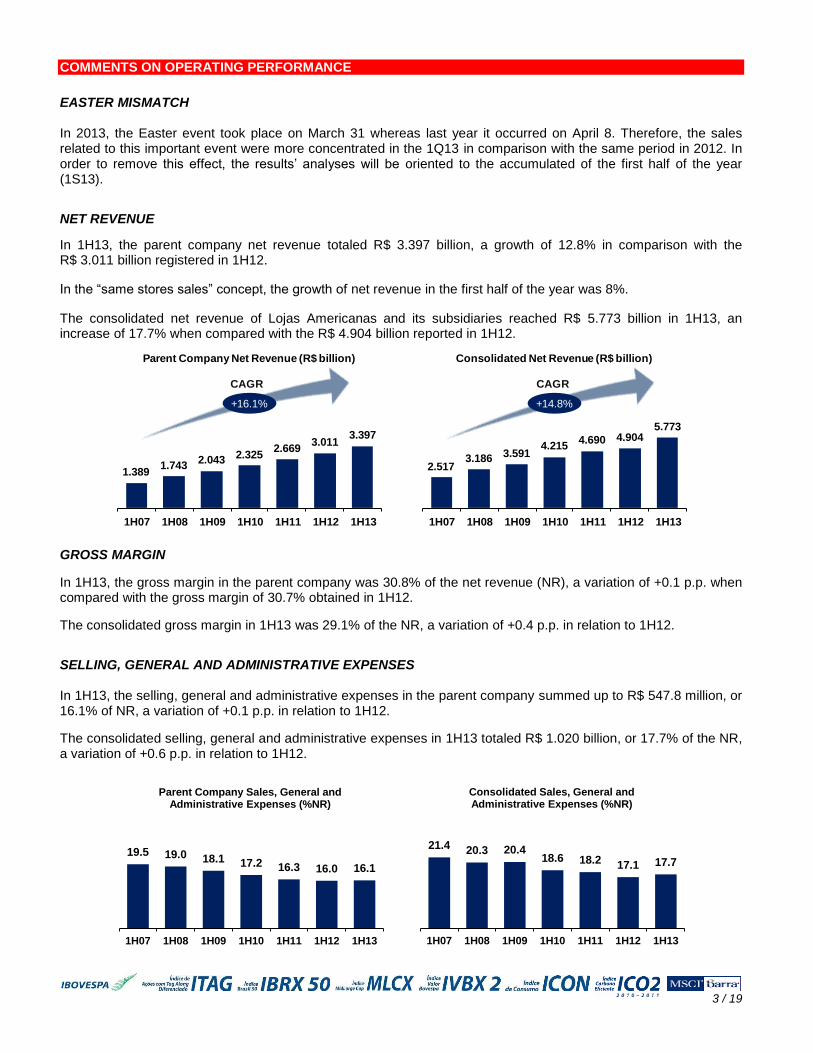
NET REVENUE
In 1H13, the parent company net revenue totaled R$ 3.397 billion, a growth of 12.8% in comparison with the R$ 3.011 billion registered in 1H12.
In the “same stores sales” concept, the growth of net revenue in the first half of the year was 8%.
The consolidated net revenue of Lojas Americanas and its subsidiaries reached R$ 5.773 billion in 1H13, an increase of 17.7% when compared with the R$ 4.904 billion reported in 1H12.
1.3891.743
2.0432.325
2.6693.011
3.397
1H07 1H08 1H09 1H10 1H11 1H12 1H13
+16.1%
CAGR
Parent Company Net Revenue (R$ billion)
2.5173.186 3.591
4.2154.690 4.904
5.773
1H07 1H08 1H09 1H10 1H11 1H12 1H13
+14.8%
CAGR
Consolidated Net Revenue (R$ billion)
GROSS MARGIN
In 1H13, the gross margin in the parent company was 30.8% of the net revenue (NR), a variation of +0.1 p.p. when compared with the gross margin of 30.7% obtained in 1H12.
The consolidated gross margin in 1H13 was 29.1% of the NR, a variation of +0.4 p.p. in relation to 1H12.
SELLING, GENERAL AND ADMINISTRATIVE EXPENSES In 1H13, the selling, general and administrative expenses in the parent company summed up to R$ 547.8 million, or 16.1% of NR, a variation of +0.1 p.p. in relation to 1H12.
The consolidated selling, general and administrative expenses in 1H13 totaled R$ 1.020 billion, or 17.7% of the NR, a variation of +0.6 p.p. in relation to 1H12.
19.5 19.0 18.1 17.2 16.3 16.0 16.1
1H07 1H08 1H09 1H10 1H11 1H12 1H13
Parent Company Sales, General and Administrative Expenses (%NR)
21.4 20.3 20.418.6 18.2 17.1 17.7
1H07 1H08 1H09 1H10 1H11 1H12 1H13
Consolidated Sales, General and Administrative Expenses (%NR)

4 / 19
ADJUSTED EBITDA
In 1H13, the parent company Adjusted EBITDA reached R$ 499.5 million, an increase of 12.7% when compared with 1H12. The parent company Adjusted EBITDA margin for the period was 14.7%, the same level reported in 1H12.
The consolidated Adjusted EBITDA summed up to R$ 661.2 million in 1H13, an improvement of 14.9% in relation to the one obtained in 1H12. The consolidated Adjusted EBITDA margin in the 1H13 was 11.5% of the NR, a variation of -0.2 p.p. in relation to 1H12.
The following table shows the Adjusted EBITDA per Company:
Adjusted EBITDA 1H13 % NR 1H12 % NR R$ ∆ %
Consolidated 661.2 11.5% 575.4 11.7% 85.8 14.9%
LOJAS AMERICANAS 499.5 14.7% 443.1 14.7% 56.4 12.7%
B2W 161.6 6.4% 134.7 6.8% 26.9 20.0%
BWU and Other 0.1 - (2.4) - 2.5 -104.2%
127.5173.5
215.0262.9
351.6443.1
499.5
9.2% 10.0% 10.5%11.3%
13.2%14.7% 14.7%
1H07 1H08 1H09 1H10 1H11 1H12 1H13
EBITDA (R$ million) EBITDA (% NR)
+25.6%
CAGR
Parent Company Adjusted EBITDA
259.3330.2
398.0482.6
579.5 575.4661.2
10.3% 10.4% 11.1% 11.5% 12.4%11.7% 11.5%
1H07 1H08 1H09 1H10 1H11 1H12 1H13
EBITDA (R$ million) EBITDA (% NR)
+16.9%
CAGR
Consolidated Adjusted EBITDA
Adjusted EBITDA (Operating profit before interest, taxes, depreciation and amortization, other operating income/expenses, equity accounting, minority participation, statutory participation and discontinued operations) is presented as additional information because we believe it represents an important indicator of our operating performance, besides being useful for keeping the comparability with previous reported results.
EBITDA (CVM 527/12)
On October 4th, 2012, Brazilian Securities Exchange Commission (CVM) enacted the Instruction 527/12, which
disposes about the voluntary disclosure of not accounting information, as EBITDA.
The Instruction aims to standardize the disclosure, in order to improve the understanding of this information and making it comparable among the publicly listed companies.
To keep the consistency and the comparability between previous periods, we present the EBITDA reconciliation in the following table.
EBITDA Reconciliation - R$ MM 1H13 1H12 ∆ % 1H13 1H12 ∆ %
Gross Profit 1,047.3 922.9 13.5% 1,680.9 1,408.3 19.4%
(+) Sales Expenses (512.3) (448.0) 14.4% (948.9) (770.9) 23.1%
(+) General and Administrative Expenses (35.5) (31.8) 11.6% (70.8) (62.0) 14.2%
(=) Adjusted EBITDA 499.5 443.1 12.7% 661.2 575.4 14.9%
(+) Other Operat. Income (Expenses)* (0.4) (0.4) 0.0% (42.6) (22.8) 86.8%
(+) Equity Accounting (61.2) (31.1) 96.8% - 3.1 -100.0%
(+) Discontinued Operations 1.9 (7.4) -125.7% 1.9 (7.4) -125.7%
(=) EBITDA (CVM 527/12) 439.8 404.2 8.8% 620.5 548.3 13.2%
* In the old accounting rules, considered as "non-operating income".
Parent Company Consolidated
Adjusted EBITDA - Operating profit before interest, taxes, depreciation and amortization, other operating income/expenses, equity accounting, minority participation, statutory participation and discontinued operations.
EBITDA’s (CVM 527/12) calculation takes into account the net income of the period plus income taxes, net financial expenses of financial revenues and depreciation, amortization and depletion.

5 / 19
NET FINANCIAL RESULT In 1H13, the parent company net financial expenses totaled R$ 204.6 million, a variation of -5.5% in relation to the R$ 216.4 million net financial expenses presented in 1H12.
The consolidated financial expenses in 1H13 were R$ 425.7 million, which represents a variation of +11.7% in comparison with the expenses of R$ 381.0 million reported in 1H12.
For a better evaluation of the parent company’s net financial result we must consolidate the revenues and financial expenses of the non-operating subsidiaries (BWU and others). Thus, in the following table, we present a view of the financial result with the aforementioned effects.
Breakdown of the Net Financial Result - R$ MM 1H13 1H12 ∆ %
Parent Company Net Financial Result (before non-operating subsidiaries) (204.6) (216.4) -5.5%
(+) Net Financial Result of Non-Operating Subsidiaries 20.6 25.0 -17.6%
(+) B2W Net Financial Result - Consolidated (241.7) (189.6) 27.5%
Consolidated Net Financial Result (425.7) (381.0) 11.7%
The Company continues to reaffirm its commitment to a conservative cash investment policy, manifested by the use of hedge instruments in foreign currencies, to offset eventual exchanges fluctuations, whether relative to financial liabilities or total cash position. These instruments offset the foreign exchange risk, transforming the cost of the debt to local currency and interest rates (as a percentage of CDI*). Similarly, it is worth mentioning that the Company’s cash is invested with Brazil’s largest financial institutions.
*CDI - Interbank Deposit Certificate: average rate of funding through the interbank market.
NET RESULT The parent company net income in 1H13 summed up to R$ 86.3 million, an evolution of 24.7% when compared with the R$ 69.2 million disclosed in 1H12.
In the consolidated, the net income in 1H13 reached R$ 92.7 million, an increase of 17.8% in relation to the R$ 78.7 million registered in 1H12.
The following table shows the main variations from Parent Company Adjusted EBITDA to net result:
Reconciliation of the Net Result - R$ MM 1H13 1H12 ∆ %
Adjusted EBITDA 499.5 443.1 12.7%
(+) Depreciation / Amortization (81.8) (64.1) 27.6%
(+) Net Financial Result (204.6) (216.4) -5.5%
(+) Equity Accounting (61.2) (31.1) 96.8%
(+) Other Operat. Income (Expenses)* (0.4) (0.4) 0.0%
(+) Income tax and social contribution (67.1) (54.5) 23.1%
(+) Discontinued Operations 1.9 (7.4) -125.7%
(=) Net Result 86.3 69.2 24.7%
* In the old accounting rules, considered as "non-operating income".
Parent Company
Adjusted EBITDA - Operating profit before interest, taxes, depreciation and amortization, other operating income/expenses, equity accounting, minority participation, statutory participation and discontinued operations.

6 / 19
The following table shows the main variations from Consolidated Adjusted EBITDA to net result:
Reconciliation of the Net Result - R$ MM 1H13 1H12 ∆ %
Adjusted EBITDA 661.2 575.4 14.9%
(+) Depreciation / Amortization (126.9) (97.6) 30.0%
(+) Net Financial Result (425.7) (381.0) 11.7%
(+) Equity Accounting - 3.1 -100.0%
(+) Other Operat. Income (Expenses)* (42.6) (22.8) 86.8%
(+) Minority Participation 41.2 33.6 22.6%
(+) Income tax and social contribution (16.4) (24.6) -33.3%
(+) Discontinued Operations 1.9 (7.4) -125.7%
(=) Net Result 92.7 78.7 17.8%
* In the old accounting rules, considered as "non-operating income".
Consolidated
Adjusted EBITDA - Operating profit before interest, taxes, depreciation and amortization, other operating income/expenses, equity accounting, minority participation, statutory participation and discontinued operations.
INDEBTEDNESS
Lojas Americanas uses its cash flow giving priority to investments that generate the best returns for shareholders. Thus, we have listed below the main actions carried out in the period between 07/01/2012 and 06/30/2013:
Investments made by Lojas Americanas and B2W in property and intangible assets (websites and systems
development) of R$ 888.5 million;
Payment of interest on equity and gross dividends in the amount of R$ 100.0 million.
Lojas Americanas’ consolidated short and long-term loans and debentures at 06/30/2013 totaled R$ 7,453 million. If we deduct the cash position of R$ 4,794 million (cash + money market investments + accounts receivable from credit and debit cards) from total loans, we will reach a net debt position of R$ 2,659 million.
Indebtedness - R$ MM 6/30/2013 3/31/2013
Short Term Debt 712.6 831.1
Short Term Debentures 120.9 172.2
Shot Term Indebtedness 833.5 1,003.3
Long Term Debt 4,285.5 2,867.6
Long Term Debentures 2,333.6 2,334.5
Long Term Indebtedness 6,619.1 5,202.1
Total Debt (1) 7,452.6 6,205.4
Cash and banks 437.2 259.8
Money market investments 3,039.6 2,078.6
1,316.9 1,591.2
Total Cash (2) 4,793.7 3,929.6-
Net Cash (Debt) (2) - (1) (2,658.9) (2,275.8)
Net Debt / Adjusted EBITDA LTM 1.6 1.4
Average Maturity of Debt (in days) 1,222 1,082
Consolidated
Accounts Receivable
Adjusted EBITDA - Operating profit before interest, taxes, depreciation and amortization, other operating income/expenses, equity accounting, minority participation, statutory participation and discontinued operations.

7 / 19
At 06/30/2013, the Company’s net debt was 1.6x in the 12-month accumulated EBITDA. The average maturity of the debt was 1,222 days in 1H13 (40 months).
In order to face the uncertainties and the volatility of the financial market, Lojas Americanas is guided by the principle of preserving cash and extending its debt profile. During the past years, a number of initiatives were taken with this objective in mind, which permits us to consolidate the Company’s long-term growth plan. Throughout June, the Company’s Board of Directors approved the widening of the Shareholder’s Equity of the Fundo de Investimento em Direitos Creditórios (FIDC) in R$ 707.6 million, reaching approximately R$ 1.3 billion. The FIDC model of credit card structured by the Company is a unique tool in the market and represents an important source of fundraising.
Accounts receivable are composed of receivables from credit cards, net of the discounted value which have immediate liquidity and can be considered as cash. The breakdown of accounts receivable from the consolidated point of view of Lojas Americanas is shown in the following table:
Accounts Receivable Conciliation - R$ MM 6/30/2013 3/31/2013
Gross Credit-Cards Receivable 2,926.8 2,779.3
Electronic debits and checks Receivables 27.1 69.6
Receivable Discounts (1,637.0) (1,257.7)
1,316.9 1,591.2
Present-value adjustment (10.3) (16.1)
Allowance for doubtful accounts (38.9) (45.8)
Other accounts receivable 148.6 163.5
Consolidated Net Accounts Receivable 1,416.3 1,692.8
Accounts Receivable from credit / debit cards
Because of the adoption of the new CPCs/IFRS, in particular the CPC 38 and its corresponding IAS 39, the Company began to write off (derecognize) receivables from credit card administrators the moment they were effectively discounted (as of the explanatory notes of the financial statements). However, to better demonstrate the volume of receivables discounted on the base-dates analyzed, in the chart above the Company presents the accounts receivable adjusted by the discounts made until the base-dates under analysis. NO EXPOSURE TO FOREIGN EXCHANGE VARIATIONS In 1H13, Lojas Americanas S.A.’s balance sheet recorded foreign currency denominated debt. Such debt, however, is FULLY PROTECTED against any foreign exchange fluctuations through derivative (swap) operations that replace the foreign exchange risk for the variation in the basic Brazilian interest rate (CDI). SALES BY MEANS OF PAYMENT The breakdown of the sales, by means of payment in 1H13 and 1H12 can be seen in the following table:
Means of Payment 1H13 1H12 Var. 1H13 1H12 Var.
Cash 60% 59% +1 p.p. 50% 49% +1 p.p.
Credit Cards 40% 41% -1 p.p. 50% 51% -1 p.p.
Parent Company Consolidated
8 / 19
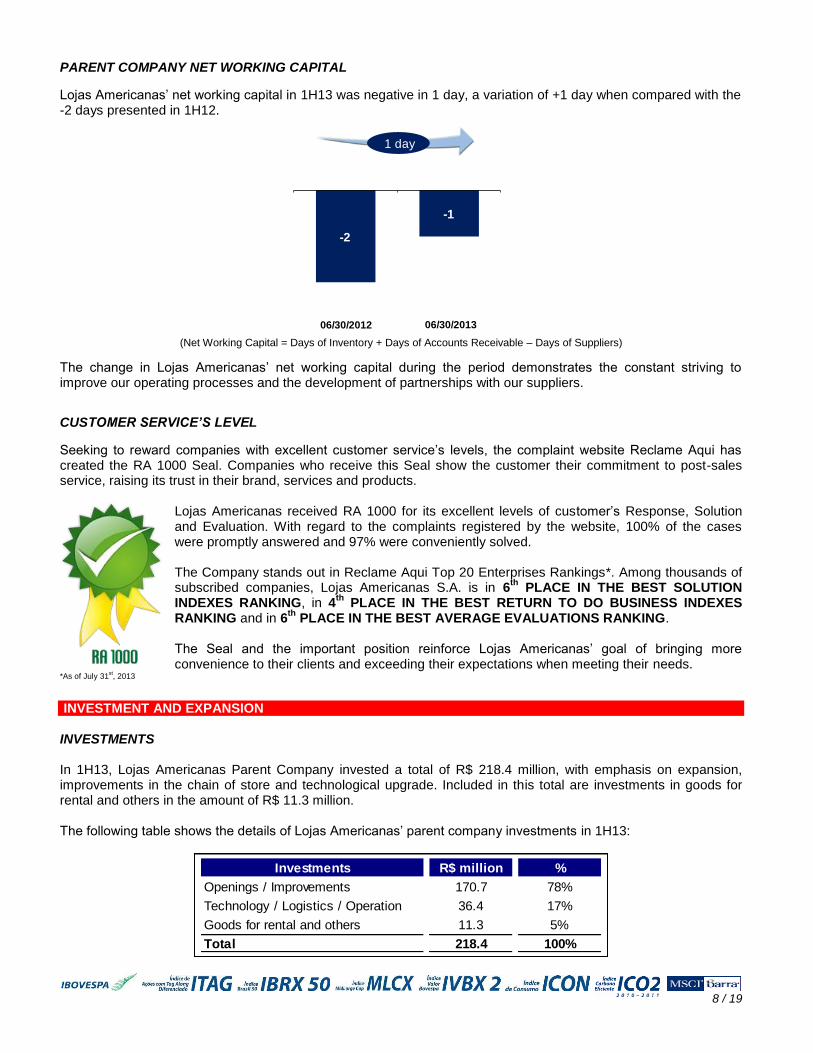
PARENT COMPANY NET WORKING CAPITAL
Lojas Americanas’ net working capital in 1H13 was negative in 1 day, a variation of +1 day when compared with the -2 days presented in 1H12.
-2
-1
06/30/2012 06/30/2013
1 day
(Net Working Capital = Days of Inventory + Days of Accounts Receivable – Days of Suppliers)
The change in Lojas Americanas’ net working capital during the period demonstrates the constant striving to improve our operating processes and the development of partnerships with our suppliers.
CUSTOMER SERVICE’S LEVEL
Seeking to reward companies with excellent customer service’s levels, the complaint website Reclame Aqui has created the RA 1000 Seal. Companies who receive this Seal show the customer their commitment to post-sales service, raising its trust in their brand, services and products.
Lojas Americanas received RA 1000 for its excellent levels of customer’s Response, Solution and Evaluation. With regard to the complaints registered by the website, 100% of the cases were promptly answered and 97% were conveniently solved. The Company stands out in Reclame Aqui Top 20 Enterprises Rankings*. Among thousands of subscribed companies, Lojas Americanas S.A. is in 6
th PLACE IN THE BEST SOLUTION
INDEXES RANKING, in 4th
PLACE IN THE BEST RETURN TO DO BUSINESS INDEXES RANKING and in 6
th PLACE IN THE BEST AVERAGE EVALUATIONS RANKING.
The Seal and the important position reinforce Lojas Americanas’ goal of bringing more convenience to their clients and exceeding their expectations when meeting their needs.
*As of July 31st, 2013
INVESTMENT AND EXPANSION INVESTMENTS In 1H13, Lojas Americanas Parent Company invested a total of R$ 218.4 million, with emphasis on expansion, improvements in the chain of store and technological upgrade. Included in this total are investments in goods for rental and others in the amount of R$ 11.3 million. The following table shows the details of Lojas Americanas’ parent company investments in 1H13:
Investments R$ million %
Openings / Improvements 170.7 78%0 0%
Technology / Logistics / Operation 36.4 17%0 0%
Goods for rental and others 11.3 5%0 0%
Total 218.4 100%

9 / 19
Expansion of the Chain of Stores
We intend to create value for our shareholders, following our internal motto, “We Always Want More”. The Lojas Americanas’ expansion project takes place on two main fronts: Lojas Americanas (brick-and-mortar retail) and B2W (Internet, telephone sales, catalogues, TV and kiosks).
At the end of 1H13, Lojas Americanas owned 744 stores, divided in the following formats:
Format Number of Stores %
Traditional 475 64%
Express 269 36%729
Total 744 100%
In 2013, we opened 21 stores as of today and have more than 80 stores with contract signed or in an advanced stage of negotiation, which demonstrates the Company’s commitment in the execution of our expansion plan.
411447
496 510
587
649
723
370Stores
418Stores
469Stores
479 Stores
565Stores
643Stores
744Stores
1H07 1H08 1H09 1H10 1H11 1H12 1H13
Nu
mb
er
of
Sto
res
Sale
s A
rea (
tho
usan
d m
²)
Evolution of Sales Area x Number of stores Position at June 30
State Traditional Stores Express Stores Sales Area (m²)
BA 2 - 1,5630 0 00 0 0ES 1 - 9990 0 00 0 0.0
MG 1 1 1,8110 0 00 0 0PA 1 - 1,1090 0 00 0 0.0
PB 1 - 1,1000 0 00 0 0PE - 1 5490 0 00 0 0.0
PI 1 - 1,3030 0 00 0 0PR 1 - 8440 0 00 0 0.0
RJ 1 1 1,2070 0 00 0 0RN 1 - 7330 0 00 0 0.0
RO 1 - 1,2190 0 00 0 0SP 1 - 7730 0 00 0 0
Total 12 3 13,209
Openings in the 1st Half/2013:
State Traditional Stores Express Stores Sales Area (m²)
BA 2 - 1,5050 0 0MG 3 - 2,374
RJ - 1 555
Total 5 1 4,434
Openings after the 1st Half/2013:

10 / 19
Expansion Plan – “SEMPRE MAIS BRASIL”
In the “SEMPRE MAIS BRASIL” organic expansion program, the Company has already opened 292 stores, keeping its commitment with the profitability and the usual discipline in the economic feasibility studies to the opening of new stores. As of 1H13, all the Company’s stores were located in 261 of the more than 5,500 cities in the country, which demonstrates the opportunity for Lojas Americanas to open new stores in cities that are at a greater distance from Brazil’s large urban centers.
As illustrated in the following chart, based on economic feasibility studies and analyses conducted internally using the EVA
® (Economic Value Added) tool, together with socio-economic data (population, income, access to basic
services, access to consumer goods, among others), we believe that at this moment there is the possibility that our brick-and-mortar retail stores could be present in approximately 100 additional cities.
26189
5,150
Cities with Lojas Americanas
Cities with potential for openingLojas Americanas
Nationwide distribution
In the last years we increased our presence in cities farther from urban centers and started our operations in the states of Acre, Amapá and Tocantins. Taking into account our “SEMPRE MAIS BRASIL” expansion program period (2010 – 2013), we opened our first store in 117 new cities as of today. At the end of 1H13 our stores were located in 25 states of the country plus the Federal District, with distribution as follows: 60.6% in the Southeast, 17.5% in the South/Midwest and 21.9% in the North/Northeast. Coupled with our confidence in the development of the country, the expansion plan for these new cities could especially benefit the North/Northeast/Midwest regions. As it has occurred historically, the growth should be in the proportion of 70% Traditional stores (average sales area between 1,000 m² and 1,500 m²) and 30% Express stores (average sales area between 300 m² and 500 m²). The following table shows the number of stores inaugurated in 2010, 2011 and 2012:
Year Number of Stores
2010 70
2011 90
2012 111 In February, 2012, Lojas Americanas announced the creation of a new Distribution Center, this time in Uberlândia, Minas Gerais. The new Distribution Center, which opening is expected for the second half of this year, will guarantee a faster supply of the physical stores and a better customer service for the Minas Gerais and for the Midwest and North regions.

11 / 19
INDICATORS AND HIGHLIGHTS OF THE SUBSIDIARIES B2W DIGITAL
We are presenting below the results for 2Q13 of our subsidiary B2W DIGITAL (BOVESPA: BTOW3).
The accounting information that serves as the basis for the following comments are presented pursuant to international financial reporting standards (IFRS) as well as the regulations issued by the Brazilian Securities Exchange Commission (CVM) and the Novo Mercado listing regulations, and are in reais (R$). The comparisons refer to 2Q12.
Gross Revenue
In 2Q13, the consolidated gross revenue reached R$ 1,369.8 million, a growth of 24.0%;
Net Revenue In 2Q13, the consolidated net revenue reached R$ 1,210.5 million, a growth of 22.1%;
Gross Profit and Gross Margin In 2Q13, the consolidated gross profit reached R$ 317.0 million, a growth of 28.3% and the consolidated gross margin reached 26.2%, a gain of 1.3 p.p.;
Adjusted EBITDA In 2Q13, the consolidated Adjusted EBITDA was R$ 87.4 million, a growth of 17.0%;
Improvement of 34 days in Consolidated Net Working Capital The consolidated net working capital at June 30, 2013 was 75 days, representing an improvement of 34 days when compared to the 109 days presented at June 30, 2012;
Fitch Ratings upgraded B2W DIGITAL rating to AA-
The rating agency Fitch Ratings upgraded the long-term corporate rating of B2W and their respective Debenture emissions from A + to AA- with a stable outlook;
B2W DIGITAL launches innovatively Fashion category In July 2013, Submarino launched the Fashion category, offering the best brands in the market and bringing the "Virtual Fitting Room", an unprecedented tool in Brazil;
B2W DIGITAL won the “RA 1000" Seal
B2W DIGITAL received the “RA 1000" Seal of quality in customer service in the Americanas.com and Shoptime brands.

12 / 19
CORPORATE GOVERNANCE AND CAPITAL MARKETS Since 1940, Lojas Americanas S.A. has been listed on the Brazilian Stock, Merchandise and Futures Exchange (BM&FBOVESPA). The Company has a shareholder base composed of common shares (LAME3) and preferred shares (LAME4). Lojas Americanas has a Board of Directors consisting of eight members – six appointed by the controllers, one appointed by minority shareholders and one appointed by the Board of Directors. Lojas Americanas also has a Fiscal Council formed by 3 members, one being indicated by the controllers and two indicated by the minority shareholders. Since 2006, the Company has maintained a commitment, as part of its By-Laws, to concede full (100%) tag-along rights for all of its common and preferred shares. This guarantees that all of Lojas Americanas’ shareholders will receive equal treatment in the event of a change of ownership, assuring them the right to sell their shares under the same terms extended to the controlling shareholders. Below is a brief description of the major corporate events of 2013: On January 11, 2013, through publication of a Material Fact, Lojas Americanas reported that it settled its financial obligations as foreseen in a contract of purchase and sale and other matters which the Company had signed with ITAÚ UNIBANCO HOLDING S.A., through the following payments: i) Lojas Americanas received R$ 93.6 million as a counterpart to the prior sale of its ownership interest in the capital stock of FAI – Financeira Americanas Itaú and; ii) Lojas Americanas paid R$ 112.4 million for the acquisition of usage license owned by FAI regarding exclusivity to offer, distribute and commercialize financial products and services, securities and pension products to its clients and/or affiliates. In addition, Lojas Americanas offered B2W the portion related to B2W’s distribution channels for the right to exclusivity, to offer, distribute and commercialize the Financial Products and Services. The offer was accepted through payment to LASA, by B2W, of an agreed amount of R$ 16.5 million. On March 12, 2013, at a Board of Directors Extraordinary Meeting, the members approved the early payment of dividends that were the subject of the proposal for the use of the net profits approved in a meeting held in March 6, 2013, debited from Net Profits for the fiscal year ending December 31, 2012 in the total amount of R$ 62,500,000.75. These dividends are to be paid as of April 1, 2013 and imputed to the mandatory dividend. On April 30, 2013, the Company’s General and Extraordinary Shareholders Meetings were held, at which the following Resolutions were approved: 1 – To take recognizance of the accounts prepared by the managers and related financial statements for the fiscal year ended December 31, 2012;
2 – Proposal for adoption of the Capital Budget for the fiscal year of 2013;
3 – Allocation of the net income reported for the fiscal year ended December 31, 2012;
4 – Election of Messrs. Carlos Alberto da Veiga Sicupira, Paulo Alberto Lemann, Miguel Gomes Pereira Sarmiento Gutierrez, Roberto Moses Thompson Motta, Cecilia Sicupira Giusti, Love Goel and Ruy Villela Moraes Abreu to the position of full members of the Company’s Board of Directors and Mr. Claudio Moniz Barreto Garcia as alternate member of the Board;
5 – Establishment of the Fiscal Council and the election of Messrs. Márcio Luciano Mancini, Ricardo Scalzo and Vicente Antonio de Castro Ferreira to the position of full members and Messrs. Pedro Carvalho de Mello, André Amaral de Castro Leal and Carlos Alberto de Souza as alternate members;
6 – Amendment to the Bylaws of the Company and its consolidation. On July 24, 2013, the Company reported the 8th Issue of simple debentures, non-convertible into shares, of chirographic type, in up to three series, for public distribution with restricted placement efforts, for a global total amount of R$ 400 million. The funds obtained through the debentures issuance will be used for its debt reprofiling. The minutes of the meetings listed above, as well as other corporate and financial information of Lojas Americanas S.A. are available for inspection on our Investor Relations website (http://ir.lasa.com.br) and on the website of the Brazilian Securities and Exchange Commission (www.cvm.gov.br).

13 / 19
About Lojas Americanas S.A. Lojas Americanas, one of the main retail chains in Brazil, is present all over the national territory through its multichannel chain, which comprises bricks-and-mortar stores, e-commerce, telephone sales and catalogues operations. The Company operates with two store formats: Traditional and Express. The former has an average sales area of 1,400 square meters, a daily fulfillment and an assortment of 60 thousand items while the second format has an average sales area of 400 square meters, just-in-time logistics and an assortment of 15 thousand items, selected according to every location’s needs. Lojas Americanas’ assortment is in continuous evolution, always aiming at exceeding the clients’ expectations when meeting their needs.
Currently, the 749 stores (480 in the Traditional format and 269 in the Express format – equivalent to a 727-thousand square meter sales area) are present in 261 cities of 25 states plus the Federal District and are served by three distribution centers, located in São Paulo, Rio de Janeiro and Pernambuco.
In the e-commerce, the Company operates through B2W DIGITAL, the result of the merger of Americanas.com and Submarino in 2006 that serves all the national territory and comprises the following brands: Americanas.com, Submarino, Shoptime, B2W Viagens, Ingresso.com, Submarino Finance, BLOCKBUSTER® Online and SouBarato.
Lojas Americanas’ shares are listed on the BM&FBOVESPA through ticker symbols LAME3 (common) and LAME4 (preferred).
“We Always Want More”
14 / 19
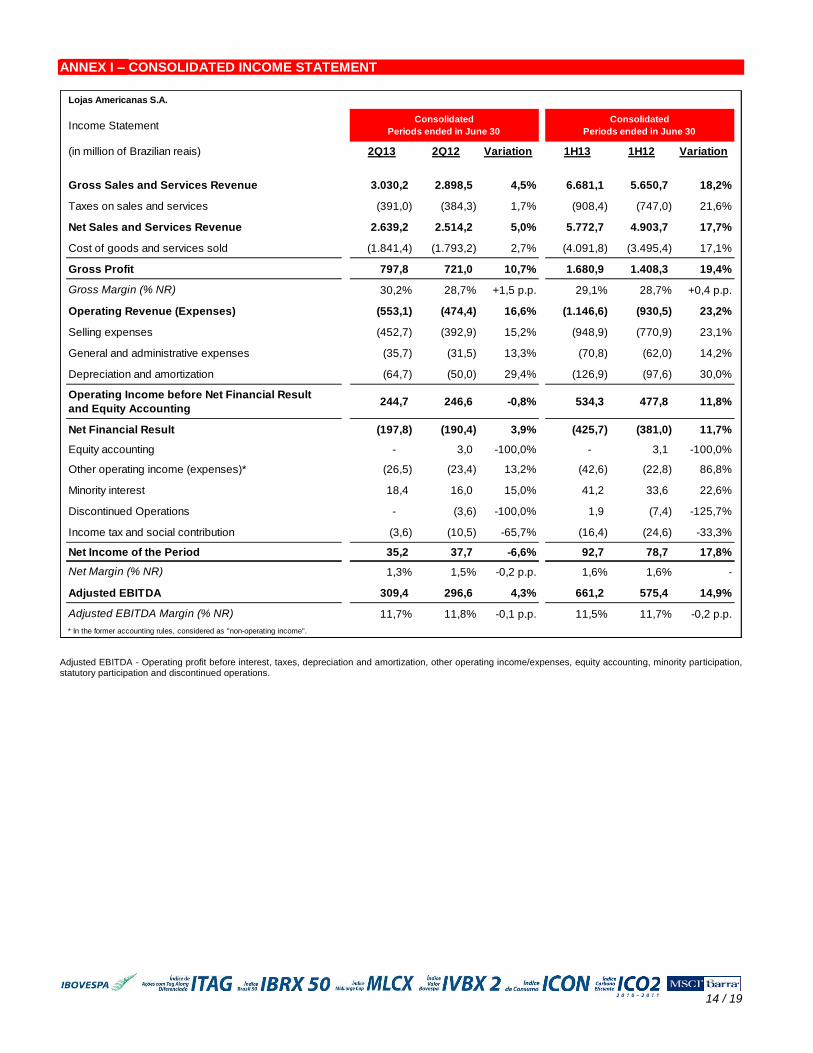
ANNEX I – CONSOLIDATED INCOME STATEMENT
Lojas Americanas S.A.
Income Statement
(in million of Brazilian reais) 2Q13 2Q12 Variation 1H13 1H12 Variation
Gross Sales and Services Revenue 3.030,2 2.898,5 4,5% 6.681,1 5.650,7 18,2%
Taxes on sales and services (391,0) (384,3) 1,7% (908,4) (747,0) 21,6%
Net Sales and Services Revenue 2.639,2 2.514,2 5,0% 5.772,7 4.903,7 17,7%
Cost of goods and services sold (1.841,4) (1.793,2) 2,7% (4.091,8) (3.495,4) 17,1%
Gross Profit 797,8 721,0 10,7% 1.680,9 1.408,3 19,4%
Gross Margin (% NR) 30,2% 28,7% +1,5 p.p. 29,1% 28,7% +0,4 p.p.
Operating Revenue (Expenses) (553,1) (474,4) 16,6% (1.146,6) (930,5) 23,2%
Selling expenses (452,7) (392,9) 15,2% (948,9) (770,9) 23,1%
General and administrative expenses (35,7) (31,5) 13,3% (70,8) (62,0) 14,2%
Depreciation and amortization (64,7) (50,0) 29,4% (126,9) (97,6) 30,0%
Operating Income before Net Financial Result
and Equity Accounting244,7 246,6 -0,8% 534,3 477,8 11,8%
Net Financial Result (197,8) (190,4) 3,9% (425,7) (381,0) 11,7%
Equity accounting - 3,0 -100,0% - 3,1 -100,0%
Other operating income (expenses)* (26,5) (23,4) 13,2% (42,6) (22,8) 86,8%
Minority interest 18,4 16,0 15,0% 41,2 33,6 22,6%
Discontinued Operations - (3,6) -100,0% 1,9 (7,4) -125,7%
Income tax and social contribution (3,6) (10,5) -65,7% (16,4) (24,6) -33,3%
Net Income of the Period 35,2 37,7 -6,6% 92,7 78,7 17,8%
Net Margin (% NR) 1,3% 1,5% -0,2 p.p. 1,6% 1,6% -
Adjusted EBITDA 309,4 296,6 4,3% 661,2 575,4 14,9%
Adjusted EBITDA Margin (% NR) 11,7% 11,8% -0,1 p.p. 11,5% 11,7% -0,2 p.p.
* In the former accounting rules, considered as "non-operating income".
Consolidated
Periods ended in June 30
Consolidated
Periods ended in June 30
Adjusted EBITDA - Operating profit before interest, taxes, depreciation and amortization, other operating income/expenses, equity accounting, minority participation, statutory participation and discontinued operations.

15 / 19
ANNEX II – PARENT COMPANY INCOME STATEMENT
Lojas Americanas S.A.
Income Statement
(in million of Brazilian reais) 2Q13 2Q12 Variation 1H13 1H12 Variation
Gross Sales and Services Revenue 1,791.2 1,843.4 -2.8% 3,947.0 3,543.9 11.4%
Taxes on sales and services (246.1) (278.8) -11.7% (550.5) (533.0) 3.3%
Net Sales and Services Revenue 1,545.1 1,564.6 -1.2% 3,396.5 3,010.9 12.8%
Cost of goods and services sold (1,063.9) (1,090.8) -2.5% (2,349.2) (2,088.0) 12.5%
Gross Profit 481.2 473.8 1.6% 1,047.3 922.9 13.5%
Gross Margin (% NR) 31.1% 30.3% +0.8 p.p. 30.8% 30.7% +0.1 p.p.
Operating Revenue (Expenses) (300.4) (283.3) 6.0% (629.6) (543.9) 15.8%
Selling expenses (241.0) (232.2) 3.8% (512.3) (448.0) 14.4%
General and administrative expenses (17.5) (15.8) 10.8% (35.5) (31.8) 11.6%
Depreciation and amortization (41.9) (35.3) 18.7% (81.8) (64.1) 27.6%
Operating Income before Net Financial Result
and Equity Accounting180.8 190.5 -5.1% 417.7 379.0 10.2%
Net Financial Result (97.2) (109.4) -11.2% (204.6) (216.4) -5.5%
Equity accounting (26.1) (17.5) 49.1% (61.2) (31.1) 96.8%
Other operating income (expenses)* - (0.1) -100.0% (0.4) (0.4) 0.0%
Discontinued Operations - (3.6) -100.0% 1.9 (7.4) -125.7%
Income tax and social contribution (25.4) (26.9) -5.6% (67.1) (54.5) 23.1%
Net Income of the Period 32.1 33.0 -2.7% 86.3 69.2 24.7%
Net Margin (% NR) 2.1% 2.1% - 2.5% 2.3% +0.2 p.p.
Adjusted EBITDA 222.7 225.8 -1.4% 499.5 443.1 12.7%
Adjusted EBITDA Margin (% NR) 14.4% 14.4% - 14.7% 14.7% -
* In the former accounting rules, considered as "non-operating income".
Parent Company
Periods ended in June 30
Parent Company
Periods ended in June 30
Adjusted EBITDA - Operating profit before interest, taxes, depreciation and amortization, other operating income/expenses, equity accounting, minority participation, statutory participation and discontinued operations.

16 / 19
ANNEX III – BALANCE SHEET
Lojas Americanas S.A.
Balance Sheet
(In Million Reais) 6/30/2013 12/31/2012 6/30/2013 12/31/2012
ASSETS
CURRENT ASSETS
Cash and banks 237.5 141.2 437.2 183.5
Marketable securities 927.2 1,315.0 3,039.6 2,924.8
Clients accounts receivable 385.3 702.3 1,416.3 1,622.2
Inventories 1,166.9 1,155.3 1,979.6 1,884.2
Recoverable taxes 228.9 257.5 387.4 386.0
Dividends receivable - 0.4 - -
Prepaid expenses 12.3 3.0 33.6 20.0
Other accounts receivable 164.1 289.6 221.7 333.3
Total Current Assets 3,122.2 3,864.3 7,515.4 7,354.0
NON-CURRENT ASSETS
Marketable securities 17.5 15.0 - -
Loans e advances to subsidiaries companies 7.3 0.9 - -
Receivables from stockholders - Stock Option Plan 55.3 55.3 55.3 55.3
Deferred income tax and social contribution - - 330.4 276.2
Escrow deposits 105.6 77.0 142.8 109.9
Recoverable taxes 313.1 264.2 423.2 349.3
Investments 1,413.8 1,470.5 - -
Property, plant and equipment 1,188.7 1,071.3 1,453.8 1,334.4
Intangible assets 256.7 261.8 1,815.5 1,601.2
Deferrred assets 3.6 8.7 - -
Total Non-Current Assets 3,361.6 3,224.7 4,221.0 3,726.3
TOTAL ASSETS 6,483.8 7,089.0 11,736.4 11,080.3
LIABILITIES AND SHAREHOLDER´S EQUITY
CURRENT LIABILITIES
Suppliers 1,550.1 1,958.9 2,530.2 2,920.1
Loans and financing 240.1 598.9 712.6 1,193.6
Debentures 103.9 144.1 120.9 166.5
Payroll and related charges 47.6 47.6 86.9 76.6
Taxes payable 90.1 141.6 95.1 152.9
Income tax and currents social contribution 53.7 101.9 59.6 107.2
Dividends and participations proposed - 117.9 - 117.9
Provisions for contingencies 10.4 11.9 11.1 12.7
Accounts payable - acquisitions - - 22.6 -
Other accounts payable 94.9 128.0 158.4 156.9
Total Current Liabilities 2,190.8 3,250.8 3,797.4 4,904.4
NON-CURRENT LIABILITIES
Long term liabilities:
Loans e advances to subsidiaries companies 4.3 34.6 - -
Loans and financing 1,359.9 941.5 4,285.5 2,556.8
Debentures 1,935.2 1,934.2 2,333.6 2,335.4
Taxes payable 9.4 15.5 11.8 17.3
Income tax and deferred social contribution 21.6 5.0 21.6 5.0
Allowance for contingencies 37.4 68.7 66.3 92.1
Allowance for loss on investiments 21.7 19.8 - -
Other accounts payable - - 0.6 -
Total Non-Current Liabilities 3,389.5 3,019.3 6,719.4 5,006.6
SHAREHOLDER'S EQUITY
Social capital 526.5 526.5 526.5 526.5
Capital reserves 22.0 19.3 22.0 19.3
Goodwill on capital transactions (196.0) (196.0) (196.0) (196.0)
Profit reserves 800.2 800.3 790.8 790.9
Treasury shares (337.1) (334.8) (337.1) (334.8)
Comprehensive result 1.6 1.7 1.6 1.7
Profit/ loss for the period 86.3 - 92.7 -
Additional distributable dividends - 1.9 - 1.9
Minority interest - - 319.1 359.8
Total Shareholders' Equity 903.5 818.9 1,219.6 1,169.3
TOTAL LIABILITIES AND SHAREHOLDERS' EQUITY 6,483.8 7,089.0 11,736.4 11,080.3
The accompanying notes are an integral part of these financial statements
Parent Company Consolidated

17 / 19
ANNEX IV – CASH FLOW STATEMENT
Lojas Americanas S.A.
CASH FLOW STATEMENT - INDIRECT METHOD
(In million reais) 6/30/2013 12/31/2012 6/30/2013 12/31/2012
Cash Flow from Operating Activities
Net Income for the Period: 86.3 69.2 92.7 78.7
Adjustments to Net Income:
Depreciation and amortization 90.4 72.2 135.4 105.7
Residual and deferred value of fixed assets write-off 20.8 4.0 4.3 4.3
Equity accounting 61.2 31.1 - (3.1)
Discontinued operations' profit realization (1.9) 7.4 (1.9) 7.4
Income tax and social contribution referred 13.3 7.3 (41.7) (27.7)
Interest on credits (2.3) (2.2) (2.3) (2.2)
Interest and variations financing and other debits 59.3 95.5 152.0 119.5
Adjustment in provision for contingencies - - 5.3 5.2
Stock option plan 1.8 1.4 2.8 1.9
Allowance for doubtfull accounts (0.3) (0.4) (14.3) 37.1
Others 12.4 0.6 20.1 0.2
Minority interest - - (41.2) (33.6)
Adjusted Net Income 341.0 286.1 311.2 293.4
Decrease (Increase) in Operating Assets:
Trade accounts receivable 302.4 205.7 72.9 412.8
Inventories (6.6) 75.0 (94.6) 4.0
Recoverable taxes (20.6) (105.3) (75.4) (141.1)
Prepaid expenses (12.8) (3.3) (17.2) 2.9
Escrow deposits (28.6) (19.9) (32.9) (34.6)
Other accounts receivable 125.5 (8.8) 111.6 18.1
359.3 143.4 (35.6) 262.1
Decrease (Increase) in Operating Liabilities:
Suppliers (425.4) (390.7) (410.4) (474.2)
Payroll and related charges - 0.8 10.3 4.2
Taxes payable (current and non-current) (107.5) (81.1) (113.3) (92.5)
Contingencies payments (current and non-current) (38.8) (6.4) (38.8) (6.5)
Loans and advances from subsidiaries (36.7) (1.2) - -
Accounts payable - acquisitions - - 22.6 -
Other accounts payable (current and non-current) (29.9) (57.1) 6.6 (78.0)
(638.3) (535.7) (523.0) (647.0)
Net Cash Provided (or Used) by Operating Activities 62.0 (106.2) (247.4) (91.5)
Cash Flow from Investing Activities
Marketable securities 385.4 385.3 (114.7) 25.6
Plant, property and equipment (183.0) (260.2) (198.5) (292.4)
Intangible (35.4) (23.0) (274.8) (183.0)
Dividends received 0.4 0.3 - -
Net Cash Provided (or Used) by Invest Activities 167.4 102.4 (588.0) (449.8)
Cash Flow from Financing Activities
Loans e financing ( current and non-current):
Borrowings 165.7 - 1,410.7 199.9
Liquidations (120.9) (154.3) (225.4) (397.2)
44.8 (154.3) 1,185.3 (197.3)
Debentures (current and non-current) (76.5) 348.9 (129.5) 638.6
Discounted receivables 18.4 (117.9) 153.1 180.3
Receivables from Stock Option Plan 2.4 4.2 2.4 4.1
Capital Increase - 15.8 - 15.8
Interest on equity and dividends paid (119.8) (96.1) (119.8) (96.2)
Share buy-back (2.4) (0.8) (2.4) (0.8)
Net Cash Provided (or Used) by Financing Activities (133.1) (0.2) 1,089.1 544.5
Net Increase (Decrease) in cash 96.3 (4.0) 253.7 3.2
Cash at the begining of period 141.2 107.3 183.5 131.5
Cash at the end of period 237.5 103.3 437.2 134.7
Net Increase (Decrease) in cash 96.3 (4.0) 253.7 3.2
The accompanying notes are an integral part of these financial statements
Parent Company Consolidated

18 / 19
Number of Stores Sales AreaNumber of
Associates
643 649 thousand m² 15,340
Opened 15
Transfered/Deactivated (1)
09/30/2012 657 661 thousand m² 15,673
Opened 74
Transfered/Deactivated (2)
12/31/2012 729 709 thousand m² 17,180
Opened 3
Transfered/Deactivated -
03/31/2013 732 713 thousand m² 17,617
Opened 12
Transfered/Deactivated -
744 723 thousand m² 16,99106/30/2013
06/30/2012
Evolution of the number of stores, associates and sales area - Lojas Americanas
EARNINGS RESULTS CONFERENCE CALL

19 / 19
EBITDA (CVM 527/12) – Net income of the period plus income taxes, net financial expenses of financial revenues and depreciation, amortization and depletion. Adjusted EBITDA (Operating profit before interest, taxes, depreciation and amortization, other operating income/expenses, equity accounting, minority participation, statutory participation and discontinued operations) is presented as additional information because we believe it represents an important indicator of our operating performance, besides being useful for keeping the comparability with previous reported results. Statements relating to the prospects of the business, estimates for operating and financial results, and those related to growth prospects of Lojas Americanas, eventually expressed in this report are merely projections and, as such, are based exclusively on the expectations of Lojas Americanas’ management concerning the future of the business and its continued access to capital to fund the Company’s business plan. Such statements depend, substantially, on changes in market
conditions, government regulations, competitive pressures, the performance of the Brazilian economy and the industry, among other factors and are, therefore, subject to change without prior notice BLOCKBUSTER® trademarks are owned by Blockbuster Inc. and Lojas Americanas S.A. has the right to use these trademarks in the activities of video rental and sales operation. MSCI Brand logo: The use of Morgan Stanley Capital International Inc. registered trademarks and indices ("MSCI") does not constitute any type of sponsorship, endorsement or promotion on the part of MSCI, its affiliates, its suppliers or other parties involved or related in the compilation, computation or creation of any MSCI index. MSCI’s indices are registered trademarks of MSCI or its affiliates and Lojas Americanas S.A. has been granted a license to use these trademarks for given purposes.