LOGO - Landmark Group · Hospital Name Sinocare Revenue 2008 Sinocare Revenue 2009 lease fee and...
40
LOGO Confidential
-
Upload
nguyendang -
Category
Documents
-
view
214 -
download
0
Transcript of LOGO - Landmark Group · Hospital Name Sinocare Revenue 2008 Sinocare Revenue 2009 lease fee and...

LOGO
Confidential

SinoCare
Introduction (1). Overview (2). Health sector (3). Advantages
(3). Management Team (4). Corporate Structure
Model &
Strategy
(1). Business Model (2). Hospital Analysis & Acquisition
(3). JV Structure (4). JV Cash Flow (5). Competitive JV
Case Study (1). Binggong
Future Plans (1). Sinocare Future Plans (2). Future Hospitals

Overview
The Chinese healthcare sector offers large and
scaleable opportunities
SinoCare is uniquely positioned to exploit these
opportunities
By the end of 2008, SinoCare has 3 hospitals
The aim is to be the Chinese equivalent of Kaiser
Permanente or BUPA
SinoCare plans IPO at $ 1 billion + valuation in 2016
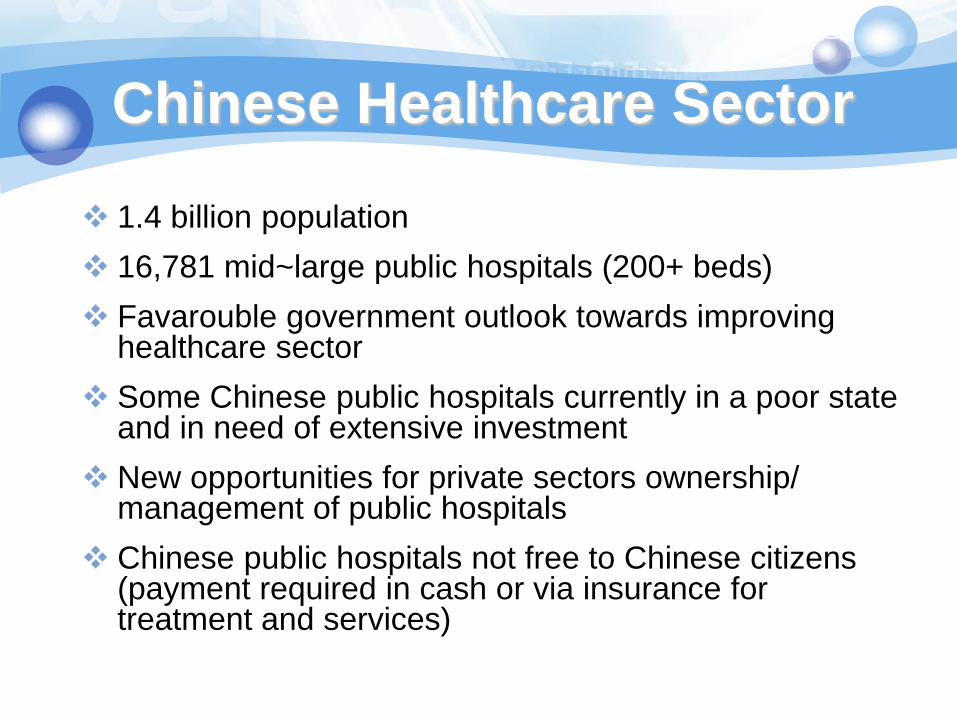
Chinese Healthcare Sector
1.4 billion population
16,781 mid~large public hospitals (200+ beds)
Favarouble government outlook towards improving healthcare sector
Some Chinese public hospitals currently in a poor state and in need of extensive investment
New opportunities for private sectors ownership/ management of public hospitals
Chinese public hospitals not free to Chinese citizens (payment required in cash or via insurance for treatment and services)
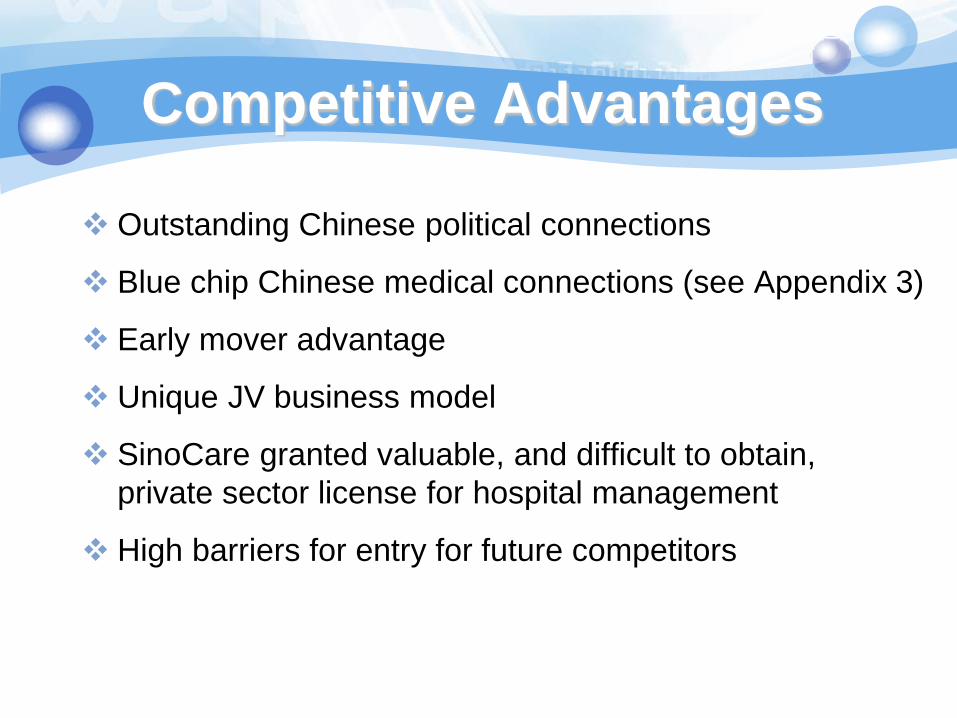
Competitive Advantages
Outstanding Chinese political connections
Blue chip Chinese medical connections (see Appendix 3)
Early mover advantage
Unique JV business model
SinoCare granted valuable, and difficult to obtain,
private sector license for hospital management
High barriers for entry for future competitors

Corporate Structure
100%
100%
Please see main shareholders’ CVs in Appendix 1
Shareholders Shareholders
Landmark Group John Porter Other investors
SinoCare Co Ltd. (BJ)
SinoCare Group Ltd. (HK)
Beijing SinoCare Co. Ltd

Management Team
Doron BIRAN
Hospital Investment
Hospital Management
Finance & Accounting
Sicheng YANG Baoying CHEN Jingda WANG
Please see CVs of management team in Appendix 2
John PORTER Yanhui MA Kai ZHAO Doron BIRAN John PORTER Dr.Yanhui MA
BOARD
Co-Chairman
CEO
Dr.YanHui MA
Co-Chairman CEO

Business Model
Focus on hospitals in high GDP cities
Target the number 1 or 2 hospitals in each target city
Focus on public hospitals for the mass Chinese population, not private hospitals for expatriates and the rich Chinese
JV with municipalities (with SinoCare always retaining control)

Hospital Investment and Management Review
Process
Stage 1 Preliminary Review
Exclusivity agreement for period of due diligence with initial price
and proportion of JV agreed
Physical inspection
Operational evaluation
Financial review
Overview discussions with hospital management and staff, approval
in principal including preliminary contract
Typically takes 2-4 weeks

Hospital Investment and Management Review
Process
Stage 2 Detailed Evaluation
Assignment of key Sinocare project team
Confirmation of ownership of physical assets
Detailed prior 3 years financial review
Legal review
Preparation of audited valuation report
Proposal of Sinocare plan for target hospital (prepared after
discussions with hospital management and local municipal)
Detailed investment and joint venture structure plans
Typically takes a futher 4-8 weeks depending on size of hospital and
Joint venture structure
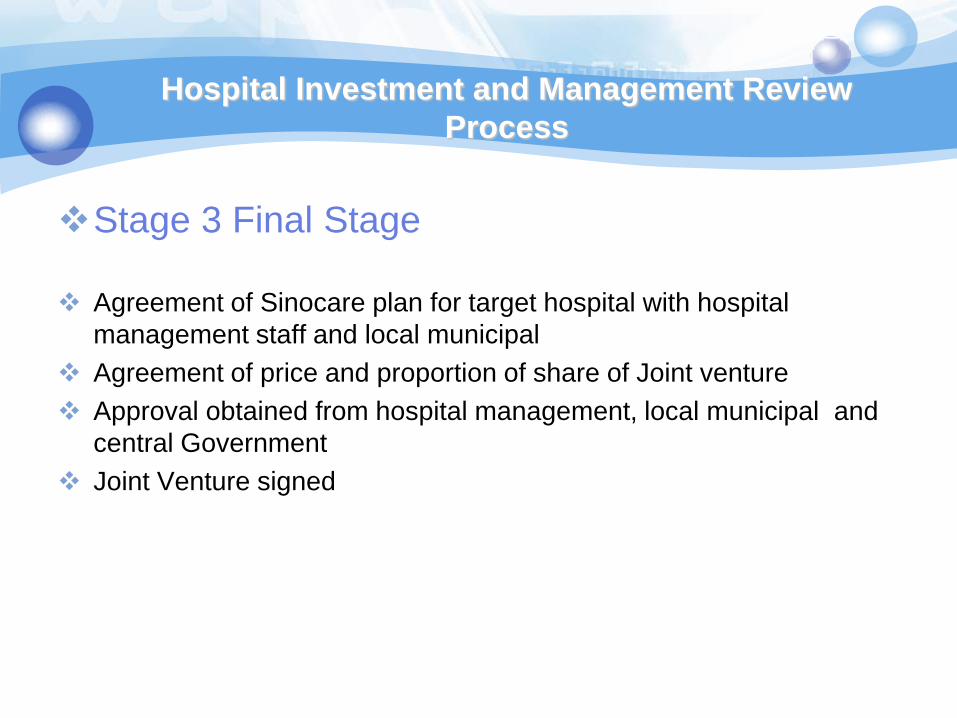
Hospital Investment and Management Review
Process
Stage 3 Final Stage
Agreement of Sinocare plan for target hospital with hospital
management staff and local municipal
Agreement of price and proportion of share of Joint venture
Approval obtained from hospital management, local municipal and
central Government
Joint Venture signed

Management Strategy
Increase Revenue and Control Costs by:
Introducing modern management techniques
Outsourcing non-core functions to reduce costs
Modernising standards of healthcare
Providing new technologies and state of the art equipment
Restructuring hospital teams and introducing new
motivated/trained personnel
Creating network of strategically located hospitals
Collaborating with international hospitals and key
professionals around the world
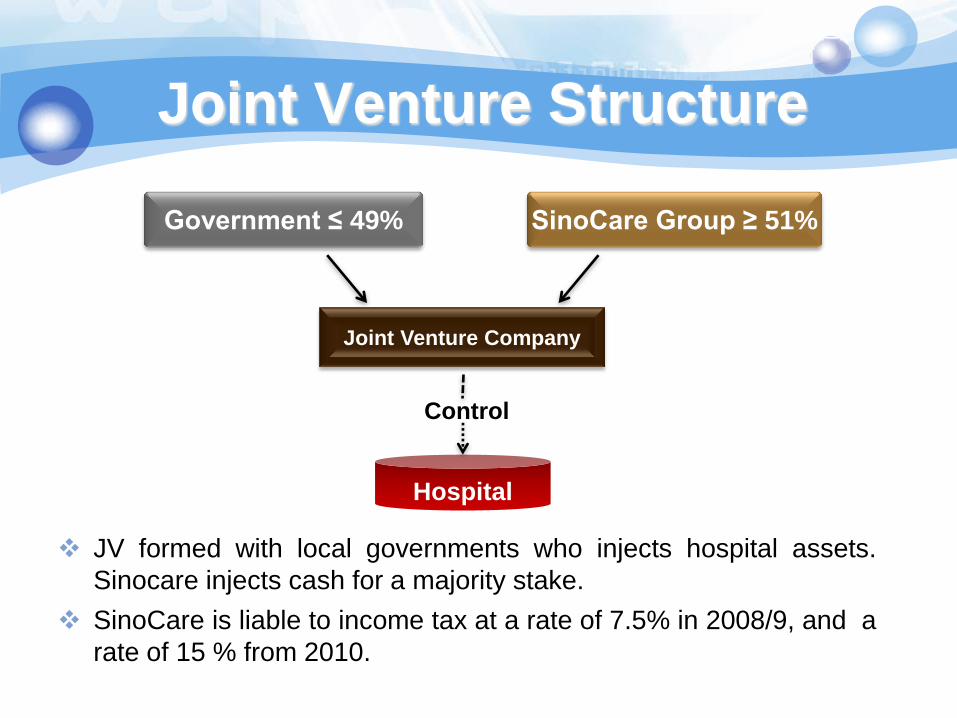
Joint Venture Structure
Hospital
Control
JV formed with local governments who injects hospital assets.
Sinocare injects cash for a majority stake.
SinoCare is liable to income tax at a rate of 7.5% in 2008/9, and a
rate of 15 % from 2010.
Government ≤ 49% SinoCare Group ≥ 51%
Joint Venture Company

Joint Venture Cash Flow
15% Rent
5% Management Fee
SinoCare Group Limited (HK)
Investment Dividend
Dividend
JV and the Hospital sign a 15-20 year renewable Management Agreement
with SinoCare with a management fee of 5% of total revenue.
JV signs a 15-20 year renewable Lease Agreement with the Hospital (on
sale & lease back model). Hospital pays a rent of 15% of total revenue.
SinoCare revenue stream based on hospital revenue generation rather than profits
SinoCare Group
Joint Venture Company
Hospital

Competitive JV Structure
Unique revenue-sharing Joint Venture Structure
Low capital intensity and capex requirements
High profit margins and cash flow conversion potential
given size of market, allowing rapid network expansion
Strong replicability of business model throughout
SinoCare hospitals all over China
High barriers to entry for future competitors
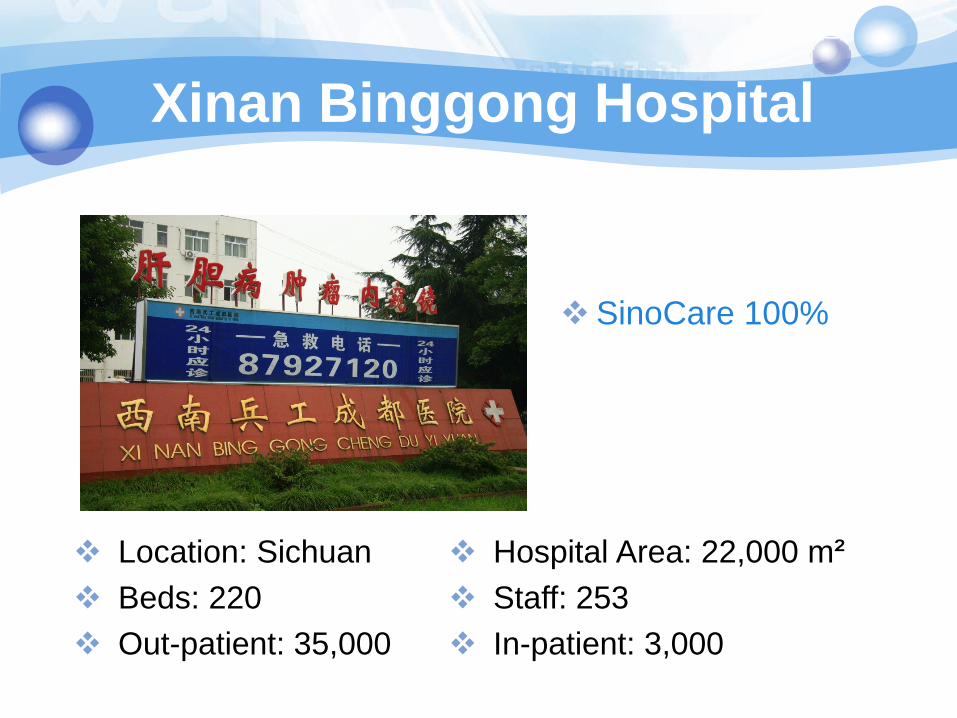
Xinan Binggong Hospital
SinoCare 100%
Location: Sichuan
Beds: 220
Out-patient: 35,000
Hospital Area: 22,000 m²
Staff: 253
In-patient: 3,000

Xinan Binggong Hospital
2006 2007 2008 2009 2010 2011
Hospital
Revenue 1.25 1.94 2.87 4.45 6.45 8.71
Profit - - 0.39 1.10 2.10 3.22
Sinocare’s
income 0.57 0.89 1.29 1.74
Unit: US $ million Investment amount: $ 2.14 million

Hospitals prospect
Puren Hospital Nanjing Hospital
Maoming Sinopec Hospital Handan Cancer Hospital

Hospital basic information
Name bed
numbers
before merger after merger
bed
occupancy
rate of 2007
bed
occupancy
rate of 2008
length of
patient
stay(days)2
007
length of
patient
stay(days)2
008
number of
outpatients
2007
number of
outpatient
s 2008
number of
inpatients
2007
number of
inpatients
2008
opened
bed
numbers
employe
es
medical
staff
month
revenue
opened
bed
numbers
employee
s
medical
staff revenue
Dongdu
hospital 250 60 178 128 O.8M 100 183 50 0.65M 58.00% 59.55% 22.78 22.30 25817 18550 2957 2050
Nanchong
hospital
120(250
available
) 80 185 135 O.6M 120 172 140 O.7M 58.10% 61.59% 15.40 18.70 10646 11478 1139 1150
Xinan
Binggong
hospital 185 140 176 137 1.2M 185 199 160 2M 59.00% 81.50% 18 13.83 31366 36528 2870 3915
Name bed
numbers
2008
bed
occupancy
rate of 2007
bed
occupancy
rate of 2008
length of
patient
stay(days)2
007
length of
patient
stay(days)2
008
number of
outpatients
2007
number of
outpatient
s2008
number of
inpatients20
07
number of
inpatients20
08
opened bed
numbers employees medical staff month revenue
Wuhan Puren
hospital
520(600
practical
) 600 698 602 11.6M 108.99% 98.28% 12.57 11.52 318923 335000 14769 18654
Maoming
hospital 603 573 820 686 10.8M 68.89% 70.59% 13.35 12.23 294788 338500 12659 16000
Zhangjiakou
hospital 300 300 325 231 4.16M 95.44% 102.52% 15.70 16.06 108533 112494 3857 3779
Handan
hospital 260 200 240 184 1.2M 80% 82% 17.20 16.01 42000 45000 2300 2500

SinoCare Future Plans
Acquire 3 and up to 6 hospitals by December 2009
IPO or sale of strategic stake in 2010
Develop own insurance operations leveraging off hospital network
Exploit synergies between SinoCare and SinoMed and SinoPharma

Appendix 1
Co-Chairman Prof.Doron BIRAN Israeli born, British citizen
LL.B Business Law degree from London University
Lloyd’s underwriter for medical malpractice
Well regarded international investor
Chairman of Landmark Group (one of the top real estate investors with multimillion pound property and bonds portfolio in the UK, Europe, Asia and the US)
Lectured as part-time Professor in Tsinghua University

Appendix 1
Co- Chairman
JOHN PORTER
British citizen
Degrees from Oxford University, Institut d’Etudes Politiques de Paris and Stanford University
Engaged in significant investment projects mainly in the information and healthcare industries since 1980s
Major shareholder of Telos Corp. (listed on NASDAQ) and was also the co-founder of Verifone Inc. (listed on NYSE)

Appendix 1
Director – Dr.Yanhui MA
MD, China Medical School; PhD, University of California
Specialized in diabetes and endocrinology
Close ties with central and local governments and national medical institutions
Member of Government medical think tank
Very high reputation in medical investment and technology area both in China and America

Appendix 2
CFO – Jingda WANG
Ph.D, Accounting, Beijing Tsinghua University
Published her research in dozens of peer-reviewed journals relevant to fiscal system and taxation in China

Appendix 2
Management Director – Sicheng YANG
MA, Finance
Was the investment manager of Beijing Venture Capital Co., Ltd.
Experienced in project investment and management

Appendix 2
Hospital Management Director
– Baoying CHEN
Hospital Director Excellence Award
President for 10 years of one of largest Hospitals in PRC
>20 years international experience in clinical practice and hospital management

Appendix 3
Government & Professional Associations
China Ministry of Health (MOH)
China Ministry of Education (MOE)
China Ministry of Science and Technology (MOST)
China Food and Drug Administration (FDA)
Chinese Sinopec Hospital Association
Chinese Hospital Association (CHA)
Chinese Stomatological Association (CSA)
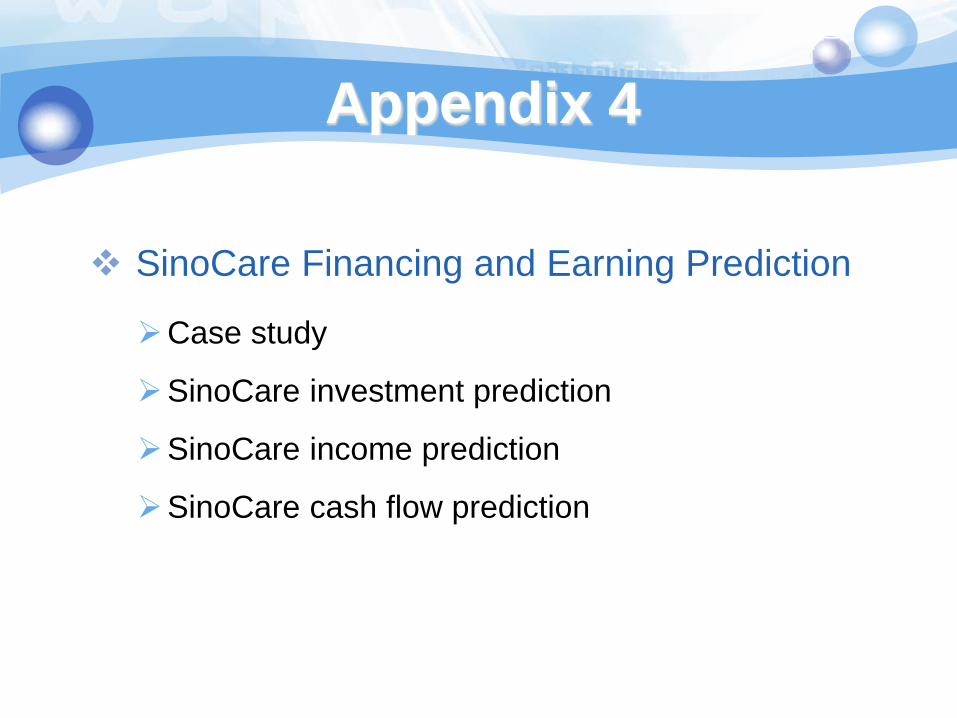
Appendix 4
SinoCare Financing and Earning Prediction
Case study
SinoCare investment prediction
SinoCare income prediction
SinoCare cash flow prediction
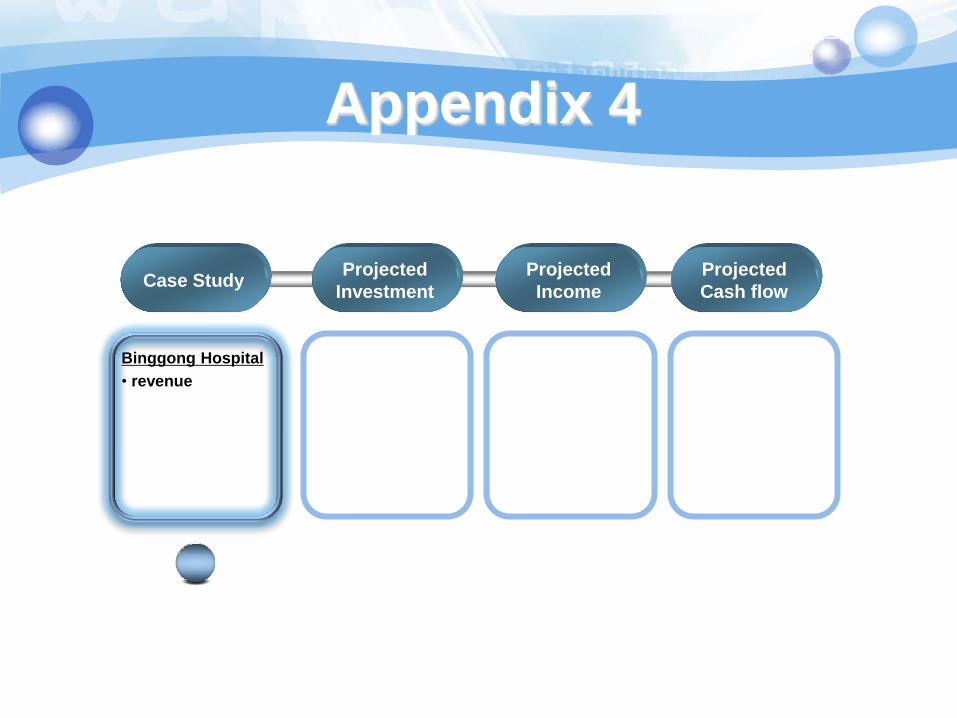
Case
study
Projected
Investment Projected
Income
Projected
Income Case Study Projected
Investment
Projected
Income
Projected
Cash flow
Binggong Hospital
• revenue
Appendix 4

Unit: US $ 10,000

Case
study
Projected
Investment Projected
Income
Projected
Income Case Study Projected
Investment
Projected
Income
Projected
Cash flow
2008 – 2011
2008 – 2012
•projected income
• return on investment
• Residual profit
• sinocare’s income
from residual profit
Appendix 4
Binggong Hospital
• revenue

Hospital Gross Turnover
unit:RMB million
Hospital Name Sinocare Revenue 2008 Sinocare Revenue 2009 lease fee and management fee
rate
gross turn over 2008
gross turn over 2009
Nanchong hospital 1.55M 2.31M 15.33% 10.11M 15.04M
Dongdu hospital 0.54M 2.41M 15.50% 3.48M 15.55M
Xinan binggong hospital 4.01M 5.80M 20% 20.05M 29M
Wuhan puren hospital 20.24M 12.65% 160M
Maoming Hospital 27.75M 12.65% 219M
Zhangjiakou Hospital 8.22M 18.50% 44.45M
Handan Hospital 3.30M 12.65% 26.09M
Nanjing Hospital 18.37M 12.65% 145M

Hospital Information
hospital name
Sinocare shareholding %
Total Investment & Purchase Amount Required (RMB)
Investment used for hospital growth (RMB)
Investment/purchase amount required in 2009 (RMB)
2007 revenue (RMB)
2008 Revenue (RMB)
2008 Profit (RMB)
2009 Forecast Revenue (RMB)
2009 Forecast Net Profit (RMB)
Current Debt(RMB)
Explanation of revenue model to Sinocare. Eg. 15% mgmt agreement? X% leaseback hospital asset? Only direct sharing of profit without mgmt fees? Etc.
Dongdu hospital 70% 20M 8M 15M 9.94M 6.81M - 15.56M 1.80M 34.98M
management and lease contract signed
Nanchong hospital 68.89% 25M 6M 0M 7.85M 8.95M - 15.04M 1.74M 4.21M
management contract signed, JV is set up, asset lease contract will be signed in Feb.
Xinanbinggong hospital 100% 15M 0M 0M 13.55M 20.16M - 29.00M 5.66M 16.01M
management contract signed, JV will be set up, then asset lease contract will be signed.
Maoming hospital 90% 70M 10M 42M 117.23M 130M 10M 150M 28M 49.34M
hospital manager team agree that we can get 5%management fee and 15% lease fee from hosptal.
Wuhan hospital 51% 80M 40M 117.86M 140M 11M 160M 19M 54.99M
hospital manager team agree that we can get management fee or lease fee from hosptal.
Zhangjiakou hospital 51% 50M 5M 25M 40.59M 49.26M 3.38M 65.01M 13M 19.18M
hospital manager team agree that we can get management fee or lease fee from hosptal.
Handan hospital 51% 16M 6M 8M 13.38M 14.68M - 27.09M 4.39M 20.60M
hospital manager team agree that we can get management fee or lease fee from hosptal.

Projected hospital ROI of Sinocare
Unit: RMB million
Hospital invested shares percentage capital investment projected income of sinocare 2009 ROI of 2009
Nanchong 69% 10 2.31 23.06%
Dongdu 70% 10 2.41 24.10%
Xinan Binggong 100% 15 5.80 38.67%
Puren 51% 80 20.24 25.30%
Maoming 90% 70 27.75 39.64%
zhangjiakou 51% 50 8.22 16.45%
Handan 51% 16 3.30 20.63%
Nanjing 51% 90 18.37 20.41%

Unit: US $ million

Used for medical education
and charity Reinvested to hospital
Shared by SinoCare and Government

Unit: US $ million

Case
study
Projected
Investment Projected
Income
Projected
Income Case Study Projected
Investment
Projected
Income
Projected
Cash flow
Appendix 4
Binggong Hospital
• revenue
2008 – 2012
•projected income
• residual profit
• sinocare’s income
from residual profit
2008 – 2011
2008 – 2009
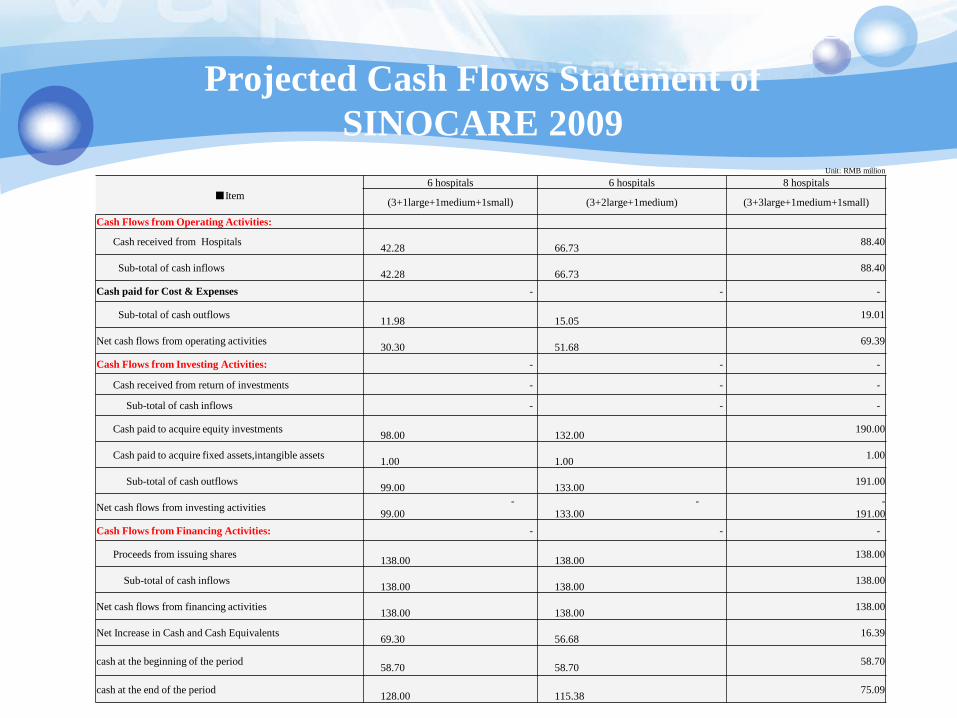
Projected Cash Flows Statement of
SINOCARE 2009
Unit: RMB million
■Item
6 hospitals 6 hospitals 8 hospitals
(3+1large+1medium+1small) (3+2large+1medium) (3+3large+1medium+1small)
Cash Flows from Operating Activities:
Cash received from Hospitals
42.28
66.73 88.40
Sub-total of cash inflows
42.28
66.73 88.40
Cash paid for Cost & Expenses - - -
Sub-total of cash outflows
11.98
15.05 19.01
Net cash flows from operating activities
30.30
51.68 69.39
Cash Flows from Investing Activities: - - -
Cash received from return of investments - - -
Sub-total of cash inflows - - -
Cash paid to acquire equity investments
98.00
132.00 190.00
Cash paid to acquire fixed assets,intangible assets
1.00
1.00 1.00
Sub-total of cash outflows
99.00
133.00 191.00
Net cash flows from investing activities -
99.00
-
133.00
-
191.00
Cash Flows from Financing Activities: - - -
Proceeds from issuing shares
138.00
138.00 138.00
Sub-total of cash inflows
138.00
138.00 138.00
Net cash flows from financing activities
138.00
138.00 138.00
Net Increase in Cash and Cash Equivalents
69.30
56.68 16.39
cash at the beginning of the period
58.70
58.70 58.70
cash at the end of the period
128.00
115.38 75.09

LOGO