LOGISTICS - Steamships · STEAMSHIPS’ ORGANISATIONAL STRUCTURE Steamships Annual Report 2016 3...
68
2016 ANNUAL REPORT
Transcript of LOGISTICS - Steamships · STEAMSHIPS’ ORGANISATIONAL STRUCTURE Steamships Annual Report 2016 3...

2016A N N U A L R E P O R T


Steamships Annual Report 2016 1
ContentsBrief Profile of Steamships Trading Company Limited . . . 2
Financial Highlights . . . . . . . . . . . . . . . . . . . . 4
Chairman’s Report . . . . . . . . . . . . . . . . . . . . . 6
Directors’ Review . . . . . . . . . . . . . . . . . . . . . 7
Review of Operations - LOGISTICS . . . . . . . . . . . . 8
Consort Express Lines . . . . . . . . . . . . . . . . 8
Pacific Towing . . . . . . . . . . . . . . . . . . . . 9
Transport & Port Services . . . . . . . . . . . . . 10
Review of Operations - PROPERTY . . . . . . . . . . . 11
Coral Sea Hotels . . . . . . . . . . . . . . . . . . 11
Pacific Palms Property . . . . . . . . . . . . . . . 12
Review of Operations - COMMERCIAL . . . . . . . . . 13
Laga Industries . . . . . . . . . . . . . . . . . . . 13
Colgate Palmolive . . . . . . . . . . . . . . . . . 14
Sustainability . . . . . . . . . . . . . . . . . . . . . . . 15
Corporate Governance . . . . . . . . . . . . . . . . . . 16
Financial Section . . . . . . . . . . . . . . . . . . . . . 17
Statements of Comprehensive Income . . . . . . . 17
Statement of Changes in Equity . . . . . . . . . . 18
Balance Sheets . . . . . . . . . . . . . . . . . . . 19
Statements of Cash Flows . . . . . . . . . . . . . 20
Notes to the Financial Statements . . . . . . . . . 21
Independent Auditor’s Report . . . . . . . . . . . 52
Directors’ Report . . . . . . . . . . . . . . . . . . 58
Stock Exchange Information . . . . . . . . . . . . 62
Company Directory . . . . . . . . . . . . . . . . . . . IBC
CONTENTS

2 Steamships Annual Report 2016
BRIEF PROFILE OF STEAMSHIPS GROUP
Integral to this vision are the following business strategies:
• The long-term development of a diversified range of businesses in which shareholder value can be created,
• Employment of staff who we believe will further our strategic objectives and will be committed to the group for the long term and providing them with rewarding careers,
• Operational excellence in the way we conduct our business,
• Doing business in a sustainable manner, and
• Commitment to the highest standards of corporate governance.
The Group employs over 3,500 PNG citizens and non-citizens in 6 diverse divisions grouped under the 3 operating categories of Logistics, Property and Commercial.
Steamships core values include the following:
• Safety – We prioritise safety awareness and compliance to ensure our business operations are conducted safely.
• Integrity – Taking the more ethical and honest path; honouring our commitments and delivering on our promises; creating a bond of trust that sustains relationships with our staff, customers, shareholders, business partners and the communities in which we do business.
• Excellence – Our customers and colleagues expect us to deliver high quality goods and services. If something is to be done, we believe it should be done in the best possible way.
• Customer Focus – Our customers are the final judges of our success or failure. We understand and respond to the needs of our customers.
• People Development – We value a working environment that fosters innovation and encourages personal development and learning.
• Humility – We believe in the need to respect and to learn from others. To do this we must be aware of our own limitations and to seek to understand other perspectives.
• Continuity – We take a long term view. We grow our business sustainably and create enduring value that earns the respect of our customers, our staff, our communities and our shareholders.
Steamships is aware of its prominent position in the community and its responsibility to serve that community. The Group continues to be one of PNG’s largest private sector employers and one of the largest supporters of community initiatives in education, health and social welfare. Steamships ensures that core sustainability concepts are embedded in its business models and systems. The Group is wholly aware that its business goals cannot be achieved unless this is the case. Steamships cannot succeed without the engagement and support of the people it employs, the loyalty and satisfaction of its customers, the local communities and the environment in which it operates.
Ninety-eight years on, Steamships is still showing it has the resources and capacity, vision and capability to meet the dynamic needs of a growing country.
Steamships Trading Company (Steamships) is a committed investor in Papua New Guinea with a near 100 year history. The group is a well-established business conglomerate with diverse commercial interests and listings on both the Australian and Port Moresby Stock Exchanges.
Steamships has a vision to build a valuable and profitable business that is widely respected as being the best group to work for and with which to do business.

STEAMSHIPS’ ORGANISATIONAL STRUCTURE
Steamships Annual Report 2016 3
STEAMSHIPS TRADING COMPANY
LOGISTICS PROPERTY COMMERCIAL
Consort Express Pacific Towing Transport & Pacific Palms Coral Sea Laga Lines Port Services Property Hotels Industries
X5 Associate Port East West Harbourside Colgate Service Co’s Transport Development JV Palmolive JV
JV Port Services Pacific (x10 JV Entities) Rumana JV
Wonye JV
Viva No 31 JV
BRIEF PROFILE OF STEAMSHIPS GROUP Brief Profile of Steamships Group

4 Steamships Annual Report 2016
FINANCIAL HIGHLIGHTS
2016 2015 Change K’000 K’000 %
Revenue (including discontinued operations) 732,701 773,535 -5%Profit attributable to shareholders 84,210 98,979 -15%Cash generated from operations 191,061 202,821 -6%Net cash inflow/(outflow) before financing 229,044 121,601 87%Shareholders’ funds 833,006 789,087 6%External Borrowings 502,497 644,667 -22% Earnings per share (toea) 272 319 -15%Dividends per share (toea) 130 130 0%Shareholders’ funds per share (toea) 2,686 2,545 6% Underlying profit attributable to shareholders 71,721 80,651 -11%Underlying earnings per share (toea) 231 260 -11% Gearing ratio 35% 43% -1%Interest cover 6.5 6.3 3%Dividend cover 2.1 2.5 -15%
2016 FINANCIAL HIGHLIGHTS
FINANCIAL HIGHLIGHTS

Steamships Annual Report 2016 5
Financial HighlightsSUMMARY OF PAST PEFORMANCE
2007 2008 2009 2010 2011 2012 2013 2014 2015 2016 K’000 K’000 K’000 K’000 K’000 K’000 K’000 K’000 K’000 K’000INCOME STATEMENT (including discontinued operations) Revenue 404,592 462,972 495,976 789,918 920,357 986,310 930,934 941,708 773,535 732,701 Profit before tax 91,208 111,615 120,602 180,834 233,967 265,574 79,747 134,789 136,042 118,686 Share of associates profit 15,029 16,837 16,732 11,416 13,859 14,188 9,697 3,843 3,062 5,865 Income tax expense (27,869) (32,808) (34,637) (53,935) (67,727) (81,414) (14,042) (38,487) (37,710) (35,677)Minority interests (4,211) (5,418) (6,137) (21,870) (21,838) (20,648) 38,609 (11,490) (2,415) (4,664)Net profit attributable to shareholders 74,157 90,226 96,560 116,445 158,261 177,700 114,011 88,655 98,979 84,210Depreciation transfer 1,467 159 0 0 (1,061) 0 0 0 0 0Equity adjustment 0 0 0 0 0 0 (8,994) 0 2,206 0 Dividends paid or provided for the year (38,760) (45,272) (45,272) (31,008) (58,916) (88,373) (57,365) (43,411) (48,062) (40,291)Earnings retained this year 36,864 45,113 51,288 85,437 98,284 89,327 47,652 45,244 53,123 43,919 Underlying profit attributable to shareholders (adjusted for significant items) 49,926 67,770 85,120 113,597 153,566 156,213 128,367 108,808 80,651 71,721 BALANCE SHEET SHARE CAPITAL & RESERVES Issued Capital 24,200 24,200 24,200 24,200 24,200 24,200 24,200 24,200 24,200 24,200 Retained Earnings 254,230 302,595 353,883 428,157 554,349 652,978 689,777 711,764 764,887 808,806 Shareholders’ funds 278,430 326,795 378,083 452,357 578,549 677,178 713,977 735,964 789,087 833,006 13,684 18,336 43,854 62,851 75,365 84,322 22,907 30,773 47,515 48,831 EQUITY 292,114 345,131 421,937 515,208 653,914 761,500 736,884 766,737 836,602 881,837 Fixed Assets / Investment Properties 263,276 353,261 664,196 786,510 938,709 1,023,861 1,066,393 1,115,123 1,072,955 1,068,892 Investments in Associated Companies 22,225 33,337 17,939 15,416 28,445 38,687 31,471 33,193 36,458 66,445 Future Income Tax Benefit 5,358 4,150 7,305 9,282 0 0 21,081 33,521 36,914 36,680 Goodwill 3,568 7,578 17,183 17,183 17,183 17,183 93,617 80,491 80,491 80,491 Other assets 137,623 154,508 203,480 294,203 299,634 411,920 352,549 366,479 400,480 284,200 TOTAL ASSETS 432,050 552,834 910,103 1,122,595 1,283,971 1,491,651 1,565,111 1,628,807 1,627,298 1,536,708 Current Liabilities 134,941 122,562 236,847 273,055 283,445 370,396 230,390 190,621 541,292 184,646 Non-Current Liabilities 4,995 85,141 251,319 334,331 346,612 359,755 597,837 671,449 249,404 470,225 TOTAL LIABILITIES 139,936 207,703 488,166 607,386 630,057 730,151 828,227 862,070 790,696 654,871 NET ASSETS 292,114 345,131 421,937 515,208 653,914 761,500 736,884 766,737 836,602 881,837 RATIOS Current assets to current liabilities 1.02 1.26 0.86 1.08 1.06 1.11 1.53 1.92 0.74 1.12Borrowings to shareholders funds 13.6% 34.8% 89.1% 89.7% 70.1% 72.6% 89.7% 95.2% 81.7% 57%Gearing 11.5% 24.8% 44.4% 44.0% 38.3% 39.2% 46.5% 47.8% 43.1% 34.6%Tangible net asset backing per share (kina) 9.31 10.89 13.05 16.06 20.53 24.00 20.75 22.13 24.38 25.84Net profit to revenue % 18.3% 19.5% 19.5% 14.7% 17.2% 18.0% 12.2% 9.4% 12.8% 11.5%Net profit to shareholders’ funds % 26.6% 27.6% 25.5% 25.7% 27.4% 26.2% 16.0% 12.0% 12.5% 10.1%Underlying profit to shareholders’ funds % 17.9% 20.7% 22.5% 25.1% 26.5% 23.1% 18.0% 14.8% 10.2% 8.6%Dividends per share (toea) 125 146 146 100 190 285 185 140 130 130EPS (toea) 239 291 311 376 510 573 368 286 319 272Underlying EPS (toea) 161 219 275 366 495 504 414 351 260 231Earnings retained % 49.7% 50.0% 53.1% 73.4% 62.1% 50.3% 41.8% 51.0% 61.5% 52.2% Notes Earnings per share = profit attributable to shareholders / average shares in issueGearing = debt / debt plus equityInterest cover = earnings before interest and tax / net finance chargeDividend cover = profit attributable to shareholders / total dividend paid and provided
FINANCIAL HIGHLIGHTS

6 Steamships Annual Report 2016
The economic environment in 2016 was weaker than had been anticipated across all sectors. Although commodity prices, upon which the economy is heavily dependent, generally increased during 2016 the benefit has yet to be felt in the broader economy. The lack of foreign currency hampered business activity and maintained pressure for a devaluation of the Kina. Government expenditure was constrained by the continuing national budget deficit and there is a lack of international investor appetite for the much discussed sovereign bond issue
The introduction of legislation with proposed reforms to the Land Act, the Mining Act and the SME policy has caused concern for the private sector and may lead to a reduction in foreign direct investment in PNG whilst there is uncertainty over the scope of these reforms.
Continuing low oil and gas prices bring uncertainty to anticipated development projects, but the quality and extent of PNG resources should mean that development will commence in the foreseeable future. The reopening of the Ok Tedi copper mine in early 2016 and the increased price of copper provided an encouraging boost for the economy.
The predicted national budget deficit and a mid-year election creates uncertainty for the 2017 economic outlook, which combined with subdued private sector investment, will likely see another difficult year for business in 2017 .
Port Moresby will host the APEC economic leaders meeting in November 2018 and there will be many related events that should generate business activity. Construction of the conference centre is underway and Steamships is supportive of efforts to create a landmark event to promote PNG to a global audience.
In 2016 the logistics businesses, including shipping, towing, stevedoring and transport benefitted from the corporate restructurings of 2015 as well as new investment in vessels and equipment. The International Terminal Concession award remained open and the Steamships’ stevedoring and handling businesses remain well positioned to work with whoever is finally selected.
Pacific Palms Property’s performance was satisfactory and remained largely static by virtue of its high quality investments in strategic locations. Despite over-supply in some sectors as demand fell in 2016, rents and occupancy rates remained resilient. Market conditions have led to a cautious approach to new development but some exciting prospects are in the design phase to take advantage of any market recovery. Significant progress has been made on the
reconstruction of Waigani Central, as well as joint venture mixed commercial and retail developments in Mt. Hagen and Madang.
Coral Sea Hotels was affected by the economic slowdown and new capacity entering the Port Moresby market. Investment was maintained in the upgrade of product and service standards to better attract and retain customers in the increasingly competitive market. New dining facilities were launched at The Gateway Hotel in Port Moresby and compensated for a reduction in room revenue. The Coastwatchers Hotel in Madang was sold and The Melanesian Hotel in Lae was closed pending construction of a new and larger hotel.
The transformation of Laga through focus on enhanced manufacturing, sales and distribution capacities, especially in the ice cream sector, continued to reap rewards and its sharper focus on quality and customer service is being recognised in the market.
Capital investment was constrained in 2016 in light of the economic downturn. The balance sheet remains strong and positions Steamships well to capitalise on opportunities when they arise. Steamships remains confident in the longer term prospects for the PNG economy whilst remaining disciplined in tackling short-term challenges. This approach has enabled Steamships over its 98 years of operations to contribute and participate in PNG’s journey of development.
Steamships will continue to invest in the training and development of all employees despite the economic slowdown. We intend to be at the forefront of the recovery of economic growth and for our team to continue to grow Steamships and its contribution to PNG. I thank all our staff for their commitment and hard work which have been and will remain critical to the success of Steamships.
GL CundleChairman
31 March 2017
Chairman’s ReportCHAIRMAN’S REPORT

Steamships Annual Report 2016 7
The Directors of Steamships Trading Company Limited advise a profit after tax and minority interests of K84.2 million for the 12 months to December 2016, compared to a profit of K99.0 million for the same period in 2015, a 14.9% decrease. Adjusting for significant items the underlying profit attributable to shareholders decreased by 11.1% from K80.7 million in 2015 to K71.7 million in 2016 as shown below:
The result reflects the prolonged weakness in economic conditions that was evident throughout much of last year. Demand for goods and services was adversely impacted in the second half of the year not only by the continuation of low commodity prices (which did see a late recovery that is encouraging for the future) but also by a shortage of foreign currency. The market also saw an increase in capacity and consequently competition which compounded this weak demand picture. As a consequence 2016 saw notable pressure across the economy and Steamships’ sales revenue declined 5% to K732.7 million against last year’s K773.5 million, on a continuing basis.
Depreciation in 2016 was K106.7 million (excluding impairments) against K102.1 million in 2015, and net interest on borrowings (excluding capitalised interest) was K22.0 million against K26.0 million in 2015. Capital
expenditure for the 12 months was K109.5 million (with capitalised interest of K1.7 million) against K108.1 million (with capitalised interest of K1.5 million) in 2015 reflecting a deliberate slow down in project activity given the economic climate. The group’s net operating cash flow generation declined 6% to K191.1 million against K202.8 million in 2015 .
A final dividend of 35 toea per share has been proposed and will be paid following approval at the company’s annual general meeting on the 19th of May 2017, subject to Steamships’ ability to secure foreign exchange for non PNG shareholders. This brings the total dividend for the year to 130 toea per share (2015 = 130 toea per share). The dividend is unfranked and there is no conduit foreign income .
2016 2015 Km’s Km’s Change Net profit attributable to shareholders 84.2 99.0 -14.9%
Add back/(less) impact of significant items (post tax and minority interests)Unrealised gain on change in control of Pacific Rumana - (18.9)Impairment of coastal slipway due to Paga Hill ring road - 1.3Gain on sale of fleet and equipment (post highway closure impairment) - (0.7)Gain on sale of properties (19.2) -Trade Winds impairment - 0.9Laga office and amenities impairment - (1.0)Impairment of fixed assests 2.2 -Hotel and Property development cost write off 5.6 -Other (1.1) -Total impact of significant items (12.5) (18.3)
Underlying profit attributable to shareholders 71.7 80.7 -11.1%
Directors’ ReviewDIRECTORS’ REVIEW

8 Steamships Annual Report 2016
At 31 December 2016, Consort operated a fleet of 19 coastal vessels (7 geared, multi-purpose deep water vessels and 12 shallow water landing craft, bulk carriers, tugs and barges). All are PNG flagged and manned and all safety and technical specifications are maintained in accordance with Lloyds international standards.
LINER SERVICES
Consort connects 17 ports around PNG. The Division has scheduled services to the North Coast, South Coast, New Guinea Islands, Bougainville and Western Province. Consort proudly serves the people of PNG by providing the sole supply link to many of the communities on its routes.
The division can carry a range of cargoes including containerised, break-bulk, reefer, LCL and project cargo. Consort transports cargo for a diverse customer base from domestic manufacturers and wholesalers to international liner carriers transshipping cargoes to outports.
In addition to owning and operating ships, Consort provides complementary depot services to customers at its Lae hub and is a shareholder and manager of stevedoring operations at five PNG ports. These stevedoring companies are partnerships between Consort and local landowner companies and provide significant employment opportunities for the nearby communities.
PROJECT CHARTERS
Consort provides short and long term vessel charters specialising in shallow water river shipping, and together with the Transport & Port Services Division develops, implements and supports intermodal logistics solutions linked to land based services such as road transport, cargo handling, storage, agencies, customs clearance, lay down areas and warehousing.
The year started with the virtual collapse in the oil and gas exploration markets as a function of the sharp drop in the price of oil in Q4 2015 and continuation of the El Nino drought from the end of 2015.
As a consequence of the weakness in the Oil & Gas market, planned deployments of the Projects Charters fleet failed to eventuate but the first quarter of the year was buoyed by activity associated with the demobilisation of rig sites remaining from 2015. Thereafter a portion of the Project Charters fleet was deployed with the liner trades, with surplus vessels remaining idle.
The El Nino drought lasted until April and curtailed both demand as well as the ability to supply the Fly River ports. Frosts in the highlands as well as the shortage of rain severely hampered the local production of food and damaged the cash economy leading to generally low levels of shipping throughout the country for the first half of the year. Volumes improved with the breaking of the drought and a very good coffee crop and high prices for cocoa meant that shipping levels increased in the second half of the year.
Consort’s planned fleet renewal programme continued with the disposal of one of its older liner vessels in July and the arrival of a replacement, Niugini Coast, in November. Niugini Coast is a sister to the two larger capacity vessels in the fleet and introduces efficiency and capacity that will support the division into the future. The landing craft ‘Lahara Chief’ was sold at the end of the year, having been superseded by the new shallow draft and double bottomed landing craft purchased in 2014.
2016 also saw a number of liner vessels requiring extensive scheduled periods in dock to revalidate their certificates. In the fourth quarter a decision was taken to start sending vessels to Singapore for docking and, despite the time needed to get to and from the dock, a noticeable improvement has been observed in both out-of-service time and docking expense.
At the close of 2016 Consort withdrew from the international liner market due to declining freight volumes and as a consequence the decision was taken to sell the two vessels which had serviced this trade lane in 2017.
Despite the challenges of 2016, the underlying performance was positive with tonnages up 4% on 2015 and a significant year-on-year improvement in the underlying result. While the 2017 economic environment is expected to be just as tough as 2016, Consort believes the recent transition of tonnage will allow them to concentrate on delivering a consistent and reliable service to their customers, resulting in greater market support.
CONSORT EXPRESS LINES
Review of Operations - LogisticsREVIEW OF OPERATIONS - LOGISTICS

Steamships Annual Report 2016 9
Pacific Towing is the leading provider of harbour towage and mooring services in PNG and offers coastal and ocean towage services. A full member of the International Salvage Union, it also retains a fast responder salvage capability complimented by a comprehensive range of commercial dive services. As an ancillary service the company also provides life raft leasing & servicing and in 2017 will commence with the provision of oil spill response and fire services.
Pacific Towing is headquartered in Port Moresby and operates 11 tugs and 10 associated support vessels in five ports across PNG (Port Moresby, Lae, Rabaul, Kimbe and Madang). Dedicated harbour towage services were extended to the Solomon Islands in 2013 through a subsidiary company operating in Honiara
Pacific Towing experienced a 7% decline in its principal harbour towage jobs, but positive non-harbour towage, salvage and diving activity meant that the division posted a respectable result .
In 2016 two salvages were responded to (Swift 8 & Kiunga Chief) with the latter being settled during the year. During 2016 the Helene Rickmers salvage was also settled and a conclusion to negotiations for the Foxhound and Tao Mariner salvages are expected in 2017.
People development remains a focus and work experience for Pacific Towing seafarers continues with Hong Kong Salvage & Towage, with two employees expected to travel to Hong Kong for a month’s work in 2017. Nine new cadets have been selected for training at the Madang Maritime College and training of the existing cadre of deck and engine officers continues with the college. Pacific Towing’s divers likewise continue to attend the Professional Diving Academy in Sydney.
At the end of 2016 Pacific Towing secured the purchase of a 50tbp tug, Turner, which will allow for the location of an ASD tug in Kimbe, increasing tug capacity in that port in response to growing tanker needs.
REVIEW OF OPERATIONS - LOGISTICS
PACIFIC TOWING

10 Steamships Annual Report 2016
TRANSPORT & PORT SERVICES
Transport & Port Services completed its first full year of operations in 2016 after the management of the group’s transport and port services interests were combined in 2015.
EAST WEST TRANSPORT (EWT)
EWT is one of the country’s main multifaceted transport and logistics companies with a presence in Lae, Port Moresby, Kimbe, Rabaul, Madang, Wewak and Kavieng. The division has a sizable fleet of prime movers, heavy trucks, light trucks, forklifts and reach stackers ranging from 2.5 to 45 tons in capacity. All equipment is supported by localised workshop facilities, safety and emergency vehicles and in house training programs.
EWT operates across a wide spectrum of transport-related activities including bulk fuel, containerised cargoes, sawdust and coffee along with break-bulk cargoes and depot services such as equipment hire, warehousing and yard storage. EWT also offers a licensed customs cargo clearance service in Lae and Port Moresby. The Division capitalises on its close relationship with its sister shipping company by offering specialised project solutions for the mining, oil and gas sectors.
JV PORT SERVICES (JVPS)
The group’s eight JVPS businesses offer a full range of stevedoring and handling facilities in the ports of Port Moresby, Lae, Alotau, Oro, Madang, Kimbe, Kavieng and Kiunga. With a fleet of specialist equipment the businesses handle all types of containers, as well as project cargo, break-bulk, RO-RO, LO-LO and grains. The stevedoring companies are joint ventures between Steamships and local landowner groups at the respective ports. Each joint venture employs a local workforce and is structured in a manner so that a share of earnings is able to filter back into the community.
The Transport and Port Services division showed resilience in the face of soft operating conditions in 2016 to meet projected financial performance, and continues to unlock synergies from the 2015 merger of land based logistics operations .
Competition remains fierce in the transport industry however with the exit of a number of smaller operators and with customers looking for safety and reliability, transport has been able to maintain its market share with respect to general transport and has seen an increase in depot services. Material fuel contracts have also been renewed or extended in 2016. The reduction in PNG imports has impacted top-line revenue however cost controls and synergies from the merger of EWT with JV Port Services have maintained a sustainable bottom line.
Joint Venture Port Services (JVPS) regional operations produced a slightly improved consolidated result. Port Services Ltd in Port Moresby was negatively impacted by lines calling at the new Motukea facilities, but Lae stevedoring operations remain strong. Morobe Terminals Limited was established in Q4 2016 as a joint venture between Riback and Lae Port Services to provide handling operations in Lae port and position the merged entity as a strong partner for the eventual awardee of the Lae Tidal Basin terminal operating concession.
The division moves into 2017 with a formidable array of experience through a strong, well trained employee base of 1,300 staff and with a significant range of fit for purpose equipment. It remains highly compliant with industry best practice standards and thus is well placed to meet the challenges head on.
REVIEW OF OPERATIONS - LOGISTICS

Steamships Annual Report 2016 11
Coral Sea Hotels (CSH) operates seven hotel and apartment complexes offering full hotel facilities and serviced apartments as well as extensive meeting, conference and banqueting facilities.
CSH is the largest hotel group in PNG, offering 549 hotel rooms and 125 apartments. The Group comprises the Grand Papua Hotel, the Gateway Hotel and Apartments, the Ela Beach Hotel and Whittaker Apartments in Port Moresby; the Huon Gulf Hotel in Lae; the Highlander Hotel and Apartments in Mount Hagen and the Bird of Paradise Hotel in Goroka. During the year the Coastwatchers Hotel in Madang was sold and the Melanesian Hotel in Lae was demolished in preparation for a new hotel to be constructed.
The CSH profit margin declined further in 2016 as revenue per available asset for both rooms and apartments declined 13% and 32% respectively and F&B revenues declined 15% on the prior year. The continuing impact of a slower economy on business travel, budget constraints on government department expenditure and reduced consumer discretionary spend all contributed to this decline but 2016 also saw a significant increase in competition in Port Moresby. The hotel sector was impacted by the opening of the Stanley Hotel in Waigani and in the restaurant space by the commencement of operations of 5 new restaurants and cafés at Harbourside.
The Port Moresby hotels benefited from pre APEC 2018 meetings as well as the FIFA women’s under 20’s world cup Championships held in November 2016. The opening of three new F&B outlets at the Gateway Hotel increased the profile of that property and is providing a new destination for dining and entertainment near the airport.
Investment was maintained in the completion of the upgrade of the Ela Beach Hotel and the progression of the refurbishment plans for the Highlander Hotel, which will commence in the first quarter of 2017. 2017 will also see soft upgrades performed on the room inventory at the Gateway Hotel and Whittaker Apartments. Coral Sea Hotels is partnering with the Ok Tedi Development Foundation to build and operate a new 45 bed hotel (the Cassowary) in Kiunga, which is due to open in 2017.
Significant investment continues in training and staff development in order to maintain a high quality of service offering for customers and a number of World Luxury Hotel Awards in the Australasia and Oceania category were once again achieved in 2016.
Plans for 2017 onwards include redevelopment of the Melanesian Hotel in Lae, extensions for the Highlander Hotel in Mt Hagen and a re-invigorated restaurant concept for the Grand Papua Hotel. The market is expected to remain competitive as new Hotels commence operations in the run up to APEC in 2018.
CORAL SEA HOTELS
Review of Operations - PropertyREVIEW OF OPERATIONS - PROPERTY

12 Steamships Annual Report 2016
PACIFIC PALMS PROPERTY
Pacific Palms Property (PPP) is one of the largest and most dynamic property developers in PNG. The division currently holds property in the Residential, Commercial, Retail and Industrial sectors with building and land assets located in Port Moresby, Lae, Madang, Wewak, Goroka, Mt. Hagen, Popondetta and Rabaul.
PPP’s strategy of making investments of scale and quality in good locations continues to support stable revenues even though over-supply of property is growing in Port Moresby. PPP continued its selective disposal of less strategic properties over 2016 .
The Port Moresby residential market has been hit by falling demand as the economy continues to decline and over-supply to the market continues. PPP rates however remained stable and overall occupancy increased year on year, reflecting the quality of its product. The refurbishment of Windward West apartments completed during the year and the building was fully tenanted at year end.
The commercial category has seen occupancy drop amidst signs of weakness in the market. The Harbourside East
& West Development remains at 100% occupancy and this supported the decision to approve work to design the complimentary Harbourside South Development .
The retail category maintained strong occupancy, although this is reduced from prior year. The joint venture to develop a mixed retail & commercial centre in Madang will see this property complete construction in early 2017. The joint venture to develop a mixed retail & commercial centre in Mt. Hagen will see the construction of Mt. Hagen’s largest supermarket and a modern retail/commercial facility complete in 2017. The rebuild of the fire damaged Waigani Central supermarket has recently been completed and operations to commence tenant fitout will follow.
PPP remains the dominant player in the industrial category. General market rates and occupancies have held steady through 2016. PPP’s recent development of warehouses in the Baruni area continues to experience vacancies however PPP remain positive that the market will pick up as various developments around the new international berth at Motukea continue and the road development is completed in 2017.
The focus in 2017 for PPP will be to renew expiring leases in all sectors and maintain high maintenance standards to sustain high occupancy rates.
REVIEW OF OPERATIONS - PROPERTY

Steamships Annual Report 2016 13
LAGA INDUSTRIES
Headquartered in Lae, Laga Industries is one of PNG’s largest consumer goods businesses manufacturing and distributing ice cream, vegetable oils, condiments, powdered drinks, snack foods and beverages.
Brands include Gala Ice Cream, distributed from the “Gala Pala’s” found in most leading retail supermarkets; Highland Meadows and Laga Cooking Oils; Kools powdered drinks, Star of India Curry Powder, 111 Baking Powder and Instant Yeast and various other branded Specialty lines; and Trade Winds spirits including popular ready-to-drink (RTD) premixed beverages. Laga Industries also bottles pure drinking water under the Tropical Oasis brand and various private labels.
Operationally, the Division has a fully integrated production facility in Lae, a freezer and dry goods distribution centre and sales office in Port Moresby and sales offices in Madang, Wewak, Goroka, Mt Hagen, Kimbe, Kavieng, Kokopo/Rabaul and Buka. The Lae production facility is a large industrial site which features a state of the art Ice Cream production plant which is the largest capacity plant in the Pacific.
Laga Industries continued its significant turnaround in fortunes in 2016 with sales growth in key segments, including Ice Cream and Cooking Oil as well as operational improvements across all aspects of the business .
Despite challenging market conditions overall sales saw modest growth. In the core Ice Cream and Cooking Oil
segments solid growth was achieved, particularly in the second half of the year. Specialty Lines sales were flat and Beverage sales declined as focus shifted away from alcoholic lines, under the Trade Winds banner, to non-alcoholic products.
Ice Cream was buoyed by the introduction of a new product Hamamas, which contributed to a much improved product range. The new Ice Cream plant continued to generate high product quality and pleasing production efficiencies, yielding improved margins. The business continued to invest in the iconic Gala brand.
Cooking Oil margins reduced during the year as the impact of rising commodity prices and the declining Kina impacted. Paradoxically, these same forces, combined with the lack of liquidity in the Kina, pushed many competitors out of the market in 2016, driving strong growth in the second half for the Highland Meadows range.
Specialty Lines sales were flat in 2016 after strong growth in the prior year. After many years of underinvestment, significant capital was invested in this business segment in 2016 to lift production capacity and efficiency.
The Beverages business declined sharply in 2016 as the alcoholic beverages business, Trade Winds, was being scaled down in anticipation of divestment. This process is expected to conclude early 2017. As a result of the exit of the alcoholic beverages business, sales will decline in 2017 .
Operating profit improved in 2016 but 2017 is expected to see a small reduction due to the loss of Beverage revenue. Overhead costs have been significantly reduced during 2015 and 2016. The forward focus is now on growth of the core business segments.
Review of Operations - CommercialREVIEW OF OPERATIONS - COMMERCIAL

14 Steamships Annual Report 2016
Review of Operations - CommercialREVIEW OF OPERATIONS - COMMERCIAL
COLGATE PALMOLIVE
Steamships holds a 50 per cent beneficial interest in Colgate-Palmolive (PNG) Ltd (Colgate), a company that markets and distributes oral, personal, home and fabric care products in PNG. Joint control is exercised by the board however day to day management is performed by Colgate-Palmolive Australia .
Colgate Palmolive, a PNG joint venture, saw improved trade volumes in Oral, Personal Care and Home Care categories, the latter being driven by a record year in Laundry Bar sales. Margins improved but soap chip input costs will continue to be a challenge.
Continued improvement in in-store execution and an enhanced distribution presence in second tier markets had a positive impact on sales. Marketing focus was maintained on consumer education programmes in all media to promote the health benefits of oral and personal hygiene. The “Bright Smiles, Bright Futures” campaign for Colgate toothpaste had a direct interaction between Colgate Palmolive’s oral health ambassadors and 305,000 consumers (the majority being school children) across PNG, up from 245,000 in 2015.
2017 is expected to see a continuing tight consumer market, however, based on excellent sales execution, modest growth in sales and profit is anticipated.

Steamships Annual Report 2016 15
The principles of Sustainable Development remain core to how Steamships conducts its business and are key to delivering long term value to its customers and shareholders. The three pillars of Our People, Our Environment and Our Community, underpin the Sustainability strategy of the company. Steamships’ understands that a clear commitment to these three pillars will ensure it is always well placed to make a valuable and lasting economic and social contribution to Papua New Guinea.
Steamships people are its most critical asset . At Steamships the focus is to ensure that employees are afforded every opportunity to build strong, rewarding and successful careers in an environment of safety, trust, fairness and respect. Recognising this fact, the company recruited a specialist General Manager for Human Resources in 2016 to drive the necessary changes required for superior people development. The transition of the company’s two original GDP (Graduate Development Programme) trainees into fulltime roles within the business marked a significant milestone for its graduate development pathways, and focus will continue to develop programmes for the future leaders of the business. The results of the 2016 People Pulse staff survey confirm that there is an overriding satisfaction with the opportunities and rewards offered at Steamships, as well as highlighting areas for improvement.
Environmental Sustainability continues to be a priority area for Steamships. Responsible and sustainable energy consumption is an area of increased focus and this is done through the regular monitoring and reporting of energy use, water use and environmental emissions at operational level. There is an intention to further enhance reporting to align with internationally recognised reporting
standards. Company staff again participated in World Environment Day, delivering awareness lectures to selected school children, and coordinating a number of educational activities to highlight the importance of environmental sustainability.
Steamships has a considerable presence in PNG and it is considered essential to have a positive impact on the various communities in which it operates. Engagement with the community is facilitated through an involvement in social programs that prioritize four key areas; health, social welfare, education, sports and culture. The aim is to identify projects and partnerships that bring measurable, meaningful, and positive impact to those in most need. The company committed over K1.2 million to various community based initiatives in 2016.
Steamships’ sustainability performance aligns with the requirements of the Global Reporting Initiative (GRI), a worldwide corporate transparency initiative that Steamships has followed since 2013. The full GRI report and a comprehensive Sustainability Report are available on the Steamships website at www.steamships.com.pg.
SustainabilitySUSTAINABILITY

16 Steamships Annual Report 2016
Corporate GovernanceCORPORATE GOVERNANCE
Steamships and its Board are committed to achieving and demonstrating the highest standards of corporate governance and ethical behaviour, and they expect these standards from all employees. The Group believes that the maximisation of long term returns to shareholders is best achieved by acting in a socially responsible manner that recognises the interests of community stakeholders.
Steamships is committed to:
• Providing high-quality products and services to meet customers’ needs;
• Maintaining high standards of business ethics and corporate governance; and
• Ensuring the safety and wellbeing of employees and others with whom the Group has contact;
• Promoting sustainable business practice.
Steamships reports against the Australian Stock Exchange (ASX) recommendations by addressing each key principle in the order it is listed in the ASX guidelines. Each section
addressing a key principle includes references to relevant information that appears elsewhere in the 2016 Annual Report or on the Steamships’ website.
Steamships believes it complied with the Australian Stock Exchange Corporate Governance Principles (the third edition) during the twelve months ended 31 December 2016, except where noted in the Corporate Governance Report .
Steamships’ Corporate Governance Report can be found at http://www.steamships.com.pg/aboutus/corporategoverance

Steamships Annual Report 2016 17
STATEMENTS OF COMPREHENSIVE INCOMESteamships Trading Company Limited Year Ended 31 December 2016 (Amounts in Kina 000’s)
Consolidated Parent Entity
Note 2016 2015 2016 2015Continuing Operations Revenue 3(a) 732,701 773,535 31,691 38,044Other income 3(a) 19,766 48,285 2,726 3,217Operating expenses 3(b) (611,794) (660,082) (1,805) (1,928)OPERATING PROFIT 140,673 161,738 32,612 39,334Finance (costs)/income - net 3(e) (21,987) (25,696) 72 72Share of profit of associates and joint ventures 4(b) 5,865 3,062 - -PROFIT BEFORE INCOME TAX 124,551 139,104 32,684 39,406Income tax expense 5(a) (35,677) (37,710) (801) (519)PROFIT FROM CONTINUING OPERATIONS 88,874 101,394 31,883 38,887Other comprehensive income - - - -TOTAL COMPREHENSIVE INCOME FOR THE YEAR 88,874 101,394 31,883 38,887Attributable to: Non-controlling interests 4,664 2,415 - -Shareholders 84,210 98,979 31,883 38,887 88,874 101,394 31,883 38,887 Basic and Diluted Earnings per share continuing (toea) 3(f) 272t 319t
These Statements of Comprehensive Income are to be read in conjunction with the accompanying notes.

18 Steamships Annual Report 2016
STATEMENT OF CHANGES IN EQUITYSteamships Trading Company Limited Year Ended 31 December 2016 (Amounts in Kina 000’s)
Non- Share Retained Other Total Capital Controlling Total Capital Earnings Reserves & Reserves Interest Equity
BALANCE AT 1 JANUARY 2015 24,200 720,758 (8,994) 735,964 30,773 766,737
Profit for the year - 98,979 - 98,979 2,415 101,394
Dividends paid 2015 - (48,062) - (48,062) (2,795) (50,857)
Equity adjustment due to deconsolidation - 2,206 - 2,206 17,122 19,328
BALANCE AT 31 DECEMBER 2015 24,200 773,881 (8,994) 789,087 47,515 836,602
Profit for the year - 84,210 - 84,210 4,664 88,874
Dividends paid 2016 - (40,291) - (40,291) (3,348) (43,639)
BALANCE AT 31 DECEMBER 2016 24,200 817,800 (8,994) 833,006 48,831 881,837
This Statement of Changes in Equity is to be read in conjunction with the accompanying notes.
No Statement of Changes in Equity is presented for the Parent Entity as the only movement in equity is represented by the retained earnings as shown in the statement of comprehensive income and dividend movements as reflected above for the Group.
There is no other comprehensive income.

Steamships Annual Report 2016 19
BALANCE SHEETSSteamships Trading Company Limited As At 31 December 2016 (Amounts in Kina 000’s)
Consolidated Parent Entity Note 2016 2015 2016 2015Current assets Cash and cash equivalents 6 36,685 11,538 404 1,660Trade and other receivables 7 134,822 147,830 407 1,101Inventories 8 41,128 41,008 - -Loans to related companies 9 - 159,755 - -Income tax receivable 5(e) 716 - - 604 213,351 360,131 811 3,365Non-current assets Property, plant and equipment 10 682,917 731,596 25,934 26,160Investment properties 11 385,974 341,359 - -Investments in related companies 4(a) 66,445 36,458 208,163 195,360Loans to related companies 9 70,850 40,349 5,712 5,712Intangible assets 12 80,491 80,491 - -Deferred tax assets 5(c) 36,680 36,914 245 182 1,323,357 1,267,167 240,054 227,414TOTAL ASSETS 1,536,708 1,627,298 240,865 230,779
Current liabilities Trade and other payables 13 98,639 89,456 680 -Provisions for other liabilities and charges 14 11,510 9,970 - -Loans from related companies 9 35,452 26,690 200,404 182,592Loan from minority shareholder 15 32,259 22,933 - -Borrowings 15 6,786 390,836 - -Income tax payable 5(e) - 1,407 4 - 184,646 541,292 201,088 182,592Non-current liabilities Deferred tax liabilities 5(c) 30,982 33,426 - -Provisions for other liabilities and charges 14 11,243 11,770 - -Borrowings 15 428,000 204,208 - - 470,225 249,404 - -TOTAL LIABILITIES 654,871 790,696 201,088 182,592NET ASSETS 881,837 836,602 39,777 48,187 EQUITY Issued capital 16 24,200 24,200 24,200 24,200Reserves 808,806 764,887 15,577 23,987Capital and reserves attributable to theCompany’s shareholders 833,006 789,087 39,777 48,187Non-controlling interests 48,831 47,515 - -TOTAL EQUITY 881,837 836,602 39,777 48,187
These Balance Sheets are to be read in conjunction with the accompanying notes.
For and on behalf of the Board: G.L. Cundle P.W. Langslow31 March 2017 Chairman Managing Director

20 Steamships Annual Report 2016
STATEMENTS OF CASH FLOWSSteamships Trading Company Limited Year Ended 31 December 2016 (Amounts in Kina 000’s)
Consolidated Parent Entity
Note 2016 2015 2016 2015CASH FLOWS FROM OPERATING ACTIVITIES
Receipts from customers 783,668 797,587 3,421 1,966
Payments to suppliers and employees (531,244) (525,266) (590) (2,148)
Interest received 12,248 13,952 72 72
Interest and other finance costs paid (34,235) (41,194) - -
Income tax paid 5(e) (39,376) (42,258) (256) -
Net cash provided by/(used in) operating activities 18 191,061 202,821 2,647 (110)
CASH FLOWS FROM INVESTING ACTIVITIES
Purchase of property, plant & equipment (109,478) (108,116) (311) -
Proceeds from sales of property, plant & equipment 24,241 8,608 - -
Loans repaid by/(extended to) associated companies 147,343 13,219 17,812 11,024
Investment in associates & joint ventures (24,143) - (12,803) -
Dividends received 20 5,067 31,691 38,044
Net cash (used in)/provided by investing activities 37,983 (81,222) 36,389 49,068
CASH FLOWS FROM FINANCING ACTIVITIES
Proceeds from borrowings 38,000 9,208 - -
Repayments of borrowings (186,903) (75,612) - -
Dividends paid (43,639) (50,857) (40,292) (48,063)
Net cash (used in)/provided by financing activities (192,542) (117,261) (40,292) (48,063)
NET INCREASE/(DECREASE) IN CASH HELD 36,502 4,338 (1,256) 895
NET CASH AT BEGINNING OF THE YEAR (6,603) (10,941) 1,660 765
NET CASH AT END OF THE YEAR 29,899 (6,603) 404 1,660
CASH COMPRISES:
Cash and cash equivalents 6 36,685 11,538 404 1,660
Bank overdrafts 15 (6,786) (18,141) - -
29,899 (6,603) 404 1,660
These Statements of Cash Flows are to be read in conjunction with the accompanying notes.

Steamships Annual Report 2016 21
NOTES TO THE FINANCIAL STATEMENTSSteamships Trading Company Limited Year Ended 31 December 2016 (Amounts in Kina 000’s)
1. Summary of significant accounting policies
The Company is a company limited by shares and is incorporated and domiciled in Papua New Guinea.
These Group consolidated financial statements were authorised for issue by the Board of Directors on 31 March 2017.
The Board of Directors has the power to amend the financial statements after their issue.
The financial statements have been prepared in accordance with International Financial Reporting Standards (“IFRS”).
Changes in accounting policy and disclosures
Standards, amendment and interpretations effective in the year ended 31 December 2016
The following standards, amendments and interpretations to existing standards became applicable for the first time during the accounting period beginning 1 January 2016.
• Amendment to IFRS 11 ‘Joint arrangements’ on acquisition of an interest in a joint operation. These amendments provide new guidance on how to account for the acquisition of an interest in a joint operation that constitutes a business.
• Amendment to IAS 16 ‘Property, plant and equipment’ and IAS 38 ‘Intangible assets’, on depreciation and amortisation. These amendments clarify that the use of revenue-based methods to calculated depreciation and amortisation is not appropriate because revenue generated by an activity that includes the use of an asset generally reflects factors other than the consumption of the economic benefits embodied in the asset .
• Amendments to IAS 27 ‘Separate financial statements’ on the equity method. These amendments allow entities to use the equity method to account for investments in subsidiaries, joint ventures and associates in their separate financial statements.
• Annual improvements 2014 makes minor changes to IFRS 5, IFRS 7, IAS 19 and IAS 34.
• Amendments to IAS 1 ‘Presentation of Financial Statements’ form a part of the IASB’s Disclosure Initiative and clarify guidance in IAS 1 on a number of issues including:
- Materiality – disclosures specified in IFRS only need to be included in financial statements if they are material to the entity
- Disaggregation and subtotals – line items specified in IAS 1 may need to be
disaggregated where this is relevant to an understanding of the entity’s financial position or performance. However, entities should not aggregate or disaggregate information in a manner that obscures useful information. There is also new guidance on the use of subtotals .
- Notes – confirmation that the notes do not need to be presented in a particular order
- Other comprehensive income (OCI) arising from investments accounted for under the equity method: the share of OCI arising from equity-accounted investments is grouped based on whether the items will or will not subsequently be reclassified to profit or loss. Each group should then be presented as a single line item in the statement of OCI.
• Amendments to IFRS 10 and IAS 28 on investment entities applying the consolidation exemption. The amendments to IFRS 10 clarify that the exception from preparing consolidated financial statements is available to intermediate parent entities which are subsidiaries of investment entities. The exception is available when the investment entity parent measures its subsidiaries at fair value. The amendments to IAS 28 allow an entity which is not an investment entity, but has an interest in an associate or joint venture which is an investment entity, a policy choice when applying the equity method of accounting.
Standards, amendments and interpretations issued but not yet effective for the year ended 31 December 2016 or adopted early
The following standards, amendments and interpretations to existing standards have been published and are mandatory for the company’s accounting periods beginning on or after 1 January 2017 or later periods, but the company has not early adopted them:
• Amendments to IAS 7 ‘Statement of Cash Flows’ on disclosure initiative (effective 1 January 2017). These amendments to IAS 7 introduce an additional disclosure that will enable users of financial statements to evaluate changes in liabilities arising from financing activities.
• Amendments to IAS 12 ‘Income Taxes’ on recognition of deferred tax assets for unrealised losses (effective 1 January 2017). These amendments on the recognition of deferred tax assets for unrealised losses clarify how to account for deferred tax assets related to debt instruments measured at fair value.

22 Steamships Annual Report 2016
NOTES TO THE FINANCIAL STATEMENTSSteamships Trading Company Limited Year Ended 31 December 2016 (Amounts in Kina 000’s)
• IFRS 9, ‘Financial Instruments’ (effective 1 January 2018) replaces the guidance in IAS 39 with a standard that is less complex and principles based. The new standard simplifies the model for classifying and recognising financial instruments and aligns hedge accounting more closely with common risk management practices. Changes in own credit risk in respect of liabilities designated at fair value through profit or loss shall now be presented within OCI; this change can be adopted early without adopting IFRS 9. IFRS 9’s new impairment model is a move away from IAS 39’s incurred credit loss approach to an expected credit loss model. Earlier recognition of impairment losses is likely to result and for entities with significant lending activities, an overhaul of related systems and processes will be needed.
• IFRS 15 ‘Revenue from contracts with customers’ (effective 1 January 2018) is a converged standard from the IASB and FASB on revenue recognition and replaces IAS 11 and IAS 18. The new standard is based on the principle that revenue is recognised when control of a good or service transfers to a customer – so the notion of control replaces the existing notion of risks and rewards.
The entity will have to adopt a new 5-step process for the recognition of revenue:
- identify contracts with customers
- identify the separate performance obligations
- determine the transaction price of the contract
- allocate the transaction price to each of the separate performance obligations, and
- recognise the revenue as each performance obligation is satisfied.
• Amendments to IFRS 15 (effective 1 January 2018). These amendments comprise clarifications of the guidance on identifying performance obligations, accounting for licences of intellectual property and the principal versus agent assessment (gross versus net revenue presentation).
• IFRS 16, ‘Leases’ (effective 1 January 2019) replaces the guidance in IAS 17 and will have a significant impact on accounting by lessees. The previous distinction under IAS 17 between finance leases and operating leases for lessees has been removed. IFRS 16 now requires a lessee to recognise a lease liability representing future lease payments and a ‘right-of-use asset’ for
virtually all lease contracts. There is an optional exemption for certain short-term leases and leases of low-value assets. Under IFRS 16, a contract is, or contains, a lease if the contract conveys the right to control the use of an identified asset for a period of time in exchange for consideration.
• Amendments to IAS 40, ‘Investment property’ (effective 1 January 2018) relating to transfers of investment property. These amendments clarify that to transfer to, or from, investment properties there must be a change in use. To conclude if a property has changed use there should be an assessment of whether the property meets the definition. This change must be supported by evidence.
• Annual improvements 2014 – 2016 makes minor changes to IFRS 1, IFRS 12 and IAS 28.
• IFRIC 22, ‘Foreign currency transactions and advance consideration’ (effective 1 January 2018) addresses foreign currency transactions or parts of transactions where there is consideration that is denominated or priced in a foreign currency. The interpretation provides guidance for when a single payment/receipt is made as well as for situations where multiple payments/receipts are made.
The company has not yet assessed the impact arising from the release of these new pronouncements.
(a) Basis of preparation
The consolidated financial statements of the Group have been prepared in accordance with International Financial Reporting Standards (IFRS) and IFRIC interpretations. The consolidated financial statements have been prepared under the historical cost convention as modified by financial assets and liabilities at fair value through profit and loss.
The preparation of financial statements in conformity with IFRS requires the use of certain critical accounting estimates. It also requires management to exercise its judgement in the process of applying the Group’s accounting policies. The areas involving a higher degree of judgement or complexity, or areas where assumptions and estimates are significant to the consolidated financial statements are disclosed in note 1 (z).
(b) Foreign currency
The Company’s functional and presentation currency is the Papua New Guinea Kina. Transactions in foreign currencies have been

Steamships Annual Report 2016 23
NOTES TO THE FINANCIAL STATEMENTSSteamships Trading Company Limited Year Ended 31 December 2016 (Amounts in Kina 000’s)
translated into the functional currency at rates ruling at the date of the transaction. Amounts payable to and by the Group in foreign currencies have been translated to the functional currency at rates of exchange ruling at the year end. Gains and losses arising from movements in foreign exchange rates are recognised in the statement of comprehensive income when they arise.
(c) Principles of consolidation
(i) Subsidiaries
The consolidated financial statements incorporate the assets and liabilities of all subsidiaries of Steamships Trading Company Limited as at 31 December 2016 and the results of all subsidiaries for the year then ended. Steamships Trading Company Limited and its subsidiaries together are referred to as the Group or the consolidated entity.
Subsidiaries are all entities over which the Group has control, that is when the Group is exposed to, or has rights to, variable returns from its involvement with the entity and has the ability to affect those returns through its power over the entity.
Subsidiaries are fully consolidated from the date on which control is transferred to the Group. They are de-consolidated from the date that control ceases .
The acquisition method of accounting is used to account for business combinations by the Group (refer to note 1d).
Intercompany transactions, balances and unrealised gains on transactions between group companies are eliminated. Unrealised losses are also eliminated unless the transaction provides evidence of the impairment of the asset transferred. Accounting policies of subsidiaries have been changed where necessary to ensure consistency with the policies adopted by the Group.
Non-controlling interests in the results and equity of subsidiaries are shown separately in the consolidated statement of comprehensive income, statement of changes in equity and balance sheet respectively.
(ii) Associates
Associates are all entities over which the Group has significant influence but not control generally accompanying a shareholding of between 20% and 50% of the voting rights. Investments in associates are accounted for using the equity
method of accounting, after initially being recognised at cost. The Group’s investment in associates includes goodwill identified on acquisition (refer to note 12).
The Group’s share of its associates’ post-acquisition profits or losses is recognised in profit or loss, and its share of post-acquisition other comprehensive income is recognised in other comprehensive income. The cumulative post-acquisition movements are adjusted against the carrying amount of the investment. Dividends receivable from associates are recognised as a reduction in the carrying amount of the investment.
When the Group’s share of losses in an associate equals or exceeds its interest in the associate, including any other unsecured long-term receivables, the Group does not recognise further losses, unless it has incurred obligations or made payments on behalf of the associate.
Unrealised gains on transactions between the Group and its associates are eliminated to the extent of the Group’s interest in the associates. Unrealised losses are also eliminated unless the transaction provides evidence of an impairment of the asset transferred. Accounting policies of associates have been changed where necessary to ensure consistency with the policies adopted by the Group.
(iii) Joint ventures
Joint venture entities
The interest in a joint venture is accounted for using the equity method after initially being recognised at cost as for associates.
(iv) Changes in ownership interests
The Group treats transactions with non-controlling interests that do not result in a loss of control as transactions with equity owners of the Group. A change in ownership interest results in an adjustment between the carrying amounts of the controlling and non-controlling interests to reflect their relative interests in the subsidiary. Any difference between the amount of the adjustment to non-controlling interests and any consideration paid or received is recognised in a separate reserve within equity attributable to shareholders.
When the Group ceases to have control or significant influence, any retained interest in the entity is re-measured to its fair value with the change in carrying amount recognised in profit or loss. This fair value becomes the

24 Steamships Annual Report 2016
NOTES TO THE FINANCIAL STATEMENTSSteamships Trading Company Limited Year Ended 31 December 2016 (Amounts in Kina 000’s)
initial carrying amount for the purposes of subsequently accounting for the retained interest as an associate or financial asset. In addition, any amounts previously recognised in other comprehensive income in respect of that entity are accounted for as if the Group had directly disposed of the related assets or liabilities. This may mean that amounts previously recognised in other comprehensive income are reclassified to profit or loss.
If the ownership interest in a jointly-controlled entity or an associate is reduced but significant influence is retained, only a proportionate share of the amounts previously recognised in other comprehensive income are reclassified to profit or loss where appropriate
(d) Business combinations
The acquisition method of accounting is used to account for all business combinations, regardless of whether equity instruments or other assets are acquired. The consideration transferred for the acquisition of a subsidiary comprises the fair values of the assets transferred, the liabilities incurred and the equity interests issued by the Group. The consideration transferred also includes the fair value of any asset or liability resulting from a contingent consideration arrangement and the fair value of any pre-existing equity interest in the subsidiary. Acquisition-related costs are expensed as incurred. Identifiable assets acquired and liabilities and contingent liabilities assumed in a business combination are measured initially at their fair values at the acquisition date. On an acquisition-by-acquisition basis, the Group recognises any non-controlling interest in the acquiree either at fair value or at the non-controlling interest’s proportionate share of the acquiree’s net identifiable assets.
The excess of the consideration transferred, the amount of any non-controlling interest in the acquiree and the acquisition date fair value of any previous equity interest in the acquiree over the fair value of the Group’s share of the net identifiable assets acquired is recorded as goodwill. If those amounts are less than the fair value of the net identifiable assets of the subsidiary acquired and the measurement of all amounts has been reviewed, the difference is recognised directly in determining profit or loss as a bargain purchase.
Where settlement of any part of cash consideration is deferred, the amounts payable in the future are discounted to their present value as
at the date of exchange. The discount rate used is the entity’s incremental borrowing rate, being the rate at which a similar borrowing could be obtained from an independent financier under comparable terms and conditions.
Contingent consideration is classified either as equity or a financial liability. Amounts classified as a financial liability are subsequently re-measured to fair value with changes in fair value recognised in profit or loss
(e) Revenue recognition
The Group recognises revenue when the amount of revenue can be reliably measured, it is probable that future economic benefits will flow to the entity and specific criteria have been met for each of the Group’s activities as described below. The Group bases its estimates on historical results, taking into consideration the type of customer, the type of transaction and the specifics of each arrangement.
Revenue is recognised for the major business activities as follows:
Sale of goods - Revenue from the sale of goods is recognised when the entity sells a product to the customer and all significant risks and rewards have been transferred.
Services - Service revenue is recognised when the service has been rendered.
Freight - Freight revenue is recognised as the service has been provided.
Interest income - Interest income is recognised using the effective interest method.
Dividend income - Dividends are recognised when the right to receive payment is established.
Rental income - Rental income is recognised on a straight line basis over the term of the lease.
(f) Income tax
The income tax expense or benefit for the period is the tax payable on the current period’s taxable income based on the notional income tax rate adjusted by changes in deferred tax assets and liabilities attributable to temporary differences between the tax bases of assets and liabilities and their carrying amounts in the financial statements, and to unused tax losses.
Deferred income tax is provided in full on temporary differences arising between the tax bases of assets and liabilities and their carrying amounts in the financial statements. Currently enacted tax rates are used in the determination

Steamships Annual Report 2016 25
NOTES TO THE FINANCIAL STATEMENTSSteamships Trading Company Limited Year Ended 31 December 2016 (Amounts in Kina 000’s)
of deferred income tax. Deferred tax assets are recognised to the extent that it is probable that future taxable profit will be available, against which the temporary differences can be utilised.
(g) Cash and cash equivalents
For the purpose of the statement of cash flows, cash and cash equivalents includes cash on hand, deposits held at call with banks and Treasury Bills with a maturity less than 90 days. Bank overdrafts are shown in current liabilities in the statement of financial position.
(h) Receivables
Trade receivables are amounts due from customers for merchandise sold or services provided in the ordinary course of business. There are classified as current assets if collection is expected within one year. Receivables are recognised initially at fair value and subsequently measured at amortised cost using the effective interest method, less provision for impairment. A provision is established when there is objective evidence that the Group will not be able to collect all amounts due according to the original terms of receivables.
(i) Inventories
Inventories are valued at the lower of cost and net realisable value. In general, cost is determined on the weighted average basis and, where appropriate, includes a proportion of variable overhead expenditure. Net realisable value is the estimated selling price in the ordinary course of business, less applicable variable selling costs.
(j) Non-current assets held for resale
Non-current assets (or disposal groups) are classified as held for sale if their carrying amount will be recovered principally through a sale transaction rather than through continuing use and a sale is considered highly probable. They are measured at the lower of their carrying amount and fair value less costs to sell, except for assets such as deferred tax assets, assets arising from employee benefits, financial assets and contractual rights under insurance contracts, which are specifically exempt from this requirement.
An impairment loss is recognised for any initial or subsequent write down of the asset (or disposal group) to fair value less costs to sell. A gain is recognised for any subsequent increases in fair value less costs to sell of an asset (or disposal group), but not in excess of any cumulative
impairment loss previously recognised. A gain or loss not previously recognised by the date of the sale of the non-current asset (or disposal group) is recognised at the date of derecognition.
Non-current assets (including those that are part of a disposal group) are not depreciated or amortised while they are classified as held for sale. Interest and other expenses attributable to the liabilities of a disposal group classified as held for sale continue to be recognised.
Non-current assets classified as held for sale and the assets of a disposal group classified as held for sale are presented separately from the other assets in the balance sheet. The liabilities of a disposal group classified as held for sale are presented separately from other liabilities in the balance sheet .
A discontinued operation is a component of the entity that has been disposed of or is classified as held for sale and that represents a separate major line of business or geographical area of operations, is part of a single coordinated plan to dispose of such a line of business or area of operations, or is a subsidiary acquired exclusively with a view to resale. The results of discontinued operations are presented separately in the income statement .
(k) Financial assets
Classification
The Group classifies its financial assets in the following categories: at fair value through profit or loss and loans and receivables. The Group does not hold any held to maturity investments or available for sale financial assets. The classification depends on the purpose for which the financial assets were acquired. Management determines the classification of its financial assets at initial recognition.
(i) Financialassetsatfairvaluethroughprofitorloss
Financial assets at fair value through profit or loss are financial assets held for trading. A financial asset is classified in this category if acquired principally for the purpose of selling in the short term. Derivatives are also categorised as held for trading unless they are designated as hedges. Assets in this category are classified as current assets .
(ii) Loans and receivables
Loans and receivables are non-derivative financial assets with fixed or determinable payments that are not quoted in an active market.

26 Steamships Annual Report 2016
NOTES TO THE FINANCIAL STATEMENTSSteamships Trading Company Limited Year Ended 31 December 2016 (Amounts in Kina 000’s)
They are included in current assets, except for maturities greater than 12 months after the balance sheet date. These are classified as non-current assets. The Group’s loans and receivables comprise ‘trade and other receivables’ and ‘cash and cash equivalents’ in the balance sheet.
Recognition and measurement
Regular purchases and sales of financial assets are recognised on the trade date – the date on which the Group commits to purchase or sell the asset .
Financial assets carried at fair value through profit or loss are initially recognised at fair value, and transaction costs are expensed in the income statement . Financial assets are derecognised when the rights to receive cash flows from the investments have expired or have been transferred and the Group has transferred substantially all risks and rewards of ownership. Loans and receivables are carried at amortised cost using the effective interest method.
Gains or losses arising from changes in the fair value of the ‘financial assets at fair value through profit or loss’ category are presented in the income statement within ‘other (losses)/gains – net’ in the period in which they arise. Dividend income from financial assets at fair value through profit or loss is recognised in the income statement as part of other income when the Group’s right to receive payments is established.
The Group assesses at each balance sheet date whether there is objective evidence that a financial asset or a group of financial assets is impaired. Impairment testing of trade receivables is described in note 1(h).
(l) Property, plant and equipment
All property, plant and equipment are initially recorded at cost. Borrowing costs directly attributable to the acquisition or construction of qualifying assets are added to the cost of those assets until the assets are ready for their intended use. Depreciation is calculated on the straight-line method to write off the cost of each asset to their residual values using the below rates which is reflective of their estimated useful life as follows:
Land and buildings 0 - 10% Ships 5 - 10% Plant and fittings 10 - 33% Motor vehicles 20 - 33%
Where the carrying amount of an asset is greater than its estimated recoverable amount, it is written down immediately to its recoverable
amount. Gains and losses on disposal of property, plant and equipment are determined by reference to their carrying amount and are taken into account in determining operating profit.
Subsequent costs are included in the asset’s carrying amount or recognised as a separate asset, as appropriate, only when it is probable that future economic benefits associated with the item will flow to the Group and the cost of the item can be measured reliably. All other repairs and maintenance are charged to the statements of comprehensive income during the financial period in which they are incurred.
(m) Investment properties
Investment properties include land held for long-term capital appreciation and buildings leased out under operating leases. Properties that comprise a portion held to earn rentals and a portion for own use or occupation will only be classified as investment property if an insignificant portion is held for own use of occupation. Investment properties are recognised when it is probable that future economic benefits associated with the property will flow to the Group and the cost of the investment property can be reliably measured. Investment properties are stated at cost less accumulated depreciation and accumulated impairment losses. Transaction costs are included on initial measurement. Borrowing costs directly attributable to the acquisition or construction of qualifying assets are added to the cost of those assets until the assets are ready for their intended use. The fair values of investment properties are disclosed in the Note 11. These are assessed using internationally accepted valuation methods, such as taking comparable properties as a guide to current market prices or by applying the discounted cash flow method. Like property, plant and equipment, investment properties are normally depreciated using the straight-line method over similar useful lives.
(n) Goodwill
Goodwill represents the excess of the cost of an acquisition over the fair value of the Group’s share of the net identifiable assets of the acquired business at the date of acquisition.
Goodwill is capitalised and assessed for impairment annually or more frequently if events or changes in circumstances indicate a potential for impairment and is carried at cost less impairment losses. Any impairment is recognised immediately as an expense and is not subsequently reversed.

Steamships Annual Report 2016 27
NOTES TO THE FINANCIAL STATEMENTSSteamships Trading Company Limited Year Ended 31 December 2016 (Amounts in Kina 000’s)
Gains and losses on the disposal of an entity include the carrying amount of goodwill relating to the entity sold. Goodwill is allocated to cash-generating units for the purpose of impairment testing.
(o) Trade and other payables
These amounts represent obligations to pay for goods and services that have been acquired in the ordinary course of business from suppliers. They are classified as current liabilities if payment is due within one year or less. Trade payables are recognised initially at fair value and subsequently measured at amortised cost using the effective interest method. The amounts are unsecured and are usually paid within 30 days of recognition.
(p) Provisions
Provisions are recognised when the Group has a present legal or constructive obligation as a result of past events; it is probable that an outflow of resource embodying economic benefits will be required to settle the obligation; and a reliable estimate of the amount of the obligation can be made.
A liability for annual leave is recognised and measured at the amount of unpaid leave at amounts expected to be paid to settle the present entitlements. A liability for long service leave is recognised taking into consideration expected future wage and salary levels, experience of employee departures and periods of service, discounted to present values.
A provision for estimated ship dry docking costs is only recognised where the Group has a contractual obligation under a Bare Boat charter agreement from a third party. Dry docking costs relating to ships not under third party long term charter agreements are only recognised as incurred, and are capitalised to the extent that the previously assessed economic benefits associated with the asset are restored.
(q) Employee benefits
(i) Short term obligations
Liabilities for wages and salaries, including non-monetary benefits, annual leave and accumulating sick leave expected to be settled within 12 months after the end of the period in which the employees render the related service are recognised in respect of employees’ services up to the end of the reporting period and are measured at the amounts expected to be paid when the liabilities are settled. The liability for annual leave and accumulating sick leave is recognised in the provision for employee
benefits. All other short term employee benefit obligations are presented as payables.
(ii) Otherlong-termemployeebenefitobligations
The liability for long service leave and annual leave which is not expected to be settled within 12 months after the end of period in which the employees render the related service is recognised in the provision for the employee benefits and measured as the present value of expected future payments to be made in respect of services provided by employees up to the end of the reporting period using the projected unit credit method. Consideration is given to expected future wage and salary levels, experience of employee departments and periods of service. Expected future payments are discounted using the market yields at the end of the reporting period on national government bonds with terms to maturity and currency that match, as closely as possible, the estimated future cash outflows.
(iii)Terminationbenefits
Termination benefits are payable when employment is terminated by the Group before the normal retirement date, or whenever an employee accepts voluntary redundancy in exchange for these benefits. The Group recognises termination benefits at the earlier of the following dates: (a) when the Group can no longer withdraw the offer of those benefits; and (b) when the entity recognises costs for a restructuring that is within the scope of IAS 37 and involves the payment of termination benefits. In the case of an offer made to encourage voluntary redundancy, the termination benefits are measured based on the number of employees expected to accept the offer. Benefits falling due more than 12 months after the end of the reporting period are discounted to their present value.
(r) Borrowings
Borrowings are recognised initially at fair value, net of any transaction costs incurred, and are subsequently measured at amortised cost using the effective interest method. Borrowings are classified as current liabilities unless the Group has an unconditional right to defer settlement of the liability for at least 12 months after the end of the reporting period.
(s) Impairment of assets
Assets that have an indefinite useful life are not subject to amortisation and are tested annually for impairment. Assets that are subject to depreciation or amortisation are reviewed for impairment whenever events or changes in

28 Steamships Annual Report 2016
NOTES TO THE FINANCIAL STATEMENTSSteamships Trading Company Limited Year Ended 31 December 2016 (Amounts in Kina 000’s)
circumstances indicate that the carrying amount may not be recoverable. An impairment loss is recognised for the amount by which the asset’s carrying value exceeds its fair value less costs to sell. For the purpose of assessing impairment, assets are grouped at the lowest levels for which there are separately identifiable cash flows (cash generating units).
(t) Borrowing costs
Borrowing costs incurred for the construction of qualifying assets, which are assets that take a substantial period of time to get ready for their intended use or sale, are capitalised during the period of time that is required to complete and prepare the asset for its intended use or sale. Other borrowing costs are expensed.
The capitalisation rate used to determine the amount of borrowing costs to be capitalised is the weighted average interest rate applicable to the entity’s outstanding borrowings during the year, in this case 4.5% (2015 – 5.7%).
(u) Segment reporting
Operating segments are reported in a manner consistent with the internal reporting provided to the chief operating decision maker. The chief operating decision maker, who is responsible for allocating resources and assessing performance of the operating segments, has been identified as the Strategic Steering Committee.
(v) Earnings per share
Basic earnings per share is calculated by dividing the profit attributable to equity holders of the Group, by the weighted average number of ordinary shares outstanding during the financial year. There are no potential ordinary shares on issue and hence the diluted earnings per share is equal to the basic earnings per share.
(w) Goods and services tax (GST)
Revenues, expenses and assets are recognised net of the amount of associated GST. Receivables and payables are stated inclusive of GST. The amount of GST recoverable from, or payable to, the Taxation authority is included with other receivables or payables in the balance sheet.
(x) Leases
Leases under which the Group assumes substantially all the risks and rewards incidental to ownership have been classified as finance leases and are capitalised. The asset and corresponding liability are recorded at inception of the lease at the fair value of the leased asset,
at amounts equivalent to the discounted present value of minimum lease payments including residual values.
The finance cost is charged to the profit or loss over the lease period so as to produce a constant periodic rate of interest on the remaining balance of the liability for each period.
Capitalised leased assets are depreciated over their expected lives in accordance with rates established for other similar assets.
Operating lease payments are representative of the pattern of benefits derived from the leased assets and accordingly are charged to the profit and loss account in the periods in which they are incurred.
(y) Rounding of amounts
Amounts in the financial statements have been rounded off to the nearest thousand Kina.
(z) Critical accounting estimates and judgments
Estimates and judgments are continually evaluated and are based on historical experience and other factors, including expectations of future events that may have a financial impact on the entity and that are believed to be reasonable under the circumstances.
The Group makes estimates and assumptions concerning the future. The resulting accounting estimates will, by definition, seldom equal the related actual results. The estimates and assumptions that have a significant risk of causing a material adjustment to the carrying amounts of assets and liabilities within the next financial year are discussed below:
(i) Estimated impairment of goodwill
The Group tests annually whether goodwill has suffered any impairment. The recoverable amounts of cash-generating units have been determined based on value-in-use calculations.
(ii) Estimated impairment of ships and other plant and equipment
The Group tests periodically the recoverable amount of ships and other plant and equipment. Recoverable amounts have been determined using the higher of fair value less cost to sell and its value in use. Fair value has been determined using market based information while value in use has been determined using a post-tax discount rate of 12.5%.

Steamships Annual Report 2016 29
NOTES TO THE FINANCIAL STATEMENTSSteamships Trading Company Limited Year Ended 31 December 2016 (Amounts in Kina 000’s)
2. Financial risk management The Group’s activities expose it to a variety of
financial risks including market risk (including currency, and interest rate risk), credit risk, liquidity risk and capital risk. The Group’s overall risk management program focuses on the unpredictability of financial markets and seeks to minimise potential adverse effects on the financial performance of the Group. Risk management is carried out under policies approved by the Board of Directors.
(a) Market risk
(i) Foreign exchange risk
The Group engages in international purchase transactions and is exposed to foreign exchange risk arising from various currency exposures, primarily with respect to the Australian dollar. Foreign exchange risk arises from recognised assets and liabilities.
The Group’s foreign currency purchases do not represent a significant proportion of the Group’s costs and as such exposure to foreign currency risk is minimal. It is not the Group’s policy to hedge foreign currency risk. As the foreign currency exposure is minimal no sensitivity analysis is provided.
(ii) Price risk
The Group is not significantly exposed to equity securities or commodities price risk.
(iii)Cashflowinterestraterisk
The Group’s interest rate risk arises from long-term borrowings. Borrowings issued at variable rates expose the Group to cash flow and fair value interest rate risk. Borrowings issued at fixed rates expose the Group to fair value interest rate risk. Long term borrowings are a mix of fixed and variable rate interest. It is not the Group’s policy to hedge cash flow and interest rate risk.
At 31 December 2016, if interest rates on PNG Kina-denominated borrowings had been 1% higher/lower with all other variables held constant, post-tax profit for the year would have been K3,044,000 (2015: K4,089,000) lower/higher, mainly as a result of higher/lower interest expense on floating rate borrowings.
(b) Credit risk
The Group has no significant concentration of credit risk and it is not the Group’s policy to hedge credit risk. The Group has policies in place to ensure that sales of products and services are made to customers with an appropriate credit history and has policies that limit the amount of credit exposure to any one customer. Where credit limits were exceeded during the reporting period management has made provision for amounts considered uncollectible.
(c) Liquidity risk
Prudent liquidity risk management implies maintaining sufficient cash and the availability of funding through an adequate amount of committed credit facilities. The Group manages liquidity risk by maintaining sufficient bank balances to fund its operations and the availability of funding through committed credit facilities .
Management monitors rolling forecasts of the Group’s liquidity reserve on the basis of expected cash flows.
Undrawn finance facilities as of 31 December were as follows:
2016 2015 K’000 K’000
Undrawn Facilities 126,000 83,000

30 Steamships Annual Report 2016
NOTES TO THE FINANCIAL STATEMENTSSteamships Trading Company Limited Year Ended 31 December 2016 (Amounts in Kina 000’s)
Less than Between 1 Between 2 Over 5 1 year & 2 years & 5 years years Total K’000 K’000 K’000 K’000 K’000
At 31 December 2016
Borrowings (6,786) - (428,000) - (434,786)
Borrowings from minority shareholders (32,259) - - - (32,259)
Borrowings from related parties (35,452) - - - (35,452)
Trade and other payables (98,639) - - - (98,639)
(173,136) - (428,000) (601,136)
At 31 December 2015
Borrowings (390,836) (84,208) (120,000) - (595,044)
Borrowings from minority shareholders (22,933) - - - (22,933)
Borrowings from related parties (26,690) - - - (26,690)
Trade and other payables (89,456) - - - (89,456)
Income tax payable (1,407) - - - (1,407)
(531,322) (84,208) (120,000) - (735,530)
The Group does not hold derivative financial instruments.
All loan covenants associated with borrowing arrangements have been met.
The table below analyses the Group’s financial liabilities which will be settled on a net basis into relevant maturity groupings based on the remaining period at the balance sheet date to the contractual maturity date. The amounts disclosed in the table are the contractual undiscounted cash flows.

Steamships Annual Report 2016 31
NOTES TO THE FINANCIAL STATEMENTSSteamships Trading Company Limited Year Ended 31 December 2016 (Amounts in Kina 000’s)
(d) Capital risk management
The Group’s objectives when managing capital are to safeguard the Group’s ability to continue as a going concern in order to provide returns to shareholders and benefits for other stakeholders and to maintain an optimal capital structure to reduce the cost of capital.
In order to maintain or adjust the capital structure, the Group may adjust the amount of dividends paid to shareholders, return capital to shareholders, issue new shares or sell assets to reduce debt.
The Group monitors capital on the basis of the gearing ratio. This ratio is calculated as net debt divided by total capital. Net debt is calculated as external borrowings and unsecured loans less cash and cash equivalents. Total capital is calculated as capital and reserves attributable to the Company’s shareholders plus net debt.
The gearing ratios at each balance date were as follows:
2016 2015 K’000 K’000
Total external borrowing & unsecured loans 502,497 644,667 Less: Cash & Cash equivalents 36,685 11,538 Net debt 465,812 633,129 Total equity 881,837 836,602 Total capital 1,347,649 1,469,731 Gearing ratio 35% 43%
(e) Fair value estimation
IFRS 7 ”Financial Instruments: Disclosures” requires disclosure of fair value measurements by level of the following fair value measurement hierarchy:
Quoted prices (unadjusted) in active markets for identical assets or liabilities (level 1).
Inputs other than quoted prices included within level 1 that are observable for the asset or liability, either directly (that is, as prices) or indirectly (that is, derived from prices) (level 2).
Inputs for the asset or liability that are not based on observable market data (that is, unobservable inputs) (level 3).
If one or more of the significant inputs is not based on observable market data, the instrument is included in level 3.
The Group does not hold any financial assets at fair value.
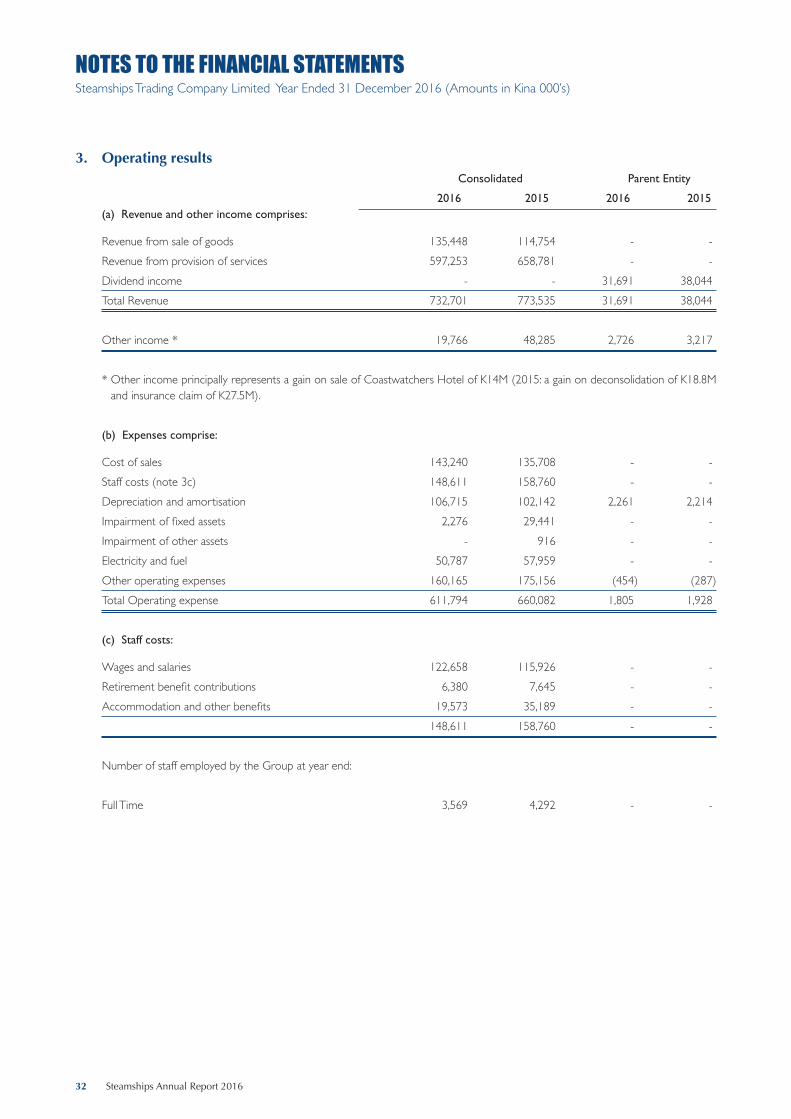
32 Steamships Annual Report 2016
NOTES TO THE FINANCIAL STATEMENTSSteamships Trading Company Limited Year Ended 31 December 2016 (Amounts in Kina 000’s)
3. Operating results Consolidated Parent Entity
2016 2015 2016 2015 (a) Revenue and other income comprises:
Revenue from sale of goods 135,448 114,754 - - Revenue from provision of services 597,253 658,781 - - Dividend income - - 31,691 38,044 Total Revenue 732,701 773,535 31,691 38,044
Other income * 19,766 48,285 2,726 3,217
* Other income principally represents a gain on sale of Coastwatchers Hotel of K14M (2015: a gain on deconsolidation of K18.8M and insurance claim of K27.5M).
(b) Expenses comprise:
Cost of sales 143,240 135,708 - - Staff costs (note 3c) 148,611 158,760 - - Depreciation and amortisation 106,715 102,142 2,261 2,214 Impairment of fixed assets 2,276 29,441 - - Impairment of other assets - 916 - - Electricity and fuel 50,787 57,959 - - Other operating expenses 160,165 175,156 (454) (287) Total Operating expense 611,794 660,082 1,805 1,928
(c) Staff costs:
Wages and salaries 122,658 115,926 - - Retirement benefit contributions 6,380 7,645 - - Accommodation and other benefits 19,573 35,189 - - 148,611 158,760 - -
Number of staff employed by the Group at year end: Full Time 3,569 4,292 - -

Steamships Annual Report 2016 33
NOTES TO THE FINANCIAL STATEMENTSSteamships Trading Company Limited Year Ended 31 December 2016 (Amounts in Kina 000’s)
3. Operating results (continued) Consolidated Parent Entity
2016 2015 2016 2015 (d) The operating profit before income tax is arrived at after charging and crediting the following specific items:
After charging: Audit fees 995 995 10 10 Fees for non-audit services to Auditors 814 675 - - Bad and doubtful debts 1,645 1,099 - - Donations 1,278 1,618 - - Impairment of fixed assets 2,276 29,441 - - Impairment of other assets - 916 - - After crediting: Gain on deconsolidation - 18,867 - - Gain on sale of property, plant and equipment 19,766 1,595 - - Net foreign exchange transaction gains 530 38 - - Insurance receivable - 27,500 - -
(e) Cost of financing – net:
Expense* 34,235 39,648 - - Income (12,248) (13,952) (72) (72) Net finance costs 21,987 25,696 (72) (72)
*The interest expense excludes capitalised interest of K1.7M.
(f) Earnings per share
Basic earnings per share are calculated by dividing the net profit attributable to shareholders by the average number of ordinary shares on issue during the year. There is no difference between the basic and diluted earnings per share.
Net profit attributable to shareholders 84,210 98,979 Average number of ordinary shares on issue (thousands) 31,008 31,008 Basic earnings per share (continuing operations) 272t 319t

34 Steamships Annual Report 2016
NOTES TO THE FINANCIAL STATEMENTSSteamships Trading Company Limited Year Ended 31 December 2016 (Amounts in Kina 000’s)
4. Investments in subsidiaries, associates and joint ventures Consolidated Parent Entity
2016 2015 2016 2015 (a) Investments are accounted for in accordance with the policy set out in Note 1(c) and relate to:
Investments in subsidiary companies (note 20) - - 171,537 171,537 Investments in associates (note 21) 35,813 20,607 - - Investments in joint ventures (note 22) 30,632 15,851 36,626 23,823 66,445 36,458 208,163 195,360 (b) Share of after tax profit in associates and joint ventures
Share of profit in associates 3,886 3,039 - - Share of profit in joint ventures 1,979 23 - - 5,865 3,062 - -
5. Income Tax Consolidated Parent Entity
2016 2015 2016 2015 (a) Income tax expense Current tax 37,887 39,783 864 - Deferred tax (2,210) (2,073) (63) 519 35,677 37,710 801 519
(b) The income tax in the Statement of Comprehensive Income is determined in accordance with the policy set out in note 1(f). The effective rate of tax charged differs from the statutory rate of 30% for the following reasons.
Prima facie tax on profit before income tax 37,365 41,731 9,805 11,822 Tax effect of rebateable dividends - - (9,507) (11,413) Expenses not deductible for tax 1,696 6,967 28 110 Deductible expenses not recognised for accounting purposes (2,432) (1,737) - - Income not assessable for tax (2,514) (8,665) - - Prior year (over)/under provisions 1,562 (586) 475 - 35,677 37,710 801 519 (c) The deferred tax (liability)/ asset comprises: Provisions 9,987 10,108 - - Tax losses 32,799 26,729 - - Prepayments & consumables (16,837) (8,891) - - Property, plant and equipment (20,251) (24,458) 245 182 5,698 3,488 245 182 Comprising of Deferred tax asset 36,680 36,914 245 182 Deferred tax liability (30,982) (33,426) - - 5,698 3,488 245 182
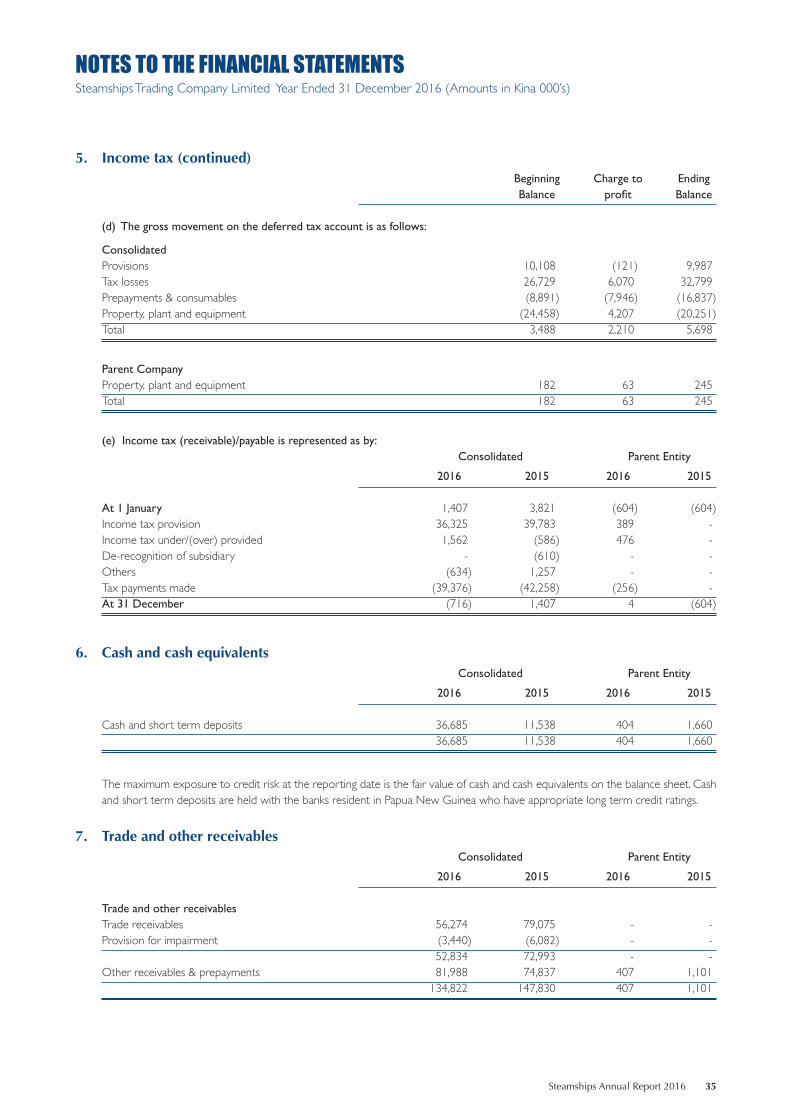
Steamships Annual Report 2016 35
NOTES TO THE FINANCIAL STATEMENTSSteamships Trading Company Limited Year Ended 31 December 2016 (Amounts in Kina 000’s)
5. Income tax (continued) Beginning Charge to Ending Balance profit Balance (d) The gross movement on the deferred tax account is as follows:
Consolidated Provisions 10,108 (121) 9,987 Tax losses 26,729 6,070 32,799 Prepayments & consumables (8,891) (7,946) (16,837) Property, plant and equipment (24,458) 4,207 (20,251) Total 3,488 2,210 5,698 Parent Company Property, plant and equipment 182 63 245 Total 182 63 245
(e) Income tax (receivable)/payable is represented as by: Consolidated Parent Entity
2016 2015 2016 2015 At 1 January 1,407 3,821 (604) (604) Income tax provision 36,325 39,783 389 - Income tax under/(over) provided 1,562 (586) 476 - De-recognition of subsidiary - (610) - - Others (634) 1,257 - - Tax payments made (39,376) (42,258) (256) - At 31 December (716) 1,407 4 (604)
6. Cash and cash equivalents Consolidated Parent Entity
2016 2015 2016 2015 Cash and short term deposits 36,685 11,538 404 1,660 36,685 11,538 404 1,660
The maximum exposure to credit risk at the reporting date is the fair value of cash and cash equivalents on the balance sheet. Cash
and short term deposits are held with the banks resident in Papua New Guinea who have appropriate long term credit ratings.
7. Trade and other receivables Consolidated Parent Entity
2016 2015 2016 2015 Trade and other receivables Trade receivables 56,274 79,075 - - Provision for impairment (3,440) (6,082) - - 52,834 72,993 - - Other receivables & prepayments 81,988 74,837 407 1,101 134,822 147,830 407 1,101

36 Steamships Annual Report 2016
NOTES TO THE FINANCIAL STATEMENTSSteamships Trading Company Limited Year Ended 31 December 2016 (Amounts in Kina 000’s)
7. Trade and other receivables (continued) Consolidated Parent Entity
2016 2015 2016 2015 (i) Impaired trade receivables
As at 31 December 2016, trade receivables of K3.4M (2015: K6.1M) relating to trade debtors were considered impaired and were provided for by management. The ageing of these receivables is as follows:
3 to 6 months 762 777 - - Over 6 months 2,678 5,305 - - 3,440 6,082 - -
Movement in the provision for impairment of trade receivables is as follows:
Opening balance 6,082 5,305 - - Impairments recognised during the year 1,645 1,099 - - Provision released (4,287) (322) - - Total 3,440 6,082 - - The creation and release of the provision for impaired receivables is included in operating expenses in the statement of
comprehensive income. Amounts charged to the provision account are generally written off when there is no expectation of recovering the balance outstanding.
(ii) Past due but not impaired
As at 31 December 2016, trade receivables of K4.9M (2015: K3.1M) were past due but not impaired. These relate to a number of independent customers for whom there is no recent history of default. The ageing analysis of these trade receivables is as follows:
3 to 6 months 928 586 - - Over 6 months 3,924 2,481 - - 4,852 3,067 - -
The other classes within trade and other receivables do not contain impaired assets and are not past due. The maximum exposure to credit risk at the reporting date is the fair value of each class of receivable mentioned above. The Group does not hold any collateral as security in relation to these receivables.
(iii) Other receivables and prepayments
Other receivables generally arise from transactions outside the usual operating activities of the Group. Interest may be charged at commercial rates where the terms of repayment exceed three months. Collateral is not normally obtained.
Prepayments relate to advance payments for expenses not yet incurred.

Steamships Annual Report 2016 37
NOTES TO THE FINANCIAL STATEMENTSSteamships Trading Company Limited Year Ended 31 December 2016 (Amounts in Kina 000’s)
8. Inventories Consolidated Parent Entity
2016 2015 2016 2015
Raw materials 10,024 3,650 - - Work in progress - 25 - - Finished goods 33,326 40,659 - - Provision for obsolescence (2,222) (3,326) - - 41,128 41,008 - -
Inventories recognised as an expense during the year ended 31 December 2016 and included in cost of sales and cost of providing services amounted to K90.6M (2015: K80.3M). The provision for obsolescence of inventories during the year decreased by K1.1M (2015: by K0.3M increase).
9. Loans to/(from) related companies Consolidated Parent Entity
2016 2015 2016 2015 Current
Harbourside Development Limited - 159,755 - -
Non-Current Colgate Palmolive (PNG) Limited 500 500 500 500 Wonye Limited 275 - - - Morobe Terminal Limited 60 - - - Labu Holdings Limited 100 - - - Pacific Rumana Limited 36,800 39,849 - - Harbourside Development Limited 33,115 - - - 70, 850 40,349 500 500 Loans to subsidiaries - - 5,212 5,212 70,850 40,349 5,712 5,712 Loans from associates and joint ventures: Harbourside Development Limited (1,111) - - - Morobe Terminal Limited (3,150) - - - Consort Express Lines Limited’s associates (31,191) (26,690) - - (35,452) (26,690) - - Loans from subsidiaries - - (200,404) (182,592) (35,452) (26,690) (200,404) (182,592)
During 2016, the Harbourside Development Limited loan was partially refinanced with a syndicate of commercial banks to finance Harbourside Development Limited directly. The remaining loan to Harbourside Development Limited is secured and earns interest at 6.5%. The loan to Pacific Rumana Limited is unsecured and earns interest at 9%. The loan from Consort Express Lines Limited’s associates are unsecured and incur interest at 4%.

38 Steamships Annual Report 2016
NOTES TO THE FINANCIAL STATEMENTSSteamships Trading Company Limited Year Ended 31 December 2016 (Amounts in Kina 000’s)
10. Property, plant & equipment Plant and Property Ships Vehicles Total
Consolidated 2016
Cost 513,002 325,149 435,279 1,273,430 Accumulated depreciation (including impairment losses) (142,612) (160,762) (287,140) (590,513) Net book value 370,391 164,387 148,139 682,917 Opening value 393,606 169,319 168,671 731,596 Additions 24,734 26,118 44,477 95,329 Disposals - (4,004) (12,639) (16,643) Depreciation (7,775) (27,046) (50,094) (84,916) Impairment of fixed assets - - (2,276) (2,276) Transfers to investment properties (40,174) - - (40,174) Closing value 370,391 164,387 148,139 682,917 2015
Cost 479,944 342,327 481,423 1,303,694 Accumulated depreciation (including impairment losses) (86,338) (173,008) (312,752) (572,098) Net book value 393,606 169,319 168,671 731,596 Opening value 355,626 187,229 171,774 714,630 Additions 36,510 13,338 49,925 99,773 Disposals - (6,003) (2,777) (8,780) Depreciation (19,369) (25,245) (49,641) (94,255) Impairment of fixed assets 580 - (611) (31) Transfers from investment properties 20,259 - - 20,259 Closing value 393,606 169,319 168,671 731,596 Parent Entity 2016
Cost 73,210 - 5,994 79,204 Accumulated depreciation (48,660) - (4,610) (53,270) Net book value 24,550 - 1,384 25,934 Opening value 24,549 - 1,611 26,160 Additions 3 - 308 311 Transfers 1,724 - - 1,724 Depreciation (1,726) - (535) (2,261) Closing value 24,550 - 1,384 25,934

Steamships Annual Report 2016 39
NOTES TO THE FINANCIAL STATEMENTSSteamships Trading Company Limited Year Ended 31 December 2016 (Amounts in Kina 000’s)
10. Property, plant & equipment (continued) Plant and Property Ships Vehicles Total
Parent Entity 2015
Cost 73,206 - 5,686 78,892 Accumulated depreciation (48,657) - (4,075) (52,732) Net book value 24,549 - 1,611 26,160 Opening value 25,370 - 1,450 26,820 Additions 997 - 695 1,692 Transfers (147) - 9 (138) Depreciation (1,671) - (543) (2,214) Closing value 24,549 - 1,611 26,160
(a) Assets in the course of construction
The carrying amounts of the assets disclosed above include the following expenditure recognised in relation to property, plant and equipment and investment properties which are in the course of construction:
Consolidated Parent Entity
2016 2015 2016 2015 Property (classified as investment properties in note 11) 45,502 52,733 - - Ships 1,239 6,649 - - Plant and vehicles 16,300 20,068 - - Total assets in the course of construction 63,041 79,450 - -
The cost of additions in 2016 includes capitalised borrowing costs of K1.7M (2015: K1.5M) in relation to qualifying assets.
(b) Impairment losses
During the year the Directors performed an impairment review on all key assets of the Group. As a result of this assessment an impairment charge of K2.3M (2015: K24.9M) was recorded on plant and vehicles.
There are no other further conditions that indicate impairment of property, plant and equipment as at 31 December 2016.
.

40 Steamships Annual Report 2016
NOTES TO THE FINANCIAL STATEMENTSSteamships Trading Company Limited Year Ended 31 December 2016 (Amounts in Kina 000’s)
11. Investment properties Investment properties represent the Group’s residential and commercial properties that are available for external lease rather than
internal use. Properties used by the Group are shown in ‘Property’ within note 10. Consolidated Parent Entity
2016 2015 2016 2015
Cost 521,381 469,342 - - Accumulated depreciation (135,407) (127,983) - - Net book value 385,974 341,359 - - Opening value 341,359 400,493 - - Additions 27,693 9,889 - - De-recognition of subsidiary - (5,738) - - Disposals (1,453) (5,728) - - Transfers from/(to) property, plant & equipment 40,174 (20,259) - - Impairment - (29,410) Depreciation (21,799) (7,888) - - Closing value 385,974 341,359 - -
(a) Amounts recognised in profit/loss for investment properties Consolidated Parent Entity
2016 2015 2016 2015 Rental income 130,562 125,104 - - Repairs and maintenance attributable to rental properties under non-cancellable leases (4,654) (3,791) - - Operating expenses directly attributable to rental properties under non-cancellable leases (11,483) (13,141) - -
(b) Valuation basis
Properties include commercial and residential properties occupied by Group businesses together with commercial and residential investment properties which are available for external lease. An analysis of the carrying amount and estimated range of fair values for each category of property is shown below. Fair values have been estimated internally, based on market evidence of property values, supported by independent professional valuations as at December 2016 for a selected sample of representative properties and discounted value in use assessments for hotel properties.
Included in properties are the following: NBV Valuation Lower Range Higher
Investment properties 385,974 818,201 1,023,127 Other properties (note 10) 370,931 786,252 983,177 Total 756,905 1,604,453 2,006,304
The independent valuer utilised certain historical facts and relevant market data available up to the date of valuation in reaching their opinion as to the valuation of the properties, including use of comparable sales and capitalisation rates.
(c) Non-current assets pledged as security
Refer to note 15 for information on non-current assets pledged as security by the Group. (d) Contractual receivables
Minimum lease receivables under non-cancellable operating leases of investment properties not recognised in the financial statements are receivable as follows:
Consolidated Parent Entity
2016 2015 2016 2015 Within one year 143,899 142,686 - - Later than one year but not later than five years 143,171 144,072 - - Later than five years 168,589 183,876 - - 455,659 470,634 - -

Steamships Annual Report 2016 41
NOTES TO THE FINANCIAL STATEMENTSSteamships Trading Company Limited Year Ended 31 December 2016 (Amounts in Kina 000’s)
12. Intangible assets Consolidated Parent Entity
2016 2015 2016 2015
Goodwill 80,491 80,491 - -
Goodwill is allocated to the Group’s cash-generating units (CGUs) identified according to operating segment. The goodwill balance of K80.5M (2015: K80.5M) is attributable to various business acquisitions in the logistics and commercial segments including Consort (K.5M), Laga Industries (K3.6M), Pacific Towing (K67.4M) and New Britain Shipping (K9M). The recoverable amount of a CGU is determined based on value-in-use calculations. These calculations use pre-tax cash flow projections based on financial budgets approved by management covering a three year period. Growth beyond year three for the purpose of the impairment testing is set at 5%-8%. A post-tax discount rate of 12.5% per annum has been used and reflects specific risks relating to the operating segment.
13. Trade and other payables Consolidated Parent Entity
2016 2015 2016 2015
Trade Payables 44,980 48,737 - - Accruals 53,447 38,418 - - Other payables 212 2,301 680 - 98,639 89,456 680 -
All trade and other payables are due and payable within 12 months and are recorded at their carrying value. 14. Provisions for other liabilities and charges
Employee Dry 2016 2015 Dock Total Total
Opening value 17,893 3,847 21,740 24,247 Charged to profit & loss 10,464 3,250 13,714 10,609 Utilised during year (10,351) (2,350) (12,701) (13,116) Closing value 18,006 4,747 22,753 21,740 Current 6,763 4,747 11,510 9,970 Non-current 11,243 - 11,243 11,770 18,006 4,747 22,753 21,740
A description of employee and dry dock provisions is disclosed in note 1p.
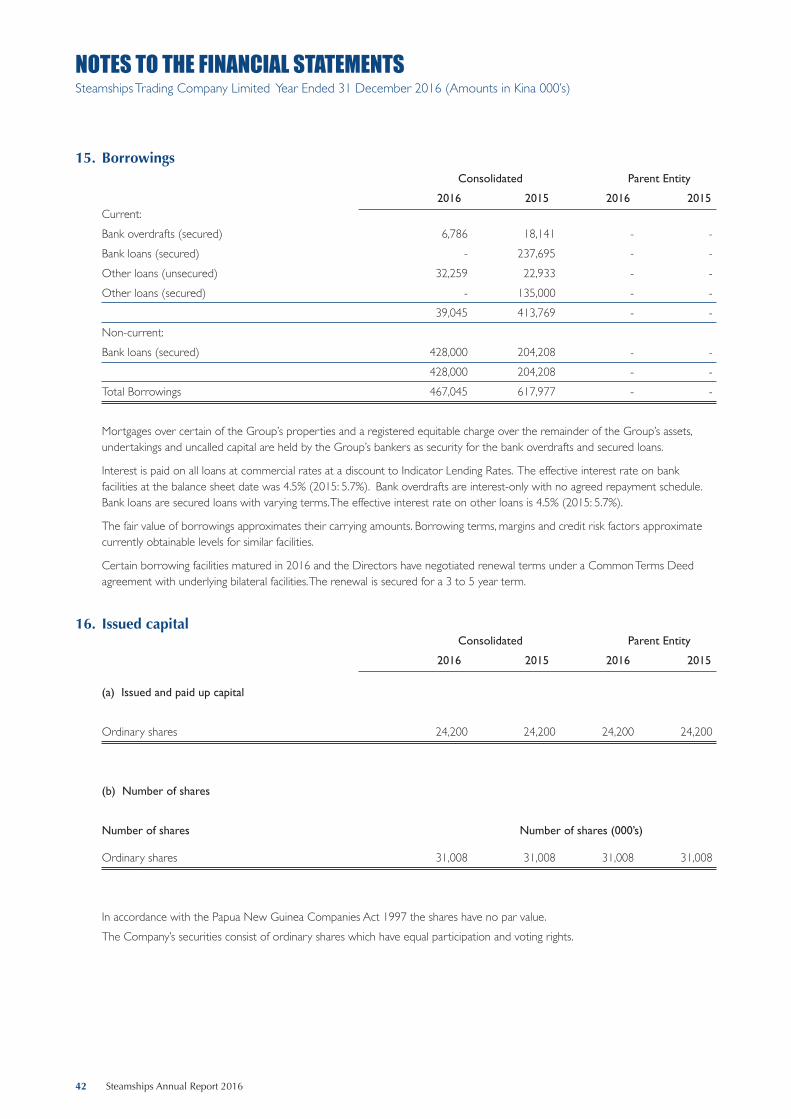
42 Steamships Annual Report 2016
NOTES TO THE FINANCIAL STATEMENTSSteamships Trading Company Limited Year Ended 31 December 2016 (Amounts in Kina 000’s)
15. Borrowings Consolidated Parent Entity
2016 2015 2016 2015 Current: Bank overdrafts (secured) 6,786 18,141 - - Bank loans (secured) - 237,695 - - Other loans (unsecured) 32,259 22,933 - - Other loans (secured) - 135,000 - - 39,045 413,769 - - Non-current: Bank loans (secured) 428,000 204,208 - - 428,000 204,208 - - Total Borrowings 467,045 617,977 - -
Mortgages over certain of the Group’s properties and a registered equitable charge over the remainder of the Group’s assets, undertakings and uncalled capital are held by the Group’s bankers as security for the bank overdrafts and secured loans.
Interest is paid on all loans at commercial rates at a discount to Indicator Lending Rates. The effective interest rate on bank facilities at the balance sheet date was 4.5% (2015: 5.7%). Bank overdrafts are interest-only with no agreed repayment schedule. Bank loans are secured loans with varying terms. The effective interest rate on other loans is 4.5% (2015: 5.7%).
The fair value of borrowings approximates their carrying amounts. Borrowing terms, margins and credit risk factors approximate currently obtainable levels for similar facilities.
Certain borrowing facilities matured in 2016 and the Directors have negotiated renewal terms under a Common Terms Deed agreement with underlying bilateral facilities. The renewal is secured for a 3 to 5 year term.
16. Issued capital Consolidated Parent Entity
2016 2015 2016 2015
(a) Issued and paid up capital
Ordinary shares 24,200 24,200 24,200 24,200 (b) Number of shares
Number of shares Number of shares (000’s)
Ordinary shares 31,008 31,008 31,008 31,008
In accordance with the Papua New Guinea Companies Act 1997 the shares have no par value. The Company’s securities consist of ordinary shares which have equal participation and voting rights.

Steamships Annual Report 2016 43
NOTES TO THE FINANCIAL STATEMENTSSteamships Trading Company Limited Year Ended 31 December 2016 (Amounts in Kina 000’s)
17. Related party disclosures
(a) Parent entity
The Group is controlled by John Swire & Sons (PNG) Limited, which owns 72.12% of the Company’s shares. The ultimate Holding Company is John Swire & Sons Limited, incorporated in England.
(b) Interest in subsidiaries, associates and joint ventures:
These are set out in notes 20, 21 and 22 respectively.
(c) Directors:
G.L. Cundle, P.W. Langslow and M.R Scantlebury are directors of John Swire & Sons (PNG) Limited.
(d) Remuneration:
Income received or due and receivable both by Directors and senior managers in connection with the management of the Group companies is shown in the Directors’ Report.
Consolidated Parent Entity
2016 2015 2016 2015
Key management personnel disclosure
Wages and salaries 12,488 9,931 - - Other short term benefits 1,293 1,159 - - Long-term benefits 27 21 - -
(e) Material transactions:
Sales of goods and services - Associates & joint ventures 8,728 1,737 - - - Key Management 1,007 278 - - - Associated Groups 49,970 45,237 - - Lease and rental income - Associates & joint ventures 97 - - - - Key management 50 - - - - Associated Groups 1,292 1,338 - - Dividends received - Subsidiaries, associates & joint ventures 20 5,067 31,691 38,044 Management fees income - Associates & joint ventures 1,181 - - - Purchase of goods and services - Associates & joint ventures (2,401) (1,540) - - - Associated groups (9,370) (5,105) - - - Shareholders of associated companies (157) - - - Management fees paid - Associates & joint ventures (599) (421) - - Purchase of assets - Associates & joint ventures (794) (1,138) - - - Associated groups (465) - - - Lease rental expense - Other Shareholders (2,462) (6,672) - - Container/Charter hire fee - Other Shareholders (2,424) (145) - -

44 Steamships Annual Report 2016
NOTES TO THE FINANCIAL STATEMENTSSteamships Trading Company Limited Year Ended 31 December 2016 (Amounts in Kina 000’s)
17. Related party disclosures (continued)
Consolidated Parent Entity
2016 2015 2016 2015
Finance Cost - Associates & joint ventures (1,058) - - - - Other shareholders (1,764) - - - Dividends paid - Other shareholders (minority interest) (3,349) (2,795) - - - Controlling shareholder (29,058) (34,605) (29,058) (34,605) - Significant shareholder (8,755) (9,608) (8,755) (9,608) Loans to/(from) related companies - Other shareholders (22,733) (106,628) - - Insurance premiums - Affiliated party (12,002) (11,474) - - All transactions with related parties are made on normal commercial terms and conditions. Balances with related companies:
Associates and joint ventures: Consort associates (note 9) (31,191) (26,690) - - Harbourside Development Limited (note 9) (1,111) - - - Morobe Terminal Limited (note 9) (3,150) - - - Consort shareholders (note 15) (22,773) (22,773) - - Basilok Limited (note 15) (160) (160) - - Croesus RE SPC Limited (note 15) (9,326) - - - Loans to related companies:
Colgate Palmolive Limited (note 9) 500 500 500 500 Harbourside Development Limited (note 9) 33,115 159,755 - - Subsidiary Companies (note 9) - - 5,212 5,212 Pacific Rumana Limited (note 9) 36,800 39,725 - - Labu Holdings Limited (note 9) 100 - - - Consort Associates - 125 - - Morobe Terminal Limited (note 9) 60 - - - Wonye Limited (note 9) 275 - - -

Steamships Annual Report 2016 45
NOTES TO THE FINANCIAL STATEMENTSSteamships Trading Company Limited Year Ended 31 December 2016 (Amounts in Kina 000’s)
18. Reconciliation of profit after income tax to net cash inflow from operating activities
Consolidated Parent Entity
2016 2015 2016 2015
Profit for the year after tax 88,874 101,394 31,883 38,887 Depreciation and impairment 108,991 131,583 2,261 2,215 Dividend and interest income - - (31,691) (38,044) Net loss (gain) on sale of fixed assets (19,766) (1,595) - 139 Gain on deconsolidation - (18,867) - - Share of profit of associates and joint ventures (5,865) (3,062) - - Change in operating assets and liabilities, net of effects from purchase of controlled entity (Increase)/decrease in trade debtors 21,079 (8,548) (1,030) (3,843) (Increase)/decrease in inventory (120) (3,948) - - (Increase)/decrease in deferred tax asset 234 (3,393) (246) 519 (Increase)/decrease in operating assets (7,961) (12,431) 182 - (Decrease)/increase in trade creditors (22,494) (1,184) 680 17 Increase in other operating liabilities 32,656 23,966 - - (Decrease)/increase in provision for income tax payable (2,123) (2,414) 608 - (Decrease)/increase in deferred tax liability (2,444) 1,320 - - Net cash inflow from operating activities 191,061 202,821 2,647 (110)
19. Retirement benefit plans
The total cost of retirement benefits of the Group in 2016 was K6.4M (2015: K7.6M). The Group participates in the National Superannuation Fund of Papua New Guinea, a multi-employer defined contribution fund, on behalf of all citizen employees with minimum employer and employee contribution rates established by legislation. The Group also contributes to a defined contribution superannuation plan on behalf of expatriates. The defined contribution superannuation plan was established in 2002.
The parent entity does not employ staff directly; consequently there was no charge during the year.

46 Steamships Annual Report 2016
NOTES TO THE FINANCIAL STATEMENTSSteamships Trading Company Limited Year Ended 31 December 2016 (Amounts in Kina 000’s)
20. Subsidiaries and transactions with non-controlling interests
Significant investments in subsidiaries
The consolidated financial statements incorporate the assets, liabilities and results of the following subsidiaries in accordance with the accounting policy described in Note 1 (c):
Equity Equity Holdings* Holdings* Name of Entity Country of Incorporation Class of Shares 2016 2015
Consort Express Lines Limited Papua New Guinea Ordinary 70.2 70.2
Kavieng Port Services Limited Papua New Guinea Ordinary 60 60
Kiunga Stevedoring Company Limited Papua New Guinea Ordinary 100 100
Lae Port Services Limited Papua New Guinea Ordinary 51 51
Laga Industries Limited Papua New Guinea Ordinary 100 100
Madang Port Services Limited Papua New Guinea Ordinary 60 60
New Britain Shipping Limited** Papua New Guinea Ordinary 50 50
Oro Port Services Limited Papua New Guinea Ordinary 100 100
Pacific Towing (PNG) Limited Papua New Guinea Ordinary 100 100
Pacific Rumana Mobile Investments Limited Papua New Guinea Ordinary 79.8 79.8
Palm Stevedoring & Transport Limited Papua New Guinea Ordinary 56.7 56.7
Port Services PNG Limited Papua New Guinea Ordinary 54 54
Steamships Limited Papua New Guinea Ordinary 100 100
Windward Apartments Limited Papua New Guinea Ordinary 100 100
*The portion of ownership is equal to the proportion of voting power held.
** Consolidated by virtue of control over the operating decisions and returns. As at December 31, 2016 Steamships Trading Company still has control over this entity.
Shares in subsidiary companies have been stated at cost or fair value on acquisition less dividends received from pre-acquisition profits.
Steamships Trading Company Limited has granted a call option to a minority shareholder of Consort Express Lines in the event of any recovery under a charter performance guarantee to enforce a proportional equity capital buy back. At 31 December 2016 the performance guarantee obligations are being met.
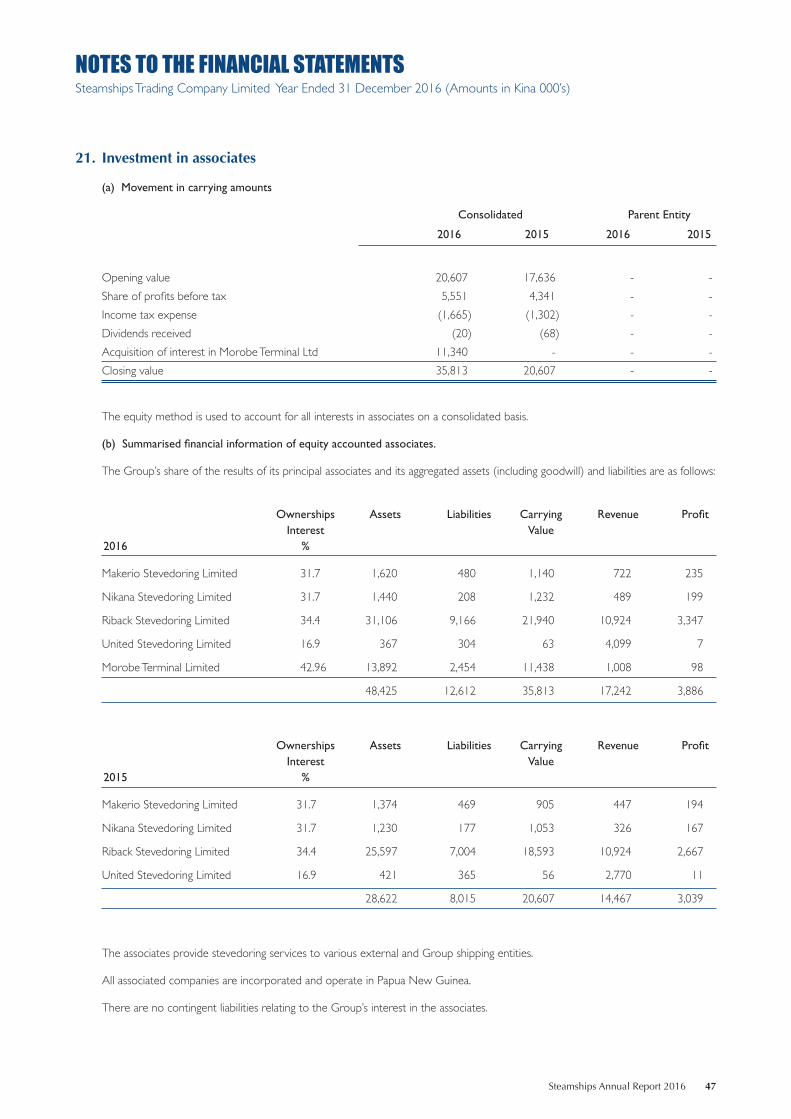
Steamships Annual Report 2016 47
NOTES TO THE FINANCIAL STATEMENTSSteamships Trading Company Limited Year Ended 31 December 2016 (Amounts in Kina 000’s)
21. Investment in associates
(a) Movement in carrying amounts
Consolidated Parent Entity
2016 2015 2016 2015
Opening value 20,607 17,636 - - Share of profits before tax 5,551 4,341 - - Income tax expense (1,665) (1,302) - - Dividends received (20) (68) - - Acquisition of interest in Morobe Terminal Ltd 11,340 - - - Closing value 35,813 20,607 - -
The equity method is used to account for all interests in associates on a consolidated basis.
(b) Summarised financial information of equity accounted associates.
The Group’s share of the results of its principal associates and its aggregated assets (including goodwill) and liabilities are as follows:
Ownerships Assets Liabilities Carrying Revenue Profit Interest Value 2016 %
Makerio Stevedoring Limited 31.7 1,620 480 1,140 722 235
Nikana Stevedoring Limited 31.7 1,440 208 1,232 489 199
Riback Stevedoring Limited 34.4 31,106 9,166 21,940 10,924 3,347
United Stevedoring Limited 16.9 367 304 63 4,099 7
Morobe Terminal Limited 42.96 13,892 2,454 11,438 1,008 98
48,425 12,612 35,813 17,242 3,886
Ownerships Assets Liabilities Carrying Revenue Profit Interest Value 2015 %
Makerio Stevedoring Limited 31.7 1,374 469 905 447 194
Nikana Stevedoring Limited 31.7 1,230 177 1,053 326 167
Riback Stevedoring Limited 34.4 25,597 7,004 18,593 10,924 2,667
United Stevedoring Limited 16.9 421 365 56 2,770 11
28,622 8,015 20,607 14,467 3,039
The associates provide stevedoring services to various external and Group shipping entities.
All associated companies are incorporated and operate in Papua New Guinea.
There are no contingent liabilities relating to the Group’s interest in the associates.

48 Steamships Annual Report 2016
NOTES TO THE FINANCIAL STATEMENTSSteamships Trading Company Limited Year Ended 31 December 2016 (Amounts in Kina 000’s)
22. Investment in joint ventures
(a) Movement in carrying amounts
Consolidated Parent Entity
2016 2015 2016 2015
Opening value 15,851 15,557 23,823 20,051 Share of profits before tax 2,827 33 - - Income tax expense (848) (10) - - Dividends received - (5,000) - - Acquisition of interest in joint ventures 12,803 5,271 12,803 3,772 Closing value 30,632 15,851 36,626 23,823
The interest in joint ventures is accounted for in the financial statements using the equity method of accounting. (b) Information relating to the joint ventures is set out below.
Ownership Assets Liabilities Carrying Revenue Profit Interest Value 2016 %
Colgate Palmolive (PNG) Limited 50 17,366 9,567 7,799 38,099 2,605
Harbourside Development Limited 50 94,682 91,864 2,818 9,025 (1,651)
Pacific Rumana Limited 50 3,761 299 3,462 3,836 1,047
Viva No. 31 Limited 50 10,810 7,060 3,750 - (22)
Wonye Limited 50 15,262 2,460 12,803 - -
141,881 111,250 30,632 50,960 1,979
Ownership Assets Liabilities Carrying Revenue Profit Interest Value 2015 %
Colgate Palmolive (PNG) Limited 50 12,391 7,196 5,195 37,016 2,496
Harbourside Development Limited 50 9,596 5,127 4,469 3,026 (3,390)
Pacific Rumana Limited 50 4,220 1,805 2,415 7,375 917
Viva No. 31 Limited 50 3,772 - 3,772 - -
29,979 14,128 15,851 47,417 23
Wonye Limited is a new joint venture company and is currently developing a commercial property in Mount Hagen.
In 2015 the Company recognised the deconsolidated related interest of Pacific Rumana Limited and instead recognised the equity accounted investment at fair value. A gain on deconsolidation of K18.9M was recognised for which no consideration was received. The Group’s share of the capital commitments of joint ventures at 31 December 2016 is K13.6M (2015: K2.2M).
There are no contingent liabilities arising from the Group’s interests in the joint ventures.

Steamships Annual Report 2016 49
NOTES TO THE FINANCIAL STATEMENTSSteamships Trading Company Limited Year Ended 31 December 2016 (Amounts in Kina 000’s)
23. Business combinations
2015
Increase in shareholding in Consort Express Lines
On 1 July 2015, the Group merged Steamships Coastal Shipping (SCS), a division of Steamships Limited, with Consort Express Lines Limited and increased its shareholding from 51 % to 70.2%.
The equity (merged assets) contributed by SCS amounted to K63.5M, with the fair value of these net assets contributed amounting to K58.5M resulting in goodwill recorded of K5.0M. Internal goodwill was eliminated on consolidation.
24. Segmental reporting
(a) Description of segments
The Board monitors the business from a product perspective and have identified four reportable segments. A brief description of each segment is outlined below:
• Commercial – consists of the manufacture and distribution of consumer products.
• Hotels and property – consists of the hotels owned and operated by the Group and also its property leasing division. The assets are stated at historical cost net of accumulated depreciation and includes new assets in the course of construction.
• Logistics – consists of shipping and land based freight transport and related services divisions.
• Finance and investment – consists of the head office administration function.
(b) Segment information
The segment information provided to the Board for the reportable segments for the year ended 31 December 2016 is as follows:
Commercial Hotels & Logistics Finance & Total Property Investment (and elimination) 2016 External revenue 115,823 253,170 355,992 7,716 732,701
Intersegmental revenue 529 20,000 3,344 - 23,873
Interest revenue - - - 12,248 12,248
Interest expense - - - (34,235) (34,235)
Depreciation and amortisation 4,936 45,076 53,979 2,724 106,715
Segment results 8,758 88,109 24,210 (2,391) 118,686
Share of joint ventures and associates profit 2,605 (626) 3,886 - 5,865
Total tax expense (3,018) (27,923) (11,984) 7,248 (35,677)
Profit from continuing operations 8,345 59,560 16,112 4,857 88,874
Segment assets 92,139 768,919 464,084 211,566 1,536,708
Segment liabilities (65,026) (365,418) (251,586) 27,159 (654,871)
Net assets 27,113 403,501 212,498 238,725 881,837
Total assets includes investment in joint ventures and associates 7,799 22,833 35,813 - 66,445
Capital expenditure 5,798 53,517 43,249 6,914 109,478

50 Steamships Annual Report 2016
NOTES TO THE FINANCIAL STATEMENTSSteamships Trading Company Limited Year Ended 31 December 2016 (Amounts in Kina 000’s)
24. Segmental reporting (continued)
Commercial Hotels & Logistics Finance & Total Property Investment (and elimination)
2015 External revenue 114,754 273,024 382,747 3,010 773,535 Intersegmental revenue 822 31,493 3,157 - 35,472 Interest revenue - - 255 13,697 13,952 Interest expense (2) (8) (9,721) (29,917) (39,648) Depreciation and amortisation (4,834) (43,229) (51,596) (2,483) (102,142) Segment results 3,086 107,838 6,594 18,524 136,042
Share of joint ventures and associates profit 2,495 (2,472) 3,039 - 3,062 Total tax expense (2,015) (33,864) (20) (1,811) (37,710) Profit from continuing operations 3,566 71,502 9,613 16,713 101,394
Segment assets 96,326 730,913 507,575 292,355 1,627,298 Segment liabilities (74,954) (358,506) (238,795) (118,441) (790,696) Net assets 21,372 372,407 268,780 173,913 836,602 Total assets includes investment in joint ventures and associates 5,195 10,656 20,607 - 36,458 Capital expenditure 7,145 55,501 36,598 10,418 109,662
These figures include non-controlling interests share of operating profits and assets.
(c) Geography
The Group operates almost wholly in Papua New Guinea. It is not practical to provide a segment analysis by geographical region within Papua New Guinea. The Group has one insignificant business operation in the Solomon Islands.
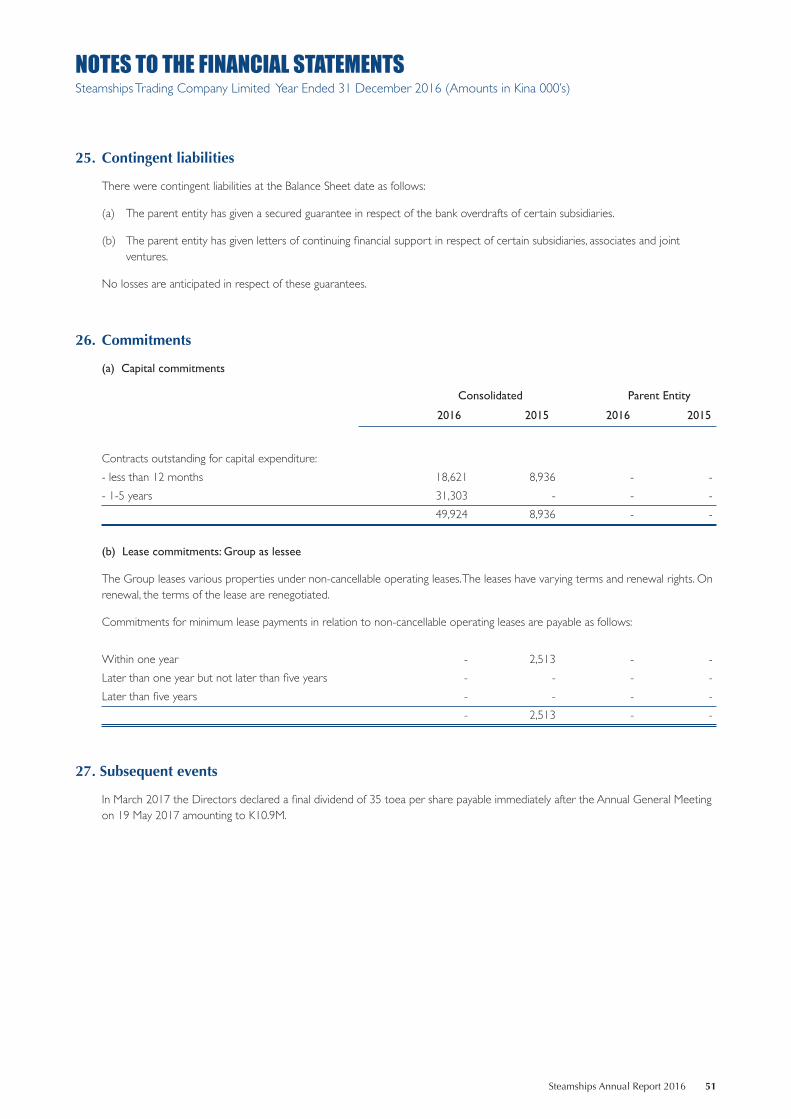
Steamships Annual Report 2016 51
NOTES TO THE FINANCIAL STATEMENTSSteamships Trading Company Limited Year Ended 31 December 2016 (Amounts in Kina 000’s)
25. Contingent liabilities
There were contingent liabilities at the Balance Sheet date as follows:
(a) The parent entity has given a secured guarantee in respect of the bank overdrafts of certain subsidiaries.
(b) The parent entity has given letters of continuing financial support in respect of certain subsidiaries, associates and joint ventures.
No losses are anticipated in respect of these guarantees.
26. Commitments
(a) Capital commitments
Consolidated Parent Entity
2016 2015 2016 2015
Contracts outstanding for capital expenditure: - less than 12 months 18,621 8,936 - - - 1-5 years 31,303 - - - 49,924 8,936 - -
(b) Lease commitments: Group as lessee
The Group leases various properties under non-cancellable operating leases. The leases have varying terms and renewal rights. On renewal, the terms of the lease are renegotiated.
Commitments for minimum lease payments in relation to non-cancellable operating leases are payable as follows: Within one year - 2,513 - - Later than one year but not later than five years - - - - Later than five years - - - - - 2,513 - -
27. Subsequent events
In March 2017 the Directors declared a final dividend of 35 toea per share payable immediately after the Annual General Meeting on 19 May 2017 amounting to K10.9M.

52 Steamships Annual Report 2016
INDEPENDENT AUDITOR’S REPORTto the Shareholders of Steamships Trading Company Limited
Report on the audit of the financial statements of the Company and the Group
Our opinion We have audited the financial statements of Steamships Trading Company Limited (the Company), which comprise the balance sheets as at 31 December 2016, the statements of comprehensive income, statement of changes in equity and statements of cash flows for the year then ended, and the notes to the financial statements that include a summary of significant accounting policies and other explanatory information for both the Company and the Group. The Group comprises the Company and the entities it controlled at 31 December 2016 or from time to time during the financial year.
In our opinion the accompanying financial statements:
• comply with International Financial Reporting Standards and other generally accepted accounting practice in Papua New Guinea; and
• give a true and fair view of the financial position of the Company and the Group as at 31 December 2016, and their financial performance and cash flows for the year then ended.
Basis for opinion We conducted our audit in accordance with International Standards on Auditing (ISAs). Our responsibilities under those standards are further described in the Auditor’sresponsibilitiesfortheauditofthefinancialstatementssection of our report .
We believe that the audit evidence we have obtained is sufficient and appropriate to provide a basis for our opinion.
Independence
We are independent of the Company and the Group in accordance with the International Ethics Standards Board for Accountants’ Code of Ethics for Professional Accountants (IESBA Code), and we have fulfilled our other ethical responsibilities in accordance with these requirements.
Our firm carries out services for the Company and its subsidiaries in the area of tax compliance and tax advisory. These services have not impaired our independence as auditor of the Company and the Group.
Our audit approach An audit is designed to provide reasonable assurance about whether the financial statements are free from material misstatement. Misstatements may arise due to fraud or error. They are considered material if individually or in aggregate, they could reasonably be expected to influence the economic decisions of users taken on the basis of the financial statements .
We tailored the scope of our audit to ensure that we performed enough work to be able to give an opinion on the financial statements as a whole, taking into account the management structure of the Company and the Group, their accounting processes and controls and the industries in which they operate.

Steamships Annual Report 2016 53
INDEPENDENT AUDITOR’S REPORTto the Shareholders of Steamships Trading Company Limited
Materiality Audit scope Key audit matters
• For the purpose of our audit of the Group we used overall group materiality of K6.2 million, which represents approximately 5% of the Group’s profit before tax.
• We applied this threshold, together with qualitative considerations, to determine the scope of our audit and the nature, timing and extent of our audit procedures and to evaluate the effect of misstatements on the financial statements as a whole.
• We chose total profit before tax as, in our view, it is the metric against which the financial position of the Group is most commonly measured and is a generally accepted benchmark.
• We selected 5% based on our professional judgement noting that it is also within the range of commonly acceptable related thresholds.
• We (PwC Papua New Guinea) conducted audit work over all the subsidiaries which comprise the Group consolidation.
• All subsidiaries of the Group are incorporated and operating in Papua New Guinea with the exception of one subsidiary which has operations in the Solomon Islands.
• All significant associates of the Group are incorporated and operating in Papua New Guinea and audited by PwC Papua New Guinea.
• Our audit focused on where the directors made subjective judgements; for example, significant accounting estimates involving assumptions and inherently uncertain future events.
• Amongst other relevant topics, we communicated the following key audit matters to the Audit and Risk Committee:
• Non-current asset impairment assessment
• Goodwill impairment assessment
• These matters are further described in the Key audit matters section of our report .

54 Steamships Annual Report 2016
INDEPENDENT AUDITOR’S REPORTto the Shareholders of Steamships Trading Company Limited
Key audit matters Key audit matters are those matters that, in our professional judgement, were of most significance in our audit of the financial statements for the current period. The key audit matters were addressed in the context of our audit of the financial statements as a whole, and in forming our opinion thereon, and we do not provide a separate opinion on these matters. We have determined the matters described below to be key matters to be communicated in our report. Further, commentary on the outcomes of the particular audit procedures is made in that context.
Key audit matter How our audit addressed the key matter
Non-current asset impairment assessment
(Refertonote10ofthefinancialstatements)
Included within Property, plant and equipment are Ships with an aggregate net book value of K164.4 million as at 31 December 2016 .
The Group’s financial performance has been impacted by a prolonged weakness in economic conditions in Papua New Guinea. These conditions adversely impacted levels of cargo shipping throughout the country.
We considered this a key audit matter because economic conditions are a potential indicator of impairment in the value of the coastal ships. The Group has assessed impairment by reference to estimated sales values of these ships. The impairment assessment is sensitive to changes in key assumptions about the estimated sales value of the ships .
The sales values have been determined by reference to an external valuation of the fleet which contains assumptions about the global supply and demand for specific ship types and dry docking schedules.
In applying the external valuations, the directors have used their professional judgement to consider the impact of the specific dry docking schedule of the individual ships.
As there was an indicator of potential impairment we have considered and tested the Group’s assessment of the estimated sale value of the ships.
We evaluated the competency, qualifications and objectivity of the expert engaged by the Group to provide the valuations of the ships.
We discussed the valuation methodologies and assumptions with the expert. This included understanding and evaluating the impact of the dry docking schedules on the determined values.
We tested, on a sample basis, the accuracy and relevance of the input data provided by the Group to the expert.
We compared the valuations of the individual ships with the valuations in the previous year. We also compared the selling prices of ships sold during 2016 and subsequent to the end of the year with the most recent valuation for each respective ship.
We compared the Group’s assertions and estimates regarding estimated useful lives and residual values with the previous year.
We also considered whether the Group’s assessment of the condition of the ships and their future operating plans were consistent with historical experience and our knowledge of the business .

Steamships Annual Report 2016 55
INDEPENDENT AUDITOR’S REPORTto the Shareholders of Steamships Trading Company Limited
Goodwill impairment assessment
(Refertonote12ofthefinancialstatements)
The Group has goodwill totalling K80.5 million at 31 December 2016. In accordance with the accounting policy in note 1(n) of the financial statements, the Group has assessed the goodwill balance for impairment at 31 December 2016 .
The prolonged weakness in economic conditions in a number of the markets in which the Group operates in Papua New Guinea has increased the risk that the carrying values of the components of goodwill may be impaired.
The Group has calculated the value of the respective cash generating units containing goodwill balances based on financial models comprising cash flow projections. The cash flow projections use a number of forward looking assumptions, including revenue and cost growth, and the value calculation is sensitive to these.
We considered this a key audit matter because of the significant judgements around future revenues and costs, and the discount rate to be applied in determining the value of the cash generating units.
We have considered and tested the financial models used by the Group to determine the value of the cash generating units. We compared the models with the previous year’s models and found them to be consistently structured and consistent with the basis of preparation required by accounting standards.
We compared the forecast revenues and expenditures to approved budgets and obtained an understanding and evaluated the Group’s budgeting procedures, upon which forecasts are based. We also evaluated the reliability of estimates made by comparing forecasts made in prior years to actual outcomes .
We benchmarked the assumptions used around revenue and cost inflation with external forecasts, and the discount rates with our expectation based on the overall Weighted Average Cost of Capital (WACC) of the Group. Together with our valuation expert we reviewed the methodology used in determining the discount rate applied.
We performed sensitivity analysis on assumptions to ascertain the extent of change that would be required in key assumptions for the respective goodwill balances to be impaired. We determined that the calculations were more sensitive to inflation assumptions and discount rates and focused our testing on these assumptions.
Information other than the financial statements and auditor’s report The directors are responsible for the annual report which includes other information. Our opinion on the financial statements does not cover the other information included in the annual report and we do not express any form of assurance conclusion on the other information .
In connection with our audit of the financial statements, our responsibility is to read the other information and, in doing so, consider whether the other information is materially inconsistent with the financial statements or our knowledge obtained in the audit, or otherwise appears to be materially misstated. If, based on the work we have performed on the other information that we obtained prior to the date of this auditor’s report, we conclude that there is a material misstatement of this other information, we are required to report that fact. We have nothing to report in this regard.

56 Steamships Annual Report 2016
INDEPENDENT AUDITOR’S REPORTto the Shareholders of Steamships Trading Company Limited
Responsibilities of the directors for the financial statements The directors are responsible, on behalf of the Company for the preparation of financial statements that give a true and fair view in accordance with International Financial Reporting Standards and other generally accepted accounting practice in Papua New Guinea and the Companies Act 1997 and for such internal control as the directors determine is necessary to enable the preparation of financial statements that are free from material misstatement, whether due to fraud or error.
In preparing the financial statements, the directors are responsible for assessing the Group’s ability to continue as a going concern, disclosing, as applicable, matters related to going concern and using the going concern basis of accounting unless the directors either intend to liquidate the Company or any of its subsidiaries or to cease operations, or have no realistic alternative but to do so.
Auditor’s responsibilities for the audit of the financial statements Our objectives are to obtain reasonable assurance about whether the financial statements, as a whole, are free from material misstatement, whether due to fraud or error, and to issue an auditor’s report that includes our opinion. Reasonable assurance is a high level of assurance, but is not a guarantee that an audit conducted in accordance with the International Standards on Auditing will always detect a material misstatement when it exists. Misstatements can arise from fraud or error and are considered material if, individually or in the aggregate, they could reasonably be expected to influence the economic decisions of users taken on the basis of the financial statements.
As part of an audit in accordance with International Standards on Auditing, we exercise professional judgement and maintain professional scepticism throughout the audit. We also:
• Identify and assess the risks of material misstatement of the financial statements, whether due to fraud or error, design and perform audit procedures responsive to those risks, and obtain audit evidence that is sufficient and appropriate to provide a basis for our opinion. The risk of not detecting a material misstatement resulting from fraud is higher than for one resulting from error, as fraud may involve collusion, forgery, intentional omissions, misrepresentations, or the override of internal control.
• Obtain an understanding of internal control relevant to the audit in order to design audit procedures that are appropriate in the circumstances, but not for the purpose of expressing an opinion on the effectiveness of the Group’s internal control .
• Evaluate the appropriateness of accounting policies used and the reasonableness of accounting estimates and related disclosures made by the directors.
• Conclude on the appropriateness of the directors’ use of the going concern basis of accounting and, based on the audit evidence obtained, whether a material uncertainty exists related to events or conditions that may cast significant doubt on the Group’s ability to continue as a going concern. If we conclude that a material uncertainty exists, we are required to draw attention in our auditor’s report to the related disclosures in the financial statements or, if such disclosures are inadequate, to modify our opinion. Our conclusions are based on the audit evidence obtained up to the date of our auditor’s report. However future events or conditions may cause the Group to cease to continue as a going concern.
• Evaluate the overall presentation, structure and content of the financial statements, including the disclosures, and whether the financial statements represent the underlying transactions and events in a manner that achieves fair presentation .

Steamships Annual Report 2016 57
INDEPENDENT AUDITOR’S REPORTto the Shareholders of Steamships Trading Company Limited
• Obtain sufficient appropriate audit evidence regarding the financial information of the entities or business activities within the Group to express an opinion on the consolidated financial statements of the Group. We are responsible for the direction, supervision and performance of the Group audit. We remain solely responsible for our audit opinion.
We communicate with those charged with governance regarding, among other matters, the planned scope and timing of the audit and significant audit findings, including any significant deficiencies in internal control that we identify during our audit.
We also provide those charged with governance with a statement that we have complied with relevant ethical requirements regarding independence, and communicate with them all relationships and other matters that may reasonably be thought to bear on our independence, and where applicable, related safeguards.
From the matters communicated with those charged with governance, we determine those matters that were of most significance in the audit of the financial statements for the current period and are therefore the key audit matters. We describe these matters in our auditor’s report unless law or regulations preclude public disclosure about the matter or when, in extremely rare circumstances, we determine that a matter should not be communicated in our report because the adverse consequences of doing so would reasonably be expected to outweigh the public interest benefits of such communication.
Report on other legal and regulatory requirements The Companies Act 1997 requires that in carrying out our audit we consider and report on the following matters. We confirm in relation to our audit of the financial statements for the year ended 31 December 2016:
• We have obtained all the information and explanations that we have required;
• In our opinion, proper accounting records have been kept by the Company as far as appears from an examination of those records.
Who we report toThis report is made solely to the Company’s shareholders, as a body, in accordance with the Companies Act 1997. Our audit work has been undertaken so that we might state to the Company’s shareholders those matters which we are required to state to them in an auditor’s report and for no other purpose. We do not accept or assume responsibility to anyone other than the Company and the Company’s shareholders, as a body, for our audit work, for this report or for the opinions we have formed.
PricewaterhouseCoopers
Christopher Hansor Partner
Registered under the Accountants Act 1996
Port Moresby31 March 2017

58 Steamships Annual Report 2016
DIRECTORS’ REPORTSteamships Trading Company Limited Year ended 31 December 2016
Steamships Trading Company Limited and Subsidiary Companies
The Directors submit their Annual Report for the year ended 31 December 2016 for the Company and its subsidiaries.
Principal Activities and Review of Operations
Full details of the Group’s activities are given in the Directors’ Review on page 7. The Group continues to operate in the segments of Commercial, Hotels and Property, and Logistics.
The Directors believe that there will be no significant changes in the Group’s activities for the foreseeable future.
Changes in Accounting Policies
There are no changes in Accounting Policies in the year.
Result
The Group operating profit for the year attributable to shareholders was K84,210,000 (2015: K98,979,000).
Dividend
The Directors advise that a final dividend of 35 toea per share will be paid immediately after the Annual General Meeting on 19 May 2017. This brings the total dividend declared for the year to 130 toea per share. Dividends payable to shareholders resident outside of Papua New Guinea will be converted to Australian Dollars at the prevailing rate which the Company is able to secure .
Rounding Off
Amounts in the Directors’ Report and accounts have been rounded off to the nearest thousand Kina.

Steamships Annual Report 2016 59
DIRECTORS’ REPORTSteamships Trading Company Limited Year ended 31 December 2016
Experience & Interests Register
Directors serving at the date of this report have disclosed the following experience and interests in shares in the Company and provided general disclosure of companies in which the Director is to be regarded as interested as set out below:
G.L. Cundle
Chairman since 28th February 2015
Managing Director from 1st January 2013 to 12th January 2015
Member of the Remuneration Committee
Member of the Strategic Planning Committee
Director since 2013
Mr Cundle joined the Swire Group in 1979 and has extensive corporate experience having worked with the Group in various divisions in Hong Kong, Australia, Korea, Japan and Papua New Guinea. He was a Non-Executive Director of Steamships in 2006-2007 and Steamships Shipping General Manager from 1989-1992. He is a director of John Swire & Sons (PNG) Ltd. He was the Managing Director of Steamships Trading Company Limited from 1st January 2013 to 12th January 2015. He is Chairman and Chief Executive Officer of John Swire and Sons Pty Limited.
P. Aitsi MBE
Director since 17th November 2014
Mr Aitsi is currently the PNG Country Manager for Newcrest Mining Limited and serves as a director for various Newcrest PNG entities including the position of Chairman of Lihir Gold Limited. He was formerly the country manager for GHD (an engineering firm), former chairman of Transparency International PNG (currently a board member) and the founder Chairman of Digicel Foundation. He also serves on the boards of PNGFM, City Pharmacy Group, Leadership PNG and Kumul Consolidated Holdings.
G. Aopi CBE
Director since 1997
Mr Aopi has achieved several tertiary degrees in Papua New Guinea, and a Masters of Business Administration from the University of Queensland. Mr Aopi has substantial public service and business experience in PNG, including Secretary of Finance and Planning and Managing Director of Telikom PNG Limited. He presently holds the position of Executive General Manager, Stakeholder Engagement at Oil Search Limited. He was previously the Chairman of Telikom PNG Limited and Independent Public Business Corporation (IPBC). Mr Aopi is a Director of Oil Search Limited, Steamships Trading Company Limited, Bank of South Pacific and is involved in a number of other private sector and charitable organisations in Papua New Guinea.
Sir M.R. Bromley KBE
Member of the Audit and Risk Committee
Member of the Remuneration Committee
Member of the Strategic Planning Committee
Director, 1986 to 1996
Director since 2000
Sir Michael Bromley has extensive international business experience from over 40 years of operating and advising companies in countries including Singapore, Indonesia, Australia, Russia, China and Papua New Guinea, principally in retail and logistics operations. He is Chairman of Heli Niugini Ltd and AAB Holdings Pty Ltd, and a Director of Pegasus Print Group Pty Ltd, Fasteners & More Pty Ltd, New Guinea Energy Limited, Sonway Asia Ltd, Chemica Ltd, Sig No.1 Ltd, Glock No. 1 Ltd, Broman Ltd, Maps Tuna Ltd, Sek No. 35 Ltd, Hoia Investment Ltd, Venture Ltd and Viva No. 31 Limited.
Relevant Interest in Steamships shares: 19.99%

60 Steamships Annual Report 2016
DIRECTORS’ REPORTSteamships Trading Company Limited Year ended 31 December 2016
D.H. Cox OL, OBE
Managing Director 2004 to 2012
Member of the Audit & Risk Committee (with effect 2015)
Member of the Strategic Planning Committee (with effect 2015)
Director since 2003
Mr Cox joined Steamships as a Manager in 1992, rising to become Managing Director from 2004-2012. He has extensive experience in the PNG business environment. He is also a Director of Telikom PNG Ltd, Australia Pacific Technical College and MBA International Hospitality.
G.J. Dunlop
Chairman of the Audit and Risk Committee
Member of the Strategic Planning Committee
Managing Director 2000 to 2003
Director since 1995
Mr Dunlop is a chartered accountant with extensive experience in the Pacific region. He is a Director of City Pharmacy Group Ltd, Credit Corporation (PNG) Ltd and Mainland Holdings Ltd.
Lady W.T. Kamit CBE
Member of the Audit and Risk Committee
Director since 2005
Lady Winifred Kamit is a former Senior Partner, and currently a consultant at Dentons (formerly Gadens Lawyers) in Port Moresby. Lady Kamit is a member of the Board of Trustee of the Papua New Guinea Institute of National Affairs, and a director of Anglicare PNG. She is a Director & Secretary of Bunowen Services Ltd, Kamchild Limited and Gadens Administration Services Ltd, a Director of Newcrest Mining Ltd, South Pacific Post Ltd and Chairman of ANZ Banking Group (PNG) Ltd.
P.W. Langslow
Managing Director from 12th January 2015
Mr Langslow joined the Swire group in September 1984. Prior to his present appointment, he has held a number of positions in Cathay Pacific, including country and regional management roles in India, Italy, Canada and Taiwan, as well General Manager Inflight Services and General Manager Airports. He is a director of John Swire & Sons (PNG) Ltd and various Steamships Trading Company subsidiaries, joint ventures and associate companies.
M.R. Scantlebury
Appointed Finance Director & Company Secretary on 24th June 2016
Mr Scantlebury is a chartered accountant and was previously Director of the Office for Financial Planning at Swire Pacific Ltd in Hong Kong and he has held various senior finance and commercial positions in the Swire group in his career. He is a director of John Swire & Sons (PNG) Ltd and various Steamships Trading Company subsidiaries, joint ventures and associated companies .
B.N. Swire
Director from 1st January 2015
Mr. Swire joined John Swire & Sons in 1985 and has since worked at various times in Hong Kong, Papua New Guinea and Japan, concentrating on the Group’s marine businesses. He returned to the London Head Office in 1994 and is now the Chairman of John Swire & Sons, Ltd., as well as the Non-Executive Chairman of the China Navigation Co., Ltd., and a Non-Executive Director of Swire Pacific Offshore Ltd and John Swire & Sons (Green Investments) Limited.
Direct and indirect beneficial interest 5.6%
J.H. Woodrow
Director from 7th September 2015
Mr Woodrow is Managing Director of the China Navigation Company Pte Ltd (Swire Shipping). He was formerly Director Cargo for Cathay Pacific (2013-2015) and General Manager Cargo Sales & Marketing for Cathay Pacific (2010-2013). He joined John Swire and Sons in September 1990 and spent 15 years in the sea freight industries in Japan and Australia. He was also a director of various companies across Asia including Air Hong Kong Ltd, Air China Cargo Ltd, Cathay Pacific China Cargo Holdings Ltd, Cathay Pacific Services Limited.

Steamships Annual Report 2016 61
DIRECTORS’ REPORTSteamships Trading Company Limited Year ended 31 December 2016
Remuneration of Directors
Directors remuneration received or receivable from the Company as directors during the year, is as follows:
2016 2015 K’000 K’000
P. Aitsi, 124 89G. Aopi 124 89T.J. Blackburn (retired) - 44M.R. Bromley 223 221D.H Cox 213 177G.L Cundle (Chairman) 223 221G.J. Dunlop 247 199J.W. Hughes - Hallett (retired) - -W.T. Kamit 135 133B.N. Swire 124 89J.H Woodrow 124 44P.W. Langslow* - -S.C. Pelling*(retired) - -M.R. Scantlebury* - - 1,537 1,306 The directors fees vary in accordance with the required duties on various sub-committees of the board.
* Executive Directors receive no fees for their service as Directors during the year.
Remuneration of Employees
The number of employees whose remuneration and other benefits was within the specified bands are as follows:
Remuneration 2016 2015 Remuneration 2016 2015 Remuneration 2016 2015K’000 No. No. K’000 No. No. K’000 No. No.
100-110 10 7 350-360 - 2 590-600 1 1110-120 4 12 360-370 2 1 600-610 1 -120-130 10 6 370-380 3 1 610-620 - 2130-140 2 2 380-390 - 2 620-630 - 1140-150 4 3 390-400 - 4 630-640 1 1150-160 1 4 400-410 1 2 640-650 2 -160-170 5 6 410-420 4 - 650-660 1 -170-180 - 4 420-430 - 4 680-690 1 -190-200 - 4 430-440 - 1 730-740 - 1200-210 5 2 440-450 1 1 740-750 2 1210-220 2 2 450-460 1 - 750-760 2 -220-230 2 3 460-470 1 1 790-800 1 -230-240 1 - 470-480 - 1 800-810 2 -240-250 4 1 490-500 - 2 820-830 - 2250-260 2 2 500-510 1 2 890-900 2 1260-270 1 5 510-520 1 - 920-930 1 -270-280 2 2 520-530 1 1 950-960 - 2280-290 2 1 530-540 - 2 970-980 1 1290-300 4 1 540-550 3 1 990-1000 - 1300-310 3 1 550-560 2 1 1,050-1,060 - 1310-320 1 1 560-570 1 - 1,070-1,080 1 -320-330 - 3 570-580 2 - 1,400-1,500 1 -330-340 6 2 580-590 1 1 2,300-2,400 1 1340-350 3 -
For and on behalf of the Board:
Port Moresby G.L. Cundle P.W. Langslow 31 March 2017 Chairman Managing Director

62 Steamships Annual Report 2016
STOCK EXCHANGE INFORMATIONSteamships Trading Company Limited Year ended 31 December 2016
Shares are listed on the Australian Securities Exchange and the Port Moresby Stock Exchange.All shares carry equal voting rights.
ShareholdingsAt 28 February 2017, there were 369 shareholders.
262 Holding 1 - 1,000 units79 Holding 1,001 - 5,000 units14 Holding 5,001 - 10,000 units 14 Holding 10,001 - and over
The number of shareholders holding less than a marketable parcel was 13.
The 20 largest shareholders were: Number of shares %
John Swire & Sons (PNG) Limited 22,362,651 72.12Bell Potter Nominees Ltd 5,760,000 18.58National Superannuation Fund Ltd 1,859,446 6.00Berne No 132 Nominees Pty Ltd 446,494 1.44John E Gill Operations Pty Ltd 54,727 0.18Citicorp Nominees Pty Limited 31,192 0.10Hylec Investments Pty Ltd 25,194 0.08Kelvinside Pty Ltd 25,000 0.08Mr Malcolm Burns Reid 23,067 0.07Mr Ramesh Mahtani 21,700 0.07HSBC Custody Nominees (Australia) Limited 17,238 0.06Intercontinental Assets Pty Ltd 15,000 0.05Engoordina Pty Ltd 11,078 0.04Derrick Charles Whitaker 10,348 0.03Jennifer May Forbes 10,000 0.03Miss Shirin Moayyad 10,000 0.03Custodial Services Limited 8,768 0.03Mrs Mary Patricia Haughton 8,161 0.03Mrs Judith Scottholland 8,161 0.03Mrs Robin Anne Gostelow 7,393 0.02 30,715,618 99.06
Applicable LegislationThe Company is incorporated in Papua New Guinea and is not generally subject to Australian Corporations Law including, in particular, Chapter 6 of the Australian Corporations Law dealing with the acquisition of shares (including substantial shareholdings and takeovers). The Company is subject to the requirements of the Papua New Guinea Companies Act 1997, Securities Act 1997 and the Takeovers Code. The Companies Act and the Securities Act regulate the issue and buy-back of shares and contain provisions as to the trading in securities, provisions as to financial benefits to related parties, substantial shareholders provisions, remedies in cases of oppression or injustice and actions by, and access to, records by shareholders.
The Takeovers Code regulates offers where a person already holds more than 20% of the voting rights in a company or where a person becomes the holder of more than 20% of the voting rights in a manner permitted by the Code.
A code offer, which can either be a full offer or a partial offer, must be extended to all holders of voting securities in the Company. The Code also contains compulsory purchase and sale provisions if more than 90% of the shares are acquired under an offer.


Steamships Annual Report
COMPANY DIRECTORY
CHAIRMANG. L. Cundle §&
MANAGING DIRECTOR P.W. Langslow
FINANCE DIRECTOR M. R. Scantlebury
NON-EXECUTIVE DIRECTORSP. Aitsi MBEG. Aopi CBESir M.R. Bromley KBE §+&D. Cox OL, OBE +&G.J. Dunlop +&Lady W.T. Kamit, CBE +B.N. Swire &J. H Woodrow
+ Member of the Audit and Risk Committee § Member of the Remuneration Committee & Member of the Strategic Planning Committee
SECRETARYM.R. Scantlebury
REGISTERED OFFICELevel 5, Harbourside West, Stanley EsplanadeTelephone: +675 313 7400P.O. Box 1Port Moresby, NCDPapua New Guinea
AUDITORSPricewaterhouseCoopersP.O. Box 484Port Moresby, NCD Papua New Guinea
SHARE REGISTRARSComputershare Investor Services Pty LimitedGPO Box 2975Melbourne VIC 3001AUSTRALIATelephone: (Aus) 1300 85 05 05(Overseas) +61 (0)3 9415 4000Fax: +61 3 9473 2500
STOCK EXCHANGEShares are listed on both the Port Moresby Stock Exchange Limited and the Australian Securities Exchange Limited.
A. R. B. N.055 836 952