LOGIC MODEL GUIDE 8-08-02 - Purdue University
27
Dr. Susan Barkman Purdue University AGAD Room 229 615 W. State Street W. Lafayette, IN. 47907-2053 765/494-8436 [email protected] Utilizing the LOGIC MODEL for Program Design and Evaluation ID 270
Transcript of LOGIC MODEL GUIDE 8-08-02 - Purdue University
1234567890123456789012345678901212345678901234567890123456789012123412345678901234567890123456789012123456789012345678901234567890121234123456789012345678901234567890121234567890123456789012345678901212341234567890123456789012345678901212345678901234567890123456789012123412345678901234567890123456789012123456789012345678901234567890121234123456789012345678901234567890121234567890123456789012345678901212341234567890123456789012345678901212345678901234567890123456789012123412345678901234567890123456789012123456789012345678901234567890121234123456789012345678901234567890121234567890123456789012345678901212341234567890123456789012345678901212345678901234567890123456789012123412345678901234567890123456789012123456789012345678901234567890121234123456789012345678901234567890121234567890123456789012345678901212341234567890123456789012345678901212345678901234567890123456789012123412345678901234567890123456789012123456789012345678901234567890121234123456789012345678901234567890121234567890123456789012345678901212341234567890123456789012345678901212345678901234567890123456789012123412345678901234567890123456789012123456789012345678901234567890121234123456789012345678901234567890121234567890123456789012345678901212341234567890123456789012345678901212345678901234567890123456789012123412345678901234567890123456789012123456789012345678901234567890121234123456789012345678901234567890121234567890123456789012345678901212341234567890123456789012345678901212345678901234567890123456789012123412345678901234567890123456789012123456789012345678901234567890121234123456789012345678901234567890121234567890123456789012345678901212341234567890123456789012345678901212345678901234567890123456789012123412345678901234567890123456789012123456789012345678901234567890121234123456789012345678901234567890121234567890123456789012345678901212341234567890123456789012345678901212345678901234567890123456789012123412345678901234567890123456789012123456789012345678901234567890121234123456789012345678901234567890121234567890123456789012345678901212341234567890123456789012345678901212345678901234567890123456789012123412345678901234567890123456789012123456789012345678901234567890121234123456789012345678901234567890121234567890123456789012345678901212341234567890123456789012345678901212345678901234567890123456789012123412345678901234567890123456789012123456789012345678901234567890121234123456789012345678901234567890121234567890123456789012345678901212341234567890123456789012345678901212345678901234567890123456789012123412345678901234567890123456789012123456789012345678901234567890121234123456789012345678901234567890121234567890123456789012345678901212341234567890123456789012345678901212345678901234567890123456789012123412345678901234567890123456789012123456789012345678901234567890121234123456789012345678901234567890121234567890123456789012345678901212341234567890123456789012345678901212345678901234567890123456789012123412345678901234567890123456789012123456789012345678901234567890121234123456789012345678901234567890121234567890123456789012345678901212341234567890123456789012345678901212345678901234567890123456789012123412345678901234567890123456789012123456789012345678901234567890121234123456789012345678901234567890121234567890123456789012345678901212341234567890123456789012345678901212345678901234567890123456789012123412345678901234567890123456789012123456789012345678901234567890121234123456789012345678901234567890121234567890123456789012345678901212341234567890123456789012345678901212345678901234567890123456789012123412345678901234567890123456789012123456789012345678901234567890121234123456789012345678901234567890121234567890123456789012345678901212341234567890123456789012345678901212345678901234567890123456789012123412345678901234567890123456789012123456789012345678901234567890121234123456789012345678901234567890121234567890123456789012345678901212341234567890123456789012345678901212345678901234567890123456789012123412345678901234567890123456789012123456789012345678901234567890121234123456789012345678901234567890121234567890123456789012345678901212341234567890123456789012345678901212345678901234567890123456789012123412345678901234567890123456789012123456789012345678901234567890121234123456789012345678901234567890121234567890123456789012345678901212341234567890123456789012345678901212345678901234567890123456789012123412345678901234567890123456789012123456789012345678901234567890121234123456789012345678901234567890121234567890123456789012345678901212341234567890123456789012345678901212345678901234567890123456789012123412345678901234567890123456789012123456789012345678901234567890121234123456789012345678901234567890121234567890123456789012345678901212341234567890123456789012345678901212345678901234567890123456789012123412345678901234567890123456789012123456789012345678901234567890121234123456789012345678901234567890121234567890123456789012345678901212341234567890123456789012345678901212345678901234567890123456789012123412345678901234567890123456789012123456789012345678901234567890121234123456789012345678901234567890121234567890123456789012345678901212341234567890123456789012345678901212345678901234567890123456789012123412345678901234567890123456789012123456789012345678901234567890121234123456789012345678901234567890121234567890123456789012345678901212341234567890123456789012345678901212345678901234567890123456789012123412345678901234567890123456789012123456789012345678901234567890121234123456789012345678901234567890121234567890123456789012345678901212341234567890123456789012345678901212345678901234567890123456789012123412345678901234567890123456789012123456789012345678901234567890121234
Dr. Susan BarkmanPurdue UniversityAGAD Room 229615 W. State StreetW. Lafayette, IN. 47907-2053765/[email protected]
Utilizing the
LOGIC MODELfor Program Design
and Evaluation
ID 270
2
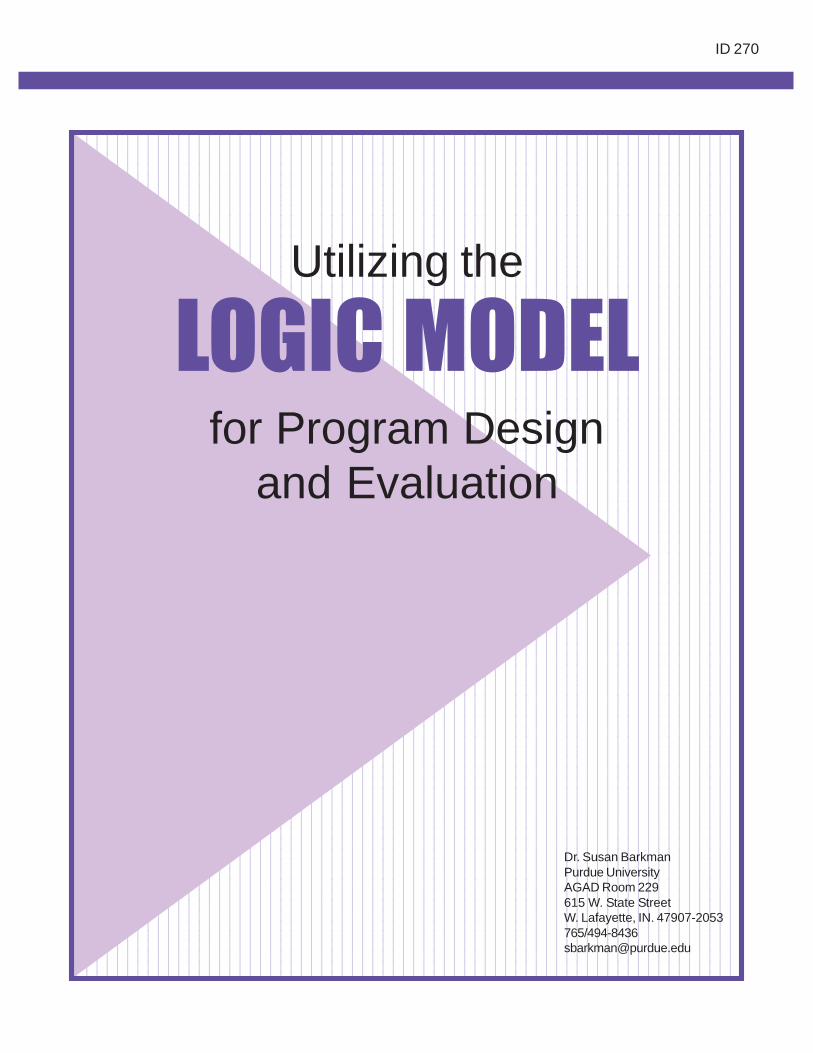
Glossary of Important Outcome Measurement Terms
baseline - data about the condition or performance prior to the educational intervention
(i.e. statewide % of low-birth weight; number of vandalism reports; standardized test scores; school dropout rate; number of accidents involving teen drivers; recidivism rate; water quality)
benchmarks - performance data used either as a baseline against which to compare future performance or as a marker to assess progress towards a goal
(i.e., periodic behavior checklist ratings; amount of debt; academic grades)
evaluation - the systematic collection and analysis of information to determine the worth of a curriculum, program or activity
input - resources that go into a program to achieve its goals, outputs and outcomes
(i.e., staff, volunteers, time, money, materials, equipment, technology, partners)
impact - the long-term outcomes of a program
(i.e., social, economic, civic or environmental impact)
outcomes - end results or benefits the participants get from a program. Outcomes can be:
• intended or unintended • positive or negative
Outcomes fall along a continuum from immediate to short-term to long-term. Long- term outcomes are called impact. Examples are listed below.
immediate outcomes - awareness created, knowledge gained, attitudes changed, skills developed, aspirations sparked
short-term outcomes - behavior changed, practice adopted, decisions made, policies changed or adopted, social action initiated
long-term outcomes - social, economic, civic, environmental impact
outcome indicators - the observable, measurable characteristics or changes that represent achievement of an outcome
(i.e., absenteeism, score on an attitude survey or completed homework assignment could all be indicators for developing a positive attitude towards school)
outcome target - numerical objective for a program's level of achievement
(i.e., percent, number, quality rating)
outputs - activities, products, services, and participation that result from the inputs
(i.e., activities such as workshops, camps, curriculum, publications, media event, web site, projects, test plots, field days, and the number, characteristics, and reactions of participants)
qualitative methodology - methods that examine, describe or interpret phenomena
(i.e., observation, open-ended interviewing, and document review)
quantitative methodology - refers to an approach involving the use of numerical measurement and data analysis methodology
(i.e., standardized, structured data collection including surveys, closed-ended interviews, tests and behavior checklists)
reliability - the extent to which measures from an instrument are consistent. Reliability is usually measured by a Cronbach Alpha. The closer an alpha is to 1.0, the more reliable the instrument
( i.e., an instrument with a .85 is more reliable than one with .65. No instrument can have a reliability of 1.00)
validity - the extent to which a measure from an instrument actually captures the concept being measured
3
Evaluation - What Is It? Evaluation means different things to different people and takes place in different contexts. Although many definitions have been developed, the one most appropriate for use within the Extension context is: "The systematic collection and analysis of information to determine the worth of a curriculum, program or activity." (Alkin 1990) The word systematic means the evaluation must be planned as an integral part of the design or planning process. It is not just an "event" that occurs at the end. Worth can be a measure of: 1. the quality or satisfaction level leading to
program improvement, or 2. the effectiveness as a means to
demonstrate the impact of the program or that the targeted outcomes have been achieved.
Both kinds of "worth" continue to be important for Extension professionals. However because of the increased accountability demands, this manual will focus primarily on measuring the impact of programs, otherwise called "outcome evaluation."
Why Measure Outcomes? Basically, the answer to that question is to see if programs really make a difference in the lives of the participants and communities. As you gather outcome data, it can be used in a variety of ways:
• To help improve programs and services.
• To be accountable in order to retain or increase funding.
• To gain valuable information to use in decision making and long range planning.
• To focus programs that can really make a difference for participants.
• To determine cost-effectiveness.
• To gain support from the community to aid in sustainability.
• To gain public and professional recognition as a quality program.
• To attract new participants • To recruit and retain talented staff. • To recruit and motivate volunteers. • To take pride in accomplishment.
Remember an outcome measurement provides an ongoing means for educators and specialists to track the percent of participants that achieved the targeted outcomes, but it does not prove that the program, and the program alone, caused the outcomes. This is a key difference between outcome measurement and program impact research, which uses sophisticated statistical methods and random assignment of participants to either the program or to a control group.
Levels of Outcomes Each program is unique and aimed at achieving a range of different outcomes. As you are developing your evaluation plan, it is important to define what you want to evaluate. In some cases, you may only be interested in finding out how participants responded to your teaching style or how satisfied they were with a program. This is good information to help you improve the program next time. In other cases, you want to document the impact the program had on the participants or whether the program achieved the targeted outcomes. Don't expect to measure impact from a single workshop or behavior changes from a program with limited contact hours (i.e., 45-minute school enrichment program, 1 1/2-hour training). The point is to tailor your evaluation to fit the program. Remember, not all Extension work needs to be formally evaluated. Be selective and think about what information is needed and how it will be used. If you are interested in outcome evaluation, here's a framework for thinking about different levels of outcomes.

4
Outcomes can be classified under three major levels: learning, action and impact. The specific outcomes you can measure are as follows. LEARNING LEVEL Immediate
Awareness Created Knowledge Gained Attitudes Changed Skills Developed Aspirations Sparked ACTION LEVEL Behavior Changed Practice Adopted Decisions Made Policies Changed or Adopted Social Action Initiated IMPACT LEVEL Social Impact Economic Impact Civic Impact Environmental Impact Long-Term It is important to determine the level of outcome you desire to reach as you plan your program. Your evaluation should be an integral part of the program planning process and not an afterthought. Remember, outcomes may be positive, negative, or neutral; intended or unintended.
Program Logic Model One effective method for linking program design and evaluation is the program logic model. A program logic model is a picture of how your program works - the theory and assumptions underlying the program. This model provides a roadmap for your program, outlining how it is expected to work, what activities need to come before others, and how desired outcomes are achieved. In simple terms, it gives a visual picture of what inputs and outputs are needed to achieve the desired outcomes.
INPUTS What resources and contributions by Extension and others are needed to achieve our goals?
• people (staff, partners, volunteers) • time • money • materials • equipment • technology
These inputs are converted into OUTPUTS What activities do we need to conduct to ensure our goals are met?
• workshops • meetings • publications • media events • web site • test plots • field days • projects
Who needs to participate, be involved or reached?
• characteristics (youth, parents, leaders, mothers on WIC, etc.)
• number • their reactions
These outputs are intended to achieve certain OUTCOMES These are the changes that occur for children, youth, families, groups, communities, organizations, and systems. Outcomes range from immediate to long-range; from learning to action to social, economic, and environmental impact. These are listed in the first column of this page.
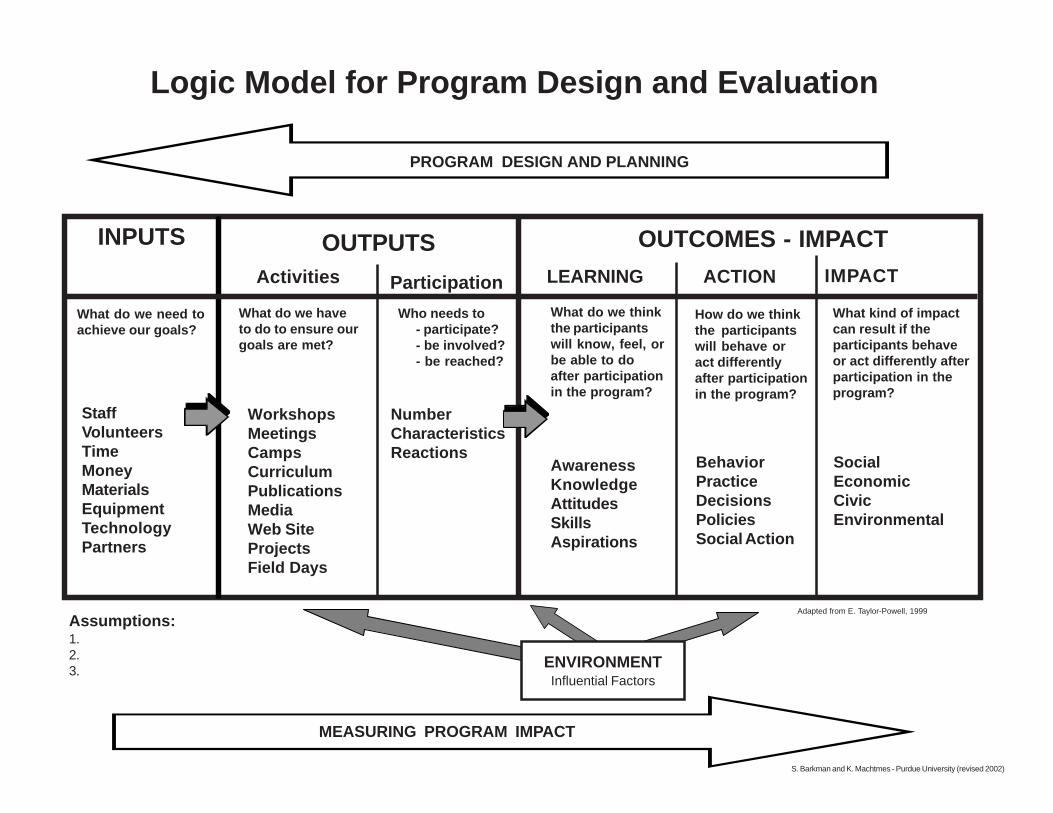
Logic Model for Program Design and Evaluation
Assumptions:1.2.3.
Adapted from E. Taylor-Powell, 1999
S. Barkman and K. Machtmes - Purdue University (revised 2002)
INPUTS OUTPUTS OUTCOMES - IMPACT
Activities Participation
ENVIRONMENTInfluential Factors
What do we need toachieve our goals?
What do we haveto do to ensure ourgoals are met?
Who needs to- participate?- be involved?- be reached?
What do we thinkthe participantswill know, feel, orbe able to doafter participationin the program?
How do we thinkthe participantswill behave oract differentlyafter participationin the program?
What kind of impactcan result if theparticipants behaveor act differently afterparticipation in theprogram?
LEARNING ACTION IMPACT
StaffVolunteersTimeMoneyMaterialsEquipmentTechnologyPartners
WorkshopsMeetingsCampsCurriculumPublicationsMediaWeb SiteProjectsField Days
NumberCharacteristicsReactions
AwarenessKnowledgeAttitudesSkillsAspirations
BehaviorPracticeDecisionsPoliciesSocial Action
SocialEconomicCivicEnvironmental
PROGRAM DESIGN AND PLANNING
MEASURING PROGRAM IMPACT
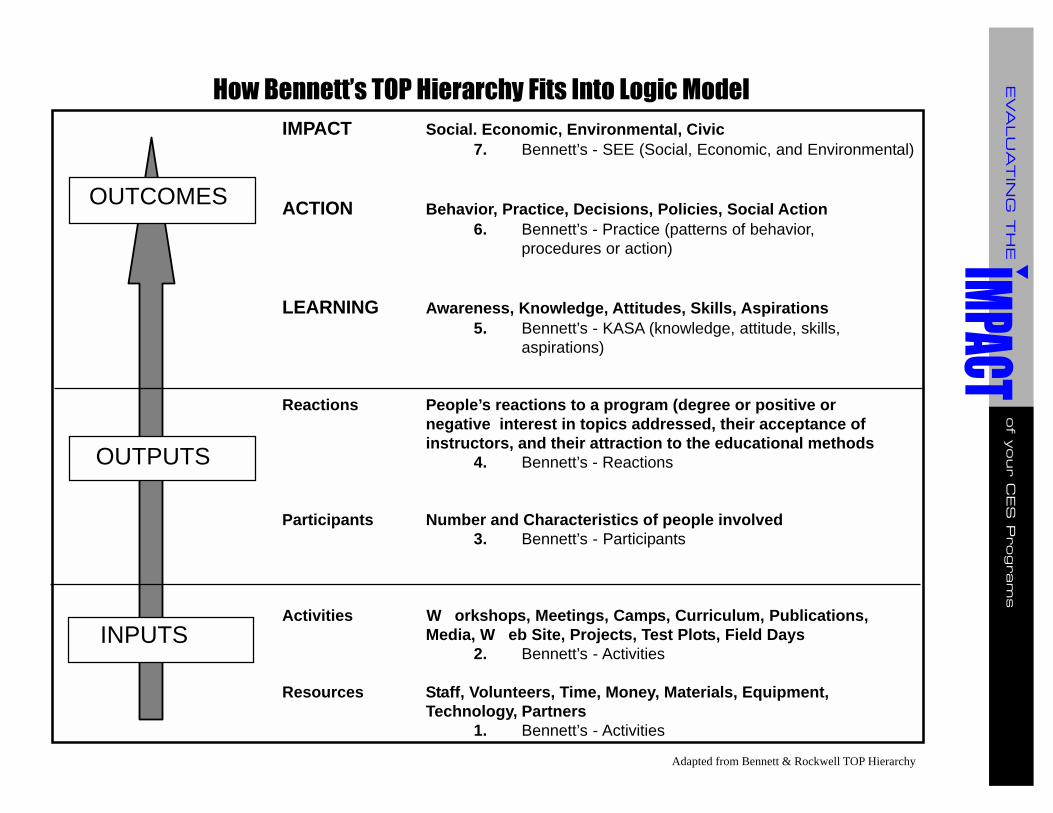
IMPACT Social. Economic, Environmental, Civic7. Bennett’s - SEE (Social, Economic, and Environmental)
ACTION Behavior, Practice, Decisions, Policies, Social Action6. Bennett’s - Practice (patterns of behavior,
procedures or action)
LEARNING Awareness, Knowledge, Attitudes, Skills, Aspirations5. Bennett’s - KASA (knowledge, attitude, skills,
aspirations)
Reactions People’s reactions to a program (degree or positive ornegative interest in topics addressed, their acceptance ofinstructors, and their attraction to the educational methods
4. Bennett’s - Reactions
Participants Number and Characteristics of people involved3. Bennett’s - Participants
Activities W orkshops, Meetings, Camps, Curriculum, Publications,Media, W eb Site, Projects, Test Plots, Field Days
2. Bennett’s - Activities
Resources Staff, Volunteers, Time, Money, Materials, Equipment,Technology, Partners
1. Bennett’s - Activities
OUTCOMES
OUTPUTS
INPUTS
Adapted from Bennett & Rockwell TOP Hierarchy
How Bennett’s TOP Hierarchy Fits Into Logic Model

7
How Does the Logic Model Work? The logic model is really a sequence that shows the logical relationship between inputs, outputs, and outcomes. IF then IF then IF INPUTS OUTPUTS OUTCOMES A logic model displays the chain of events that will effect changes and achieve your targeted outcomes. You might think about this as a series of if-then relationships. Here are some examples of this relationship. If the "Have a Healthy Baby program" teaches about the importance of good nutrition and avoidance of smoking and drugs for a baby's health (outputs), then pregnant teens acquire the knowledge, change their attitude, and gain skills to eat more nutritiously (immediate outcomes). If pregnant teens know about and want to eat nutritiously, then they will eat nutritious meals (short-term outcomes). If they eat more nutritiously, then their baby will be born healthy (longer-term outcomes.) If teens receive SERIES training on giving effective presentations and teaching younger youth (outputs), then they will acquire the knowledge and skills to be a good instructor (immediate outcomes). If teens have the knowledge and are given the opportunity to practice teaching, then they will improve their communication and teaching skills and become effective instructors (short-term outcomes). If the pesticide application training program teaches farmers how to apply the correct amount of pesticides per acre (outputs), then they will gain the knowledge and skills to use pesticides appropriately (immediate outcomes). If farmers apply pesticides appropriately, then pesticide runoff is reduced (short-term outcomes). If pesticide runoff is reduced, then the environment and ground water will not be polluted (longer-term outcomes).
Underlying each of these if-then relationships are a number of assumptions. Assumptions are the beliefs we have about the program and the way we think it will work; principles that are guiding the program. In addition, you need to consider the environment (context) in which this relationship is occurring. IF then IF then IF INPUTS OUTPUTS OUTCOMES Assumptions: 1. 2. Environment 3.
In the first example, there are two major assumptions: 1. that good nutrition and avoidance of
caffeine, alcohol, cigarettes, and drugs will produce a healthy baby.
2. that a teen mother's desire to have a healthy baby is stronger than the desire to eat junk food, drink caffeine or alcohol, smoke, or use drugs.
In the second example, there is one major assumption: 1. that SERIES training provides all the
information and practice needed to be an effective instructor.
In the third example, there two major assumptions: 1. that over application of pesticides on a
field increases the possibility of pesticide contamination of the ground water.
2. that pesticide runoff pollutes the ground water and the environment.
When you are developing your logic model, think about the underlying assumptions.
• Are they realistic and sound? • What evidence do you have to
support your assumptions?
You also need to think about the environment (the context and external conditions) in which the program exists and influences the success of the program.
8
Why Create a Logic Model? There are several reasons why you may want to create a logic model before you begin implementing your program.
• It can be a tool to use with stakeholders to build consensus around what a program's inputs, outputs (activities and participation), and outcomes look like.
• It creates a sense of ownership among stakeholders.
• It helps bring detail to broad, fuzzy goals. • It shows the "chain of events” that link
inputs to results. • It summarizes the key elements of your
program and how it is intended to work. • It clarifies the difference between activities
and outcomes. • It provides an easy way to monitor your
program's progress and make needed changes.
• It helps focus the evaluation. • It can be used to easily explain the
program to others or funders. • It can be used in funding proposals.
Benefits to Using a Logic Model
• Helps identify appropriate evaluation questions.
• Summarizes complex program to communicate with internal and external stakeholders.
• Builds underlying rationale and expectations.
• Identifies gaps in logic and uncertain assumptions.
Cautions
� The logic model represents a reality that is somewhat inaccurate:
- programs are not linear - programs are dynamic interrelationships that rarely follow a sequential order
� Logic model focuses on expected
outcomes, making it easy to miss unexpected outcomes.
� There is a challenge of causal attribution - many factors influence outcomes
(Taylor-Powell, 1999)
Deciding What Outcome(s)
to Measure Determining what outcome(s) to measure is not always an easy decision. There is no required number of outcomes for a program. • The more immediate the outcome, the
more influence a program generally has on its achievement. (United Way, 1996)
• Conversely, the farther the outcome
occurs from the program, the less direct influence a program has over its achievement and the greater the likelihood that other, extraneous forces have intervened. (United Way, 1996)
It is important to determine what the goal of interest is for you and your stakeholders by asking the question, "What do you want to have happen as a result of this program, curriculum, or activity?" That then becomes your "targeted outcome(s).”
Checklist for Outcomes
An outcome should meet all three tests. � Is it reasonable to believe the program can
influence the outcome in a non-trivial way? � Would measurement of this outcome help
identify program successes and help point out shortcomings?
� Will the program's various stakeholders
accept this as a valid outcome of the program?
Once you have examined each outcome to see if it meets the above tests, review your logic model using the checklist on the next page. Then you are ready to determine how you will measure your targeted outcomes.

9
Checklist for Your Program Logic Model and Outcomes
Does the Logic Model:
Include a listing of all inputs that will be needed for this program? (staff, volunteers, time, money, materials, equipment, technology, partners) Include details of the activities listed? (duration, days per week, month, etc; number of sessions; contact hours; location,
etc.) Include a list of the characteristics and intended number of targeted
participants? (youth ages 8-12, pregnant teens, families on welfare, etc.) Make sequential and logical connections between inputs (activities,
participation), outputs, and outcomes? ( 'If" and "then" statements are sequential and logical)
Do Targeted Outcome(s): Help fulfill Extension's mission? Represent meaningful benefits or changes for participants? Seem reasonable as a result of program participants in a non-trivial
way? Clearly define the intended scope of the program's influence? Help educators identify both points of success and problems the
program can correct? Provide data that is likely to be effective in communicating benefits to
stakeholders?
If all of the above items are checked, then you are ready to specify the indicators for your outcomes and where and how you will collect the data.
Susan J. Barkman, Purdue University (2000)
10
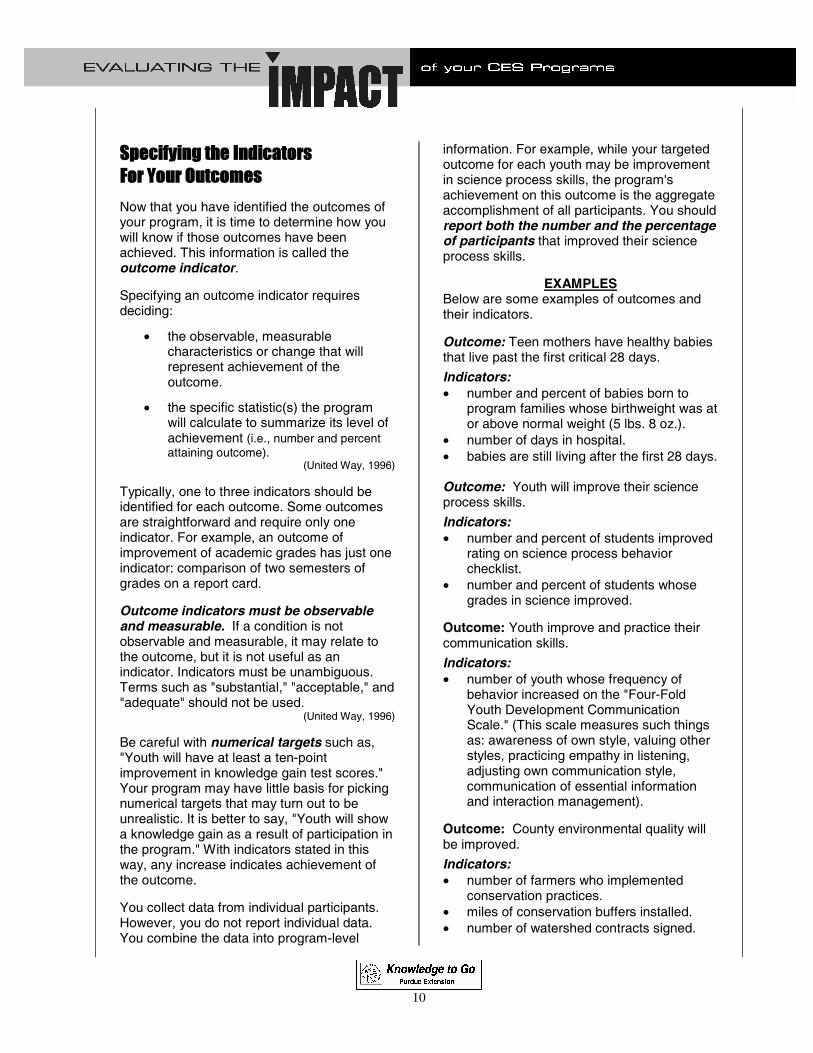
Specifying the Indicators
For Your Outcomes Now that you have identified the outcomes of your program, it is time to determine how you will know if those outcomes have been achieved. This information is called the outcome indicator. Specifying an outcome indicator requires deciding:
• the observable, measurable characteristics or change that will represent achievement of the outcome.
• the specific statistic(s) the program will calculate to summarize its level of achievement (i.e., number and percent attaining outcome).
(United Way, 1996) Typically, one to three indicators should be identified for each outcome. Some outcomes are straightforward and require only one indicator. For example, an outcome of improvement of academic grades has just one indicator: comparison of two semesters of grades on a report card. Outcome indicators must be observable and measurable. If a condition is not observable and measurable, it may relate to the outcome, but it is not useful as an indicator. Indicators must be unambiguous. Terms such as "substantial," "acceptable," and "adequate" should not be used.
(United Way, 1996) Be careful with numerical targets such as, "Youth will have at least a ten-point improvement in knowledge gain test scores." Your program may have little basis for picking numerical targets that may turn out to be unrealistic. It is better to say, "Youth will show a knowledge gain as a result of participation in the program." With indicators stated in this way, any increase indicates achievement of the outcome. You collect data from individual participants. However, you do not report individual data. You combine the data into program-level
information. For example, while your targeted outcome for each youth may be improvement in science process skills, the program's achievement on this outcome is the aggregate accomplishment of all participants. You should report both the number and the percentage of participants that improved their science process skills.
EXAMPLES Below are some examples of outcomes and their indicators. Outcome: Teen mothers have healthy babies that live past the first critical 28 days.
Indicators: • number and percent of babies born to
program families whose birthweight was at or above normal weight (5 lbs. 8 oz.).
• number of days in hospital. • babies are still living after the first 28 days. Outcome: Youth will improve their science process skills.
Indicators: • number and percent of students improved
rating on science process behavior checklist.
• number and percent of students whose grades in science improved.
Outcome: Youth improve and practice their communication skills.
Indicators: • number of youth whose frequency of
behavior increased on the "Four-Fold Youth Development Communication Scale." (This scale measures such things as: awareness of own style, valuing other styles, practicing empathy in listening, adjusting own communication style, communication of essential information and interaction management).
Outcome: County environmental quality will be improved.
Indicators: • number of farmers who implemented
conservation practices. • miles of conservation buffers installed. • number of watershed contracts signed.

11
Data Sources Not all data has to be collected from an evaluation instrument. Data can be collected from a variety of sources. Here's a listing of some possible sources. Existing Records/Data Information or records that already exist or can be obtained with minimal planning. • program documents such as statistical
reports, logs, enrollment reports, receipts • existing databases such as census data,
housing tracts, SIFT, Kids Count, school records, industry records, crime rates, police reports, ag statistics data, justice, social, and health agency records, employment records
• home or business records, such as home or farm financial record books
• county, program, or life histories Case Study • in-depth examination of a particular case
(program, group of participants, single individual, site/location). Case studies use multiple sources of information and methods to provide as complete a picture as possible
Document Analysis • use of content analysis and other
techniques to analyze and summarize printed material and existing information
Diaries or Journal • recording of events over time revealing the
personal responses and reactions Expert of Peer Review • examination by a review committee, panel
of experts, or peers Group Assessment • use of the group process to collect
evaluation information Interviews • collecting information through talking and
listening to people, either face-to-face or over the telephone
Log • recording of chronological entries which
are usually brief and factual Observation • collecting information through "seeing"
and "listening." Observation may be structured using a criteria checklist or unstructured
Portfolio Reviews • collection of materials, including samples
of work that encompass the breadth and scope of the program/activity being evaluated
Photographs, Videos • use of photographs or videos to capture
visual changes as a result of a program Product Assessment • compare writings or work by participants
over time (can use rubric to make a quantitative analysis)
Surveys • collecting standardized information
through structured questionnaires or generate quantitative data.
• surveys can be mailed, sent electronically, completed on-site, face-to-face, or on the telephone
Tests • use of established standards to assess
knowledge, skill, or performance. (i.e., pre/post-test, post/post-test) Testimonials (anecdotal data) • individual statements by people indicating
personal responses and reactions (i.e., current 4-H'er stating the positive impact 4-H has had on their lives, an adult expressing gratitude for being able to get off welfare and get her first job)
12
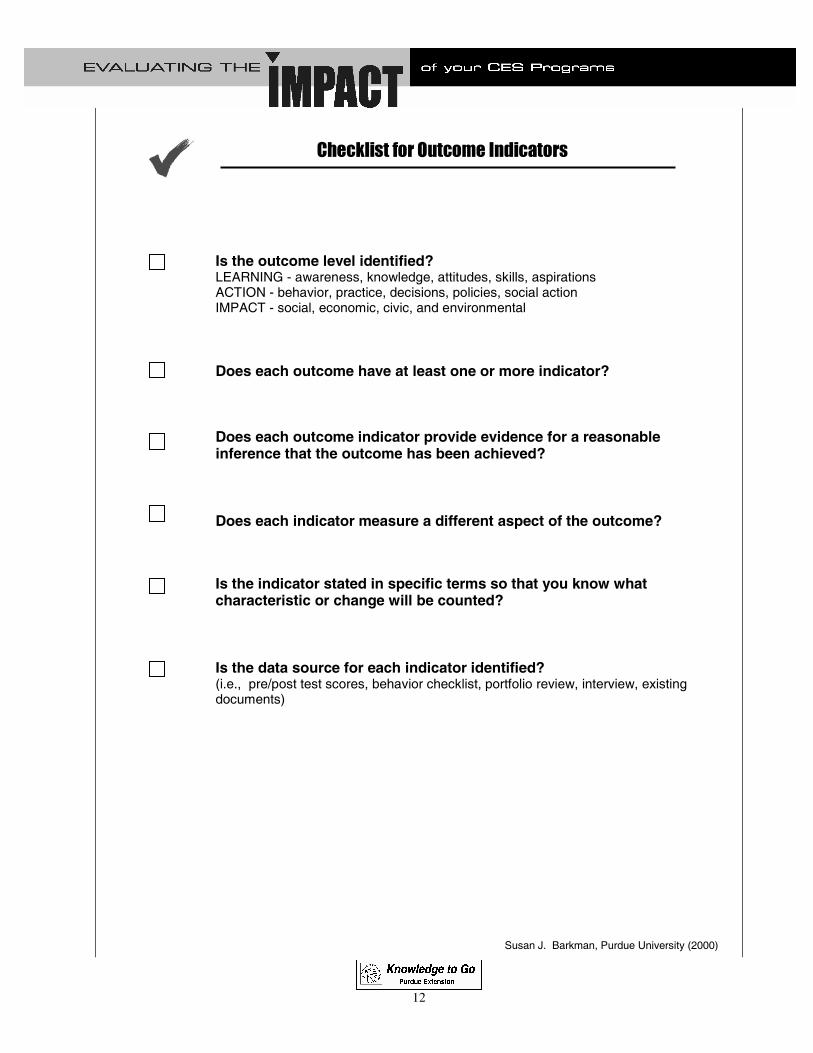
Checklist for Outcome Indicators
Is the outcome level identified? LEARNING - awareness, knowledge, attitudes, skills, aspirations ACTION - behavior, practice, decisions, policies, social action IMPACT - social, economic, civic, and environmental
Does each outcome have at least one or more indicator? Does each outcome indicator provide evidence for a reasonable
inference that the outcome has been achieved? Does each indicator measure a different aspect of the outcome?
Is the indicator stated in specific terms so that you know what characteristic or change will be counted?
Is the data source for each indicator identified? (i.e., pre/post test scores, behavior checklist, portfolio review, interview, existing
documents)
Susan J. Barkman, Purdue University (2000)
13
What Demographic Data to Collect? As you know by experience, not all participants achieve outcomes at the same level. You need to know what factors could influence a participant's achievement of the targeted outcomes. The demographics you collect could help you determine if these differences in achievement are related to a participant or to the program. By collecting this information you are able to break the data out based on the demographic characteristics and determine if it had an affect on achievement. This information is usually collected before the educational intervention. For example, if you are looking at the improvement of leadership and communication skills in teen leaders, you might want to determine their past experience in those areas (i.e., have they been in the public speaking or demonstration contest? If so, how many times? Have they served as an officer of a 4-H club or other organization? etc.) Here's a list of some types of demographic categories and some examples of data you could want to collect: • characteristics of participants age group race/ethnicity grade educational level sex household income group • geographic location neighborhood school
county city census tract
• delivery method club school enrichment television home study course group workshop one-to-one consultation hours of training computer
Your data should be grouped and analyzed by demographic categories to determine if demographics had an effect on the achievement level of the targeted outcome.
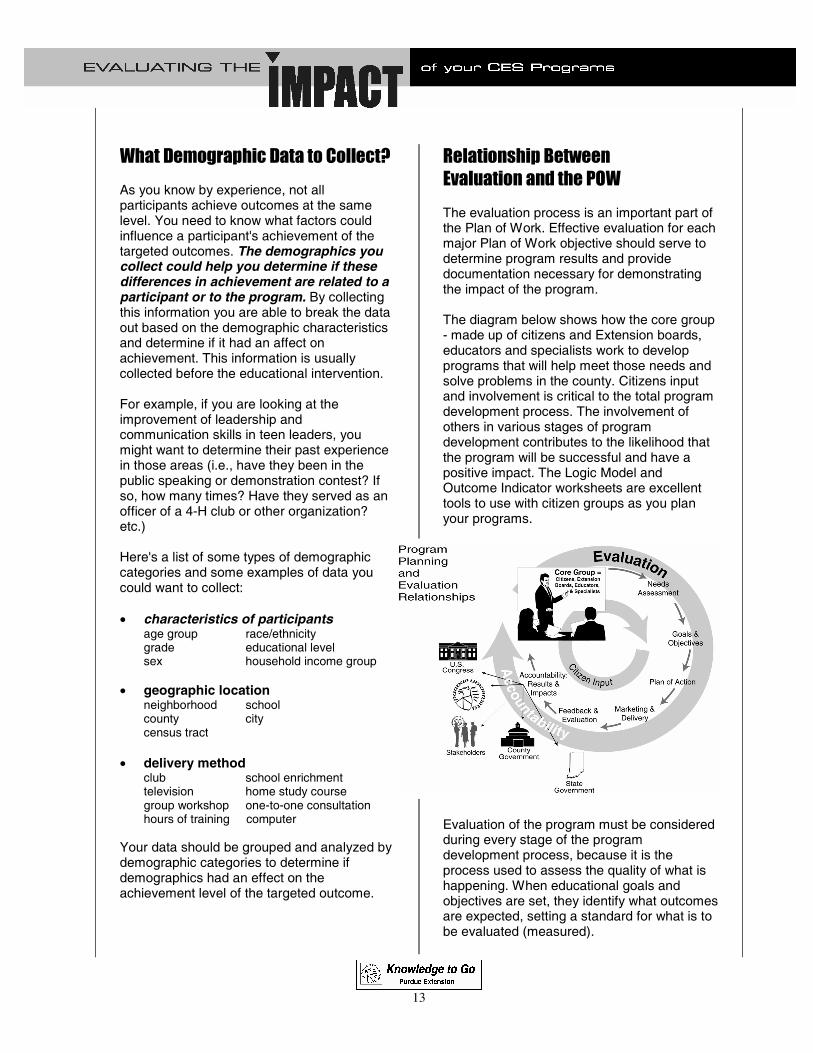
Relationship Between
Evaluation and the POW The evaluation process is an important part of the Plan of Work. Effective evaluation for each major Plan of Work objective should serve to determine program results and provide documentation necessary for demonstrating the impact of the program. The diagram below shows how the core group - made up of citizens and Extension boards, educators and specialists work to develop programs that will help meet those needs and solve problems in the county. Citizens input and involvement is critical to the total program development process. The involvement of others in various stages of program development contributes to the likelihood that the program will be successful and have a positive impact. The Logic Model and Outcome Indicator worksheets are excellent tools to use with citizen groups as you plan your programs. Evaluation of the program must be considered during every stage of the program development process, because it is the process used to assess the quality of what is happening. When educational goals and objectives are set, they identify what outcomes are expected, setting a standard for what is to be evaluated (measured).
14
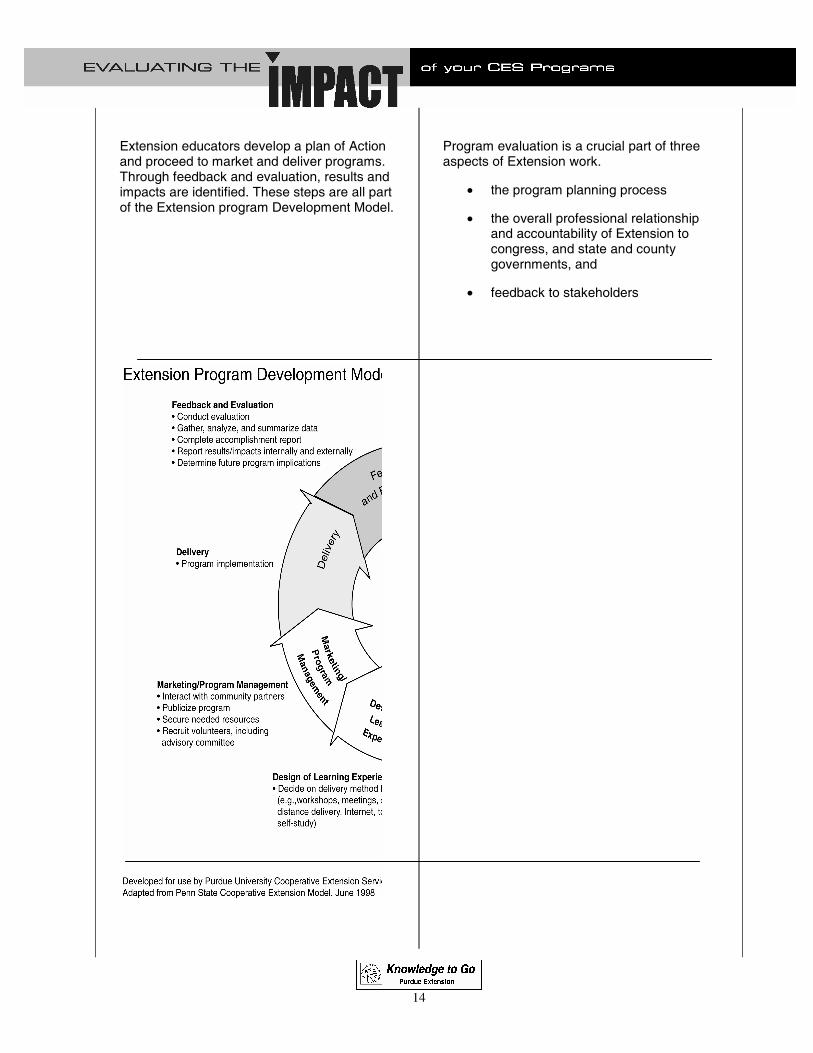
Extension educators develop a plan of Action and proceed to market and deliver programs. Through feedback and evaluation, results and impacts are identified. These steps are all part of the Extension program Development Model.
Program evaluation is a crucial part of three aspects of Extension work.
• the program planning process
• the overall professional relationship and accountability of Extension to congress, and state and county governments, and
• feedback to stakeholders

15
References and Additional Resources on Evaluation Alkin, Marvin C. (1990). Debates on Evaluation, Newbury Park, SAGE Publications. Alter, C. & Eagan, M. (1997). Logic modeling: A tool for teaching critical thinking in social work
practice. Journal of Social Work Education, 33 (1). Alter, C. & Murty, S. (1997). Logic modeling: A tool for teaching practice evaluation. Journal of Social
Work Education, 33 (1). Association for Supervision and Curriculum and Development. (1997). Topic pack: Performance
assessment. Alexandria, VA: ASCD. Association for Supervision and Curriculum Development. (1997). Topic pack: School-to-work/
apprenticeships. Alexandria, VA: ASCD. Association for Supervision and Curriculum Development. (1997). Topic pack: Student portfolios.
Alexandria, VA: ASCD. Barber, J., Bergman, L., Goodman, J.M., Hosoume, K., Lipner, L., Sneider, C., & Tucker, L. (1995).
Insights & outcomes: Assessments for great explorations in math and science. Berkley, CA: The Regents of the University of California.
Barkman, S.J., & Machtmes, K.L. (2000). Evaluating the impact of youth development programs; user
guide (4-H 913). West Lafayette, IN: Purdue University. Barkman, S.J. & Machtmes, K.L., et. al. (1999). Evaluating 4-H curriculum through the design
process; pilot testing and collecting data for the 4-H national jury review process (4-H 898). West Lafayette, IN: Purdue University and The Ohio State University. Bennett, C. & Rockwell, K. (1995). Targeting outcomes of program (TOP): An integrated approach to
planning and evaluation, http://deal.unl.edu/TOP/ Black, T. R. (1999). Doing quantitative research in the social sciences: An integrated approach to
research design, measurement, and statistics. Thousand Oaks, CA: SAGE Publications. Boyatzis, R. E. (1998). Transforming qualitative information: Thematic analysis and code
development. Thousand Oaks, CA: SAGE Publications. Center for Substance Abuse Prevention. (1993). Measurements in prevention: A manual on
selecting and using instruments to evaluate prevention programs. United States Department of Health and Human Services.
Creswell, J. W. (1998). Qualitative inquiry and research design: Choosing among five traditions.
Thousand Oaks, CA: SAGE Publications. Dahlberg, L.L., Toal, S.B., & Behrens, C.B. (1998). Measuring violence -related attitudes, beliefs,
and behaviors among youths: A compendium of assessment tools. Atlanta, GA: Centers for Disease Control and Prevention.

16
Danielson, C. (1997) A collection of performance tasks and rubrics upper elementary school
mathematics. Larchmont, NY: Eye on Education. Dick, W., & Carey, L. (1996) The systematic design of instruction. (4th ed.). New York: Addison-
Wesley Longman, Inc. Doran, D.,Chan, F.,& Tamir, P. (1998). Science educator’s guide to assessment. Arlington, VA:
National Science Teachers Association. Educators in Connecticut’s Pomperaug Regional School District 15. (1996). A teacher’s guide to
performance-based learning and assessment. Alexandria, VA: Association for Supervision and Curriculum Development.
Erickson, R. C. & Wentling, T. L. (1988). Measuring student growth: Techniques and procedures for
occupational education (Revised Ed.) Urbana, IL: Griffon Press. Fink, A. (1995). The survey kit (Vols. 1-9). Thousand Oaks, CA: SAGE Publications. Fitz-Gibbon, C. T., & Morris, L. L. (1987) How to analyze data. Newbury Park, CA: SAGE
Publications. Fitz-Gibbon, C. T., & Morris, L. L.(1987). How to design a program evaluation. Newbury Park, CA:
SAGE Publications. Freedman, R. L. H. (1994). Open-ended questioning: A handbook for educators. New York:
Addison-Wesley. Gall, M. D., Borg, W. R., & Gall, J. P. (1996). Educational research: An introduction (6th ed.) New
York: Longman Publishers. Glatthorn, A. A., Bradaw, D., Dawkins, K., & Parker, J. (1998). Performance assessment and
standards-based curricula: The achievement cycle. Larchmont, NY: Eye on Education Greig, A., & Taylor, J. (1999). Doing research with children. Thousand Oaks, CA: SAGE
Publications. Have, P. T. (1999). Doing conversation analysis: A practical guide. Thousand Oaks, CA: SAGE
Publications. Herman, J. L., Morris, L. L., & Fitz-Gibbon, C. T. (1987). Evaluator’s handbook. Newbury Park, CA:
SAGE Publications. Johnson, B. (1996). The performance assessment handbook: Volume one portfolios & Socratic
seminars. Princeton, NJ: Eye On Education. Johnson, B. (1996). The performance assessment handbook: Volume two performances &
exhibitions. Princeton, NJ: Eye on Education. Kellogg Foundation (1998). W. Kellogg Foundation evaluation handbook. Battle Creek, MI: W.K.
Kellogg Foundation.

17
King, J. A., Morris L. L., & Fitz-Gibbon, C. T. (1987). How to assess program implementation.
Newbury Park, CA: SAGE Publications. Krueger, R. A. (1998). Developing questions for focus groups. Thousand Oaks, CA: SAGE
Publications. Krueger, A. R. (1998). Moderating focus groups. Thousand Oaks, CA: SAGE Publications. Krueger, R. A. & Jean A. K. (1998). Involving community members in focus groups. Thousand
Oaks, CA: SAGE Publications. Krueger, R. A. (1998). Analyzing & report focuses group results. Thousand Oaks, CA: SAGE
Publications. Kubiszyn, T. & Borich, G. (1996). Educational testing and measurement: Classroom application
and practice (5th ed.) Harper Collins College Publishers. Kvale, S. (1996). Interviews: An introduction to qualitative research interviewing. Thousand Oaks,
CA: SAGE Publications. Lee, T.W. (1999). Using qualitative methods in organizational research. Thousand Oaks, CA:
SAGE Publications. Maxwell , J. A. (1996). Qualitative research design: An Interactive Approach.(Vol. 41) Thousand
Oaks, CA: SAGE Publications. McLaughlin, J. & Jordon, G. (1999). Logic models: A tool for telling your program's performance
story. Evaluation & Program Planning, (22). McMillan, J. H. & Schumacher, S. (1997). Research in education: A conceptual introduction (4th
ed.) New York: Longman Inc. Miles, M. B. & Huberman, A.M. (1994) An expanded sourcebook: Qualitative data analysis (2nd
ed.) Thousand Oaks, CA: SAGE Publications. Mohr, L. B. (1995). Impact analysis for program evaluation. (2nd ed.) Thousand Oaks, CA: SAGE
Publications. Morgan, D. L. (1998). Planning focus groups. Thousand Oaks, CA: SAGE Publications. Morgan, D. L. (1998). The focus group guidebook. Thousand Oaks, CA: SAGE Publications. Morris, L. L., Fitz-Gibbon, C. T., & Freeman, M.E. (1987). How to communicate evaluation findings.
Newbury Park, CA: SAGE Publications. Morris, L. L., Fitz-Gibbon, C.T., & Lindheim, E. (1987). How to measure performance and use tests.
Newbury Park, CA: SAGE Publications. Ostlund, K. L. (1992). Science process skills: Assessing hands-on student performance. Menlo
Park, CA: Addison-Wesley Publishing Company. Patton, M. Q. (1987). How to use qualitative methods in evaluation. Newbury Park, CA: SAGE
Publications.
18
Patton, M.Q. (1997). Utilization-focused evaluation (3rd ed.) Thousand Oaks, CA: Sage Publications. Reisman, J. & Mockler (1994). A field guide to outcome-based program evaluation. Organization
Research Services, Inc. Clegg & Associates, Inc. Resisman, J. & Clegg, J. (1999). Outcomes for success! Organization Research Services, Inc. Clegg
& Associates, Inc. Rezba, R. J., Sprague, C., Feil, R. L., & Funk, H. J. (1995). Learning and assessing science process
skills (3rd ed.) Dubuque, Iowa: Kindall/Hunt Publishing Company. Rossi, P. H., Freeman, H. E., & Lipsey, M. W. (1999). Evaluation: A systematic approach ( 6th ed.)
Thousand Oaks, CA: SAGE publications. Rubin, H. J., & Rubin, I. S. (1995). Qualitative interviewing: The art of hearing data. Thousand
Oaks, CA: SAGE Publications. Scales, P. C., & Leffert, R. M. (1999). Developmental assets: A synthesis of the scientific research
on adolescent development. Minneapolis, MN: Search Institute. Schwandt, T. A. (1997). Qualitative inquiry: A dictionary of terms. Thousand Oaks, CA: SAGE
Publications. Scriven, M. (1991). Evaluation thesaurus (4th ed.) Thousand Oaks, CA: SAGE Publications. Stecher, B. M., & Davis, W. A. (1987). How to focus an evaluation. Newbury Park, CA: SAGE
Publications. Substance Abuse and Mental Health Services Administration. (1998). A guide for evaluating
prevention effectiveness. Department of Health and Human Services. Tashakkori, A., & Teddlie, C. (1998). Mixed methodology: Combing qualitative and quantitative
approaches. Thousand Oaks, CA: SAGE Publications. Taylor- Powell, E. (1999, June). Logic model notes. Paper presented at the University of Wisconsin's
providing leadership for program evaluation, Madison, Wisconsin. Taylor-Powell, E., Rossing, B. & Geran, J. (1998). Evaluating collaboratives: Reaching the potential. Madision, WI; University of Wisconsin-Extension. Telfair, J., Leviton, L. C., & Merchant, J. S. (1999). Evaluating health and human programs in
community settings. San Francisco, CA : American Evaluation Association Publications. United Way of America. (1996). Measuring program outcomes: A practical approach. Arlington, VA:
United Way of America. The Joint Committee on Standards for Educational Evaluation. (1994). The program evaluation
standards (2nd ed.) Thousand Oaks, CA: SAGE Publications. Van Maanen, J. (ed.) (1998). Qualitative studies of organizations. Thousand Oaks, CA: SAGE
Publications.

19
Wholey, J.S. (1997) Evaluability; Developing program theory; in Bickman (ed) using program Theory
in Evaluation. New Directions for Program Evaluation, (33). San Fransico; Jossey-Bass. Wiggins, G. (1998). Educative assessment: Designing assessments to inform and improve student
performance. San Francisco, CA: Jossey-Bass Publishers. Witkin, B. R. & Altschuld, J. W. (1995). Planning and conducting needs assessments: A practical
guide. Thousand Oaks, CA: SAGE Publications. Yin, R. K. (1994). Case study research: Design and methods (2nd ed.) Thousand Oaks, CA: SAGE
Publications.
Useful Evaluation Web Sites http://www.four-h.purdue.edu/fourfold Four-Fold Youth Development Web Site
Instruments and on-line data analysis, research abstracts and program activities
http://www.uwex.edu/ces/pdande University of Wisconsin Program Development and Evaluation Web Site http://www.cyfernet.org/ CYFERNet - Children, Youth & Families Educational Research Network http://www.ca.uky.edu/agpsd/soregion.htm Southern Region Extension Evaluation Collaborative http://www.mapnp.org/library/evaluatn/questnrs.htm Basics of developing questionnaires http://www.fantaproject.org/publications/sampling.htm Sampling guide http://survey.sesrc.wsu.edu/dillman/ Surveys on the internet
20
Worksheets and Checklists
• Logic Model Worksheet #1 • Checklists for Your Program Logic Model and
Outcomes • Outcome Indicator Worksheet #2
• Checklist for Outcome Indicators
WORD versions of the worksheets and checklists can be download
from the Four-Fold Youth Development web site
www.four-h.purdue.edu/fourfold

Logic Model Worksheet #1
Adapted from E. Taylor-Powell, 1999
S. Barkman - Purdue University (revised 2002)
INPUTS OUTPUTS OUTCOMES - IMPACTActivities Participation LEARNING IMPACT
What do we need toachieve our goals?
What do we have to doto ensure our goals aremet?
Who needs to- participate?- be involved?- be reached?
ACTION
What do we thinkthe participants willknow, feel, or beable to do afterparticipation in theprogram?
How do we think theparticipants willbehave or actdifferently afterparticipation in theprogram?
What kind of impactcan result if theparticipants behave oract differently afterparticipation in theprogram?
Name of program ____________________________________________
22
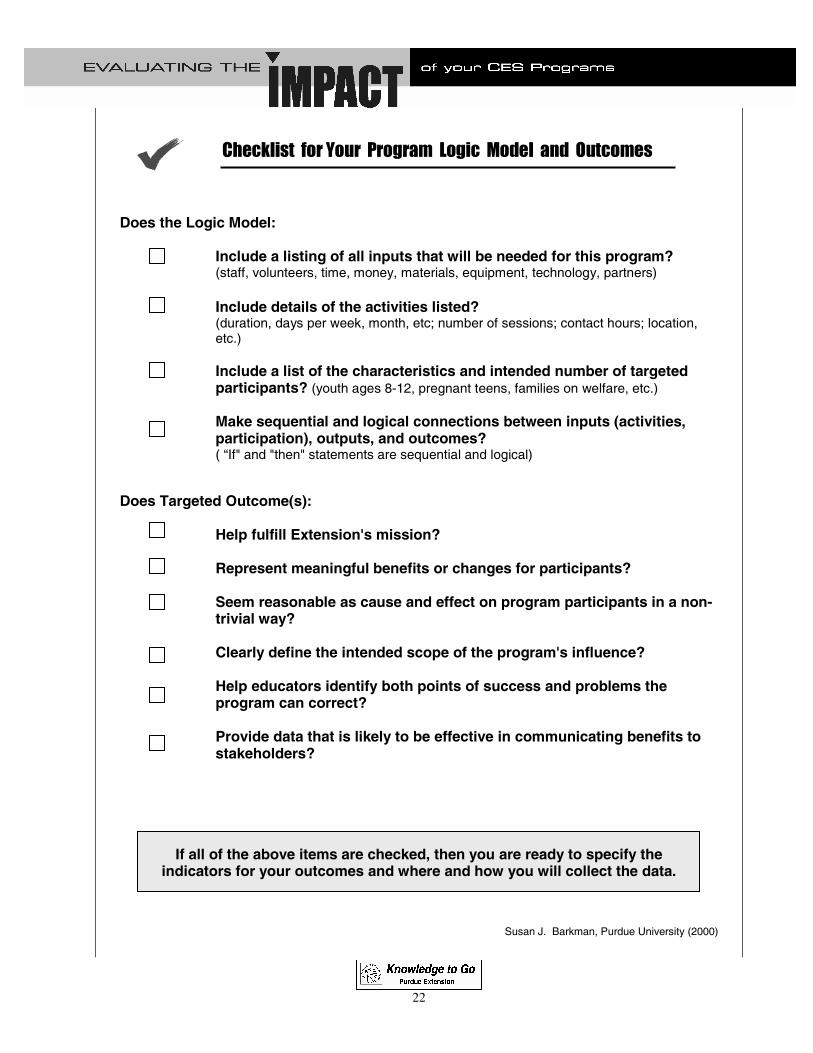
Checklist for Your Program Logic Model and Outcomes
Does the Logic Model:
Include a listing of all inputs that will be needed for this program? (staff, volunteers, time, money, materials, equipment, technology, partners) Include details of the activities listed? (duration, days per week, month, etc; number of sessions; contact hours; location,
etc.) Include a list of the characteristics and intended number of targeted
participants? (youth ages 8-12, pregnant teens, families on welfare, etc.) Make sequential and logical connections between inputs (activities,
participation), outputs, and outcomes? ( “If" and "then" statements are sequential and logical)
Does Targeted Outcome(s): Help fulfill Extension's mission? Represent meaningful benefits or changes for participants? Seem reasonable as cause and effect on program participants in a non-
trivial way? Clearly define the intended scope of the program's influence? Help educators identify both points of success and problems the
program can correct? Provide data that is likely to be effective in communicating benefits to
stakeholders?
If all of the above items are checked, then you are ready to specify the indicators for your outcomes and where and how you will collect the data.
Susan J. Barkman, Purdue University (2000)

����������� ����������������
������������������ ���������������������� ���� ��������
��������������� ��
��������������������������� ����������
�����������
�����������
�����������
������������������������������������������������������������
24
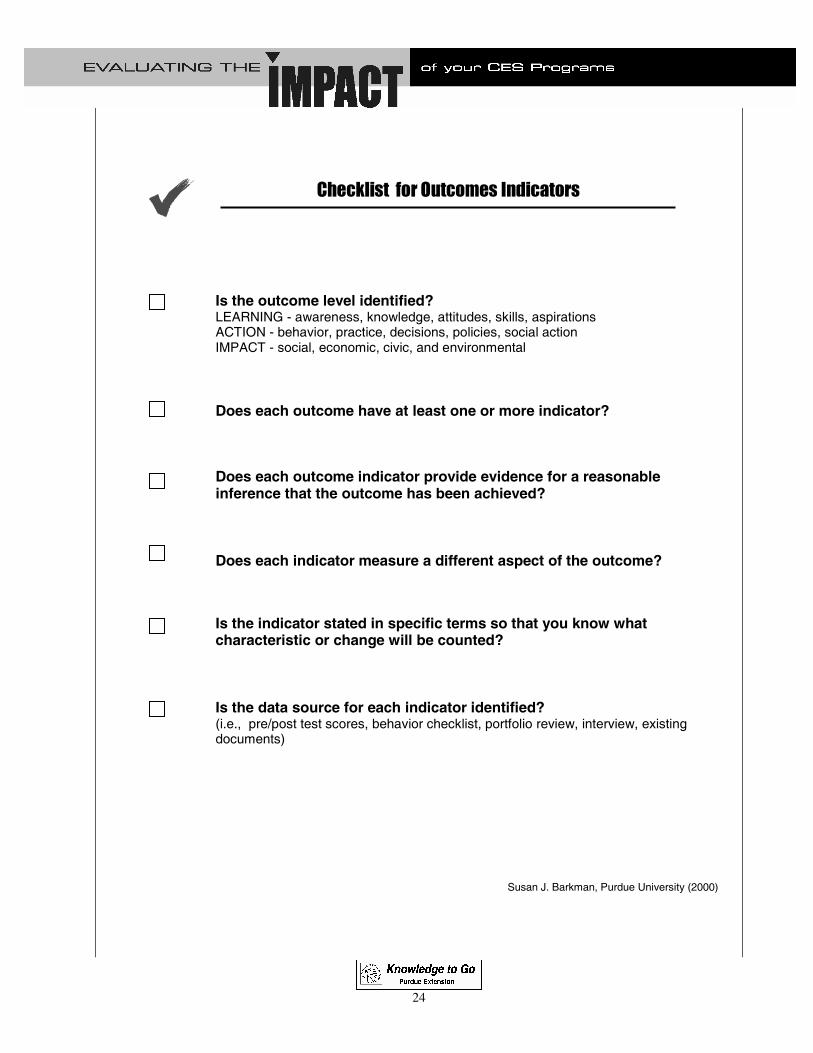
Checklist for Outcomes Indicators
Is the outcome level identified? LEARNING - awareness, knowledge, attitudes, skills, aspirations ACTION - behavior, practice, decisions, policies, social action IMPACT - social, economic, civic, and environmental
Does each outcome have at least one or more indicator? Does each outcome indicator provide evidence for a reasonable
inference that the outcome has been achieved? Does each indicator measure a different aspect of the outcome?
Is the indicator stated in specific terms so that you know what characteristic or change will be counted?
Is the data source for each indicator identified? (i.e., pre/post test scores, behavior checklist, portfolio review, interview, existing
documents)
Susan J. Barkman, Purdue University (2000)
25
SAMPLE LOGIC MODEL WORKSHEETS
AND OUTCOME DATA
Space Station Indiana Logic Model Worksheet 1 Space Station Indiana Model Worksheet 2 Space Station Indiana Impact Report County Jr. Leader Program Logic Model Worksheet 1 County Jr. Leader Program Logic Model Worksheet 2

26
SAMPLE EVALUATIO INSTRUMENTS
Four-Fold Youth D
27
SAMPLE EVALUTION INSTRUMENTS
Private Pesticide Applicator – Record Keeping
Private Pesticide Applicator – Drift

![Logic Model Workbook[1]](https://static.fdocuments.net/doc/165x107/577ce4ca1a28abf1038f292b/logic-model-workbook1.jpg)