DAY 12: DATABASE CONCEPT Tazin Afrin [email protected] [email protected] September 26, 2013 1.
Upload
randolf-boothCategory
view
214download
1
Log relationships, trig functions … & computer lab
Department of Geology and GeographyWest Virginia University
Morgantown, WV

Logarithms
The allometric or exponential functions are in the form cxaby and
cxay 10b and 10 are the bases. These are constants and we can define any other number in terms of these constants raised to a certain power.
xyei 10 .. Given any number y, we can express y as 10 raised to some power x
Thus, given y =100, we know that x must be equal to 2.

xy 10
By definition, we also say that x is the log of y, and can write
xy x 10loglogSo the powers of the base are logs. “log” can be thought of as an operator like x and which yields a certain result. Unless otherwise noted, the operator “log” is assumed to represent log base 10. So when asked what is
45y where,log yWe assume that we are asking for x such that
4510 x

Sometimes you will see specific reference to the base and the question is written as
45y where,log10 yy10log leaves no room for doubt that we are
specifically interested in the log for a base of 10.
ypow 10
One of the confusing things about logarithms is the word itself. What does it mean? You might read log10 y to say -”What is the power that 10 must be raised to to get y?” How about this operator? -
The power of base 10 that yields () y
653.1log10 y

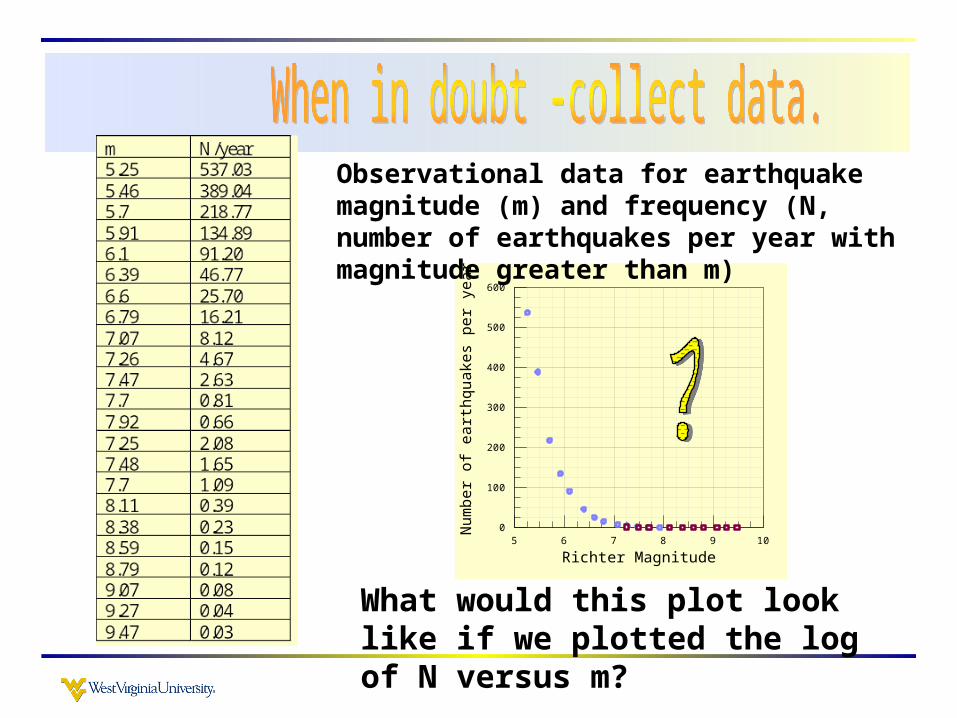
What do you think? Are small earthquakes much more common than large ones?
Fortunately, the answer to this question is yes, but is there a relationship between the size of an earthquake and the number of such earthquakes?
5 6 7 8 9 10
Richter Magnitude
0
100
200
300
400
500
600
Num
ber
of e
arth
quak
es p
er y
ear
Observational data for earthquake magnitude (m) and frequency (N, number of earthquakes per year with magnitude greater than m)
What would this plot look like if we plotted the log of N versus m?

0.01
0.1
1
10
100
1000
Num
ber
of e
arth
quak
es p
er y
ear
5 6 7 8 9 10
Richter Magnitude
This looks like a linear relationship. Recall the
formula for a straight line?
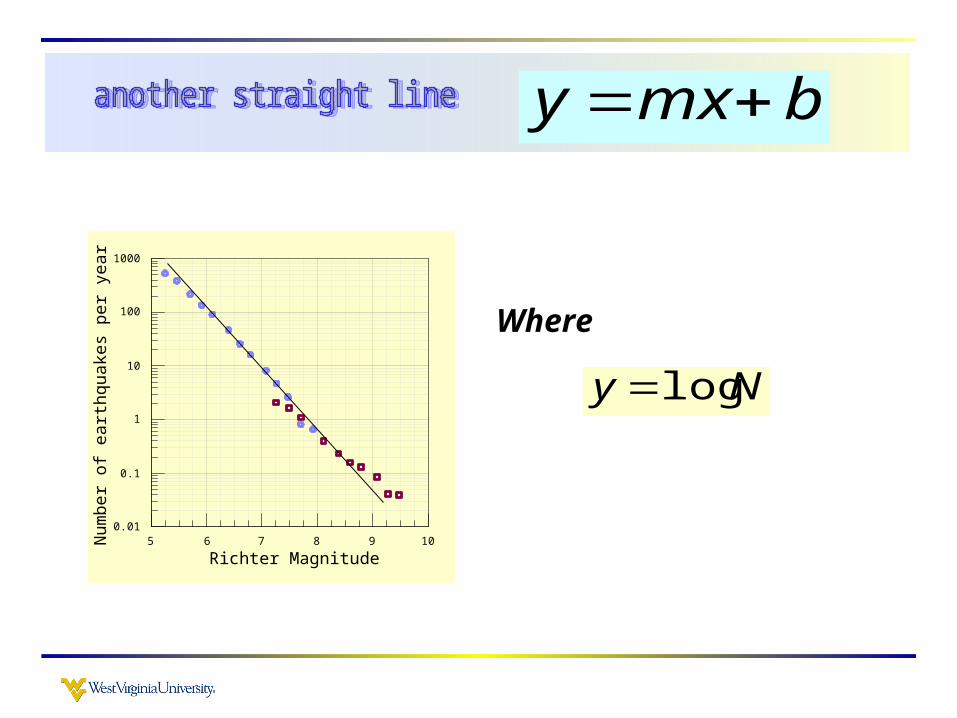
bmxy
0.01
0.1
1
10
100
1000
Num
ber
of e
arth
quak
es p
er y
ear
5 6 7 8 9 10
Richter Magnitude
Where
Ny log
5 6 7 8 9 10
Richter Magnitude
0.01
0.1
1
10
100
1000
Num
ber
of e
arth
quak
es p
er y
ear
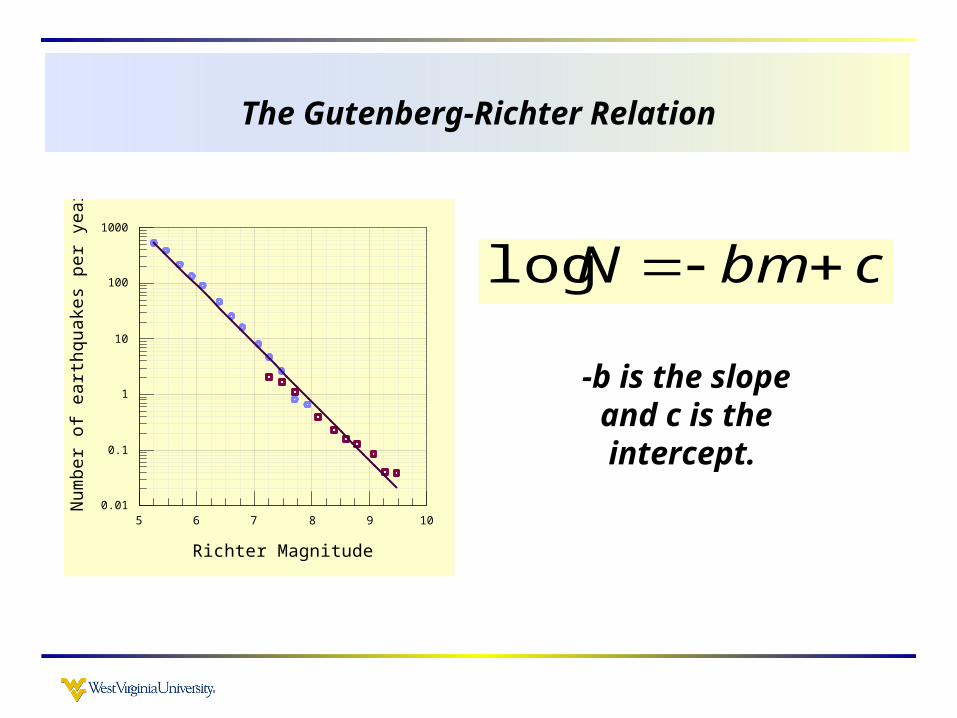
cbmN log
The Gutenberg-Richter Relation
-b is the slope and c is the intercept.

5 6 7 8 9 10
Richter Magnitude
0.01
0.1
1
10
100
1000
Num
ber
of e
arth
quak
es p
er y
ear cbmN log
The Gutenberg-Richter Relation
is linear in a log-log format because m is earthquake magnitude and you have heard that an earthquake magnitude of 5, for example, represents ground motion whose amplitude is 10 times that associated with a magnitude 4 earthquake.
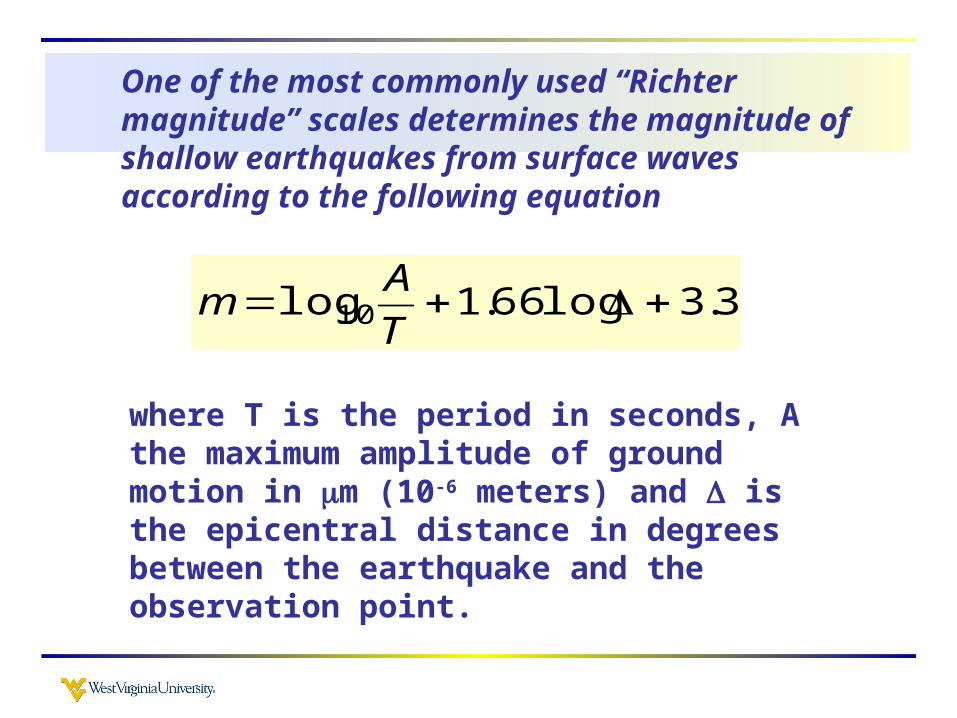
One of the most commonly used “Richter magnitude” scales determines the magnitude of shallow earthquakes from surface waves according to the following equation
3.3log66.1log10 T
Am
where T is the period in seconds, A the maximum amplitude of ground motion in m (10-6 meters) and is the epicentral distance in degrees between the earthquake and the observation point.
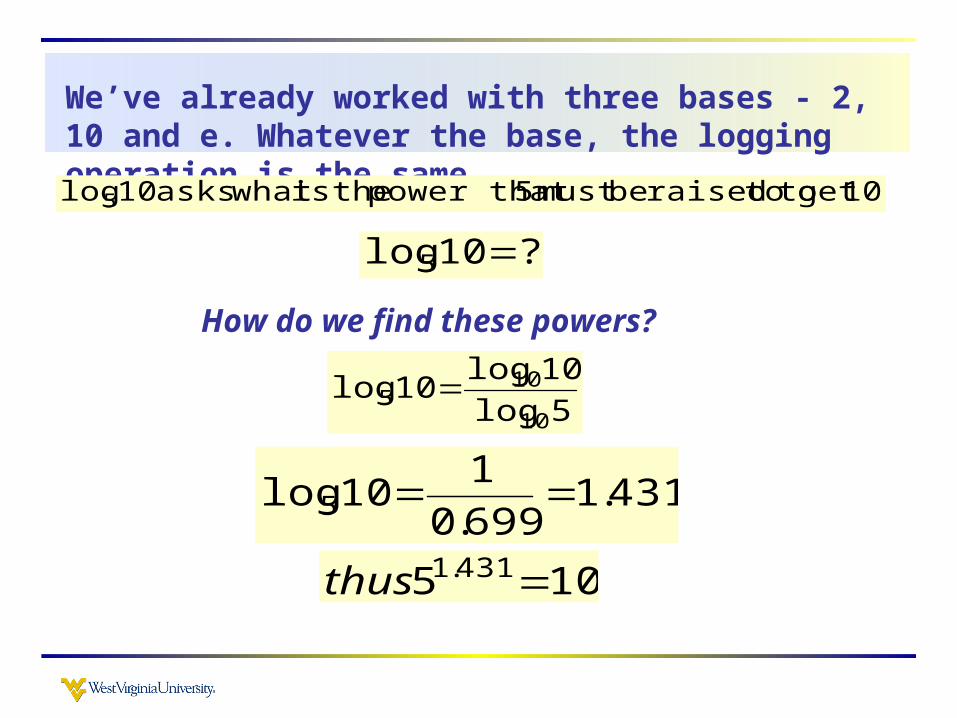
We’ve already worked with three bases - 2, 10 and e. Whatever the base, the logging operation is the same.
10.get to toraised bemust 5 power that theis what asks 10log5
? 10log5
How do we find these powers?
5log
10log 10log
10
105
431.1699.0
1 10log5
105 431.1 thus

In general, base
numberbase
10
10
log
)(log number) some(log
or
b
ab
10
10
log
)(log alog
Try the following on your own
?3log
)7(log 7log
10
103
8log8
21log7
7log4

subscript no with log, asten often writ is log that find You will 10
log10 is referred to as the common logarithm
ln. asten often writ is log e
2.079 ln8 8log e
thus
loge or ln is referred to as the natural logarithm. All other bases are usually specified by a subscript on the log, e.g.
etc. ,logor og 25l

Spend a few minutes in group discussion on the two problems handed out Tuesday
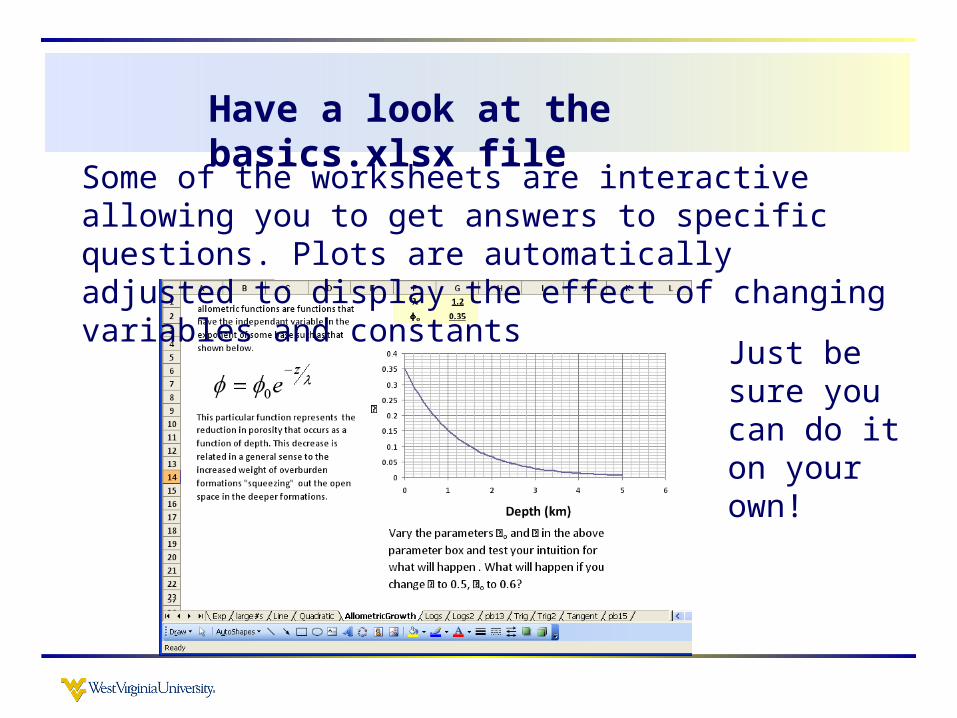
Have a look at the basics.xlsx file
Some of the worksheets are interactive allowing you to get answers to specific questions. Plots are automatically adjusted to display the effect of changing variables and constants
Just be sure you can do it on your own!
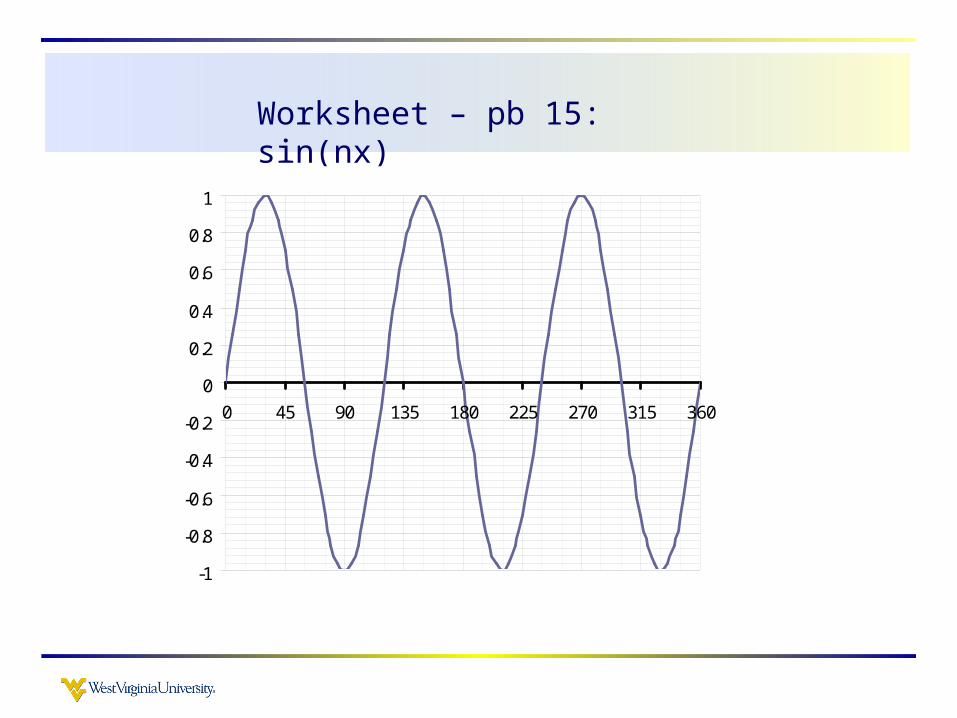
Worksheet – pb 15: sin(nx)
-1
-0.8
-0.6
-0.4
-0.2
0
0.2
0.4
0.6
0.8
1
0 45 90 135 180 225 270 315 360
sin()
Depth (cm)
0 500 1000 1500 2000 2500
AG
E(y
ears
BP
)
0
5000
10000
15000
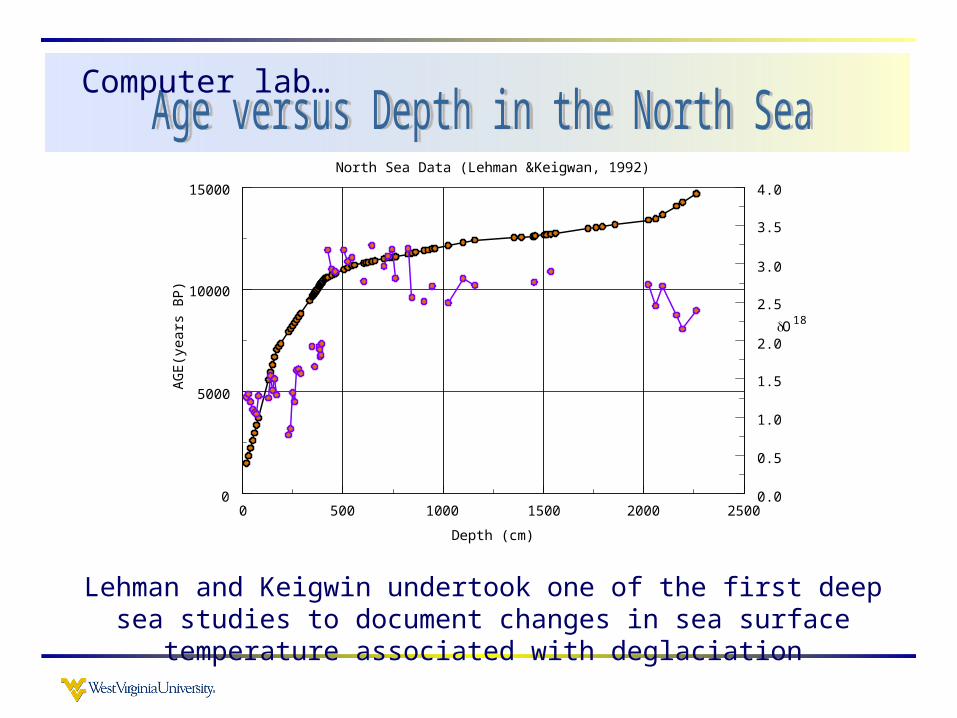
North Sea Data (Lehman &Keigwan, 1992)
O18
0.0
0.5
1.0
1.5
2.0
2.5
3.0
3.5
4.0
Lehman and Keigwin undertook one of the first deep sea studies to document changes in sea surface temperature associated with deglaciation
Computer lab…

Finish reading Chapters 1 and 2 (pages 1 through 38) of Waltham
Continue working on this lab for next class
Hand in the second set of warm-up questions