TESE - A EPÊNTESE CONSONANTAL NO PORTUGUÊS - UM ESTUDO INTRODUTÓRIO.pdf

Perception & Psychophysics1996,58 (6),936-946
Locus equations as phonetic descriptorsof consonantal place of articulation
HARVEY M.SUSSMAN and JADINESHOREUniversity oj Texas, Austin, Texas
This experiment tested whether locus equation coefficients, slope, and y-intercept could serve as indices of place ofarticulation for obstruents sharing the same place ofarticulation across different manner classes. Locus equations for 22speakers were derived from eVltl words with initial voiced stop Idl,voiceless aspirated stop It/, nasal Inl, voiced fricative Izl, and voiceless fricative lsi preceding 10vowelcontexts. Post hoc tests revealed Idl = Izl = Inl for slope means. Voiced Idl and voiceless It I were alsoequivalent when F2 transition onset measurement points were equated. Scatterplots of locus equationcoefficients revealed three nonoverlapping and distinct clusters when the diverse coronal group wascompared with labials and velars. A discriminant analysis using slope and y-intercept as predictorssuccessfully categorized all five coronals into one alveolar group with 87.1% accuracy. The collectiveresults support the contention that locus equations can serve as effective phonetic descriptors of consonant place of articulation across manner classes.
Locus equations are linear regressions of the onset ofF2 transitions on their offsets measured in the vowel nucleus (Lindblom, 1963). Frequency coordinates codingF2 transitions ofallophonic variants ofa given stop placecategory (e.g., beat, bet, bat, boot, but, boat, bought,bait, etc.) tightly cluster about regression lines that significantly vary as a function ofstop place ofarticulation(Sussman, Hoemeke, & Ahmed, 1993; Sussman, MeCaffrey, & Matthews, 1991). The vowel-context inducedvariability of the F2 transition, so evident when individual tokens are compared, gives way, when displayed aslocus equation plots, to a lawful acoustic representationof the entire stop place category. The x, y coordinates oflocus equation scatterplots align themselves in a highlycorrelated and linear fashion around the regression line.This orderly plot captures a higher order and emergentlike acoustic commonality-namely, a vowel normalization of the F2 transition within each stop place category.Higher order locus equation coefficients-slope and yintercept-when serving as predictor variables in a discriminant analysis, were shown to correctly classify labial, alveolar, and velar stop place of articulation with100% accuracy (Sussman et al., 1991). Celdran and Villalba (1995) have recently replicated this result for Spanish stops. Ten speakers produced stimulus words containing Ipl, Ibl, Itl, Idl, Ikl, and Igl preceding five vowelcontexts. With either slope alone or slope andy-interceptas predictors, the correct classification rates were 100%for all three place ofarticulation categories. Place information is inherently encoded by locus equations because
This research was supported by Grant ROI DC2014-01AI from theNational Institute on Deafness and Other Communication Disorders.Correspondence should be addressed to H. M. Sussman, Department ofLinguistics, University of Texas, Austin, TX 78712 (e-mail: [email protected]).
the slope of the regression function is proportional to theextent ofCV coarticulation being used by the speaker (seeFigure 10 in Sussman et al., 1993). The consistently linear scatterplots, as documented across languages, gender,and speaking conditions, have recently been interpreted aspossibly serving a functional role in speech perception andthe representational encoding (viz., mapping) ofacoustic-based place of articulation categories (Sussman, Fruchter, & Cable, 1995).
The acoustic correlates of consonantal place of articulation, however, are many and varied. Burst information, onset spectra, and formant transition motion haveall been implicated, to greater or lesser extents, as perceptual cues for place ofarticulation (see, e.g., Blumstein& Stevens, 1979, 1980; Dorman, Studdert-Kennedy, &Raphael, 1977; Eek & Meister, 1995; Furui, 1986; KewleyPort, 1983; Lahiri, Gewirth, & Blumstein, 1984; Nossair& Zahorian, 1991; Ohde, Haley, Vorperian, & McMahon,1995; Walley & Carrell, 1983). Locus-equation-basedanalyses can offer additional insights into the role of theF2 transition onset-offset combination as a contributingcue for consonant place of articulation. Though the taxonomic value of locus equations to date has primarilybeen as a phonetic descriptor ofstop place ofarticulation,the perceptual relevance oflocus equations has also beenshown. Fruchter (1994) demonstrated that the relationship between F2 onset and F2 vowel could be ofuse during speech perception. Fruchter orthogonally varied F2onset frequencies in .25 Bark steps across 10 vowel contexts in synthesized (five formants) CV syllables with noburst. Stimuli were presented to listeners for identification, and identification frequencies were then tabulatedand pooled across subjects (N = 3) to yield stepped grayscale displays (similar to the amplitude [z] axis ofa spectrogram) interpretable as "identification surfaces" foreach stop place of articulation. The darkest regions cor-
Copyright 1996 Psychonomic Society, Inc. 936

LOCUS EQUATIONS AND CONSONANTAL PLACE 937
responded to the highest frequencies of consensus identification across pooled subject data, and the lightest regions reflected more ambiguous zones of perceptualspace. Token-level acoustic data were then superimposedover the grayscale perceptual surfaces. The overlays allowed appraisal ofthe correspondences between the distribution of the acoustic data and features of the perceptiondata. There were clear "peaks" in the three identificationsurfaces (darkest areas) where a given stop consonantperception dominated and correspondences between theacoustic coordinates from production to these perceptionpeaks, especially for Ibl and Idl, but less so for velar Ig/,which is more dependent on the presence of a burst foridentification. In areas ofacoustic overlap, there were cleardominance effects in perception; that is, a "b" identification prevailed when tokens fell in the region of Ibl andIdl overlap in front vowel space, and a "d" identificationprevailed when tokens fell in the region of Idl and Igloverlap in back vowel space.
The Fruchter (1994) study provides the first empiricalevidence that locus equations possess psychological reality. F2 onset, operating in a relational and combinatorial sense with F2 vowel, can provide a significant cuefor stop consonant place of articulation. Interestingly,computational experiments in which time-delayed neuralnetworks were fed sampled spoken CV wave forms, taskedto classify initial consonant by place ofarticulation, andthen analyzed to determine which parts of the input signal were most effective for the task showed that the partsof the signal most informative about consonantal placeofarticulation were the F2 onset and F2 vowel frequencies (Hinton & Lang, 1988; McDermott & Katagiri, 1988;Tank & Hopfield, 1988; Waibel, Hanazawa, Hinton, Shikano, & Lang, 1987; Watrous, 1988).
Ofconsiderable interest to phoneticians and speech theorists is the ability of the locus equation metric to serveas a general phonetic descriptor for consonant place ofarticulation when a given place feature spans diverse manner classes. Studies directly comparing acoustic characteristics ofhomorganic consonants are limited. Sussman(1994) investigated unaspirated voiceless stops, nasals,fricatives, and approximants in 14 speakers ofAmericanEnglish. Ten medial vowels (Ii I e re e au 0 A ::>/) wereused with the following syllable-initial consonants: 1m nv z 3 0 w j r II as well as Ip t kl in initial IsCI clusters. Ina plot of locus equation coefficients, with slope plottedon the x-axis and y-intercept on the y-axis, consonantssharing similar place features but various manner classesclustered together in several nonoverlapping distributions. Specifically, a coronal group consisting of10 d t nz 31 formed one cluster, a velar group (/g k/) formed another cluster, and a labial/labiodental group (/b p m vi)formed a distinct and nonoverlapping third cluster. Approximants formed their own cluster with all slopes nearzero, but varying y-intercepts that reflected differencesin F2 onset loci effectively contrasting among Iw r 1 j/.No statistical comparisons were performed in this preliminary study among obstruents having the same placeofarticulation but belonging to different manner classes.
Fowler (1994) also extended the locus equation metric beyond voiced oral stops to investigate place of articulation across manner classes. Arguing that "any invariant for stop place must be an invariant for place ofarticulation in general" (p. 598), Fowler compared locusequation slopes for stops and fricatives varying along aplace continuum - Ib v 0 z 3 gl in 10 speakers. In thesingle test case when two consonants with the sameplace of articulation but different manner classes werecompared, the slope for Idl (.47) was reported to be significantly different from the slope for /zl (.42), and henceit was concluded that "locus equations provide poor information for place" (p. 605). Mean y-intercept valueswere not significantly different in the Idl (1120 Hz) versus Izl (1078 Hz) statistical analysis.
A better test ofwhether or not locus equations can serveas phonetic descriptors ofconsonant place ofarticulationacross manner class would be to jointly use slope and yintercept as codependent variables in a multivariate analysis. Locus equation slope, by itself, is proportional to theextent of coarticulation existing between the vowel andpreceding consonant (Krull, 1989; Sussman, Hoemeke, &McCaffrey, 1992). While coarticulatory factors may be expected to differ across manner classes (cf Recasens, 1989),differences in tongue body position that accommodatesubtle differences in the formation ofthe consonantal constriction also can be expected to contribute to overall F2differences. In Fowler (1994), the posterior progressionfrom labiodental Ivl to interdental 101 to alveolar Izl topalatal 131 was captured by changing slope and y-interceptvalues as slopes systematically decreased (.73 to .50 to.41 to .34) andy-intercepts systematically increased (337to 903 to 1078 to 1408 Hz) as a function offricative placeofarticulation. While slope and y- intercept are inverselycorrelated in that steep slopes tend to have lowy-interceptsand shallow slopes have highery-intercepts, two nonoverlapping scatterplots can have similar slopes and contrastonly iny-intercepts, as is seen in coronal stop contrasts involving secondary articulations such as pharyngealization (in Cairene Arabic) and retroflexion (Urdu) as reported by Sussman et aI., 1993.
Using data from both Sussman (1994) and Fowler(1994), as well as synthetic VCVs (where C varied acrosslabial, alveolar, and velar place) produced by the distinctive region model (Carre & Mrayati, 1992), Chennoukh, Carre, and Lindblom (1995) concluded that higherorder locus equation coefficients were fairly constant descriptors of place of articulation for homorganic consonants spanning oral, nasal, fricative, and voicing mannerclasses.
The following study is a replication and extension ofFowler (1994), carried out with an expanded phonetic inventory and a larger speaker population, to determinewhether locus equations can serve as a general phoneticdescriptor of consonant place of articulation. Syllableinitial consonants spanning five different manner classes,but each having the same alveolar place feature, were compared: voiced stop Id/, nasal Inl, voiceless aspirated stopItl, voiced fricative /z/, and voiceless fricative lsi. Iflocus
938 SUSSMAN AND SHORE
equations function as a phonetic descriptor ofconsonantal place ofarticulation, one would expect nonsignificantstatistical differences for slopes and y-intercepts acrossall coronals. Ifnasality, frication, aspiration, and continuancy interact with F2 trajectories in as yet unforeseenways, a softer prediction would hold that, as a class,coronals would evidence slope and y-intercept coefficients that would basically cluster together despite manner class-induced variation, but be sufficiently contrastivevis it vis labial and velar places of articulation. The purpose ofthis study was to determine how well locus equations hold up as general place descriptors when compared across the robust articulatory and sound sourcedifferences characterizing various manner classes ofconsonatal production.
METHOD
Subjects and Stimulus MaterialsTwenty-two male speakers were recruited for this study. All
subjects werevolunteersand ranged in age from 19to 55, with ameanage of34.6. All subjects had normal hearing and were monolingualspeakers of American English. Since all previous locus equationstudies have shown no significant effect of gender, male speakerswere chosen simply to maximize the ease ofmaking measurementsfrom spectrographic displays. Several dialectal variations were present in the subject pool including that of Texans with fronted luishaving F2 resonances in the vicinity of 1400-2000 Hz.
Within coronals, there are several consonants belonging to different manner classes that have an alveolar place of articulation (/dt n z s/). Although these consonants can exhibit assimilation witha following consonant that can shift the place of articulation anteriorly to interdental (e.g., Inl in tenth, Idl in hundredth) or posteriorly to postalveolar (e.g., Inl in inch, Idl in edge) (Clements, 1985),in a CV/t! context all consonants have a relatively stable alveolarplace of articulation affected only by the following vowel context.Monosyllabic test words were produced within the sentence frame:"Say CVIt! again." Each test word was repeated five times as the 10vowels in medial position were randomized in five different orderings for each consonant. The five randomized word lists per consonant were printed on a single sheet and read by the speaker at acomfortable loudness level and pace. The vowels used, identical tothose in Sussman and colleagues (Sussman et al., 1995; Sussmanet al., 1993; Sussman et al., 1991), were Ii lee re 0 0 u A 'J/. Theordering of consonants was also randomized across speakers. Thus,a total of 250 tokens were analyzed for each speaker (5 consonantsX 10 vowel contexts X 5 repetitions), and each locus equation regression function was generated by using all 50 tokens (10 vowelsX 5 repetitions) per consonant. In all, 5,500 tokens were acoustically analyzed in this study.
ProcedureAll analysis procedures and measurements were identical, inso
far as possible, to those previously described in Sussman and colleagues (Sussman et al., 1995; Sussman et al., 1993; Sussman et al.,1991). All subjects were recorded in a soundproof room (lAC)using a high-qualitymicrophone (Electro-Voice RE 15)and a Marantzcassette tape recorder (Model PMD 201). The recorded signal wassampled at 10 kHz, digitized, and filtered with an Apple Macintosh IIci computer with MacAdios II hardware. The MacSpeechLab II software package (Version 1.8, G.w. Instruments) was usedfor all display, editing, playback, and measurement procedures. F2onsets (Hz) were obtained solely from cursor readouts placed onwideband spectrogram displays. High-resolution expansions of the
portions of the spectrograms in the vicinity of the CV interfacewere routinely performed to aid visualization ofF2 onset at the firstglottal pulse of the vowel and in the noise source portions of aspirated stops. Formant measurements for F2 vowel were obtainedfrom three sources: direct cursor readouts from wideband spectrogram displays, linear predictive coding (LPC), and fast Fouriertransforms (narrowband FFTs). A default parameter of 13 coefficients was used for the autocorrelation function for LPC analysis.When LPC and FFT spectra were obtained from midvowel targetloci, the time marker in the center of the analysis window coincidedto within a millisecond to the time point sampled by the (mousecontrolled) cursor frequency from the on-screen spectrogram. Themean F2 value from the three measures (spectrogram, LPC, FFT)taken at a midvowel site was used as the independent variable, F2vowel, in the regression analyses. The average variation across thethree measurements for F2 vowel was 83.6 Hz.
Data Sampling PointsMeasurement loci for F2 vowel were exactly the same as de
scribed in Sussman et al. (1991). Briefly,criteria for F2 vowelplacement were as follows: (I) if the F2 resonance was steady state or diagonally oriented, the midpoint of the formant was taken on thebasis of visual inspection; (2) if the F2 resonance was U-shaped orthe inverse, the "minima/maxima" point was taken as the vowel target frequency. Although criteria for midvowel formant measurement loci were visually determined, no sample points from whatmight be considered the vowel off-glide were taken, and for diphthongs the measurement point was always taken within the initialvowel segment.
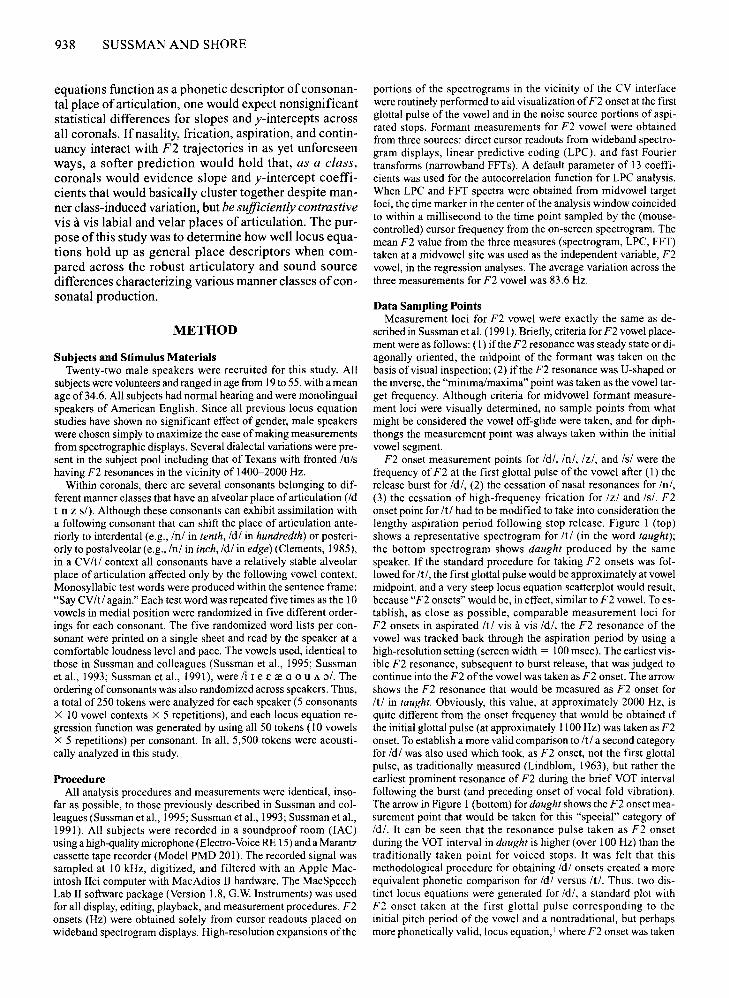
F2 onset measurement points for Id/, Inl, Izl, and lsi were thefrequency of F2 at the first glottal pulse of the vowel after (1) therelease burst for Id/, (2) the cessation of nasal resonances for Inl,(3) the cessation of high-frequency frication for Izl and lsI. F2onset point for It I had to be modified to take into consideration thelengthy aspiration period following stop release. Figure I (top)shows a representative spectrogram for It I (in the word taught);the bottom spectrogram shows daught produced by the samespeaker. If the standard procedure for taking F2 onsets was followed for It!, the first glottal pulse would be approximately at vowelmidpoint, and a very steep locus equation scatterplot would result,because "F2 onsets" would be, in effect, similar to F2 vowel. Toestablish, as close as possible, comparable measurement loci forF2 onsets in aspirated It I vis avis Id/, the F2 resonance of thevowel was tracked back through the aspiration period by using ahigh-resolution setting (screen width = 100msec). The earliest visible F2 resonance, subsequent to burst release, that was judged tocontinue into the F2 ofthe vowel was taken as F2 onset. The arrowshows the F2 resonance that would be measured as F2 onset forIt! in taught. Obviously, this value, at approximately 2000 Hz, isquite different from the onset frequency that would be obtained ifthe initial glottal pulse (at approximately 1100 Hz) was taken as F2onset. To establish a more valid comparison to It! a second categoryfor Idl was also used which took, as F2 onset, not the first glottalpulse, as traditionally measured (Lindblom, 1963), but rather theearliest prominent resonance of F2 during the brief VOT intervalfollowing the burst (and preceding onset of vocal fold vibration).The arrow in Figure 1 (bottom) for daught shows the F2 onset measurement point that would be taken for this "special" category ofId/. It can be seen that the resonance pulse taken as F2 onsetduring the VOT interval in daught is higher (over 100 Hz) than thetraditionally taken point for voiced stops. It was felt that thismethodological procedure for obtaining Idl onsets created a moreequivalent phonetic comparison for Idl versus It/. Thus, two distinct locus equations were generated for Idl, a standard plot withF2 onset taken at the first glottal pulse corresponding to theinitial pitch period of the vowel and a nontraditional, but perhapsmore phonetically valid, locus equation, 1 where F2 onset was taken

LOCUS EQUATIONS AND CONSONANTAL PLACE 939
····2.0kHz·
·:····1.0kHz
___________-...-..Id.'1.6-.'.'.I:.-__II';-----"taught"
---;:"
F2 Onset
.' 2.0kHz-··
1..•···..·········..·..····1.0kHz ...
"daught"Figure 1. Top: spectrogram ofthe word taught, showing appearance ofF2 resonance through
out the aspiration interval; the arrow shows the place where F2 onset was measured for aspirated It I tokens. Bottom: spectrogram of the word daught for the same speaker, showing thepresence of an F2 resonance pulse during the brief VOT interval following the Idl burst; thearrow shows where F2 onset was measured for the category Id/ @ burst.
after the release burst, but before glottal pulsing began for thevowel. This Idl will be noted as Id/@ burst in the data tables to follow.
A brief note should be made at this point that taking F2 onset atthe first glottal pulse corresponding to vowel onset for Iz/, lsi, andInl, while unavoidable at present, is not, strictly speaking, the mostaccurate measurement point to assess where place-related F2
acoustic resonances first arise. The long frication interval of lsi andIzi often contained a clearly visible noise-supported resonance ofF2 that could be traced back to the beginning of the consonant.However, since this F2 resonance onset point was not consistentlyand unequivocally determinable during the noise excitation for thefricatives and the nasal murmur of Inl, only traditionally definedF2 onset points were taken for Iz/, lsi, and In/.

940 SUSSMAN AND SHORE
Interjudge ReliabilityTo test for reliability of formant measurements, especially F2
onsets taken during the aspiration interval (It! and Id/@ burst), investigator 1.S. remeasured data originally measured by investigatorH.M.S. A speaker was selected at random (Speaker 17), and all tokens across all five consonants were remeasured and compared (N =250). In the replication, F2 onsets were taken, as described above,from cursor placement on high-resolution wide band spectrogramdisplays, and F2 vowel was obtained by averaging three midpointfrequencies from three convergent sources (wideband spectrogram,LPC, and narrowband FFT) for each token. Both correlations andabsolute frequency differences were obtained in the reliability analysis. While correlational analyses can be somewhat misleading in assessing reliability, the following Pearson correlation coefficientswere obtained for F2 onsets: Idl = .98; Id/@burst = .75; It I = .71;Izl = .95; lsi = .98; Inl = .94. Across all five obstruents, the correlation between the two investigators' measurements was .887. F2vowel correlation coefficients for each consonant were as follows:Idl = .98; It! = .99; Izl = .98; lsi = .99; Inl = .98. The absolutefrequency differences across the two measurements is a better indicator of test-retest reliability. The mean (absolute) frequency difference calculated across the 50 tokens per consonant were as follows:F2 onset-/dl = 67.3 Hz; Id/ @ burst = 63 Hz; It! = 74.8 Hz; Izl =72.3 Hz; lsi = 99.3 Hz; Inl = 85.5 Hz. The overall mean differencebetween the two measures across all consonants was 77 Hz. F2vowel differences across all five consonants were as follows: Idl =70 Hz; It I = 65.4 Hz; Izl = 85.6 Hz; lsi = 72 Hz; Inl = 71.2 Hz. Theoverall F2 vowel mean (absolute) difference was 72.8 Hz. Theserelatively small frequency differences compare very favorably withthe result of a recent study comparing agreement between automatic and manual formant measurements, where 82% ofthe tokenswere reported to be within 200 Hz (Hasegawa-Johnson, 1995). Although automatic versus manual comparisons are not the same asmanual versus manual, the point emphasized is that 200 Hz was takenas an acceptable benchmark for agreement across measurement
procedures. Most importantly, locus equation slopes and y-interceptsacross the two investigator measurements were in close agreement.The mean slope difference across the five consonantal categorieswas .039, with a mean y-intercept difference of only 60.6 Hz.
RESULTS
The slopes andy-intercepts oflocus equations obtainedfor each manner class obstruent across the 22 speakersare shown in Table 1. Each slopely-intercept characterizesthe regression line fit to the scatterplot ofall 50 tokens perconsonant (10 vowels X 5 repetitions). Figure 2 showsrepresentative locus equation plots for the stop, nasal, andfricative obstruents of this study (Speaker 6). It can beseen that all scatterplots have data points tightly clustered along the regression line giving an extremely linear form to the scatterplot comprising each manner classcategory. The slope and y-intercept values were enteredinto a doubly-dependent multivariate analysis. ThisMANOVA yielded a significant effect for manner class[F(1O,208) = 68.31,p < .001]. Differences between meanswere examined with Scheffe tests, and the results ofthesetests are shown separately for slope and y-intercept inTable 2. Four mean slope comparisons were nonsignificant: Idl versus Inl, Idl versus /z/, Id/@ burst versus Itl,and Inl versus Is/.2 Thus, several locus equation slopesgenerated from utterances with the same place of articulation and spanning several manner classes (voicing,nasality, and frication) were similar. The three voiced obstruents-/d/, Inl, and /z/-had statistically similar slopes,and when F2 onsets for Idl were taken at the first visible
Table 1Summary of Locus Equation Slopes and y-Intercepts Across Consonant Manner Classes for Each Speaker
Consonant Manner Classes
Idl Id/ @burst It I Inl Izi lsi
Speaker k c k c k c k c k c k c
1 .47 903 .23 1439 .17 1528 .66 502 .33 1033 .63 5592 .48 1000 .35 1393 .26 1591 .49 1053 .42 938 .67 5413 .41 938 .23 1357 .29 1365 .45 810 .32 906 .55 5704 .23 1517 .15 1687 .10 1829 .40 1104 .42 893 .66 4685 .37 1172 .25 1484 .15 1679 .55 742 .38 871 .53 7366 .46 1003 .28 1439 .31 1435 .48 918 .42 792 .61 5707 .53 923 .38 1256 .28 1377 .61 680 .43 860 .69 4658 .37 1171 .25 1414 .21 1541 .42 1019 .38 913 .65 5139 .31 1217 .28 1410 .28 1360 .60 620 .52 710 .67 475
10 .40 1041 .25 1425 .23 1434 .30 1180 .40 865 .58 56911 .30 1287 .21 1498 .20 1675 .37 1044 .21 1104 .32 97612 .37 1244 .26 1443 .22 1566 .45 986 .34 997 .53 71413 .42 1118 .22 1515 .34 1338 .39 1115 .40 993 .54 73214 .49 983 .33 1277 .22 1494 .49 866 .30 1004 .65 46015 .42 1149 .29 1412 .27 1424 .48 998 .34 1167 .50 83316 .38 1248 .28 1409 .21 1542 .42 1106 .34 1088 .51 77517 .33 1371 .20 1628 .24 1557 .37 1216 .26 1237 .42 104118 .53 979 .31 1352 .34 1314 .49 943 .45 954 .72 47619 .38 1006 .21 1275 .31 1192 .52 706 .42 823 .55 65520 .37 1089 .20 1362 .19 1439 .58 631 .43 692 .53 53621 .37 1202 .21 1539 .11 1794 .49 866 .39 967 .45 85322 .47 1007 .40 1184 .24 1417 .57 678 .42 915 .57 631
M .40 1117 .26 1418 .23 1495 .48 899 .38 942 .57 643SD .075 158 .062 117 .066 156 .089 203 .068 134 .097 169
Note-k, slope; c, y-intercept (in Hertz).

LOCUS EQUATIONS AND CONSONANTAL PLACE 941
3000 +---,~.....L.._........----'-_-"----L_ _'_--'_"",,,---J'--~_+ 3000 +-~_-'-_~.....L.._~----'-_-"-----'-_""----'-_~-+
2500Idl
2500 Inl
2000
~i 1500c5~
1000
2000
~:: 1500<5~
1000
500 Y=1003.243 + .458 • X; R"2 =.895
500Y=918.319 + .479' X; R"2 = .865
O+-~-'"T'"-~"""-"---"T"-"""-__"T-""---'-~-+ O+---'-'"T'"-~"""-"--"T"-"""--"T"-"""-__"T-"""'-+o 500 1000 1500 2000
F2 Vowel (Hz)2500 3000 o 500 1000 1500 2000
F2 Vowel (Hz)2500 3000
3000 +---'_.....L.._........----'-_""-----L_ _'_--'_........--J'--~_+
Id @burst!2500
3000 +-~--'--o...--'--~----'--""------'--""----'--"""'__T
It!2500
2000
~:: 1500s~
1000
N~2000
~m0 150 0
ic~ 1000lL
500
Y = 1438.746 + .279' X; R"2 =.736500
Y = 1435.22 + .305' X; R"2 = .91
01-~-...,..-..-_r-.....__"T-....--__.-........--,r__-__I'"
o 500 1000 1500 2000
F2 Vowel (Hz)
2500 3000 o 500 1000 1500 2000F2 Vowel (Hz)
2500 3000
3000 +---'~.....L.._........----'-_-"----L_ _'_--'_........--J'--~__+ 30 00 +---'--'--o...--'--~----'---"---'--.......--'---'-__T
2500 IzI 2500 lsI
O+-........-.--~--.,r_ ........---.-.....----r-..-............-+Y = 792.319 +.417 • X; R"2 =.87
30002500
Y=569.91 I + .608' X; R"2 =.926
1000 1500 2000F2 Vowel (Hz)
500oO+-~-.-........-r_....---,-.......--r-..--............--t-
500
2000
~:: 1500<5~
1000
300025001000 1500 2000F2 Vowel (Hz)
500o
500
2000
~:: 1500<5~
1000
Figure 2. Representative locus equation scatterplots (from Speaker 6) for the five coronal obstruents examined. All regression fitswere made to the 50 tokens constituting each consonantal category.
resonance during the briefaspiration interval there was nodifference in slope as a function ofvoicing (ld/@ burst =.26vs./tl = .23). Nasal (lnl = .48) and voiceless fricative(lsi = .57) slope means were also statistically nonsignificant. Manner class did result in significant slope differences when voiceless aspirated It! was compared with allother consonants (except that Id/@ burst) and voicelesslsi slopes were significantly higher when compared withIt,z,d/.
Three y-intercept mean comparisons showed nonsignificant differences: Idl versus 1z1, Id/@ burst versusItl, and Inl versus Izi. However, unlike the results reportedin Fowler (1994), slope and y-intercept mean differenccsfor Idl and Izi were found to be statistically nonsignificant.
Other variables of interest in comparing locus equations across manner classes are R2 and standard error ofestimate (5£). The R2 statistic indicates how much variance in the dependent variable (F2 onset) can be accounted

942 SUSSMAN AND SHORE
Table 2Results of Post Hoc Tests For Determining
Differences Among Means
Idl Id/* It I Inl Izl lsi
Slope
M .403 .261 .234 .480 .378 .569Idl t t n.s. n.s. tId/* n.s. t t tIt! t t tInl t n.s./zl tlsi
y- Intercept
M 1117 1418 1495 899 942 643Idl t t t n.s. tId/* n.s. t t tIt I t t tInl n.s. t/zl tlsi
Note-y-intercept is in Hertz. */dl measured within aspiration interval. t( < .01.
for by the independent variable, F2 vowel, and the SEstatistic reflects the standard deviation of the residualsor the average distance (Hz) of each data point from theregression line. The SE provides an indication of the overall linearity of the locus equation data points. Table 3shows R2 and SE values for all speakers across mannerclass categories. Across all consonants, the group meanR2was .79 and group mean SE was 68 Hz. Stops and thenasal had slightly lower R2 values compared with fricatives (.77 vs..83), but smaller SEs (65 vs. 72.5 Hz). In
general, all locus equations, regardless of manner class,were characterized as having tightly clustered data pointsaround each regression function.
An ANOVA performed on the R2 values yielded a significant effect for consonant manner class [F(21,105) =20.3,p < .0001]. Subsequent comparisons of mean differences using the Scheffe showed significant differences primarily involving comparisons of voiceless aspirated It I andId/@burst(.67 and .73) with every other consonant (/dl =.86,Inl = .83, /zl = .80, lsi = .86). An ANOVA performedon the SE values yielded a significant effect for consonantmanner class [F(21,105) = 15.35,p < .0001]. Subsequentcomparisons showed significant differences when Inl andlsi (83 and 82 Hz) were compared with Idl (59 Hz), Id/@burst (57 Hz), It I (62 Hz), and Izl (63 Hz).
Locus Equation SpaceThe post hoc tests following the MANOVA showed that
some slope and y-intercept differences within the coronal group were significant and others were not. Anothermethod of determining similarityldissimilarity of locusequation plots among the diverse coronals examined in thisstudy is to use a more macro approach-plotting slope versus y-intercept across a wide assortment of CVIt/tokensthat include labial, alveolar, and velar obstruents. Ifalveolars, as a group, do not overlap with labials and velars,the case is further strengthened that locus equation coefficients can serve as general phonetic descriptors forplace ofarticulation across manner classes. In Figure 3 areplotted slopes (along the x-axis) and y-intercepts (alongthe y-axis) obtained from the 22 speakers producing thefive consonantal categories of the present study. These
Table 3Summary ofR2 and Standard Error of Estimate (SE) for Locus Equations for Each Consonantal
Manner Class Across All Speakers
Idl Id/@ burst It! Inl Izl lsi
Speaker R2 SE R2 SE R2 SE R2 SE R2 SE R2 SE1 .88 59 .73 48 .58 44 .90 71 .75 58 .84 952 .88 79 .82 73 .71 99 .83 118 .81 86 .89 1033 .84 53 .60 56 .80 46 .86 55 .73 47 .85 644 .88 36 .66 44 .58 39 .76 94 .85 64 .93 675 .82 63 .75 52 .57 50 .86 86 .82 60 .85 786 .90 61 .74 65 .91 43 .87 83 .87 64 .93 667 .86 89 .82 74 .80 53 .84 124 .84 55 .91 828 .85 64 .75 59 .75 53 .80 90 .80 71 .82 1159 .77 62 .86 40 .71 67 .86 82 .86 69 .88 74
10 .89 60 .81 51 .61 78 .74 80 .77 81 .87 81II .90 33 .70 45 .47 76 .85 54 .81 34 .86 4312 .78 79 .59 85 .66 61 .77 105 .76 69 .77 10313 .93 50 .69 65 .84 72 .88 69 .87 71 .90 7914 .89 67 .83 59 .71 58 .70 131 .63 89 .77 13615 .91 53 .80 56 .91 36 .89 71 .90 42 .91 6016 .90 49 .78 58 .74 51 .81 79 .90 41 .89 6517 .84 52 .64 56 .75 55 .84 62 .85 39 .91 4718 .93 64 .84 59 .82 74 .90 80 .85 84 .87 12919 .86 46 .56 55 .64 81 .90 54 .89 42 .83 7320 .82 48 .47 59 .34 74 .83 63 .59 79 .74 7621 .82 56 .70 45 .23 77 .83 73 .71 65 .76 8322 .80 75 .86 52 .57 74 .82 96 .70 83 .86 75
M .86 59 .73 57 .67 62 .83 83 .80 63 .86 82SD .046 14 .106 11 .17 16 .054 22 .085 17 .056 24

LOCUS EQUATIONS AND CONSONANTAL PLACE 943
Place of Articulation Across Manner Classesin Locus Equation Coordinates
2000 .....................L...........o..L..................L................J..&.............&..IL..L..........&.....................................L.I...........o..L...............'+
0-1-------------------
750
1750
1500
1250
11000GJC~
500
250
o
(Id!, N, Inf, 1zI,Ia/)o
o alveolar
C labial
6 velar
C
fbi
.9.8.7.6.5.4.3.2.1
- 2 5 0 +-.......,.......T"""'"......"""""'.......,......'""T'"............T"T~.....,f""T""........................,'T""............T""'"......"""""'.......,......r+o
Slope
Figure 3. Scatterplot of slope and y-intercept coordinates across 22 speakers ofthis study producing the set of coronal consonants (/d, t, n, z, s/), Locus equation coordinates from 20 speakers producing initial labial fbi Viti and velar Ig/V/ti tokens (data from Sussman et al., 1991) areshown to compare place of articulation in higher order locus equation acoustic space.
coordinates represent a large alveolar cluster spanning avoiced stop (showing both versions ofF2 onset for Id/),a voiceless stop, a nasal, and voiced and voiceless sibilantfricatives. Since only alveolars were obtained from thespeakers of this study, it was necessary to use data obtained from other speakers, from a prior locus equationstudy, in order to compare labials and velars with the alveolar group. Locus equation coefficients (slopes and yintercepts) obtained from 20 speakers, each producing50 IblVlt! and 50 IglV/tl tokens (5 repetitions per stopacross the same 10 vowels) were entered into the scatterplot of Figure 3 (data taken from Sussman et aI., 1991).It is felt that this cross comparison of locus-equationderived place data, though obtained from different speakers, is justified for several reasons. First, the great majority oftokens in both studies were measured by the sameinvestigator (H.M.S.). Second, all contexts and conditionswere identical-CVItls produced at a normal rate andloudness level, in the carrier sentence "Say CVlt! again,"with the identical set of 10 vowels in medial position.Third, all recording, sampling, amplification, and softwareanalysis procedures were identical to those used in the
present study. Fourth, the mean Idl slope andy-interceptfrom Sussman et al. (1991) were very close to those foundin the present study. Last, locus equation place ofarticulation results similar to those used to construct Figure 3 havenow been successfully replicated by several investigatorsacross several laboratories (e.g., Bakran & Mildner,1995; Celdran & Villalba, 1995; Chinnery, Docherty, &Walshaw, 1995; Eek & Meister, 1995; Fowler, 1994).
Three distinct and nonoverlapping clusters can be seenin Figure 3. Despite the relatively large variation in bothslope and y-intercept values across speakers within thevaried alveolar cluster spanning several manner classes,alveolars (circles) are distinct from velar Igl (triangles)and labial Ibl (squares) clusters. The range of slope values within the alveolar group is quite large (from a lowof .10 for aspirated It I (Speaker 4) to a high of.72 for lsi(Speaker 18). This large slope range can be attributed tothe different measurement loci taken for F2 onset. F2onsets taken immediately following the burst for It! evidence minimum coarticulation in comparison with F2onsets taken at the first glottal pulse of the vowel for lsi,which contains a lengthy frication interval. The latter

944 SUSSMAN AND SHORE
condition (fricative lsi) results in "artificially" elevatedslopes, because the two frequency measures, "onset" andmidpoint, are highly similar. What is most interestingabout this diversity of slopelcoarticulation differencesacross manner class categories is that, despite these largeslope variations, as a class, alveolars do not overlap inhigher order locus equation acoustic space, with labialsand velars. Labials and velars characteristically exhibitrelatively more coarticulation than alveolars, regardlessofmanner class. There has never been, to our knowledge,a report of locus equation slopes for alveolars that haveexceeded those characterizing labials or velars.
Discriminant AnalysisAnother procedure to quantify how well locus equa
tion coefficients serve as general place descriptors is toperform a discriminant analysis using slope and y-interceptas predictor variables for place of articulation categorymembership. The primary objective in this analysis wasto see how the various coronals would be categorized:would they be grouped within a "generic" alveolar placegroup, or would some find categorical membership invelar or labial groups? The number ofcases for the alveolar group was 132 (6 consonants X 22 speakers). The results of this analysis are shown in Table 4. Of the totalcases (132), 115 (87.1%) were correctly classified as alveolars. Seventeen cases were incorrectly classified as velars(12.9%). The overall percent correct classification acrossthe three groups was 87.4%.
Voicing DifferencesAn unexpected manner class difference was seen when
Izl and lsi were compared. Figure 4 shows slope valuesfor lsi and /zl for each speaker. It can be seen that slopesfor lsi are consistently higher than that of /z/. The greaterslopes for lsi (mean = .57) than for Izl (mean = .38) seemto indicate that the tongue was more nearly in positionfor the upcoming vowel during the constriction oflsi thanit was for /z/. F2 onset points, taken at the first glottalpulse ofthe vowel, were, in theory, identical for both fricatives. In general, voiceless fricatives are known to belonger than voiced fricatives (Baum & Blumstein, 1987;Crystal & House, 1988). Jongman (1989) reported meandurations of frication noise of 188 msec for lsi and152 msec for /z/. By virtue of the longer noise intervalfor lsi than for Izl, F2 onsets, though technically measuredat the initial glottal pitch period of the vowel, were more
Table 4Results of Discriminant Analysis Showing
Percent Classification of Place of Articulation(Predictor Variables = Slope andy-Intercept)
Predicted Group Membership
Labial Alveolar Velar
Actual Group No. Cases % n % n % n
Labial 20 95 19 0 5 1Alveolar 132 0 87.1 115 12.9 17Velar 20 15 3 5 1 80 16
Note-M = 87.4%.
like "steady state" measures for IslVltl than for Iz/V/t/tokens. With F2 onsets more closely corresponding toF2 midpoints, a greater degree of CV coarticulation isrealized for lsi than for /zl (and the other alveolar obstruents) with resultant higher slopes.
DISCUSSION
Locus equations were derived across a varied set ofconsonantal manner classes to determine their generality asa phonetic descriptor ofconsonantal place ofarticulation.Five consonants-a voiced stop (/d/), a voiceless aspirated stop (/t/), a nasal (/n/), a voiced fricative (/z/), anda voiceless fricative (IsI)-were produced in syllableinitial position preceding 10 vowel contexts. Nonsignificant effects were found for slope means among the threevoiced obstruents Id/, /z/, and Inl, and additionally between Idl and It I when F2 onset frequencies were measured, not at the first glottal pulse following release, butrather well within the aspiration interval, as close to therelease burst as possible. The results ofthis study call intoquestion the conclusion of Fowler (1994) claiming thatlocus equations could not serve as a general descriptor ofplace of articulation because Idl and /zl slopes (.47 and.42 respectively in her data) were found to be statisticallydifferent in a group of 10 speakers.
Only lsi evidenced significantly different slopelyintercepts from the rest of the coronals (except in comparison with the slope for In/). The significantly higherslopes for Islare better explained, at this point, by invoking a measurement limitation rather than an underlyingphonetic-based explanation. By taking F2 onsets at thefirst glottal pulse of the vowel following the long frication interval for lsi, all of the transition movement ofF2was already completed. Hence, the F2 onset frequencieswere strongly conditioned by the vowel midpoint, ratherthan their reflecting an actual consonantal onset locus.This resulted in much higher slope values than would bethe case if onsets were able to be assessed at the earliestpossible moment within the lengthy frication interval.Unfortunately, it was not possible to ascertain this F2 onsetpoint at the beginning of frication with any consistencyacross all vowel contexts.l
The basic homogeneity oflocus equation coefficientsfor the entire coronal set was also seen in other formatsscatterplots of slope andy-intercept values across speakers and a discriminant analysis. When the five obstruentsconstituting the study were compared with labial and velarlocus equation coefficients, three distinct clusters ofcoordinates emerged with clear separation as a function ofplace affiliation. Despite an extensive range in both slopeand y-intercept values, the coronals occupied a differentportion of locus equation acoustic space than did labialsand velars. Only lsi coordinates, with relatively high slopes(between .50 and .70) were, in some cases, close to, butnot overlapping with, velar coordinates. In the discriminant analysis, using slopes and y-intercepts as predictorvariables, over 87% (115 of 132 cases) of the total coronal group, comprising voiced and voiceless stops, a nasal,

LOCUS EQUATIONS AND CONSONANTAL PLACE 945
.8
.7
.6
.5
a0en .4
.3
.2
. 1
0
SpeakersFigure 4. Slope values for IzJversus lsi across 22 speakers.
and voiced and voiceless fricatives, were correctly categorized as alveolars.
A stop + vowel sequence and a fricative + vowel sequence represent vastly different articulatory gestures andconcomitant acoustic correlates. The two manner classeswould be placed on opposite ends ofa variety ofphonetically based continua. Stops are characterized by a short,transient sound source, and fricatives, by a long continuant noise sound source. Stop + vowel concatenations arethe most universally encoded CVs across languages. Theirunique and complex acoustic overlap create the underlying basis for the noninvariance problem in speech perception (Liberman, Cooper, Shankweiler, & StuddertKennedy, 1967). Sibilant fricative + vowels, such as lsiand /zl, on the other hand, represent one ofthe rare casesin the speech code where isomorphism can be said tobest exist between a physical aspect of the sound and aperceived phoneme. The frication of lsi in sat can bespliced away and placed in front of it to yield the perception of sit. The same cannot be said for bat and bit.The fricative spectra of lsi and Izl, by itself, has beenfound to be the necessary and sufficient cue for perception (Harris, 1958; Heinz & Stevens, 1961; Jongman,1989). What is most noteworthy about the results of thisstudy is the fact that, despite these drastic differences inproduction mechanics, acoustic characteristics, and degree of encodedness, the locus equation coefficients foralveolars belonging to these diverse manner classes aremore similar than dissimilar. Moreover, they are all, as a
group, sufficiently contrastive to the other places ofarticulation, such as labials and velars. Rather than stress smalldifferences in locus equation slopes (viz., Fowler's Idlvs. /zl comparison), the emphasis should be on the remarkable similarity that they possess, as a group, despitenearly diametrically opposed phonetic characteristics.
It is not completely surprising, however, that the acoustic signal produced by a set ofarticulations entailing highlysimilar closure-opening gestures yield relatively similarlocus equationplots. Occlusionslconstrictionsof the tongueon the alveolar ridge, followed by release into a vowel,are encoded by similar dynamics of the F2 transition.Since locus equation coordinates are compact parameterizations of the onset and midvowel frequencies ofF2,it is to be expected that place similarities would be captured by locus equation analyses. If the temporal measurement point ofF2 onset could be standardized and phonetically matched across the varied manner classes, asthey were in comparing It! and Id/@ burst, then an evencloser correspondence oflocus equation slopes would nodoubt be obtained, with slopes more closely resemblingthose seen with voiceless aspirated It/.
The overall results of this study can be taken to support the contention that locus equations can indeed be usedas a general phonetic descriptor of place of articulation.As a class, alveolar obstruents, even across phoneticallydiverse manner classes, will have lower slopes (less CVcoarticulation) characterized by more stable onset locithan will labial and velar places of articulation.

946 SUSSMAN AND SHORE
REFERENCES
BAKRAN, J., & MILDNER, V. (1995). Effect of speech rate and coarticulation strategies on the locus equation determination. Proceedings ofthe XIlIth International Congress ofPhonetic Sciences, I, 26-29.
BAUM, S. R., & BLUMSTEIN, S. E. (1987). Preliminary observations onthe use of duration as a cue to syllable-initial voicing in English.Journal ofthe Acoustical Society ofAmerica, 82, 1073-1077.
BLUMSTEIN, S. E., & STEVENS, K. N. (1979). Acoustic invariance inspeech production: Evidence from measurements of the spectralcharacteristics of stop consonants. Journal ofthe Acoustical SocietyofAmerica, 66, 1001-1017.
BLUMSTEIN, S. E., & STEVENS, K. N. (1980). Perceptual invariance andonset spectra for stop consonants in different vowel environments.Journal ofthe Acoustical Society ofAmerica, 67,648-662.
CARRE, R., & MRt\.YATI, M. (1992). Distinctive regions in acoustictubes: Speech production modeling. Journal d 'Acoustique, 5, 141-159.
CELDRAN, E. M., & VILLALBA, X. (1995). Locus equations as a metricfor place ofarticulation in automatic speech recognition. Proceedingsofthe XIIlth International Congress ofPhonetic Sciences, 1, 30-33.
CHENNOUKH, S., CARRE, R., & LINDBLOM, B. (1995, May-June). Onthe "locus equation" and its relation with consonant place ofarticulation. Paper presented at I29th meeting of the Acoustical Societyof America, Washington, DC.
CHINNERY, c, DocHERTY, G. J., & WALSHAW, D. (1995). Formant locusequations and coarticulation in dyspaxic speech. Proceedings oftheXI11th International Congress ofPhonetic Sciences, 1,90-93.
CLEMENTS, G. N. (1985). The geometry of phonological features. Phonology Yearbook, 2, 225-252.
CRYSTAL, T. H., & HOUSE, A. S. (1988). A note on the durations offricatives in American English. Journal ofthe Acoustical Society ofAmerica, 84,1932-1935.
DORMAN, M. E, STUDDERT-KENNEDY, M., & RAPHAEL, L. J. (1977).Stop-consonant recognition: Release bursts and formant transitions asfunctionally equivalent, context-dependent cues. Perception & Psychophysics, 22,109-122.
EEK, A., & MEISTER, E. (1995). The perception of stop consonants:Locus equations and spectral integration. Proceedings of the XI11thInternational Congress ofPhonetic Sciences, 1, 18-21.
FOWLER, C. A. (1994). Invariants, specifiers, cues: An investigation oflocus equations as information for place ofarticulation. Perception &Psychophysics, 55, 597-610.
FRUCHTER, D. (1994). Perceptual significance oflocus equations. Journal ofthe Acoustical Society ofAmerica, 95, 2977.
FURUI, S. (1986). On the role of spectral transition for speech perception. Journal of the Acoustical Society ofAmerica, 80, 1016-1025.
HARRIS, K. S. (1958). Cues for the discrimination of American Englishfricatives in spoken syllables. Language & Speech, 1,1-7.
HASEGAWA-JOHNSON, M. (1995). Burst spectral measures and formantfrequencies can be used to accurately discriminate place of articulation. Journal ofthe Acoustical Society ofAmerica, 98, 2890.
HEINZ,J. M., & STEVENS, K. N. (1961). On the properties of voicelessfricative consonants. Journal of the Acoustical Society ofAmerica,33,589-596.
HINTON, G. E., & LANG, K. J. (1988). The development of the timedelay neural network architecturefor speech recognition (Tech. Rep.No. CMU-CS, 88-112). Carnegie Mellon University.
JONGMAN, A. (1989). Duration of frication noise required for identification of English fricatives. Journal of the Acoustical Society ofAmerica, 85, 1718-1725.
KEWLEy-PORT, D. (1983). Time-varying features as correlates ofplaceof articulation in stop consonants. Journal ofthe Acoustical SocietyofAmerica, 73, 322-335.
KRULL, D. (1989). Consonant-vowel coarticulation in spontaneousspeech and in reference words. PERIL US, 10,101-105. Stockholm:University of Stockholm, Institute of Linguistics.
LAHIRI, A., GEWIRTH, L., & BLUMSTEIN, S. E. (1984). A reconsiderationof acoustic invariance for place of articulation in diffuse stop consonants: Evidence from a cross-language study. Journal ofthe Acoustical Society ofAmerica, 76, 391-404.
LIBERMAN, A. M., COOPER, E S., SHANKWEILER, D. P., & STUDDERTKENNEDY, M. (1967). Perception of the speech code. PsychologicalReview, 74, 431-461.
LINDBLOM, B. (1963). On vowel reduction (Report No. 29). Stockholm:Royal Institute of Technology, Speech Transmission Laboratory.
McDERMOTT, E., & KATAGlRI, S. (1988). Phoneme recognition usingKohonen slearning vector quantization. Paper presented at ATR Workshop on Neural Networks and Parallel Distributed Processing, Osaka,Japan.
NOSSAIR, Z. B., & ZAHORlAN, S. A. (1991). Dynamic spectral shape features as acoustic correlates for initial stop consonants. Journal oftheAcoustical Society ofAmerica, 89, 2978-2991.
OHDE, R. N., HALEY, K. L., VORPERIAN, H. K., & MCMAHON, C. W.(1995). A developmental study of the perception of onset spectra forstop consonants in different vowel environments. Journal ofthe Acoustical Society ofAmerica, 97,3800-3812.
RECASENS, D. (1989). Long range coarticulatory effects for tongue dorsumcontact in VCVCV sequences. Speech Communication, 8, 293-307.
SUSSMAN, H. M. (1994). The phonological reality of locus equationsacross manner class distinctions: Preliminary observations. Phonetica, 51, 119-131.
SUSSMAN, H. M., FRUCHTER, D., & CABLE, A. (1995). Locus equationsderived from compensatory articulation. Journal of the AcousticalSociety ofAmerica, 97, 3112-3124.
SUSSMAN, H. M., HOEMEKE, K., & AHMED, E (1993). A cross-linguisticinvestigation of locus equations as a relationally invariant descriptorfor place of articulation. Journal ofthe Acoustical Society ofAmerica, 94, 1256-1268.
SUSSMAN, H. M., HOEMEKE, K., & MCCAFFREY, H.A. (1992). Locusequations as an index of coarticulation for place of articulation distinctions in children. Journal ofSpeech & Hearing Research, 35,769-781.
SUSSMAN, H. M., MCCAFFREY, H. A., & MATTHEWS, S. A. (1991). Aninvestigation of locus equations as a source of relational invariancefor stop place categorization. Journal of the Acoustical Society ofAmerica, 90, 1309-1325.
TANK, D. W., & HOPFIELD, J. J. (1988). Learning time-delayed connections in a speech recognition circuit. Paper presented at Neural Networks for Computing Conference, Snowbird, UT.
WAIBEL, A., HANAZAWA, T., HINTON, G., SHIKANO, K., & LANG, K.(1987). Phoneme recognition using time-delay neural networks(Tech. Rep. No. TR-I-006). Kyoto, Japan: ATR Interpreting Telephony Research Laboratories.
WALLEY, A. C., & CARRELL, T. D. (1983). Onset spectra and formanttransitions in the adult's and child's perception ofplace ofarticulationin stop consonants. Journal ofthe Acoustical Society ofAmerica, 73,1011-1022.
WATROUS, R. L. (1988). Speech recognition using connectionist networks.Unpublished doctoral dissertation, University of Pennsylvania.
NOTES
I. By "phonetically valid," we simply mean that if an aspirated stopis to be compared with an unaspirated stop in terms of locus equationplots, the measurement points for F2 onset and F2 vowel should correspond as closely as possible.
2. Two other post hoc tests were administered to see whether less conservative measures might change the results. Using the Fisher PLSD, Idland /zl slope means were not significantly different (p = .28); usingthe Bonferroni/Dunn, Idl and /zl slope means were also not significantly different (p = .28). All three post hoc tests also showed nonsignificant mean differences between Id/@ burst and It/.
3. It should be borne in mind that locus equations were originally devised to capture the highly encoded and rapid CV transitions of stop +vowel utterances and were not intended for continuants such as lsi and/z/, which entail F2 onset measurement points well beyond those obtainable for stops.
(Manuscript received July 27, 1995;revision accepted for publication December 14, 1995.)