Locoregional immunomodulation with oncolytic viruses...
43
Locoregional immunomodulation with oncolytic viruses for systemic cancer immunotherapy Igor Puzanov, M.D., M.S.C.I., F.A.C.P. Director, Melanoma Clinical Research Vanderbilt University, Nashville, Tennesee
Transcript of Locoregional immunomodulation with oncolytic viruses...

Locoregional immunomodulation with oncolytic viruses for systemic cancer immunotherapy
Igor Puzanov, M.D., M.S.C.I., F.A.C.P. Director, Melanoma Clinical Research
Vanderbilt University, Nashville, Tennesee

Disclosures:
• Consultant: Amgen, Hoffmann-La Roche,
• Clinical Trial Support: Merck, Amgen, Plexxikon, Hoffmann-La Roche, GlaxoSmithKline, Bristol Myers Squibb

Cancer therapy in the 21st century
• Many new ‘molecularly-targeted’ therapies have been approved
• These drugs work in patients with targeted mutation, patients ultimately develop resistance
• A new classes of therapies (checkpoint inhibitors, oncolytic virus) were recently been approved by the FDA. – These drugs produce longer durable remissions in some patients – They engage the immune system against the tumor – frequently
employing T cells
• Will there be a synergy?
• Agent specific vs. class synergy?

Locoregional therapies in development
• Oncolytic viruses (Talimogene laherparepvec, Newcastle disease virus, Coxsackie virus A21, HF10-oncolytic HSV1, Reovirus)
• Non-viral based therapies (PV-10/Rose Bengal disodium)
• These drugs work in patients with or without specific targeted mutation)
• Will there be a synergy?
• Agent specific vs. class synergy?

Pitfalls of injectable therapies
• Need for direct injection-limits the type of patients able to receive the therapy and thus benefit
• Patient selection-lack of easily obtainable biomarkers

Immune-active microenvironment and type I IFN transcriptional signature are associated with clinical benefit from immunotherapies
Positive correlation between increased T cell infiltration and type I IFN-induced transcripts Fuertes M.B. et al., JEM. 208:2005-16 (2011)
CD8
Benefit
No benefit
No clinical activity Clinical activity
Befo
re ip
ilim
umab
Aft
er ip
ilim
umab
Ji R.R., et al. Cancer Immunol Immunother. 61:1019-31 (2012)
Could strategies targeting type I IFN pathway sensitize tumors to immune checkpoint blockade?

Tumor infection with oncolytic viruses results in type I IFN production and immunogenic cell death
PAMPS
1. DC maturation 2. ↑MHC 3. ↑Costimulatory ligands 4. ↑Cytokines, chemokines
virus
MHC
1.↑MHC, 2.↑Costimulatory ligands 3.↑Surface HSPs and ecto-CRT 4.↑Type I IFN
1.TAA’s, 2.DAMPS
PAMPS
HSPs Ecto-CRTActivation and recruitment of innate and adaptive immune effectors
B7-1,2
D Zamarin, JD Wolchok - Molecular Therapy—Oncolytics, 2014

Newcastle disease virus (NDV) as an anti-cancer agent
■ Birds are a natural host, thus humans do not have pre-existing immunity to the virus
■ Readily infects the majority of cancer cells due to ubiquity of the receptor (sialic acid)
■ Strong inducer of type I interferon and dendritic cell maturation
■ Specificity for cancer cells is mediated by selective viral replication in cells with deficient innate immune responses and cells resistant to apoptosis
■ Clinical trials with systemically-administered NDV in humans demonstrated safety and durable clinical benefit in different cancer types
F
HN
M
N
L
P

NDV infection upregulates MHC and co-stimulatory molecules on the surface of tumor cells
mockNDV

Intratumoral NDV treatment results in immune infiltration in both virus-injected and distant tumors
NDV
mock NDV
CD3+CD8+
CD4+FoxP3-
CD4+FoxP3+
0
1×10⁶
2×10⁶
3×10⁶
4×10⁶
5×10⁶
6×10⁶
Cel
ls /g
tum
or
mockNDV
** * **** ns
mock NDV
Distant tumor
Zamarin D, Wolchok JD, Allison JP. Science Translational Medicine. 2014 5:226ra
B16-F10 melanoma model
mock NDV
24h 48h 72h 96h
NDV(luciferase)-treated tumor
Virus replicates only in treated tumors

NDV induces distant B16 tumor growth delay, but few complete regressions
Treated tumors
0 5 10 15 20 250
500
1000
1500
Days
Tum
or s
ize
(mm
3 ) PBSNDV
p<0.008
**
Distant tumors
0 5 10 15 20 250
500
1000
1500
Days
Tum
or s
ize
(mm
3 ) PBSNDV
p<0.0007
***
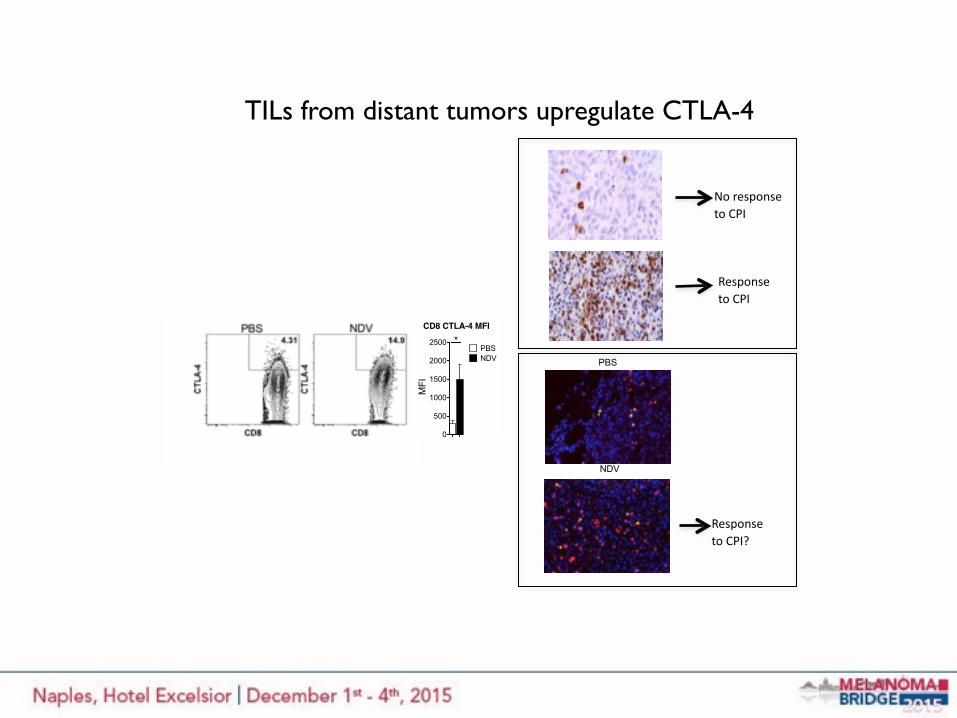
TILs from distant tumors upregulate CTLA-4
NDV
Response to CPI?
PBS
Response to CPI
No response to CPI
CD8 CTLA-4 MFI
MFI
0
500
1000
1500
2000
2500PBSNDV
*

Combination therapy with NDV and CTLA-4 blockade leads to rejection of the treated and distant B16-F10 tumors and long-term survival
a.
0 20 40 60 80 1000
20
40
60
80
100
Days post challengePe
rcen
t sur
viva
l
PBSNDV+isotypePBS+anti-CTLA-4NDV+anti-CTLA-4*
***
Zamarin D, Wolchok JD, Allison JP. Science Translational Medicine. 2014 5:226ra

Talimogene laherparepvec
14
• Talimogene laherparepvec
– Genetically modified HSV-1-based oncolytic immunotherapy
– Approved in the US for local treatment of unresectable cutaneous, subcutaneous, and nodal lesions in patients with melanoma recurrent after initial surgery*
• Pembrolizumab
– Human anti-PD-1 Ab that restores the function of tumor antigen-specific T cells and improves tumor control
– Approved for the treatment of patients with unresectable or metastatic melanoma and disease progression following ipilimumab and, if BRAF V600 mutation positive, a BRAF inhibitor
*Talimogene laherparepvec has not been shown to improve overall survival or have an effect on visceral metastases (ImlygicTM [talimogene laherparepvec]; USPI, Amgen 2015)

Key Melanoma Studies
• OPTiM: Ph 3 T-VEC vs GM-CSF1 – Improved Durable Response Rate (response for ≥6 months)
– 16% vs 2%, p<0.0001
• KEYNOTE 006: Ph 3 pembrolizumab (Q2W/Q3W) vs ipilumumab2 – Improved PFS (HR: 0.58, p<0.001)
– Improved OS (Q2W HR: 0.63, p=0.0005; Q3W HR: 0.69, p=0.0036)
– Improved ORRRECIST (Q2W 33.7%, Q3W 32.9% vs 11.9% ipi, p<0.001)
• 20110264: Phase 1b T-VEC + ipilimumab3 – ORRirRC 50%
– Durable Response Rate of 44%
– Tolerable safety profile
1. Andtbacka RHI et al. J Clin Oncol 2015; 2. Robert C et al. NEJM 2015; 3. Puzanov I et al. ASCO 2015
irRC = immune-relate response criteria; T-VEC = talimogene laherparepvec
15

Phase 1b results from a multicenter trial of talimogene laherparepvec + ipilimumab (T-VEC+ipi) in previously
untreated, unresected stage IIIB-IV melanoma
Igor Puzanov,1 Mohammed Milhem,2 Robert H. I. Andtbacka,3 David Minor,4 Omid Hamid,5 Ai Li,6 Jeffrey Chou,6 and Howard Kaufman7
1Vanderbilt University, Nashville, TN; 2University of Iowa, Iowa City, IA; 3Huntsman Cancer Institute, Salt Lake City, UT; 4California Pacific Melanoma Center, San Francisco, CA; 5The Angeles Clinic and Research Institute, Los Angeles, CA; 6Amgen Inc., Thousand Oaks, CA; 7Rutgers Cancer Institute of New Jersey, New Brunswick, NJ

Background: T-VEC Mechanism of Action
17

Ipilimumab 3mg/kg IV Q3W x 4
Primary Endpoint: Incidence of dose-limiting toxicities (DLTs) Key Secondary Endpoints: ORRirRC, Safety
20110264: Study Schema – Phase 1b Portion
Unresectable Stage IIIB-IV Melanoma •Injectable •Treatment naïve •ECOG PS 0 or 1 •No evidence of CNS mets
T-VEC Intralesional 106 PFU/mL, after 3 weeks 108 PFU/mL Q2W
Week 6
N = 19
• T-VEC dosing until CR, all injectable tumors disappear, PD per irRC, or intolerance, whichever is first
• Safety follow-up occurs 30 (+7) days after last dose of T-VEC or 60 (+7) days after last dose of ipilimumab, whichever is later
Week 1
18

Results: Patient Demographics
19
Total (N = 19*)
Sex – n (%)
Male 8 (42)Female 11 (58)
Age, median (min, max) – years 61 (29, 84)
ECOG PS – n (%)
0 14 (74)
1 5 (26)
Disease stage – n (%)
IIIB 1 (5)
IIIC 3 (16)IV M1a 4 (21)
IV M1b 5 (26)
IV M1c 6 (32)
BRAF mutation status – n (%)
Mutant 11 (58)
Wild-type 8 (42)
HSV-1 status– n (%)
Negative 5 (26)Positive 13 (68)
Missing 1 (5)*One patient received one dose of T-VEC only before withdrawing consent and enrolling in hospice care

Treatment-Emergent Adverse Events*
20
Preferred Term Total N (%)
Grade 3 N (%)
Any event 19 (100) 5 (26)Any attributed to T-VEC 17 (90) 3 (16)†
Any attributed to ipilimumab 15 (80) 3 (16)†
Chills 11 (58) -Fatigue 11 (58) 1 (5)Pyrexia 11 (58) 1 (5)Nausea 9 (47) 2 (11)Rash 9 (47) -Diarrhea 8 (42) 1 (5)Headache 8 (42) -Pruritis 8 (42) -Decreased appetite 4 (21) -Hyperglycemia 4 (21) -Vomiting 4 (21) 1 (5)ALT increased 3 (16) -Back pain 3 (16) 1 (5)Influenza-like illness 3 (16) 1 (5)Pain 3 (16) -Vision blurred 3 (16) -
*All events of any grade occurring in > 15% of patients during treatment or up to 30 days after last T-VEC or 60 days after last ipilimumab, whichever was later; †Grade 3 events in these patients: pyrexia attributed to T-VEC; hypophysitis and abdominal distention attributed to ipilimumab; and nausea, diarrhea, fatigue, influenza-like illness, vomiting, adrenal insufficiency, and dehydration attributed to both; ALT: alanine aminotransferase.
• Nausea was the only grade 3 event occurring in > 1 patient
• Two grade 4 events occurred in one patient with elevated amylase and lipase (attributed to ipilimumab)
• There was one grade 5 event of metastases to central nervous system (preferred term)
• The overall rate of grade 3 or higher treatment-emergent events was 32%

Changes in Tumor Burden by Disease Stage
21
Tumor follow-up time is the duration from the first dose of T-VEC to the last tumor assessment.
0 2 4 6 8 10 12 14 16 18 20 22 24 26 28 30Months from treatment initiation
-100-80-60-40-20
020406080
100
% C
hang
e fr
om B
asel
ine
● = Stage IIIb○ = Stage IIIc+ = Stage IV M1a■ = Stage IV M1b□ = Stage IV M1cMedian tumor follow-up time: 15.6 months
150
500
900

Best Overall Response
22
The waterfall plot shows best reductions in tumor burden at a single time point. For the irRC response table, CR, PR, and PD needed to be confirmed by consecutive assessments no less than 4 weeks apart to be considered confirmed with the following exception: if PD was the last tumor assessment, it was considered as confirmed. * ≤ -98%, but > -100% ** unconfirmed CR
N = 18
Perc
enta
ge C
hang
e fr
om B
asel
ine
-100
-500
2550
100
200
300
Stage IV M1c (N=5)Stage IV M1b (N=5)Stage IV M1a (N=4)Stage IIIc (N=3)Stage IIIb (N=1)
500
600
Best irRC Confirmed Response
Per irRC n (%)
Overall response rate 9 (50)
Complete response (CR) 4 (22)
Partial response (PR) 5 (28)
Stable disease (SD) 4 (22)
Progressive disease (PD) 5 (28)
Disease control rate (CR+PR+SD) 13 (72)
* * **
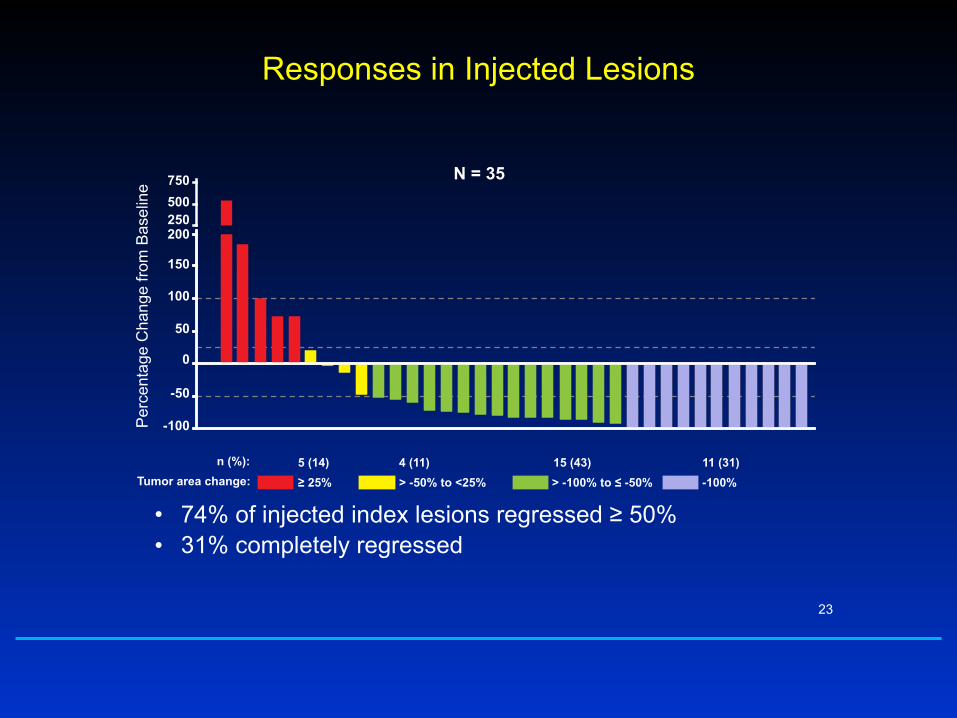
Responses in Injected Lesions
• 74% of injected index lesions regressed ≥ 50% • 31% completely regressed
23
Per
cent
age
Cha
nge
from
Bas
elin
e
-100
-50
50
100
150
200
0
250500750
-100%> -100% to ≤ -50%> -50% to <25%≥ 25% Tumor area change: n (%): 11 (31)15 (43)4 (11)5 (14)
N = 35

24
• Both uninjected non-visceral and visceral lesions regressed • 52% of uninjected index lesions regressed ≥ 50% • 39% completely regressed
–100
0
50
100
150
200
–50
-100%> -50% to <25%≥ 25%Tumor area change:n (%): 7 (54)5 (39)1 (8)
–100
–50
0
50
100
150
200250500750
Per
cent
age
Cha
nge
from
B
asel
ine
-100%> -100% to ≤ -50%> -50% to <25%≥ 25%Tumor area change:n (%): 2 (20)3 (30)3 (30)2 (20)
Responses in Uninjected Non-visceral and Visceral LesionsNon-visceral: N = 13
Visceral: N = 10

Progression-Free Survival
• Kaplan-Meier estimate of median PFS was not yet reached (range: 2.6 to 25.4+ months) • 12-month and 18-month PFS was 50%
25
| | | | | | | ||
18 18 13 12 12 10 9 9 9 9 7 5 2 0
0%
20%
40%
60%
80%
100%
T-VEC + IpilimumabNumber of Patients at Risk:
| | | | | | | ||
18
0 2 4 6 8 10 12 14 16 18 20 22 24 26Study Month
Kap
lan-
Mei
er P
erce
nt

Overall Survival
• Kaplan-Meier estimate of median OS was not yet reached – 12-month survival was 72% – 18-month survival was 67%
26
| | |||| | | || ||
18 18 17 16 16 14 13 12 12 11 10 5 2 0
0 2 4 6 8 10 12 14 16 18 20 22 24 26
| | |||| | | || ||
0%
20%
40%
60%
80%
100%
T-VEC + IpilimumabNumber of Patients at Risk:
Study Month
Kap
lan-
Mei
er P
erce
nt

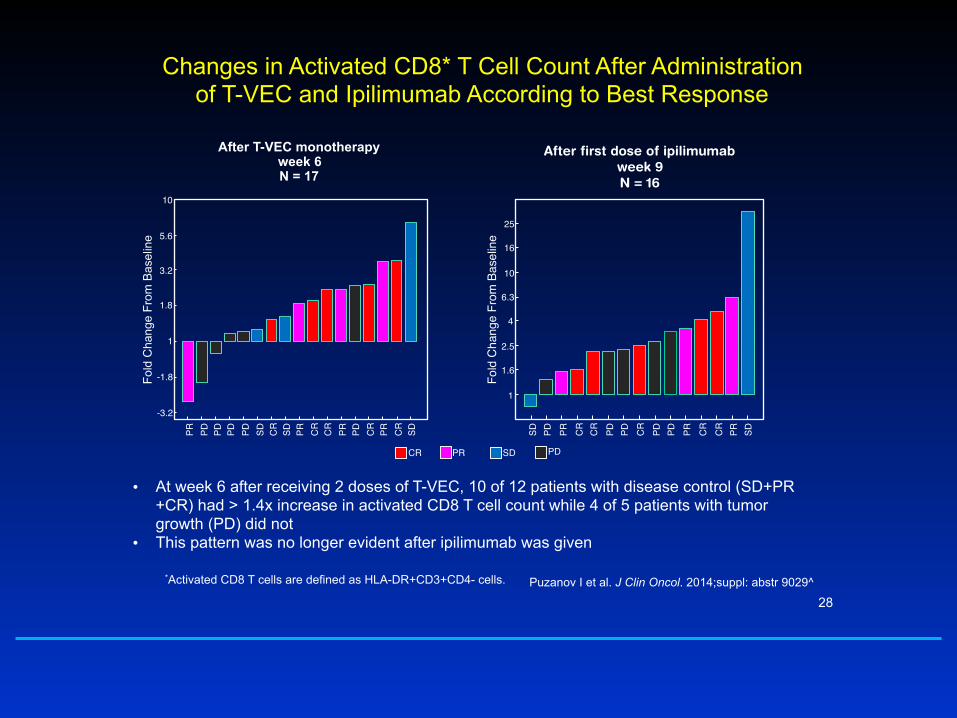
Total and activated CD8 T-cells* increase after T-VEC and combination treatment
• Total and activated CD8 T cells in the peripheral blood increased from baseline after T-VEC administration at weeks 4 and 6 and further increased at weeks 9 and 15 after combination T-VEC and ipilimumab
*Activated CD8 T cells are defined as HLA-DR+CD3+CD4- cells.
Data points are overlaid on the box plots. Each box plot shows the range between 25th percentile (q1) and 75th percentile (q3) as a yellow box, with a pink line showing the 50th percentile. The whiskers on each box are q3 ± 1.5* (q3 – q1). A red plus sign indicates outlier data within a subset. P-values below each post week 1 subset indicate significant changes from baseline level on week 1, and those above week 9 subset indicate significant changes from week 6 to week 9.
Puzanov I et al. J Clin Oncol. 2014;suppl: abstr 9029^
After first dose of ipilimumab week 9 N = 16
Changes in Activated CD8* T Cell Count After Administration of T-VEC and Ipilimumab According to Best Response
28
• At week 6 after receiving 2 doses of T-VEC, 10 of 12 patients with disease control (SD+PR+CR) had > 1.4x increase in activated CD8 T cell count while 4 of 5 patients with tumor growth (PD) did not
• This pattern was no longer evident after ipilimumab was given
PR PD PD PD PD SD CR
SD PR CR
CR
PR PD CR
PR CR
SD-3.2
-1.8
1
1.8
3.2
5.6
10
Fold
Cha
nge
From
Bas
elin
eAfter T-VEC monotherapy
week 6 N = 17
SD PD PR CR
CR
PD PD CR
PD PD PR CR
CR
PR SD
1
1.6
2.5
4
6.3
10
16
25
Fold
Cha
nge
From
Bas
elin
e
CR PR SD PD
*Activated CD8 T cells are defined as HLA-DR+CD3+CD4- cells. Puzanov I et al. J Clin Oncol. 2014;suppl: abstr 9029^

Week 1
20110264: Study Schema - Phase 2 Portion
Primary Endpoint ORRirRC Secondary Endpoints PFS, OS, DRR, BOR, DCR, DoR, TTR, resection rate
Ipilimumab 3mg/kg IV Q3W x 4
Week 6
Ipilimumab 3mg/kg IV Q3W x 4
R
Unresectable Stage IIIB-IV Melanoma •Injectable •≤ 1 line of systemic therapy for BRAF wt, or ≤ 2 lines of systemic therapy including BRAFi regimen for BRAF mutated •ECOG PS 0 or 1 •No evidence of active CNS mets
T-VEC Intralesional 106 PFU/mL, after 3 weeks 108 PFU/mL Q2W
1:1
29
N = 100
N = 100
• T-VEC dosing until CR, all injectable tumors disappear, PD per irRC, or intolerance, whichever is first
• Safety follow-up occurs 30 (+7) days after last dose of T-VEC or 60 (+7) days after last dose of ipilimumab, whichever is later
Primary analysis of MASTERKEY-265 phase 1b study of talimogene laherparepvec and
pembrolizumab for unresectable stage IIIB-IV melanoma
Georgina V. Long,1 Reinhard Dummer,2 Antoni Ribas,3 Igor Puzanov,4 Olivier Michielin,5 Ari VanderWalde,6 Robert H.I. Andtbacka,7 Jonathan Cebon,8
Eugenio Fernandez,9 Josep Malvehy,10 Anthony J. Olszanski,11 Thomas F. Gajewski,12 John M. Kirkwood,13 Christine Gause,14 Lisa Chen,15 David R. Kaufman,14
Jeffrey Chou,15 F. Stephen Hodi16
1Melanoma Institute Australia and The University of Sydney, Sydney, Australia; 2University Hospital of Zurich, Zurich, Switzerland; 3University of California at Los Angeles Medical Center, Los Angeles, CA; 4Vanderbilt University Medical Center, Nashville, TN; 5Centre Hospitalier Universitaire Vaudois; Lausanne, Switzerland; 6The West Clinic, Memphis, TN; 7University
of Utah Huntsman Cancer Institute, Salt Lake City, UT: 8Austin Health, Austin Hospital, Heidelberg, Australia; 9Hopitaux Universitaires de Geneve; Geneva, Switzerland; 10Hospital Clinic i Provincial de Barcelona, Barcelona, Spain; 11Fox Chase
Cancer Center, Philadelphia, PA; 12The University of Chicago Medicine, Chicago, IL;13University of Pittsburgh Cancer Institute, Pittsburgh, PA; 14Merck & Co., Inc., Kenilworth, NJ; 15Amgen Inc., Thousand Oaks, CA; 16Dana-Farber Cancer
Institute, Boston, MA
Pitfalls of injectable therapies
• Need for direct injection-limits the type of patients able to receive the therapy and thus benefit
• Patient selection-lack of easily obtainable biomarkers

Respiratory Enteric Orphan Virus (pelareorep)
Pelareorep infects both tumor cells and normal, healthy cells
Pelareorep is a virus whose replication is stopped in a non- Ras-activated cell
Healthy cell remains undamaged
Tumor cells rupture to release progeny virus
Replicated viruses repeat cell lysis cycle in nearby tumor cells
Pelareorep replicates in Ras- activated tumor cells
Pelareorep infects both tumor cells and normal, healthy cells
Normal Cells
Ras-Activated Cells
Pelareorep administered to patients via IV
32

Mouse Melanoma Treated with Reovirus Showed Increased PD L1 Expression
Reovirus + paclitaxel No reovirus

Pelareorep and Anti-PD-1 Combination Therapy
• The combination of Pelareorep with an anti-PD-1 Ab results in prolonged survival of mice with melanoma.
Rajani et al. 2014
34

PV-10
❑ PV-10 is a sterile, non-pyrogenic solution of Rose Bengal disodium (10% RB) for intralesional injection • RB is a small molecule Fluorescein derivative attributed to Gnehm in 1882 • Prior human use of RB
– IV hepatic diagnostic, 131I radiolabeled RB: Robengatope®
– Topical ophthalmic diagnostic: Rosettes® and Minims®
• Established safety history – Not metabolized – Short circulatory half-life (ca 30 min) – Excretion via bile
• Radiopaque with prolonged retention in tumors
• Intralesional injection results in ablative immunotherapy
23 Oct 2015

Day 0 – Pre-Tx Day 0 – 5 min Post-Tx Day 7
Day 28 (21 Apr 2010) Day 104 (06 Jul 2010) Day 464 (01 Jul 2011)
Direct liver injections: PV-10-LC-01 – Subject 0001/0003 (HCC #1) – CT
• Female, age 71, 3.4 cm HCC lesion injected once with 5.1 mL PV-10

Pitfalls of injectable therapies
• Need for direct injection-limits the type of patients able to receive the therapy and thus benefit
• Patient selection-lack of easily obtainable biomarkers

Tumor infiltrating T-cells are promising biomarkers of immunotherapy
• T-cells (CD8+) can attack and kill tumor cells
• Influx of T cells into the tumor prior to response
• Repeat biopsies burdensome
Pre-treatment Short-term treatment Tumor regression
T cells in tumor
Tumor size

Radiographic imaging
• Anatomical – MRI – XRAY – CT
• Show anatomy (density, structure)
• Functional – SPECT – PET
• Show function or other features
FDG-PETXray

Development of I124 –labelled anti-CD8 antibody
• Radioactive Iodine-124 is attached chemically to an antibody that binds to CD8 on T-cells
• This anti-CD8-I124 conjugate is then delivered to the patient or subject by IV injection (microdose)
• The anti-CD8-I124 binds to T-cells and ‘labels’ them in the body.
• PET scanning is then performed, focusing on the tumor site
• Measuring the signal in the tumor region gives an estimation on the amount of T-cells present in the tumor
• This could be at baseline and after 1-2 doses of immunotherapy
• Data analysis defining “Immuno-PET signature or response/non-response”
I124
Anti-CD8 antibody
CD8+ T cell

Imaging T cells – initial experience
Summary
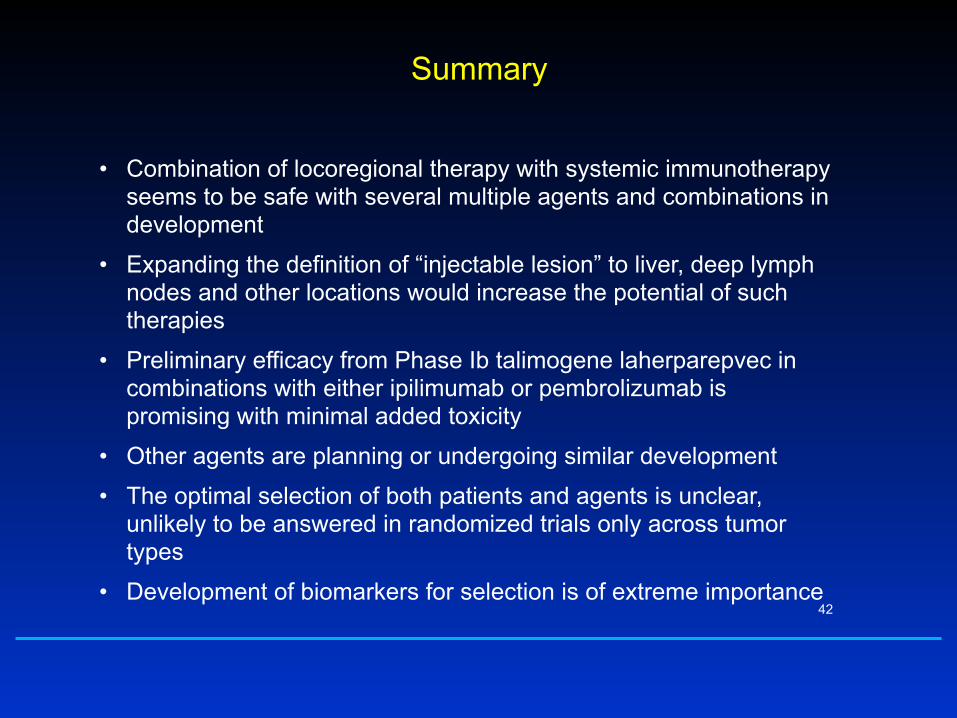
• Combination of locoregional therapy with systemic immunotherapy seems to be safe with several multiple agents and combinations in development
• Expanding the definition of “injectable lesion” to liver, deep lymph nodes and other locations would increase the potential of such therapies
• Preliminary efficacy from Phase Ib talimogene laherparepvec in combinations with either ipilimumab or pembrolizumab is promising with minimal added toxicity
• Other agents are planning or undergoing similar development
• The optimal selection of both patients and agents is unclear, unlikely to be answered in randomized trials only across tumor types
• Development of biomarkers for selection is of extreme importance42

Acknowledgements
43
• Patients and families for their dedication
• Vanderbilt University: Jeffrey Sosman, Douglas Johnson, Charles Manning, Justin Balko
• Huntsman Cancer Center: Robert Antbacka
• MSKCC: Dmitryi Zamarin, Jedd Wolchok